

1. Reframe FP&A as a financing decision system
FP&A creates value when it improves a decision about liquidity, funding, covenants, investment, pricing, capacity, working capital or risk. The system should begin with those decisions, their timing and the evidence required. A monthly forecast that arrives after a lender notice deadline or capital commitment has limited usefulness, even when its statistical error is low.
The decision system contains data, drivers, models, scenarios, management judgments, approvals and actions. It should identify who owns each element and how a forecast change reaches an authorised response. The board needs a controlled view of the range of outcomes, liquidity runway, covenant headroom, committed funding and actions available within the relevant time.
AI can support reconciliation, pattern detection, driver estimation, anomaly review, scenario generation and narrative drafting. Its outputs remain inputs to governed decisions. The finance function should measure value through shorter decision cycles, better cash visibility, fewer forecast surprises, faster response and improved capital allocation rather than the number of models deployed.
2. Define the decision catalogue
The transformation should catalogue recurring and event-driven decisions. Examples include drawing a facility, seeking a waiver, changing prices, slowing hiring, deferring capital expenditure, accelerating collections, hedging exposure, refinancing debt, raising equity, disposing of an asset or funding a growth initiative. Each decision needs a latest responsible date and an accountable authority.
The catalogue should state the trigger, evidence, lead time, cash effect, constraints and reversibility. A funding decision may require lender materials months before cash is needed. A pricing change may have contractual notice and customer-retention effects. A capital freeze can protect liquidity while delaying future revenue. FP&A should represent these dependencies rather than treating actions as instantaneous spreadsheet switches.
Decision materiality determines assurance. A local expense adjustment may use delegated rules. A covenant forecast, going-concern assessment or major financing requires executive review, specialist input and preserved evidence. The catalogue helps the organisation apply control in proportion to consequence.
3. Build a driver tree that reaches cash
The driver tree should connect external conditions and operating activity to revenue, margin, working capital, investment, tax, financing and cash. It should remain specific enough to support action. Revenue can be separated into customer volume, conversion, utilisation, price and mix. Cost can distinguish variable usage, labour, capacity commitments and discretionary investment. Working capital can connect contract terms, billing, disputes, collections, inventory and supplier timing.
Drivers should be reconciled to accountable processes and source systems. A growth rate without a commercial mechanism is an assumption, not a driver. A pipeline measure should define stage, probability, sales cycle, capacity and conversion evidence. A cost driver should identify volume, unit rate, commitment and owner.
The tree should avoid uncontrolled complexity. The finance team can prioritise drivers by cash sensitivity, controllability, volatility and decision relevance. Low-materiality accounts may use stable statistical methods. Material items should retain causal structure and management ownership. The result is a shared map for finance, operations and capital providers.
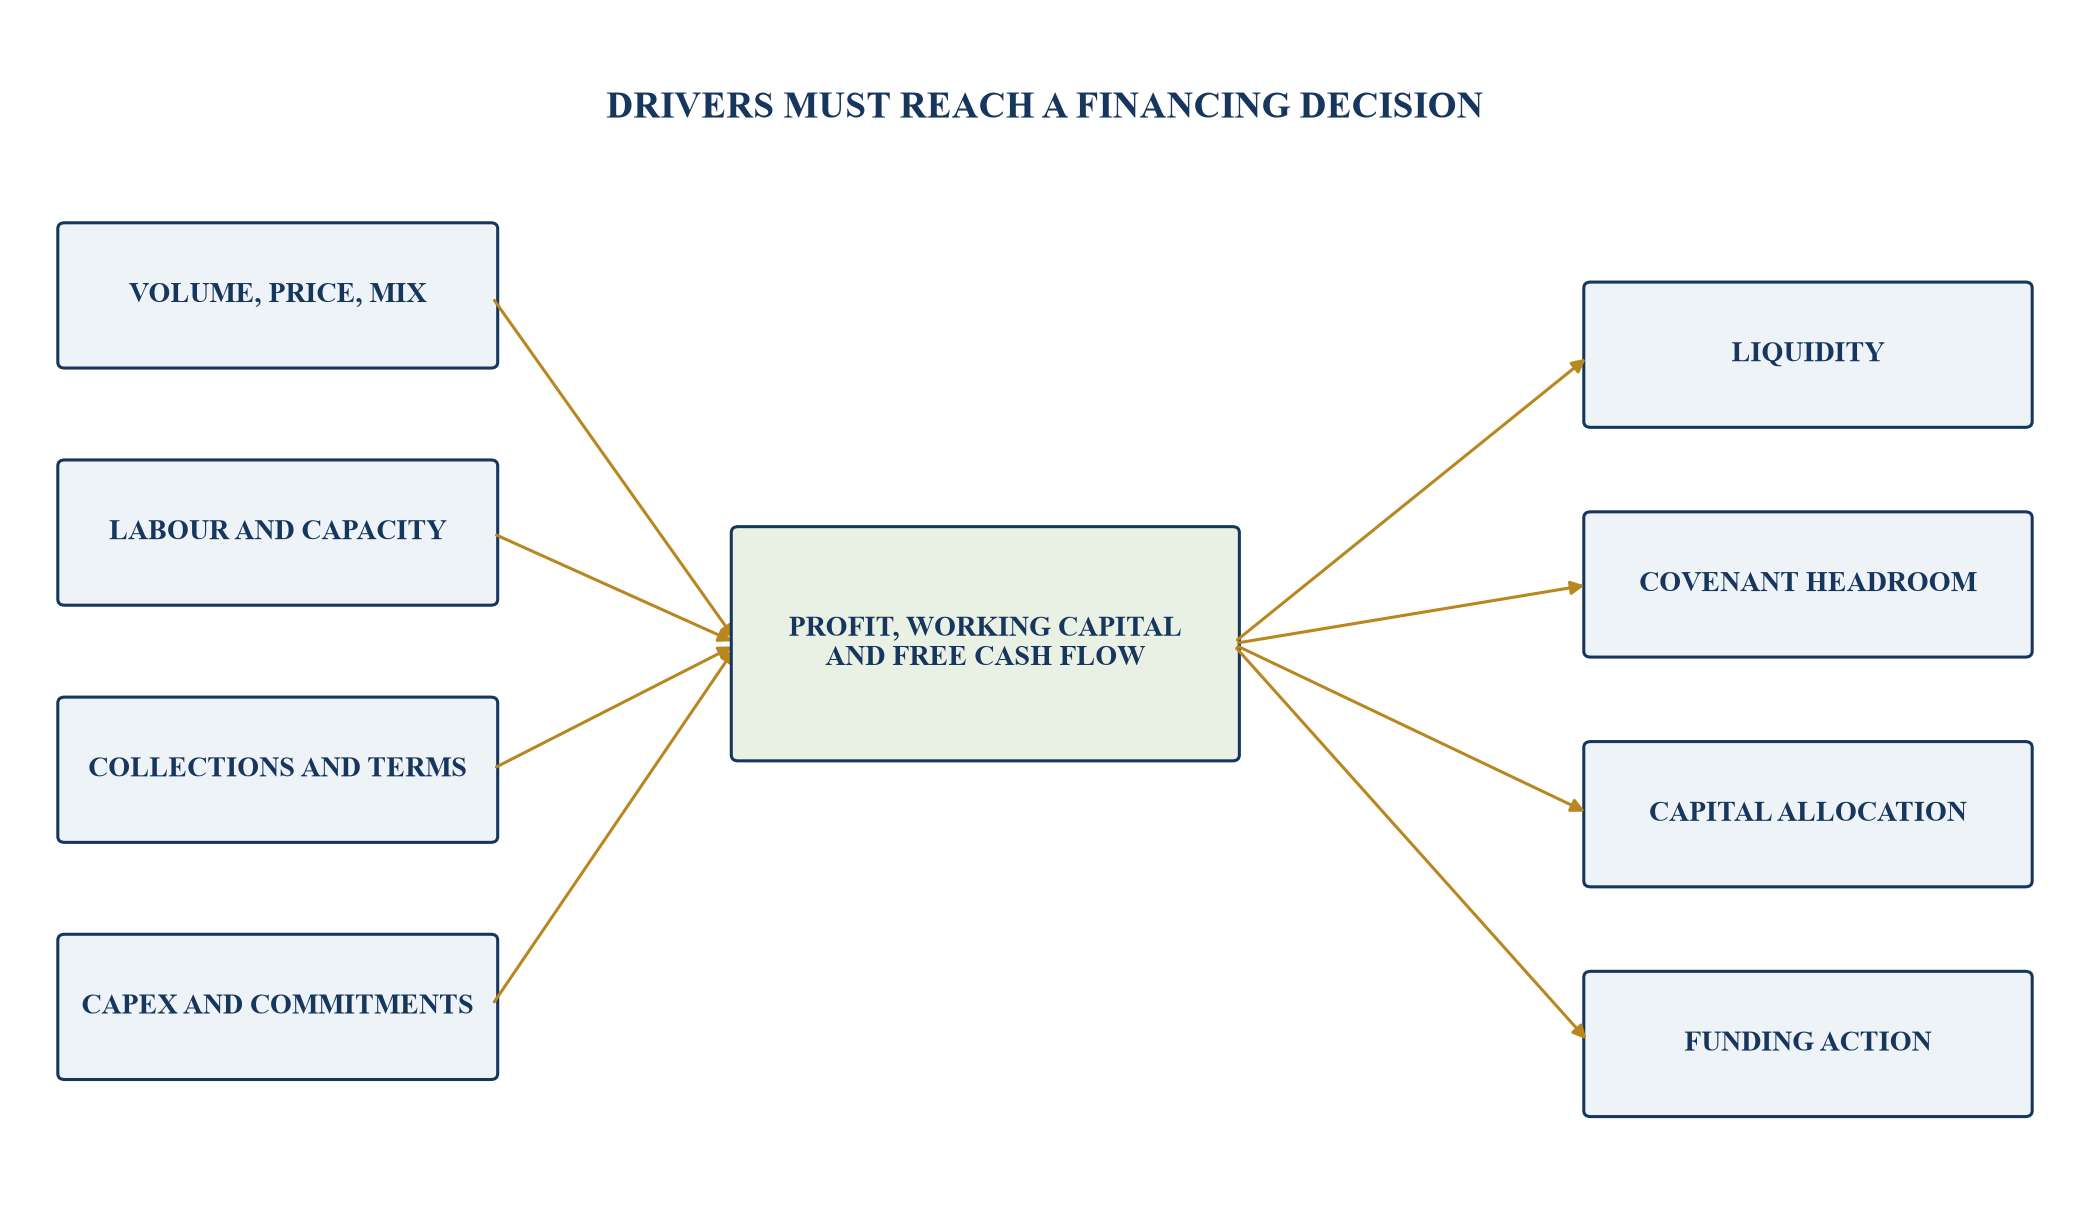
Material operating drivers flow through profit, working capital and investment into liquidity and capital action.
Table 1. Minimum driver record
| Field | Evidence | Control question | Decision use |
|---|---|---|---|
| definition and unit | data dictionary, contract and process record | is the measure stable and comparable? | forecast input and threshold |
| source and lineage | system, transformation, reconciliation and timestamp | can the value be reproduced? | assurance and exception review |
| causal pathway | operating logic, history and specialist judgment | how does the driver reach cash? | sensitivity and action design |
| owner and influence | role, authority and operating process | who can explain or change it? | accountability and response |
| uncertainty | range, error history and structural break | what movement is plausible? | scenario and reserve |
| action link | trigger, lead time, dependency and approval | which decision changes when it moves? | liquidity, covenant or capital action |
Each material driver requires evidence, ownership and a cash pathway.
4. Establish one controlled data layer
Forecasting often fails before modelling begins because actuals, operational measures, pipeline, contracts and treasury data use inconsistent definitions. A controlled layer should reconcile the general ledger, sub-ledgers, customer and supplier records, payroll, operations, banking, debt and market data. It should preserve timestamps, currencies, eliminations and organisational changes.
The finance team should define authoritative sources and reconciliation tolerances. Data quality issues need owners and temporary treatments. Machine assistance can detect anomalies, classify transactions and suggest mappings, while finance approves material changes. Source values should remain available for traceability.
Access should reflect sensitivity. Payroll, customer, banking and financing data require appropriate permissions, logging, retention and security. AI tools should not receive information without an approved purpose, contractual basis and technical control. Data governance is part of forecast governance because an output inherits weaknesses and restrictions from its inputs.
The close calendar and forecast calendar should be connected. Preliminary actuals may be sufficient for a rapid signal, while board and lender decisions may require closed and reconciled balances. The forecast record should identify whether an input is final, provisional, estimated or missing. Material provisional values need an owner and expected resolution date. This prevents speed from being mistaken for certainty.
Master-data changes should be controlled. A customer merger, product reclassification, chart-of-accounts revision or business-unit transfer can create an apparent trend that has no economic meaning. The data layer should maintain mappings across time and disclose restatements. Historical model training should use comparable definitions or explicitly accommodate structural breaks.
5. Design the forecast architecture
The architecture should combine methods according to the decision and data. Deterministic schedules can model debt, leases, payroll and committed contracts. Driver models can represent volume, price, mix and working capital. Time-series methods can support stable high-frequency lines. Machine-learning models can detect nonlinear patterns where sufficient representative data exist. Management overlays can reflect events not present in history.
Each component needs a version, owner, training or calibration period, variables, assumptions, validation, limitations and approval. The consolidated forecast should show how components reconcile to financial statements and cash. A black-box output that bypasses the ledger and treasury bridge will be difficult to trust or audit.
The system should support different horizons. A thirteen-week cash forecast needs granular receipts and payments. A rolling twelve-to-eighteen-month view supports covenant and funding decisions. A three-to-five-year plan supports strategy and capital allocation. Drivers can be shared while frequency, aggregation and uncertainty differ.
Component interfaces should be explicit. Revenue produces invoicing, receivables and cash rather than a single income-statement value. Payroll affects expense, accruals, tax and payment timing. Capital expenditure affects cash, fixed assets, depreciation and possibly covenant adjustments. A reconciled architecture preserves these double-entry and timing relationships so that a favourable profit forecast cannot coexist silently with an impossible balance sheet.
Model selection should include operational cost and failure consequence. A marginal gain in accuracy may be outweighed by unstable infrastructure, scarce skills or weak explainability. The finance team should document the benchmark, decision threshold and reason for selecting each method. Retirement criteria are equally important because models can persist after their economic relevance has disappeared.
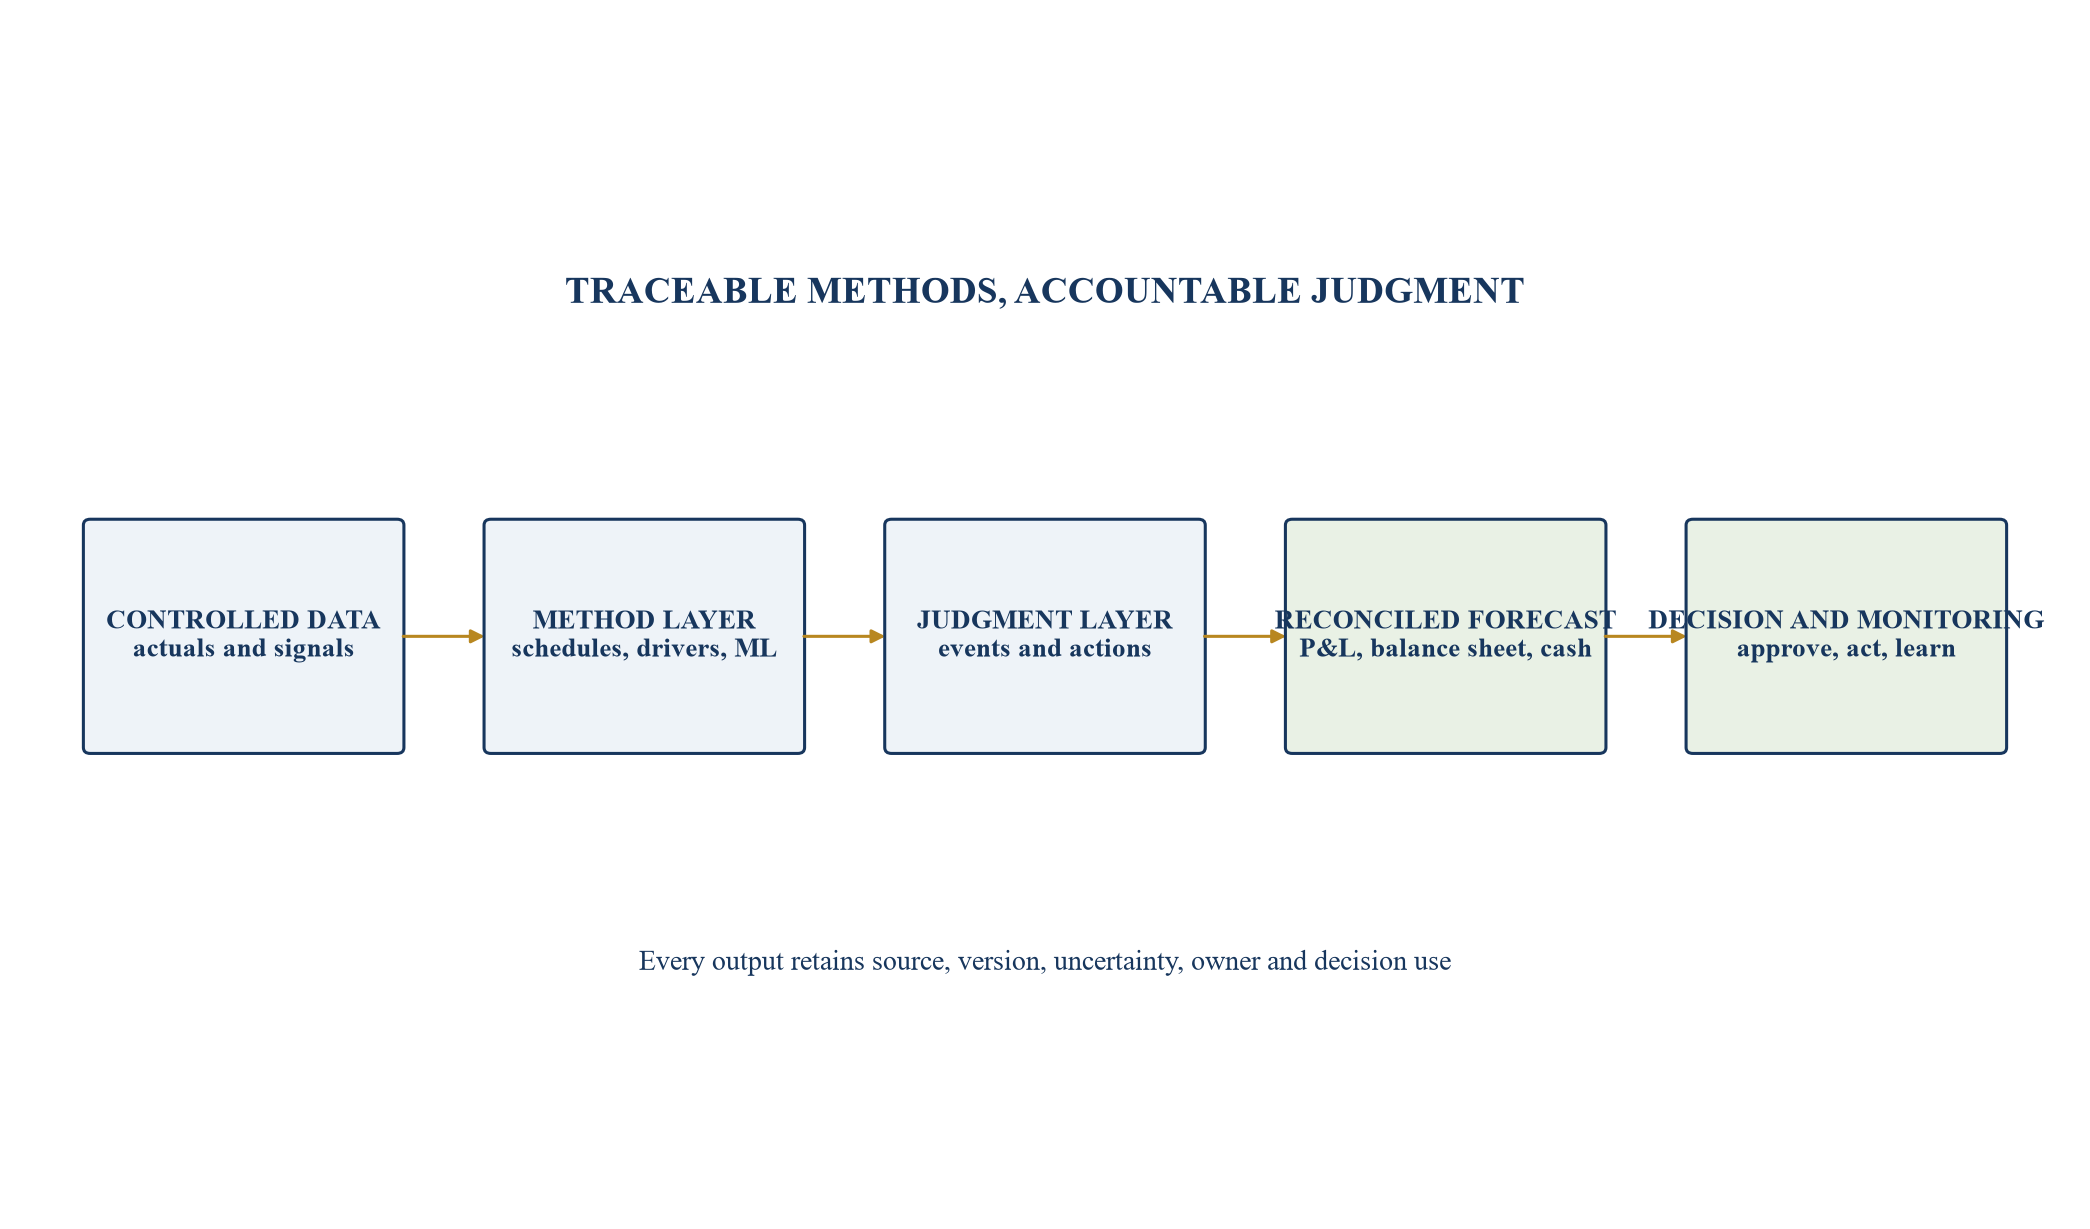
Multiple methods feed one reconciled forecast with human judgment, approval and monitoring.
Table 2. Forecast component selection
| Component | Suitable use | Evidence and validation | Main limitation |
|---|---|---|---|
| contractual schedule | debt, leases, payroll and commitments | agreement, dates, rates and reconciliation | misses behavioural change |
| driver model | revenue, cost, working capital and capacity | causal logic, history, owner and sensitivity | assumptions can become stale |
| time series | stable frequent lines with repeated pattern | out-of-sample error and structural-break test | weak event interpretation |
| machine learning | nonlinear patterns across sufficient variables | representative data, benchmark, stability and explanation | opacity, leakage and drift |
| management judgment | new event, policy, transaction or action | named rationale, range, approval and expiry | bias and weak repeatability |
| scenario model | combined uncertainty and response | internally coherent states and action lead times | probability can imply false precision |
Method choice follows the decision, data and control requirement.
6. Freeze an approved baseline
The approved baseline should identify the data cut, model versions, assumptions, overlays, scenarios and signatories. It becomes the reference for variance analysis, covenant communication and management action. A live dashboard without a frozen baseline can rewrite history and weaken accountability.
Forecast vintages should remain comparable. Organisational changes, acquisitions, disposals, currency and accounting policy should be bridged rather than silently restated. The team should explain whether a variance reflects performance, timing, scope, method or assumption change.
Approval should be proportionate. Business owners validate operating drivers. Finance validates reconciliation and method. Treasury validates debt, liquidity and covenant mechanics. Executives approve material judgments and actions. Specialist advisers address legal, accounting, tax and regulatory matters when relevant.
7. Define forecast horizons by decision lead time
Different decisions require different horizons and granularity. Daily or weekly cash visibility can support payment and drawing decisions. Monthly forecasts support operating action and covenant monitoring. Multi-year scenarios support capital structure and investment. A single horizon can obscure either near-term liquidity or long-term value.
The system should connect horizons. The closing cash of the thirteen-week forecast should reconcile to the monthly balance sheet. Committed investment and financing should flow into the strategic plan. Differences need documented reasons, such as granularity or probability treatment.
Decision lead time should drive refresh frequency. A funding process that takes six months needs warning before the thirteen-week view shows a shortfall. The long-range model should therefore identify funding windows, while the short-range model controls cash execution.
8. Forecast revenue through commercial evidence
Revenue should connect contracted backlog, usage, renewals, pipeline, price, capacity and delivery. The model should distinguish committed, highly probable and opportunity-based amounts. Each category needs a definition and historical conversion evidence. A weighted pipeline total can hide timing, concentration and capacity constraints.
AI can help classify opportunities, estimate conversion and detect changes in customer behaviour. The team should test leakage, sample bias, seller behaviour, market shifts and new-product effects. Outputs should be reviewed by commercial owners and reconciled to contracts and delivery capacity.
The forecast should show customer and product concentration where material. A probability-weighted average may understate a binary renewal or regulatory approval. Named scenarios can represent these events more honestly than a small adjustment spread across all revenue.
Contract structure should drive timing. Subscription, usage, milestone, licence, transaction and project revenue have different billing, recognition and collection patterns. The FP&A model should preserve those distinctions and reconcile contracted value to recognised revenue and cash. Backlog quality should be assessed through cancellation, acceptance, performance obligation, capacity and customer-credit evidence rather than total contract value alone.
Commercial actions also need capacity tests. A discount may improve conversion while reducing cash and attracting low-quality demand. A price increase may improve unit economics and increase churn. The scenario should show both direct and behavioural effects, with ranges when evidence is limited. Sales leaders remain accountable for commercial judgments and finance for their translation into cash.
9. Connect margin to activity and capacity
Margin forecasting should separate unit economics, fixed capacity, step costs, utilisation, procurement and mix. An apparent fixed cost may change when a volume threshold triggers hiring, cloud capacity, logistics or facilities. A variable cost may contain a minimum commitment or volume discount.
The model should use cost per successful customer outcome when activity drives technology, review or support. Failed transactions and rework consume resources without revenue. AI can detect cost patterns, while finance and operations validate causal explanations.
Margin actions require lead time. Pricing, procurement, staffing and process changes have contractual and operational constraints. Scenarios should reflect the earliest responsible effect rather than immediate full savings.
10. Build working-capital drivers
Working capital can determine liquidity even when the income statement performs. Receivables should reflect billing milestones, disputes, customer behaviour, concentration and collection action. Inventory should reflect lead times, safety stock, obsolescence and supplier conditions. Payables should reflect terms, critical suppliers and ethical or contractual constraints.
AI can segment collection risk, identify unusual deductions and estimate receipt timing. The organisation should avoid automated actions that conflict with customer relationships, consumer protection or approved credit policy. Finance retains authority over material treatment and escalation.
The forecast should bridge days-based metrics to named cash movements. A one-day improvement may be unrealistic when most exposure sits in a few disputed invoices. Account-level evidence can support near-term cash, while portfolio drivers support longer horizons.
Collections should distinguish an operational delay from credit deterioration. An invoice awaiting documentation may respond to process action. A customer facing distress may require a credit, legal or commercial decision. Automated prioritisation can support teams, while the action must remain consistent with contracts, customer treatment and approved authority.
Inventory and payables should reflect supply resilience. Reducing stock or extending suppliers can release cash and create service, quality or solvency risk elsewhere in the chain. The management-action record should quantify both the cash benefit and the operating consequence. A working-capital target without this balance can shift risk rather than create value.
11. Model capital expenditure and commitments
Capital expenditure should separate maintenance, compliance, contracted projects, growth options and strategic commitments. Each item needs timing, cash profile, cancellation terms, dependencies, benefit and authority. A high-level percentage of revenue can miss project concentration and funding conditions.
The decision system should show committed versus discretionary cash and the consequences of deferral. Deferring maintenance may protect current liquidity while increasing operational risk. Cancelling a growth project may trigger fees or reduce future capacity. Management actions should include these second-order effects.
AI can reconcile project records, invoices and milestones, and flag schedule slippage. Project owners and finance validate completion, remaining cost and benefit. Major investment remains a capital-allocation decision with appropriate governance.
12. Reconstruct debt and covenant mechanics
The model should reproduce facility limits, drawings, repayments, interest, fees, amortisation, hedging, security, baskets and covenant definitions. It should use the operative documents and specialist interpretation. Management accounts may not align with contractual definitions of EBITDA, net debt or permitted adjustments.
Headroom should be forecast under base and downside scenarios with cure periods, testing dates and notice obligations. The system should distinguish liquidity availability from legal ability to draw. Conditions precedent, borrowing bases and material adverse provisions may affect access.
AI can extract and compare terms, subject to legal verification. Treasury and counsel should approve covenant logic. A small formula error can change a financing decision, so test cases and independent review are important.
The debt schedule should model base rates, margins, floors, step-ups, commitment fees, mandatory prepayments, cash sweeps and maturity concentrations. Hedging should reflect instruments, notionals, dates, collateral and accounting or cash consequences. A central-rate assumption should be accompanied by sensitivities where interest cost or covenant headroom is material.
Facility availability should be tested under the downside. A borrowing base can shrink as receivables or inventory change. A draw may require representations that cannot be made after an adverse event. The FP&A system should identify the difference between an undrawn amount displayed in a treasury report and funding that is legally and operationally available on the required date.
13. Design scenario states rather than isolated sensitivities
A coherent scenario combines related movements in demand, price, cost, working capital, investment and financing. A demand shock may reduce revenue, lengthen collections, lower utilisation and weaken covenant headroom. An isolated revenue sensitivity can miss these interactions.
The team can define a central case, operational downside, market downside and severe but plausible state. Each scenario should identify evidence, timing, correlations, management response and recovery. Probability can support analysis while remaining clearly labelled as judgment where no stable frequency exists.
Scenarios should be few enough to govern. Hundreds of generated paths can help explore distribution, while decision makers need interpretable states and thresholds. The model can preserve both: a simulation for range and a small set of named management cases.
Correlation deserves explicit challenge. Volume, price, collections and financing cost may move together during stress. Historical relationships can break when policy, technology, competition or customer behaviour changes. Scenario design should combine data with business and market judgment, and document where correlation is assumed rather than observed.
Recovery should be modelled as carefully as deterioration. A sharp rebound may require capacity, working capital and investment before cash returns. The downside path should state whether lost customers return, deferred sales convert, suppliers restore terms and lenders maintain access. This prevents a temporary shock from being resolved through an unsupported automatic recovery.
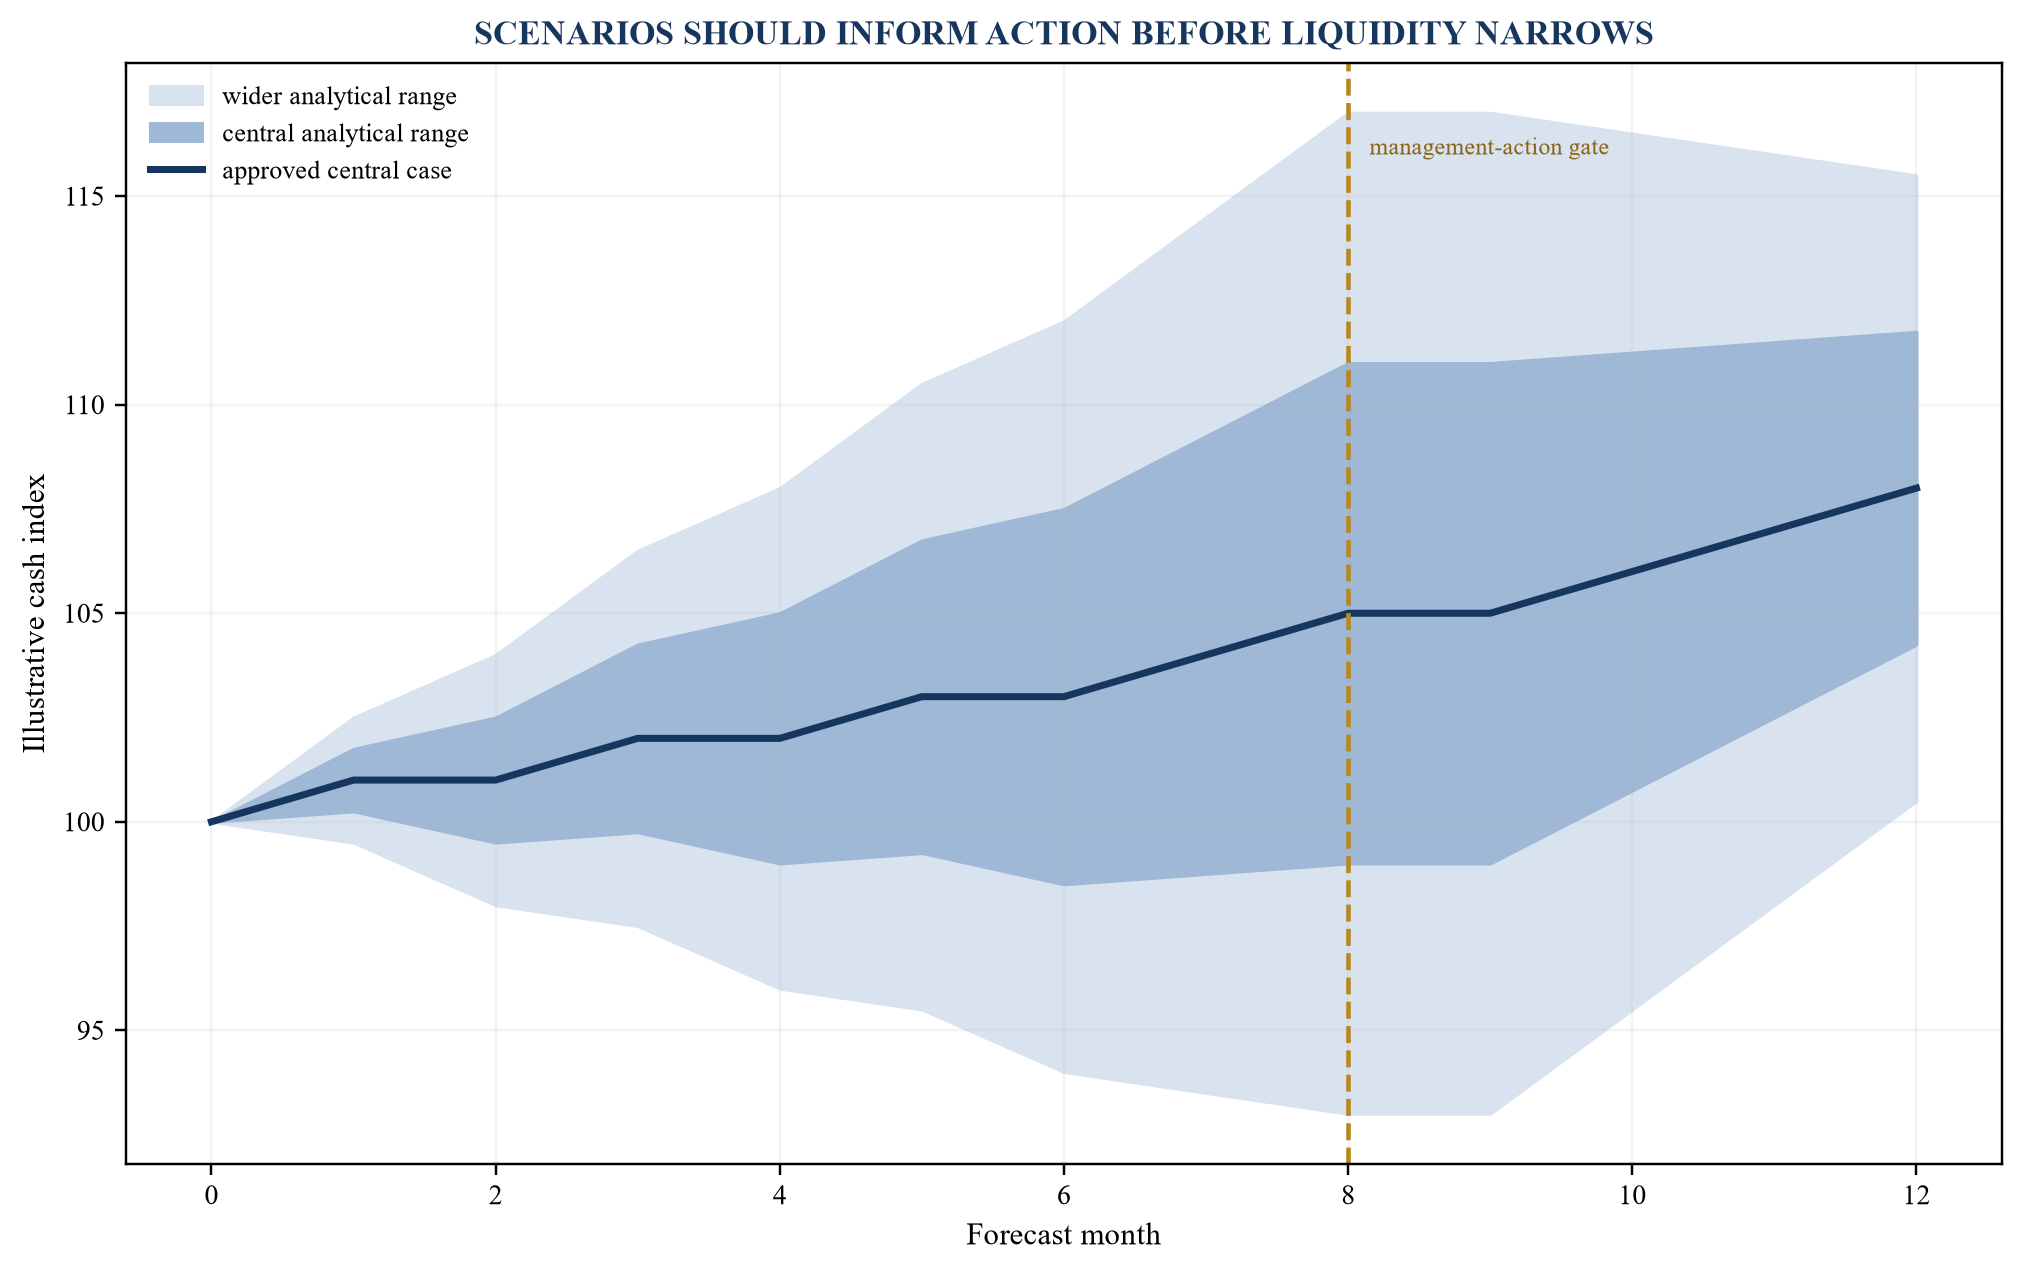
Illustrative paths show uncertainty widening until approved management action changes the range.
Table 3. Scenario design record
| Scenario element | Central case | Downside treatment | Decision test |
|---|---|---|---|
| demand and price | observed run rate and approved commercial plan | slower conversion, churn or price pressure | customer and pipeline threshold |
| gross margin | evidenced unit cost, mix and capacity | adverse mix, low utilisation and supplier increase | contribution and capacity trigger |
| working capital | account evidence and normal pattern | delayed collections and constrained supplier terms | minimum cash and collection action |
| investment | approved committed and discretionary plan | essential remediation plus deferred options | project gate and cancellation effect |
| financing | available facility and documented terms | lower headroom, higher rate and reduced access | draw, waiver or raise deadline |
| management action | funded action with owner and lead time | reduced effectiveness or later delivery | acceptance evidence and fallback |
All scenario values require company-specific evidence and approval.
14. Use probability with discipline
Probability should reflect evidence and decision purpose. Historical frequencies can support recurring events. Market and transaction events may require judgmental ranges. A model-generated percentage does not become objective simply because it is precise. The system should identify source, period, uncertainty and approver.
Expected values can hide tail liquidity needs. A ten per cent chance of a severe cash shortfall may require a funding response even when expected cash is positive. The board should see distribution, minimum liquidity and thresholds alongside the central case.
Probability should update when evidence changes. The team should preserve prior values and reasons for change. This allows calibration and prevents silent optimism or pessimism.
15. Build the earnings-to-cash bridge
The forecast should reconcile EBITDA or operating profit to operating cash, free cash flow and closing liquidity. The bridge includes working capital, tax, interest, leases, capital expenditure, acquisitions, disposals, dividends, debt and equity. It should distinguish accounting timing from cash timing.
The bridge should show gross cash, restricted cash, undrawn committed facilities and any availability conditions. Net debt alone may not reveal a near-term payment concentration. Liquidity should be measured on dates relevant to payroll, tax, debt and suppliers.
AI can identify unusual movements and reconcile sub-ledgers, while treasury and finance approve cash classification and availability. The bridge should remain reproducible from source data and the approved forecast.
16. Calculate liquidity runway by scenario
Runway should be defined against a minimum operating buffer, not the date cash reaches zero. The buffer may reflect payroll, critical suppliers, volatility, facility conditions and board risk appetite. Scenario runway should incorporate committed financing and realistic action lead times.
The system should identify the first date that minimum liquidity is breached, the amount, the drivers and the latest action date. A funding process should begin before the breach. The dashboard can escalate when lead time exceeds remaining runway.
Restricted or trapped cash should be identified. Cross-border transfer, subsidiary obligations and local regulation can limit availability. Legal, tax and treasury specialists should confirm material constraints.
Intramonth troughs can matter more than month-end balances. Payroll, tax, debt and supplier payments may cluster before customer receipts. A monthly forecast that remains positive can therefore conceal a payment-day shortfall. The short-horizon model should use transaction timing and known calendars, then reconcile to the monthly view.
Liquidity should include operational contingency. A minimum buffer can reflect forecast error, concentration and incident experience. The board should define the buffer and conditions for using it. Once the buffer is breached, the action process should escalate automatically to named authorities without allowing the model to initiate payments or financing.
17. Forecast covenant headroom
Covenant headroom should be shown in amount and percentage terms, with sensitivity to key definitions and adjustments. The model should identify test dates, information obligations, cure mechanisms and waiver lead time. Forecast headroom near a threshold requires greater data and approval discipline.
The organisation should maintain a bridge from statutory or management figures to contractual measures. Adjustments should have evidence and limits. Future synergies, exceptional items and pro forma effects require careful interpretation.
Lender communication should use approved information and comply with agreements and disclosure obligations. A forecast is not a substitute for legal interpretation. Treasury, counsel and advisers should manage material issues.
Covenant forecasting should distinguish a temporary arithmetic breach from a sustained capital-structure problem, while treating both seriously. A waiver may solve a test date and introduce fees, tighter terms or reporting. Equity cure rights may have conditions and economic consequences. The scenario should show the full cash and strategic effect of each response.
Headroom warnings should begin before a breach becomes the central forecast. A watch threshold can reflect forecast error and action lead time. When the threshold is crossed, finance can increase refresh frequency, validate definitions, preserve evidence and prepare communications. Early preparation improves optionality and does not imply that a breach will occur.
18. Link capital allocation to scenario resilience
Capital allocation should compare investment, debt reduction, acquisitions, dividends, buybacks and liquidity reserves under the same scenario framework. Each option affects expected value, downside survival and strategic flexibility. A project with attractive central-case returns may be inappropriate if it removes funding capacity needed in a plausible downside.
The decision record should identify incremental cash, risk, timing, reversibility and financing source. Sunk costs should not justify further spending without updated evidence. Option value may support staged investment with gates.
AI can help screen projects and simulate portfolios. Management and the board retain responsibility for assumptions, risk appetite and final allocation. The system should make trade-offs visible rather than select capital automatically.
Projects should be assessed for interdependence. A technology investment may enable cost reduction elsewhere. A capacity project may require working capital and commercial investment. An acquisition may consume debt headroom needed for organic growth. Portfolio analysis should identify shared resources, common downside drivers and sequencing constraints.
Stage gates can preserve options. The board may approve discovery, pilot, scale and full commitment separately, with evidence at each stage. The forecast should model committed cash and potential future cash distinctly. This reduces the risk that an approved option is treated as an unavoidable obligation before its gate is passed.
19. Convert forecast changes into management actions
An action should have an owner, authority, trigger, start date, lead time, cash effect, dependencies, costs, customer or employee consequences and acceptance evidence. General statements such as reduce cost or improve collections are insufficient. The forecast should model the action when it can be executed responsibly.
Actions can be tiered by reversibility and consequence. Early measures may include discretionary spend control, collection escalation and procurement. Later measures may include hiring changes, project deferral, asset disposal, refinancing or equity. Legal, employment, contractual and regulatory requirements need specialist review.
The action library should capture actual effectiveness. Repeated experience improves future scenarios and identifies actions that appear credible in plans but fail in operation.
Action dependencies should be mapped. A hiring freeze may require exceptions for revenue delivery and control roles. A supplier renegotiation may depend on volume commitments. A disposal may require diligence, consent and transitional services. The cash effect should enter the forecast only when the prerequisite path is plausible within the scenario.
Actions also require stop conditions. A defensive measure may become value-destructive when maintained after conditions improve. The dashboard should identify review dates and authority to reverse or modify the action. This supports disciplined response without converting a temporary liquidity measure into an unintended strategic decision.
20. Protect human decision authority
AI can influence consequential financing and workforce decisions. Roles should define who prepares, reviews, challenges, approves and executes. Users should understand the system's purpose, data, limitations and escalation. Authority should remain with accountable individuals under the organisation's governance.
Automation bias can occur when users accept a recommendation because it appears quantitative. Algorithmic aversion can occur after an error. The control response is evidence, training, comparison, override recording and review rather than blind reliance or rejection.
NIST's AI risk framework emphasises defined human roles, knowledge limits and oversight. The finance function can apply these principles through model cards, decision records, challenge sessions and outcome monitoring.
21. Govern management overlays
Management overlays are necessary when structural change or recent events are absent from historical data. Each overlay should identify the affected line, rationale, evidence, amount or range, owner, approver and expiry. The system should show forecast before and after overlay.
Overlays should be tested for bias and duplication. A sales-risk adjustment may already be captured in the conversion model. A cost reserve may overlap with a downside scenario. Finance should reconcile the total effect.
Actual outcomes should be compared with overlays. Persistent directional error can reveal incentive or governance issues. The analysis should focus on learning and accountability.
22. Monitor model performance and drift
Forecast models should be monitored by horizon, business, driver and scenario. Metrics can include absolute and percentage error, bias, interval coverage, stability and decision usefulness. A single aggregate error can hide material liquidity or covenant misses.
Drift can arise through customer behaviour, price, cost, organisational change, inflation, regulation or data systems. The team should define thresholds for review, recalibration and retirement. Material changes need approval and preserved versions.
The system should compare AI-supported methods with simple benchmarks. Complexity is justified when it improves decisions after considering maintenance and control. A simpler model may be preferable for a high-consequence item that depends on contractual schedules and management action.
Error should be attributed before remediation. A miss can arise from source data, timing, method, overlay, action failure or an unforeseeable event. Each cause has a different response. Retraining a model cannot correct an unexecuted collection action, and stronger governance cannot substitute for missing market information.
Monitoring should include economic relevance. A model may remain statistically stable while the decision changes, such as a new covenant, pricing model or funding structure. The inventory should trigger review when business purpose, users, data, method or consequence changes. Performance thresholds should be approved and periodically challenged.
23. Control generative narrative
Generative AI can draft variance commentary, scenario summaries and board materials. The narrative should be grounded in approved data and cite the underlying driver, period and evidence. It should separate observed results, forecast estimates and management judgments.
Users should review material claims, causal explanations and recommendations. The system should prevent confidential information from entering unapproved services. Generated text should not create commitments to lenders, investors, employees or customers without authority.
Version and approval records should connect the narrative to the forecast vintage. A concise commentary that explains decision impact is more valuable than a large volume of automatically generated text.
24. Apply responsible-AI expectations in the UAE
The Central Bank of the UAE's February 2026 guidance for licensed financial institutions addresses consumer protection, transparency, bias, accountability, explainability, data privacy and responsible adoption. A regulated entity should assess how FP&A tools interact with governed decisions, customer outcomes and third parties. Applicability requires specialist analysis.
The DFSA's 2025 survey reported rapid AI adoption among authorised firms in the DIFC and developing governance. These findings support attention to accountability, inventory, third-party risk, testing and oversight. They do not establish that any specific FP&A system complies.
The control framework should map applicable obligations, owners, evidence and monitoring. Qualified legal, regulatory and risk specialists should advise on the organisation's circumstances.
An FP&A tool may appear internal while influencing decisions with customer, employee or market effects. The use-case assessment should therefore examine the full decision chain, including credit, pricing, service reduction, workforce action and disclosure. The level of assurance can increase where an output materially affects protected interests or a regulated obligation.
Governance should also cover experimentation. Sandboxed analysis, synthetic or masked data, restricted access and clear non-production status can allow learning without creating an uncontrolled decision channel. Promotion into production requires documented purpose, validation, ownership, security and approval. Informal use of public generative tools should be addressed through policy, training and technical controls.
25. Manage third-party AI and concentration
FP&A may use cloud platforms, foundation models, planning software, data providers and consultants. The organisation should map contracts, data use, location, security, service levels, change rights, exit, model dependence and replacement time. A common provider across finance and operations can create correlated risk.
The Financial Stability Board identifies third-party dependency, market correlation, cyber risk, model risk, data quality and governance as relevant AI vulnerabilities in finance. A company should assess these exposures according to its system and materiality.
Fallback should be tested. Finance should retain the ability to produce a minimum cash and covenant forecast during a service outage. Exit plans should preserve data, logic, history and evidence.
Contract review should address provider use of company data, confidentiality, retention, model training, location, subcontractors, audit, incident notice, intellectual property, liability and change. Online terms can change and should be preserved with the approved configuration. Counsel should interpret material provisions.
Concentration can arise indirectly when several applications rely on the same cloud, model or integration. The inventory should identify shared dependencies and the decisions exposed. A provider outage during a financing event may require a manual process and pre-agreed evidence pack. Resilience investment should be proportionate to the cash and compliance consequence.
26. Secure the forecasting environment
The forecasting environment contains sensitive commercial, payroll, banking, customer and financing data. Controls should cover identity, least privilege, encryption, logging, development separation, secrets, backup, incident response and third parties. Generated exports and prompts need equivalent treatment.
Finance should define who can change data, models, assumptions, scenarios and approvals. Segregation of duties may be required for payments, debt and reporting. Emergency access should be logged and reviewed.
Security testing should reflect the architecture. Risks can include prompt injection, data leakage, malicious files, unauthorised connectors and model manipulation. Specialists should validate material controls.
27. Reconcile FP&A with financial reporting
FP&A forecasts support internal decisions and may inform going concern, impairment, valuation and disclosures. They should reconcile to accounting policies and reported actuals while preserving differences in purpose. Qualified accountants and auditors determine the applicable evidence and treatment.
IAS 1 requires management to consider available information about the future when assessing going concern, for at least twelve months from the reporting period end. IAS 7 addresses cash-flow presentation. The revised IFRS Practice Statement 1 focuses management commentary on factors affecting value creation and cash flows. Application depends on the entity and reporting framework.
The decision system should preserve assumptions, scenarios, approvals and changes relevant to reporting. It does not replace formal accounting or audit procedures.
Forecast purpose should be labelled. An operating forecast, board plan, impairment model, going-concern assessment, viability statement and lender forecast may use related information with different definitions, horizons and assurance. The organisation should reconcile differences and prevent one model from being reused outside its approved purpose without review.
Management commentary and investor communication should remain connected to the evidence used internally. The revised IFRS Practice Statement 1 emphasises information about factors fundamental to value creation and cash flows. Where applied, the finance team can use controlled drivers and scenarios to support coherent explanation while qualified reporting specialists determine the required content.
28. Build the liquidity bridge
The liquidity bridge begins with opening available cash, adds operating receipts and financing inflows, deducts operating payments, tax, interest, investment and distributions, and shows closing available liquidity. It should identify restricted amounts and undrawn committed facilities separately.
Scenario columns should show where movement arises. The bridge can compare approved central, downside before action and downside after approved action. This reveals whether the action restores buffer or only delays the breach.
The board should see the latest responsible dates for financing, waiver and capital decisions. A bridge without action timing can overstate flexibility.
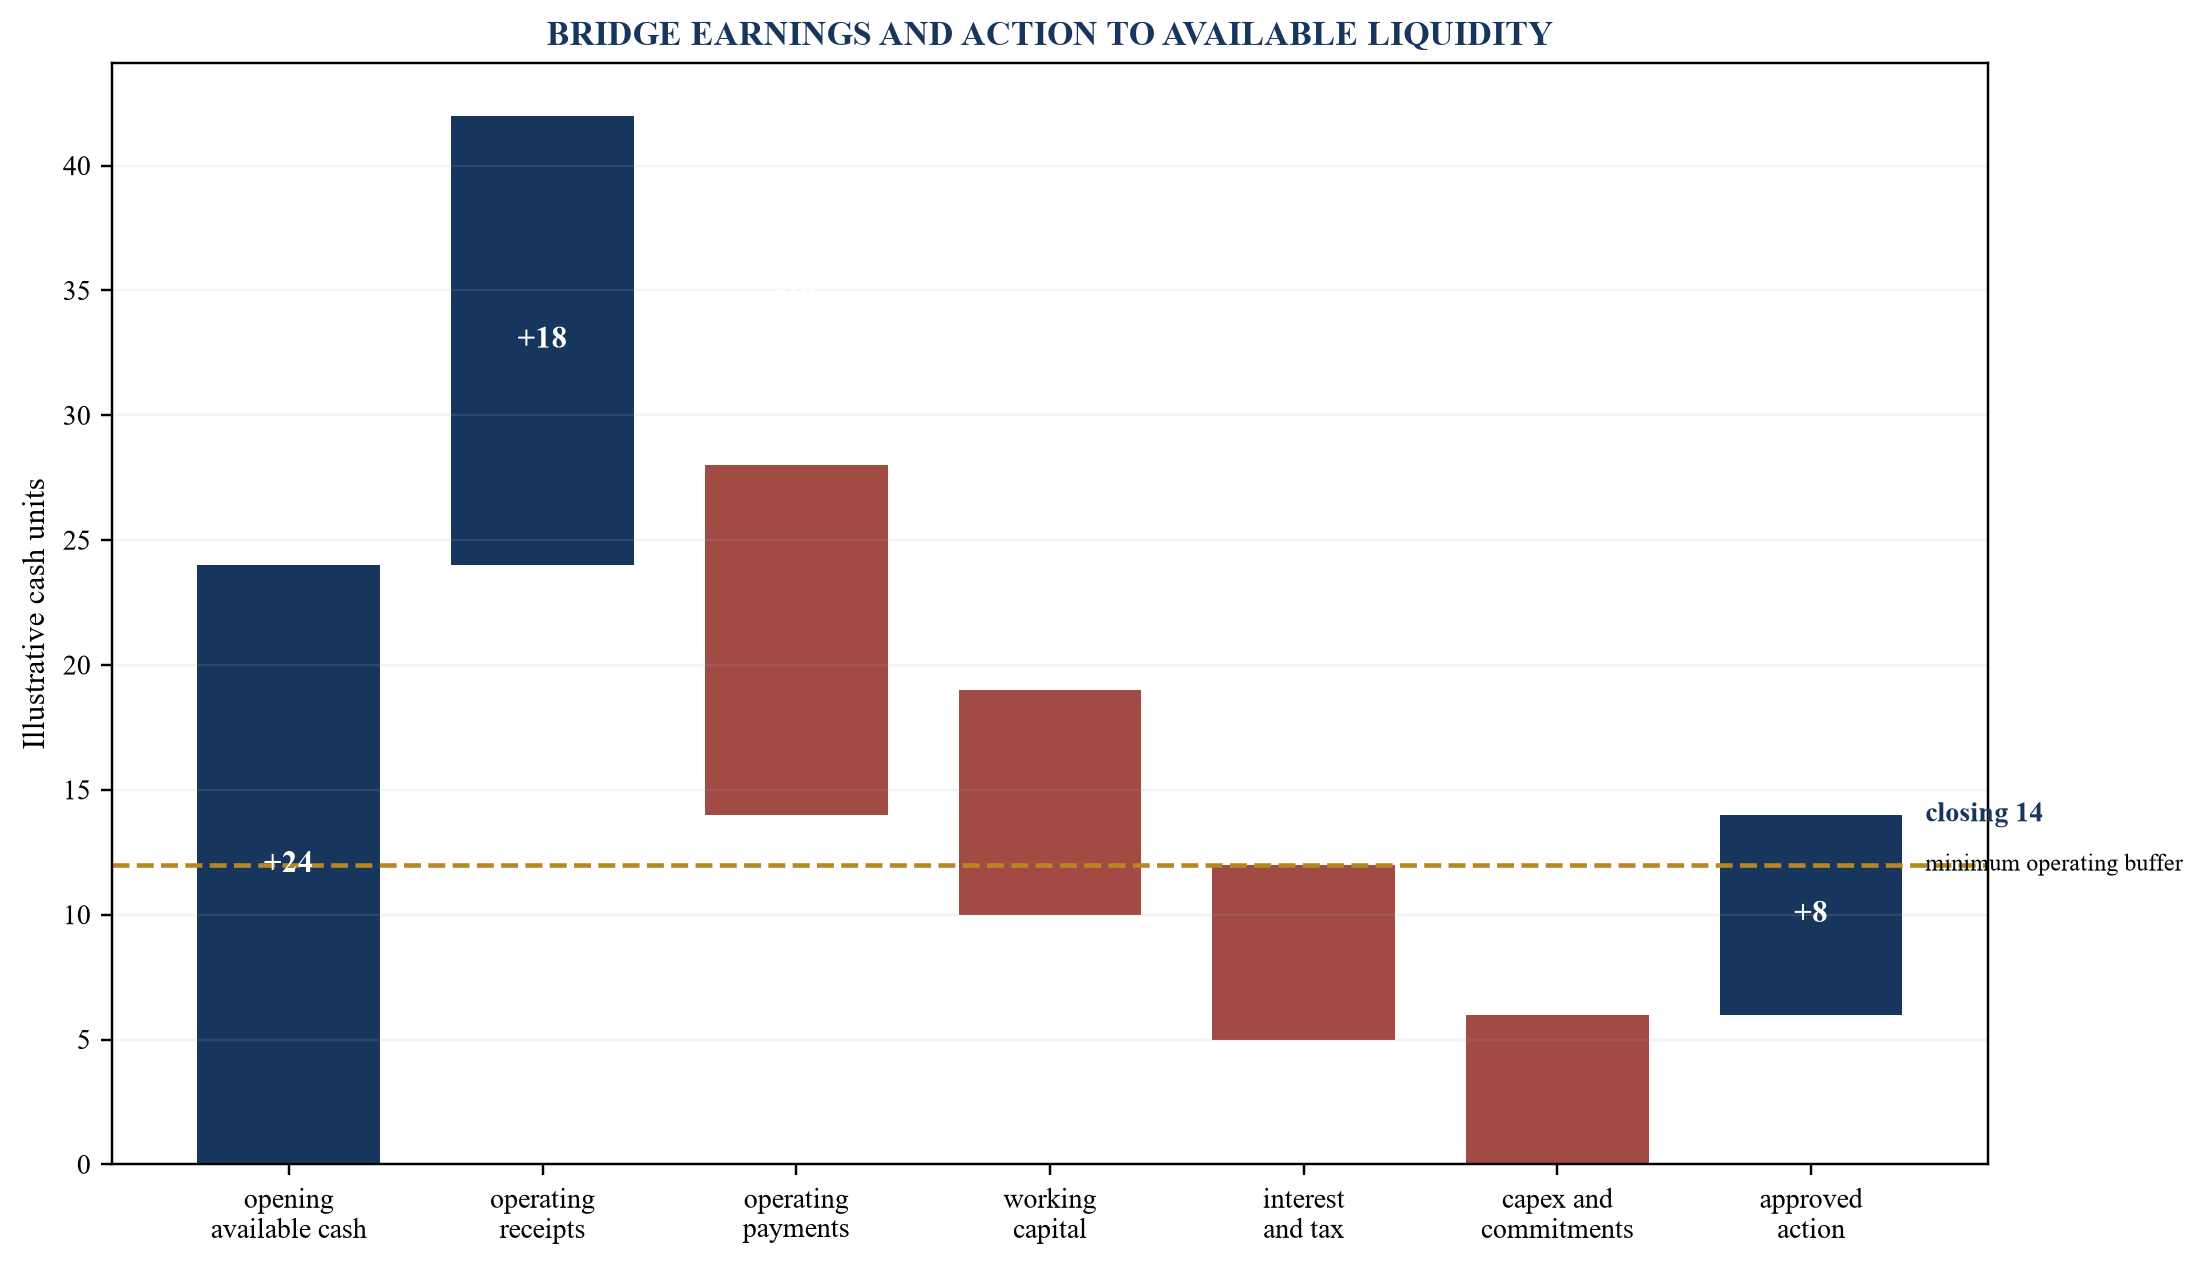
Illustrative amounts show how operating movement and approved action affect available liquidity.
Table 4. Liquidity and covenant decision record
| Measure | Source and definition | Threshold | Required response |
|---|---|---|---|
| available cash | bank, restrictions, pooling and legal availability | minimum operating buffer | preserve cash, confirm access and escalate |
| committed facility | agreement, conditions, draw process and maturity | lead time to draw or refinance | prepare draw, waiver or replacement funding |
| covenant headroom | operative definition, forecast and test date | approved warning range | validate, notify and begin mitigation |
| collection exposure | account-level receipts, disputes and concentration | delayed material receipt | assign collection and liquidity contingency |
| committed investment | contract, milestone, cancellation and consequence | cash exceeds approved scenario | gate, renegotiate, defer or fund |
| downside runway | scenario cash and action lead time | runway below response horizon | launch financing or capital action |
Values and thresholds require company-specific evidence and specialist review.
29. Build the management-action dashboard
The dashboard should display the decision, trigger, owner, authority, latest start date, expected cash effect, dependencies, status and evidence. It should distinguish proposed, approved, launched, delivered and verified actions. Colour alone should not represent status without acceptance evidence.
Actions should connect to forecast versions and scenarios. If an action slips, the system should update liquidity and covenant headroom. If a better operating result removes the trigger, the board should decide whether to stop or preserve the action.
The dashboard should focus on a small number of material decisions. Detailed tasks can remain in delivery systems. Board reporting should surface exceptions, irreversible steps and funding deadlines.
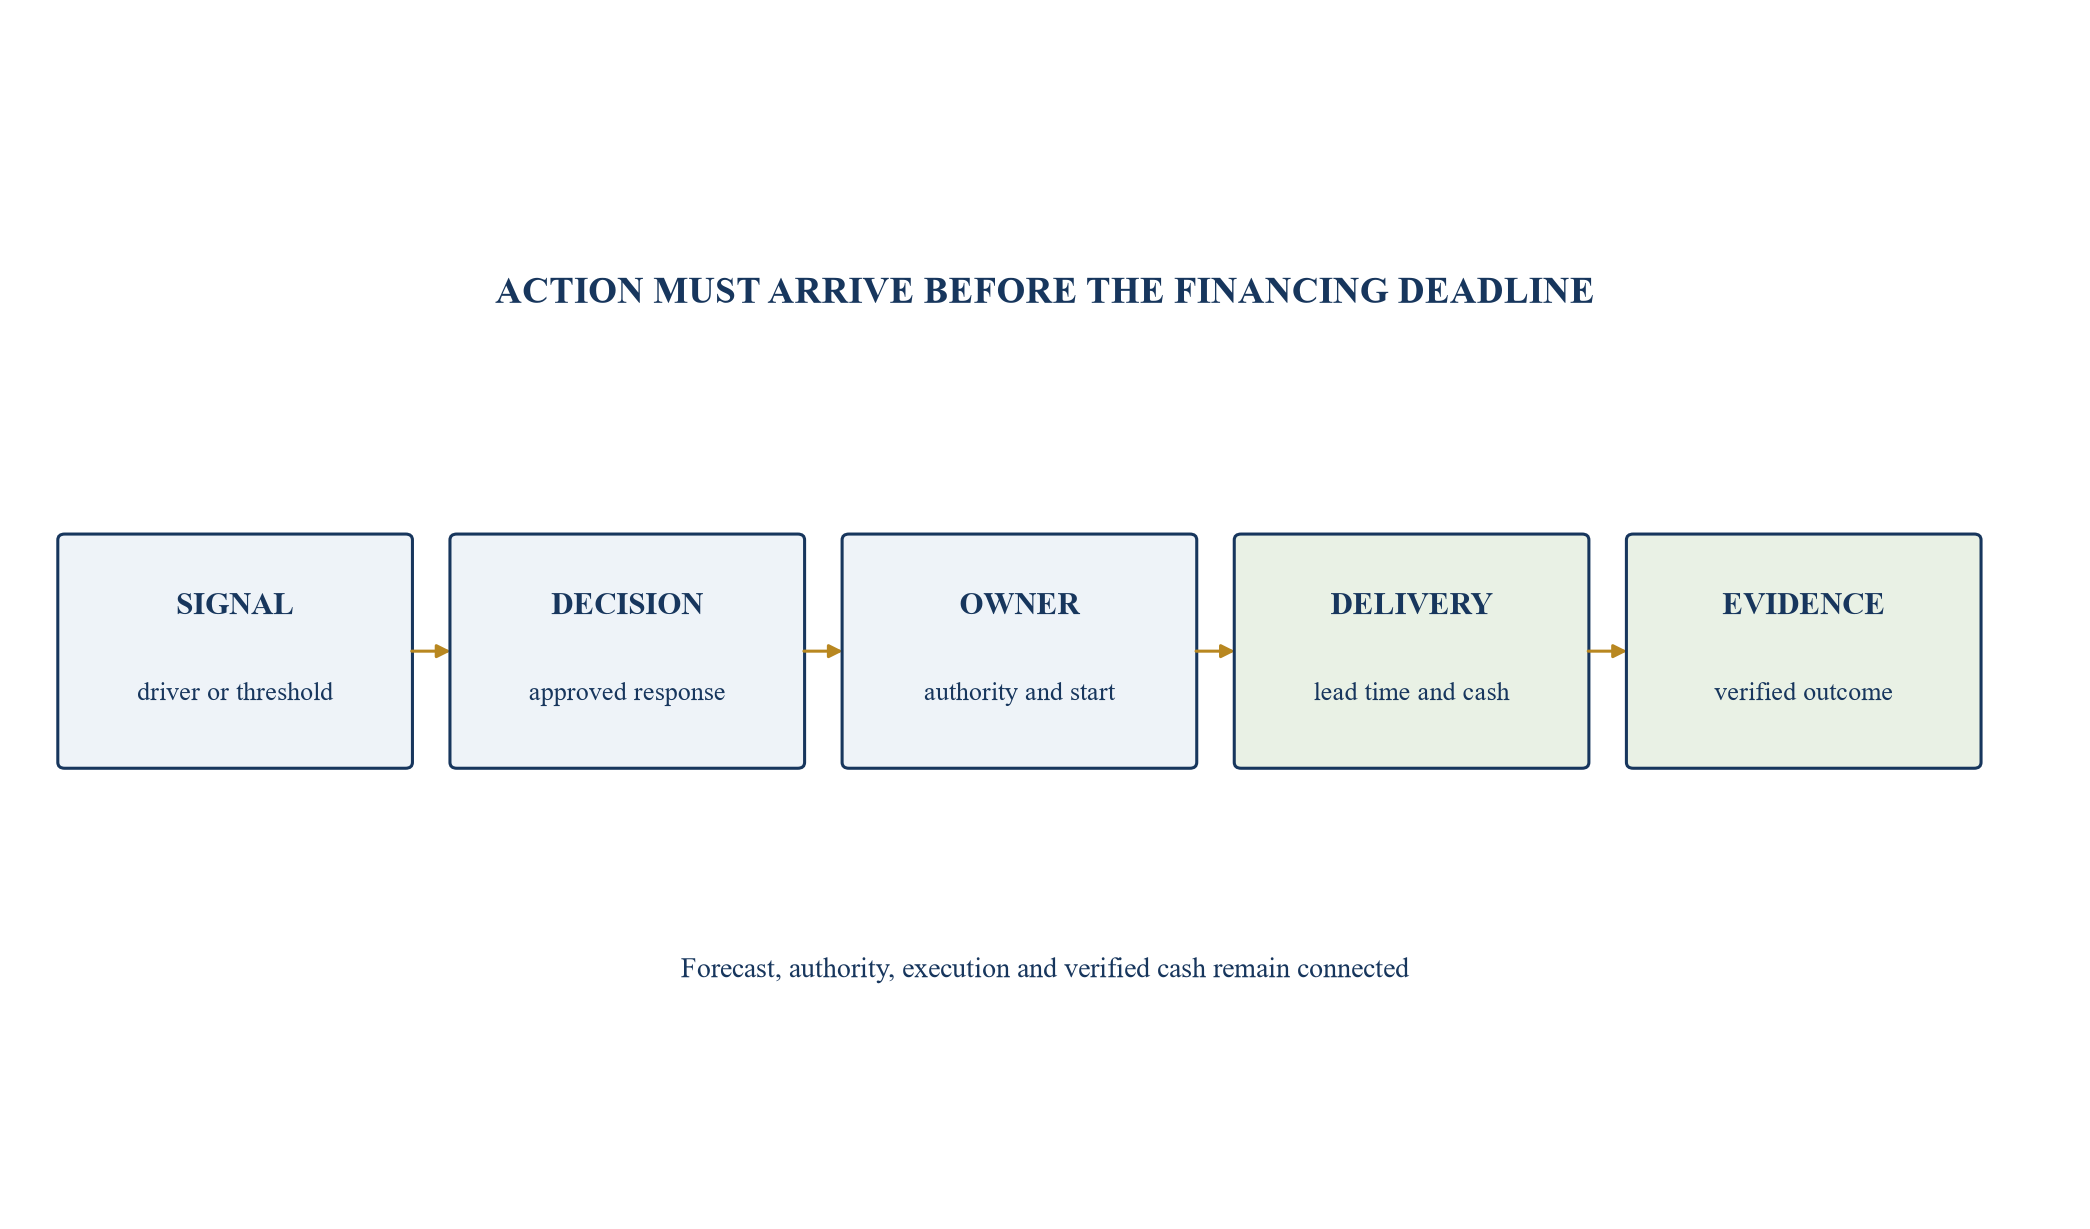
An action becomes forecastable when trigger, authority, lead time, cash effect and evidence are controlled.
Table 5. Management-action control record
| Action field | Required content | Challenge question | Acceptance evidence |
|---|---|---|---|
| trigger | driver, threshold, date and scenario | is the signal observable and material? | approved data and forecast vintage |
| owner and authority | named executive, deputy and approval route | can this person commit the organisation? | decision minute or delegated authority |
| lead time | preparation, notice, delivery and cash timing | can the effect arrive before the breach? | dated plan and dependencies |
| economics | gross cash, cost, revenue effect and reversibility | is the net effect complete and realistic? | finance bridge and specialist review |
| stakeholder effect | customer, employee, supplier and regulator | what secondary consequence arises? | impact assessment and communication plan |
| completion | deliverable, measure and verifier | how will realised cash be confirmed? | source transaction and independent check |
Cash effects enter the forecast only when action design and authority are credible.
30. Measure forecast value through decisions
Forecast accuracy remains important, while decision value includes timing and action. A model can have modest average improvement and still create significant value by identifying a funding need earlier. Another model can reduce error without changing any decision.
The scorecard can track forecast bias, interval coverage, liquidity surprises, covenant-warning lead time, action cycle time, realised cash and capital reallocation. Measures should avoid rewarding deliberate conservatism or optimism.
Benefits should be supported by evidence and compared with system, data, people and control cost. Management estimates should remain labelled until realised and verified.
Decision lead time can be measured from first reliable signal to approved action. The organisation can compare this with the previous process and with the minimum time required for financing, waiver, pricing or cost action. A longer lead time has value only when the signal is reliable enough to justify preparation.
Outcome review should avoid hindsight bias. The team should assess whether the decision was reasonable using information available at the time, not only whether the outcome was favourable. This supports learning and prevents teams from manipulating forecasts to appear accurate. Material lessons should update drivers, scenarios, actions and governance.
31. Design the operating model
The operating model should define roles across finance, treasury, business units, data, technology, risk, legal and leadership. A central team can own standards and platform. Business teams own drivers and actions. Treasury owns financing and liquidity. Executives approve material judgments and capital decisions.
The calendar should combine continuous signals with controlled forecast vintages. Exception review can occur between monthly cycles when a threshold is crossed. The organisation should avoid running many unofficial forecasts without reconciliation.
Skills include finance, operations, data, modelling, challenge and communication. Users need enough understanding to question outputs. Technical specialists need enough business context to model the right decision.
Incentives should support forecast quality. Business teams may be rewarded for targets and become reluctant to show downside. Finance may become excessively conservative to avoid surprises. The operating model should separate aspiration, commitment and best estimate, and allow responsible escalation without treating every downside signal as performance failure.
A forecast forum should focus on decisions and exceptions. Participants review material driver changes, scenario movement, action status and funding deadlines. Detailed reconciliation can occur before the meeting. The chair should record unresolved judgments, approvals and owners. This prevents the process from becoming a repetitive presentation of numbers without action.
32. Implement through controlled releases
Implementation can begin with one material decision, such as thirteen-week liquidity or covenant headroom. The team establishes the driver tree, data lineage, baseline, scenarios, action register and approval. It compares the new process with the existing forecast before wider use.
Release gates can cover data reconciliation, method validation, user acceptance, security, governance, fallback and decision authority. A pilot should produce evidence without placing the organisation at risk. Parallel operation can confirm stability.
The roadmap can add revenue, working capital, capital allocation and narrative after the control foundation works. Technology selection follows the operating requirement. A large platform programme is not a substitute for driver ownership.
33. Maintain a minimum viable fallback
Finance should be able to produce a minimum cash, debt and covenant forecast during a system or provider outage. The fallback should identify critical data, manual schedules, owners, frequency and storage. It should be tested periodically.
Fallback supports continuity and provides a benchmark. If the advanced model cannot materially improve the decision, the simpler process may remain primary. The organisation should avoid dependence on one vendor, person or model where the consequence exceeds risk appetite.
The fallback should respect security and access controls. Emergency spreadsheets can create uncontrolled copies of sensitive data unless designed in advance.
34. Use a worked company example
Consider a hypothetical regional services company with annual revenue of USD 240 million, opening available cash of USD 24 million, a revolving facility and a quarterly leverage covenant. Revenue depends on contract wins, mobilisation and utilisation. Working capital depends on milestone billing and a concentrated customer base. These figures are illustrative assumptions.
The static budget shows annual growth and adequate year-end cash. The driver system identifies a two-month mobilisation delay, slower receipt on two invoices and a capacity commitment. The central case remains within covenant, while a coherent downside crosses the board's minimum liquidity buffer before the next test date.
The approved response combines collection escalation, staged capital expenditure and early lender engagement. Each action has a latest start date and cash effect range. The board retains authority over funding and capital changes. Actual outcomes would need to be compared with the approved vintage.
35. Prepare the CFO financing pack
The CFO pack should show the decision catalogue, driver tree, forecast vintage, scenario range, liquidity bridge, covenant headroom, capital options and management actions. It should distinguish observed data, model estimates and management judgment. Material limitations and unresolved matters should remain visible.
The pack can include a one-page decision summary supported by controlled appendices. Each recommendation should state timing, authority, cash effect and fallback. Lender or investor materials require approved disclosure and legal review.
The board should be able to trace a recommendation back to evidence and forward to execution. Decorative analytics without this chain should be removed.
36. Establish board decision gates
Decision gates can include forecast approval, downside acceptance, liquidity-action launch, covenant escalation, financing mandate and capital allocation. Each gate requires defined evidence and authority. Exceptions should state temporary control, deadline and residual risk.
The board should challenge correlation, probability, management-action effectiveness and funding access. It should examine both expected value and survival. A central case should not obscure a plausible state that exhausts liquidity before action can work.
Minutes should record assumptions, decisions, owners and follow-up. This supports accountability and later learning.
37. Run a 100-day transformation
The first thirty days define decisions, drivers, data, governance and the existing baseline. Days thirty-one to sixty build the controlled forecast, scenarios, liquidity and covenant bridge. Days sixty-one to one hundred run in parallel, test actions, train users and obtain approval for production use.
The timetable should adapt to data and financing urgency. A company facing near-term liquidity should prioritise cash and debt schedules before advanced revenue modelling. Calendar completion should not override control evidence.
At Day One Hundred, the organisation should know which decisions improved, which risks remain, what capability is sustainable and which expansion is funded.
38. Maintain an FP&A evidence room
The evidence room should contain definitions, sources, reconciliations, model versions, assumptions, overlays, scenarios, approvals, action records, outcomes and change history. Access and retention should reflect sensitivity and legal obligations.
Evidence should link across the chain. A revenue driver links to source and owner. A scenario links to the driver change. A financing action links to the scenario threshold. Realised cash links back to the action. This structure supports audit, lender diligence and board review.
Automation can reconcile artefacts and identify missing links. Accountable specialists retain interpretation and approval.
39. Conclude with controlled foresight
AI-enabled FP&A can move finance from static budgeting toward continuous, evidence-led financing decisions. The value arises from connecting operating signals to cash, covenant, funding and capital action with sufficient lead time. Faster model output is useful when the organisation can understand, challenge and act on it.
The operating sequence is clear: catalogue decisions, map drivers, control data, select methods, freeze a baseline, build coherent scenarios, bridge to liquidity and covenants, assign actions, approve and learn. Every material output should preserve lineage, uncertainty, ownership and authority.
Boards should demand both analytical capability and operating discipline. A decision system should show what changed, why it matters, which action is available, when it must begin and how success will be verified. This creates controlled foresight without delegating accountability to a model.
References
- National Institute of Standards and Technology, Artificial Intelligence Risk Management Framework (AI RMF 1.0), 2023. https://nvlpubs.nist.gov/nistpubs/ai/NIST.AI.100-1.pdf
- National Institute of Standards and Technology, AI RMF Core. https://airc.nist.gov/airmf-resources/airmf/5-sec-core/
- National Institute of Standards and Technology, AI RMF Playbook. https://airc.nist.gov/airmf-resources/playbook/
- Central Bank of the UAE, Guidance Note on Consumer Protection and Responsible Adoption and Use of Artificial Intelligence and Machine Learning, 2026. https://rulebook.centralbank.ae/en/rulebook/guidance-note-consumer-protection-and-responsible-adoption-and-use-artificial-intelligence
- Dubai Financial Services Authority, AI Survey 2025: Generative AI Adoption and Governance in the DIFC, 2025. https://www.dfsa.ae/news/new-dfsa-ai-survey-generative-ai-adoption-has-nearly-tripled-within-difc-last-12-months-governance-continues-develop
- Financial Stability Board, The Financial Stability Implications of Artificial Intelligence, 2024. https://www.fsb.org/2024/11/the-financial-stability-implications-of-artificial-intelligence/
- Financial Stability Board and OECD, Roundtable on Artificial Intelligence in Finance: Summary of Key Findings, 2024. https://www.fsb.org/2024/09/oecd-fsb-roundtable-on-artificial-intelligence-ai-in-finance-summary-of-key-findings/
- IFRS Foundation, IAS 1 Presentation of Financial Statements. https://www.ifrs.org/issued-standards/list-of-standards/ias-1-presentation-of-financial-statements/
- IFRS Foundation, IAS 7 Statement of Cash Flows. https://www.ifrs.org/issued-standards/list-of-standards/ias-7-statement-of-cash-flows.html/
- IFRS Foundation, IFRS Practice Statement 1 Management Commentary, revised 2025. https://www.ifrs.org/issued-standards/list-of-standards/management-commentary-practice-statement-1/
- IFRS Foundation, IFRS 7 Financial Instruments: Disclosures. https://www.ifrs.org/issued-standards/list-of-standards/ifrs-7-financial-instruments-disclosures/
- IFRS Foundation, IFRS 9 Financial Instruments. https://www.ifrs.org/issued-standards/list-of-standards/ifrs-9-financial-instruments/
- International Organization for Standardization, ISO/IEC 42001 Artificial Intelligence Management System. https://www.iso.org/standard/81230.html
- International Organization for Standardization, ISO/IEC 23894 Artificial Intelligence Risk Management. https://www.iso.org/standard/77304.html
- International Organization for Standardization, ISO 31000 Risk Management. https://www.iso.org/iso-31000-risk-management.html
- OECD, OECD AI Principles. https://oecd.ai/en/ai-principles
- Bank for International Settlements, Financial Stability Institute, Regulating AI in the Financial Sector, 2024. https://www.bis.org/fsi/fsipapers24.htm
- Bank of England, Supervisory Statement SS1/23 Model Risk Management Principles for Banks. https://www.bankofengland.co.uk/prudential-regulation/publication/2023/may/model-risk-management-principles-for-banks-supervisory-statement
- UK Financial Reporting Council, Guidance on the Going Concern Basis of Accounting and Related Reporting. https://www.frc.org.uk/library/standards-codes-policy/accounting-and-reporting/guidance-on-the-going-concern-basis-of-accounting-and-related-reporting/
- European Banking Authority, Report on Big Data and Advanced Analytics, 2020. https://www.eba.europa.eu/publications-and-media/press-releases/eba-report-identifies-key-challenges-roll-out-big-data-and
- Committee of Sponsoring Organizations of the Treadway Commission, Enterprise Risk Management Framework. https://www.coso.org/enterprise-risk-management
- European Union Agency for Cybersecurity, Multilayer Framework for Good Cybersecurity Practices for AI, 2023. https://www.enisa.europa.eu/publications/multilayer-framework-for-good-cybersecurity-practices-for-ai
- UK National Cyber Security Centre, Guidelines for Secure AI System Development, 2023. https://www.ncsc.gov.uk/collection/guidelines-secure-ai-system-development
- US Federal Reserve and Office of the Comptroller of the Currency, Supervisory Guidance on Model Risk Management SR 11-7 and OCC 2011-12. https://www.federalreserve.gov/supervisionreg/srletters/sr1107.htm
- International Monetary Fund, Global Financial Stability Report, April 2024. https://www.imf.org/en/Publications/GFSR/Issues/2024/04/16/global-financial-stability-report-april-2024
