

1. Define the platform by the economic job it performs
An agribusiness platform should be defined by its economic job rather than by a broad technology or marketplace label. A company may aggregate produce, distribute inputs, finance inventory, operate warehouses, arrange quality testing, connect farmers with buyers, process commodities, manage logistics or combine several roles. Each role creates a different working-capital profile, margin source and risk perimeter. The investor should identify which services are principal, which are ancillary and which exist mainly to support another revenue stream.
The operating map should identify the seller, buyer, payer, inventory owner, credit provider, warehouse operator, quality assessor, transporter and loss bearer for every material transaction type. A platform that records gross merchandise value without taking title differs fundamentally from a principal trader. A commission marketplace differs from a company that guarantees payment, finances dealers or buys inventory before finding a buyer. Similar reported revenue growth can therefore represent very different capital intensity and downside exposure.
The investment thesis should state the causal mechanism of value creation. Examples include reducing farmer search costs, improving price discovery, aggregating sufficient volume for institutional buyers, lowering loss through near-farm storage, increasing input availability, shortening settlement, improving quality consistency or enabling secured finance. Each mechanism requires observable evidence. Management presentations, app registrations and transaction counts remain supporting indicators until they reconcile to repeat behaviour, realised margin and cash.
The diligence perimeter should also distinguish production risk from platform risk. Weather, pests, disease, water availability, trade restrictions and commodity prices affect customers and suppliers. The platform may absorb these risks through inventory, guarantees, fixed-price contracts or credit. The investor should trace where each external shock enters the income statement, balance sheet, cash flow and customer relationship.
Table 1. Agribusiness platform role and risk map
| Platform role | Primary earning mechanism | Principal capital exposure | Core diligence evidence |
|---|---|---|---|
| commission marketplace | transaction fee | acquisition and operating expenditure | completed trade, settlement and repeat cohorts |
| principal procurement | trading margin | inventory and price exposure | title, grade, ageing, loss and sale evidence |
| input distribution | product margin and service fee | seasonal stock and dealer receivables | sell-through, collections and return history |
| warehouse platform | storage and service fee | site, equipment and operating utilisation | occupancy, custody, loss and customer retention |
| embedded finance | interest or facilitation income | credit, fraud and funding dependence | underwriting, arrears, recoveries and funding terms |
| processing platform | conversion and product margin | plant, yield, inventory and demand | throughput, recovery, quality and contracted offtake |
Contractual allocation and actual operating practice should be reconciled for every material transaction type.
2. Build the crop-calendar and cash-cycle map
Annual accounts compress the seasonality that determines funding need. Diligence should reconstruct the business by crop, geography and channel across at least three complete operating cycles. The calendar should include sowing, input ordering, harvest, procurement, quality testing, storage, processing, sale, delivery, invoicing and collection. It should also show government procurement windows, festival demand, export seasons, monsoon exposure and relevant market closures.
For each week or month, the model should record purchase commitments, physical receipts, inventory conversion, sales orders, dispatches, receivables, payables, borrowing and unrestricted cash. The peak cash requirement can occur before reported revenue. A platform may pay farmers quickly, hold goods, sell on credit and collect after several weeks. Growth magnifies the difference between accounting profit and cash when volume expands faster than supplier terms or collection discipline.
The cash curve should separate recurring working capital from growth expenditure. Recurring working capital funds inventory and receivables that turn through an established cycle. Growth expenditure funds new districts, warehouses, technology, hiring, dealer activation and service capability before local economics mature. Combining both in one figure can cause equity to finance recoverable inventory while short-term debt funds losses or speculative expansion.
Stress cases should move several variables together. A delayed harvest can compress procurement into a shorter period. A price decline can reduce collateral value. Rain can raise moisture and quality rejection. A buyer can extend acceptance or payment. A policy change can alter export demand. The funding plan should survive a coherent adverse season rather than isolated sensitivities that overlook correlation.
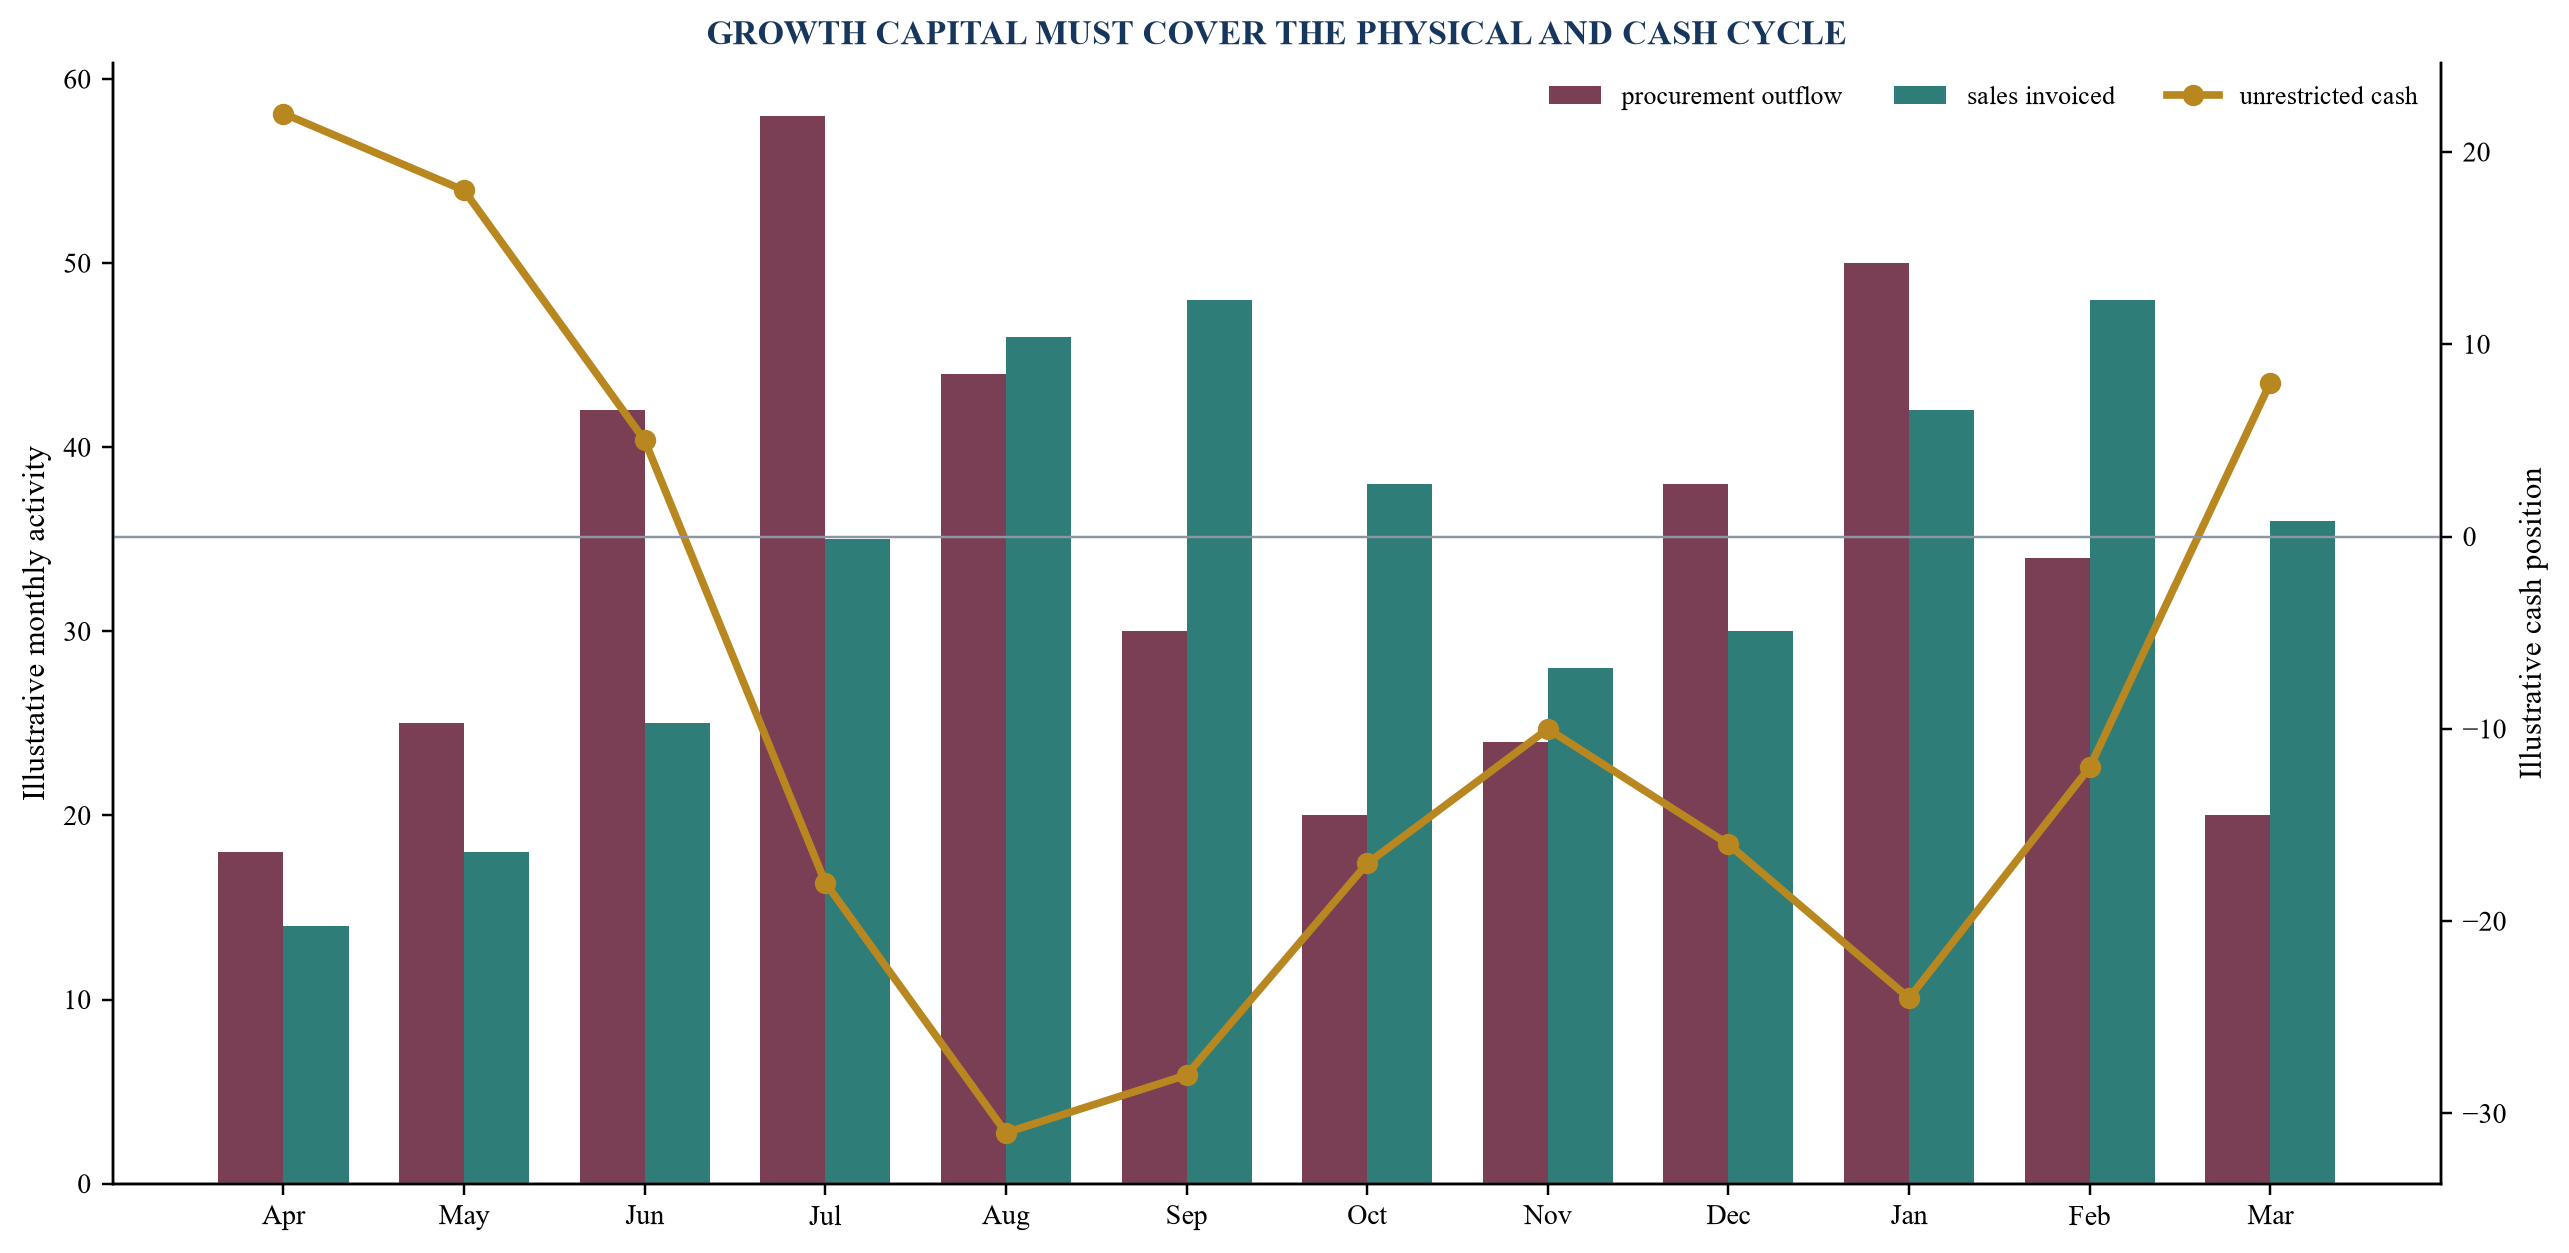
Values are hypothetical and demonstrate the timing difference between procurement, sales and collections.
3. Reconcile revenue with physical movement and settlement
Agribusiness revenue should be reconciled through a transaction spine. The spine links purchase order, supplier or farmer, lot, weighment, grade, warehouse receipt, sale order, dispatch, buyer acceptance, invoice, deduction, payment and margin. Each record should carry a stable identifier. Without that chain, an investor cannot determine whether reported growth represents completed trade, cancelled orders, gross presentation, principal exposure or cash-generating activity.
Revenue recognition deserves specific scrutiny when the platform arranges transactions among farmers, dealers, lenders, warehouses and buyers. The accounting presentation should reflect control and performance obligations under applicable standards. Diligence should compare accounting policy with contracts, operational evidence and cash settlement. Gross merchandise value, financed value, warehouse value and invoiced revenue should remain separate measures.
The reconciliation should identify exceptions. These include partial deliveries, quality downgrades, returns, quantity disputes, delayed acceptance, price renegotiation, rebates, dealer incentives, taxes, freight adjustments and credit notes. A platform can report strong gross margin before recognising claims and losses that emerge after delivery. Cohort analysis should therefore use realised contribution after transaction-specific adjustments.
The investor should test cut-off around harvest peaks and reporting dates. Purchases received without final quality approval, goods held on behalf of another party, inventory under financing arrangements and sales awaiting acceptance can distort working capital and margin. Sample testing should cover ordinary periods, peak weeks, period ends and adverse-quality events.
4. Establish inventory title, custody and saleability
Inventory value begins with legal and operational control. The investor should determine who owns each lot, who bears price and quality risk, whether title is transferable, whether any lender holds security, where the goods are located and whether they can be sold without additional consent. Physical possession alone does not prove unencumbered ownership. System records, contracts, warehouse documents, lender confirmations and third-party inspections should reconcile.
The inventory register should capture commodity, variety, grade, quantity, moisture, age, warehouse, owner, pledge, insurance, cost, current reference price, committed buyer and expected sale date. Changes in grade or quantity should create auditable events. Manual adjustments, commingling, substitution and off-system movement deserve heightened review because they can weaken both valuation and collateral control.
Saleability depends on more than quantity. A lot may be physically present but unsuitable for the target buyer, outside specification, close to expiry, exposed to infestation or uneconomic to transport. The valuation policy should incorporate grade, location, ageing, season, buyer concentration, market depth, processing requirement, logistics and disposal cost. The investor should test realised recoveries from past aged or rejected lots.
Warehouse control should be evaluated as an operating system. Registration, custody rules, weighment, sampling, quality testing, fumigation, access, surveillance, reconciliation, insurance, incident response and release authority affect loss and financeability. WDRA’s regulated warehouse and negotiable-receipt framework provides relevant institutional context, while the precise applicability depends on the facility, commodity and transaction.[11]
Table 2. Inventory evidence ledger
| Evidence field | Required control | Failure signal | Valuation consequence |
|---|---|---|---|
| title and pledge | lot-level owner and encumbrance record | duplicate claim or unclear release authority | exclude or haircut inventory |
| quantity | weighment, receipt and cycle count | unexplained shrinkage or manual override | recognise loss and control risk |
| grade and condition | independent or controlled testing | inconsistent sampling or stale certificate | reduce expected sale price |
| ageing | immutable receipt and movement dates | repeated relabelling or delayed disposal | increase markdown and carrying cost |
| insurance | covered commodity, location and peril | exclusions or insufficient declared value | increase downside loss |
| route to sale | named market, buyer or disposal channel | speculative price without executable buyer | apply liquidity discount |
Each evidence field should reconcile to physical inspection and transaction records where material.
5. Measure post-harvest loss as a controllable economic variable
Post-harvest loss should be measured by operation rather than as one annual percentage. The Ministry of Food Processing Industries’ 2022 study reports losses across harvesting, collection, sorting, grading, drying, packing, storage, transport, wholesale, retail and processing operations for major crops and commodities.[3] The range varies materially by commodity and stage. A platform-level model should therefore use actual lot and process evidence rather than a generic industry assumption.
The loss bridge should begin with received quantity and value. It should then identify moisture adjustment, cleaning, grading, handling loss, storage shrinkage, infestation, spoilage, transport loss, rejection, markdown and claim recovery. Some reductions are expected transformations rather than economic loss. The platform should define each category consistently and reconcile physical, accounting and commercial records.
Loss ownership affects incentives. The farmer, platform, warehouse, transporter, processor, insurer or buyer may bear different components. Contractual allocation can fail when evidence is weak or counterparties cannot pay. The investor should therefore measure gross physical loss, net financial loss and recoveries separately. Low reported platform loss may reflect transfer to farmers or dealers rather than superior operations.
Growth capital should fund controls that show a credible return. These may include near-farm storage, temperature or moisture monitoring, improved packaging, route optimisation, quality laboratories, faster settlement, better demand planning and disciplined disposal. The business case should connect capital expenditure to a baseline, operating change, measured loss reduction and retained margin.
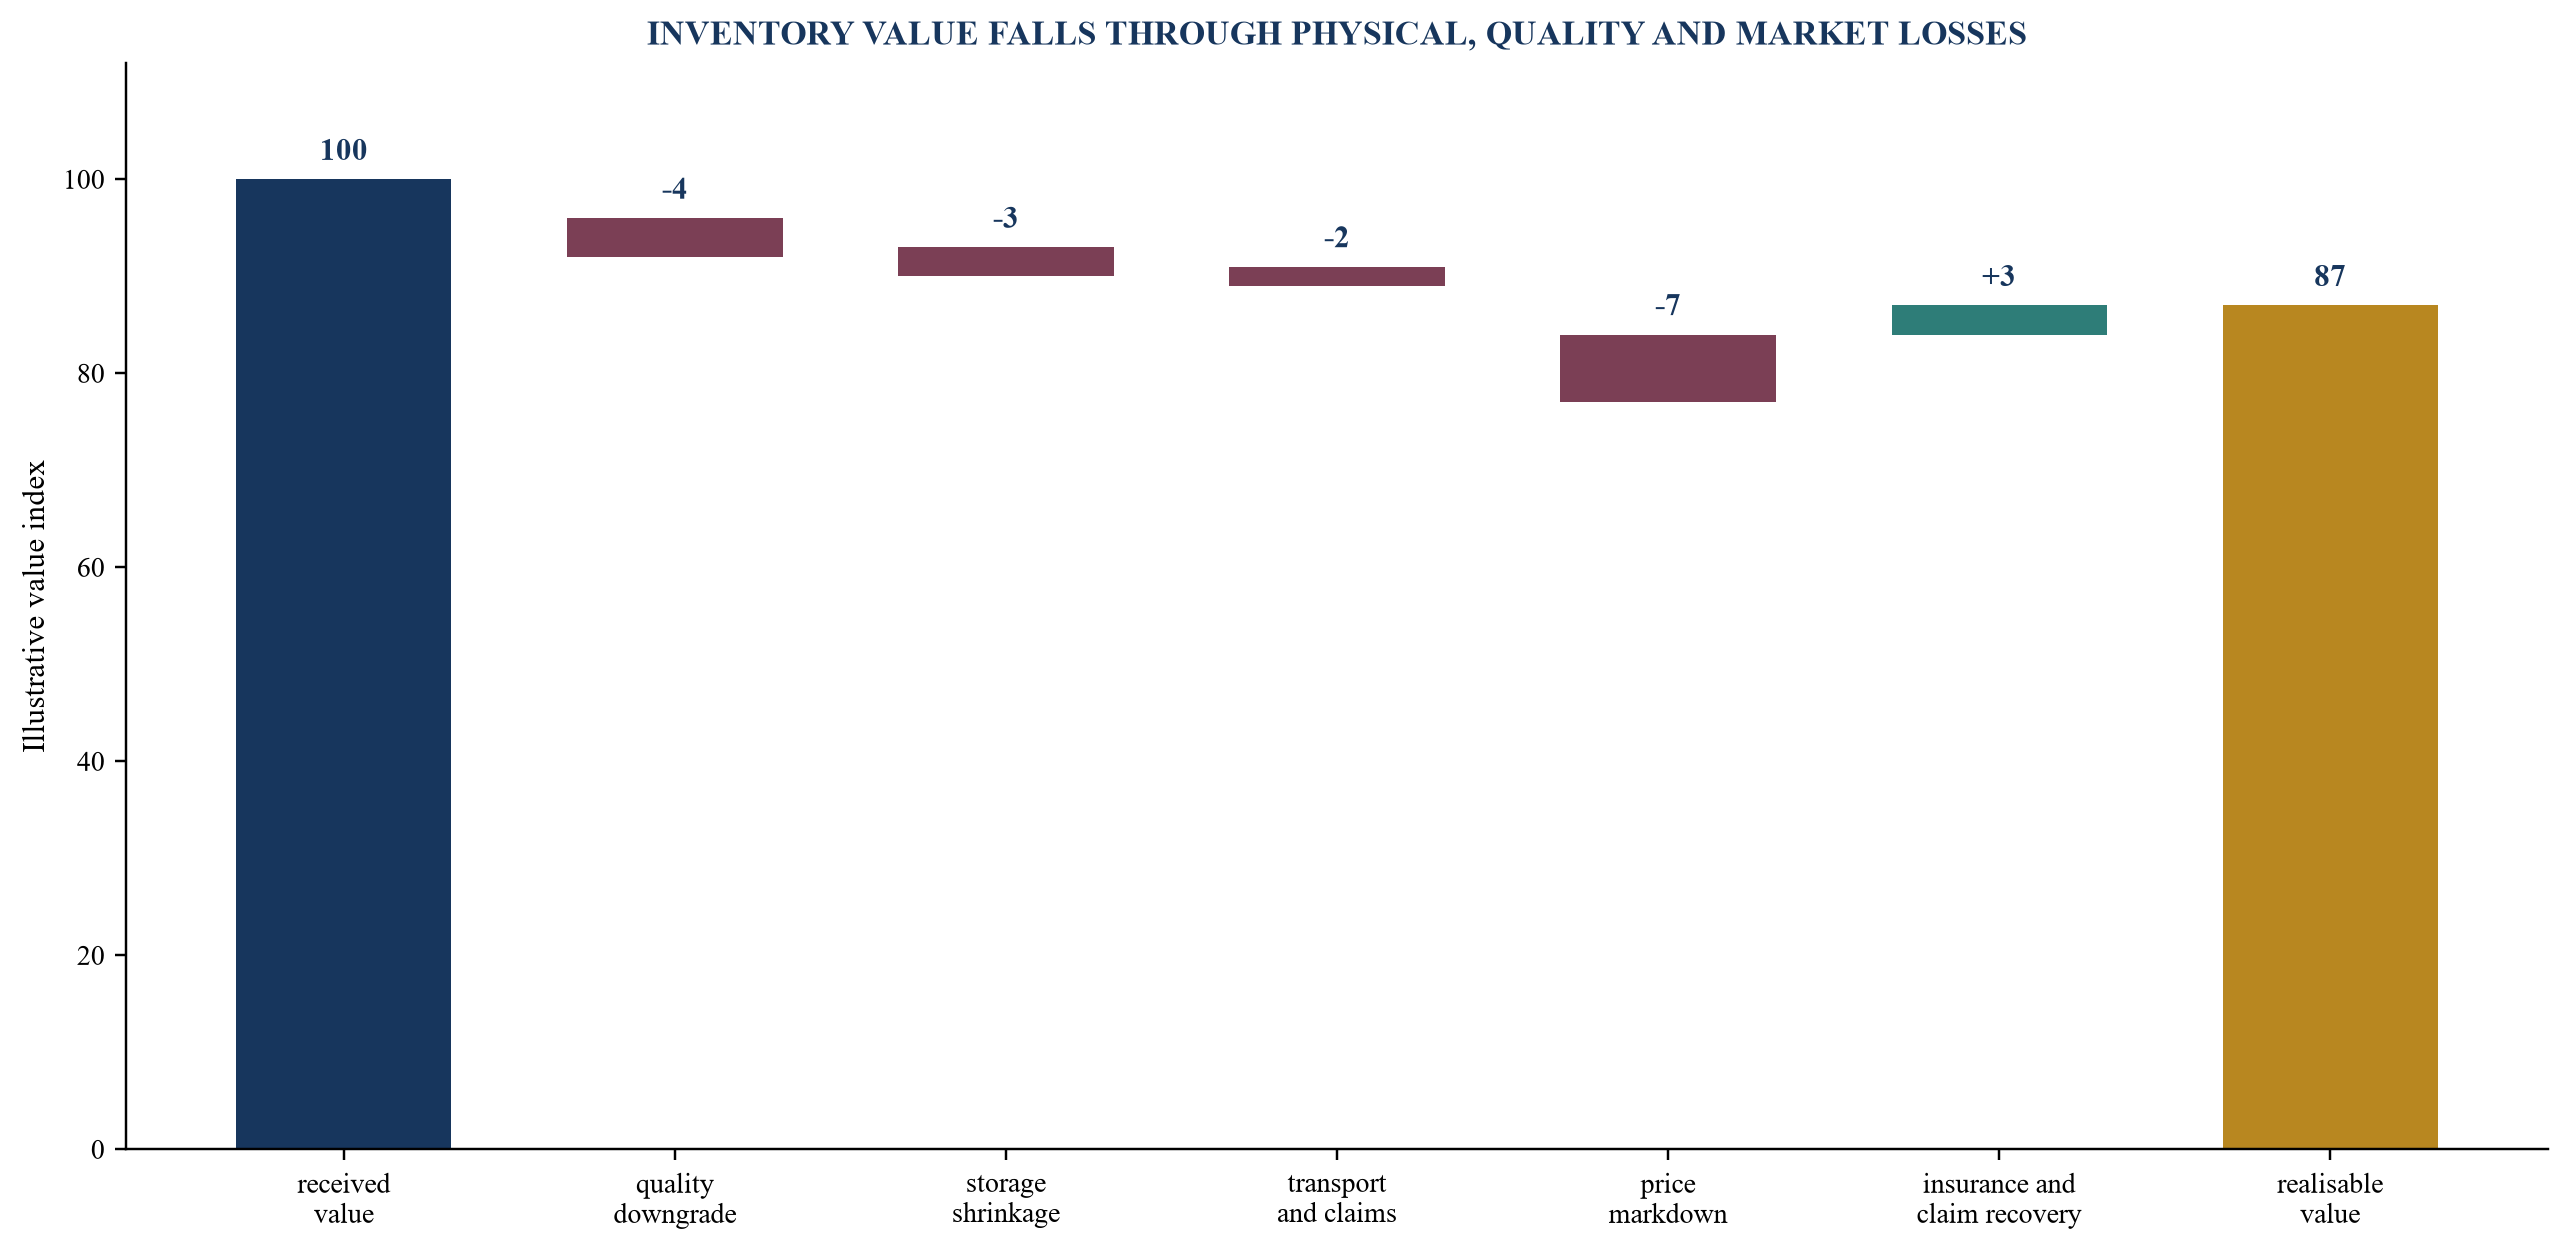
Values are hypothetical; actual loss categories and recoveries depend on the commodity, process and contracts.
6. Separate commodity exposure from operating margin
A platform may appear profitable because it benefits from commodity-price movement while holding inventory. Diligence should separate earned operating margin from price exposure. For each material crop, the investor should reconstruct purchase price, grade adjustment, carrying cost, hedge or offtake protection, logistics, processing yield, sale price and realised contribution. Inventory revaluation should remain distinct from service and execution margin.
The policy for open positions should define limits by commodity, geography, duration, counterparty and value at risk. Management should explain when the company takes deliberate price exposure, when exposure arises from operational timing and who can approve exceptions. Limits should be compared with actual positions during volatile periods. A nominally hedged position can retain basis, grade, location, volume, timing and counterparty risk.
Forward sales and minimum-price arrangements require contract testing. The investor should assess enforceability, quality and delivery conditions, termination rights, margining, settlement and counterparty capacity. A fixed selling price can protect downside while creating a loss when procurement costs rise or contracted volume cannot be sourced. The stress model should include adverse basis and delivery outcomes.
Valuation should reward repeatable service and execution economics. Earnings that depend on open commodity positions, favourable mark-to-market movements or one-off policy windows deserve separate treatment. The investment committee should understand how much profit survives when inventory is held at conservative prices and trading gains are removed.
7. Underwrite procurement quality and supplier continuity
Procurement density can create a strategic advantage when the platform earns trust, provides useful services and reliably aggregates supply. It can also be fragile. The investor should analyse farmer, FPO, trader and aggregator relationships by crop, district and season. Registration counts should be reconciled to active supply, repeat supply, volume, quality, price realisation, payment time and complaints.
Supplier concentration should be assessed at several levels. A platform may have many individual farmers while depending on a small number of FPOs, local agents, collection centres or field managers. The loss of one aggregator can affect volume across villages. The company should show how relationships are sourced, contracted, supported and transferred when personnel change.
Payment discipline matters. Faster and predictable settlement can strengthen farmer loyalty, but it increases working-capital need when buyers pay later. The investor should measure promised versus actual payment time, rejected lots, deductions, dispute resolution and repeat behaviour. Working-capital facilities should reflect the resulting cash gap without encouraging procurement that lacks demand visibility.
SFAC’s FPO programme illustrates the policy importance of producer aggregation and the institutional support available to eligible organisations.[7][8] An investee’s commercial thesis should still be tested on its own evidence. Grants, guarantees or programme participation may support capacity, while durable value depends on governance, member economics, operating capability and market access.
8. Build dealer cohorts around sell-through and collections
Input and service platforms often grow through rural dealers, retailers, agents or franchisees. Dealer count can rise while unit economics deteriorate. Diligence should construct cohorts by activation month, district, product category and acquisition channel. Each cohort should show first order, repeat order, sell-through, farmer customers, gross margin, incentives, returns, receivables, overdue balance, service activity and contribution after local support cost.
Bookings and shipments should be separated from farmer pull-through. A dealer may accept stock to earn incentives, meet a target or obtain credit. Unsold inventory can return, age or delay the next order. The platform should obtain evidence of secondary sales where feasible and reconcile digital records with field audits, dealer statements and collection behaviour.
Credit can mask weak demand. The investor should compare growth among prepaid, short-credit and extended-credit dealers. Repeat orders funded by overdue receivables do not prove product-market fit. Credit limits should reflect observed cash generation, local seasonality, collateral or guarantees, payment history and concentration rather than sales targets alone.
The dealer proposition should include economics for the channel. Margin, inventory turn, working capital, farmer footfall, service burden, returns and local competition determine retention. A platform that improves its own gross margin by compressing dealer economics may weaken distribution quality and long-term demand.
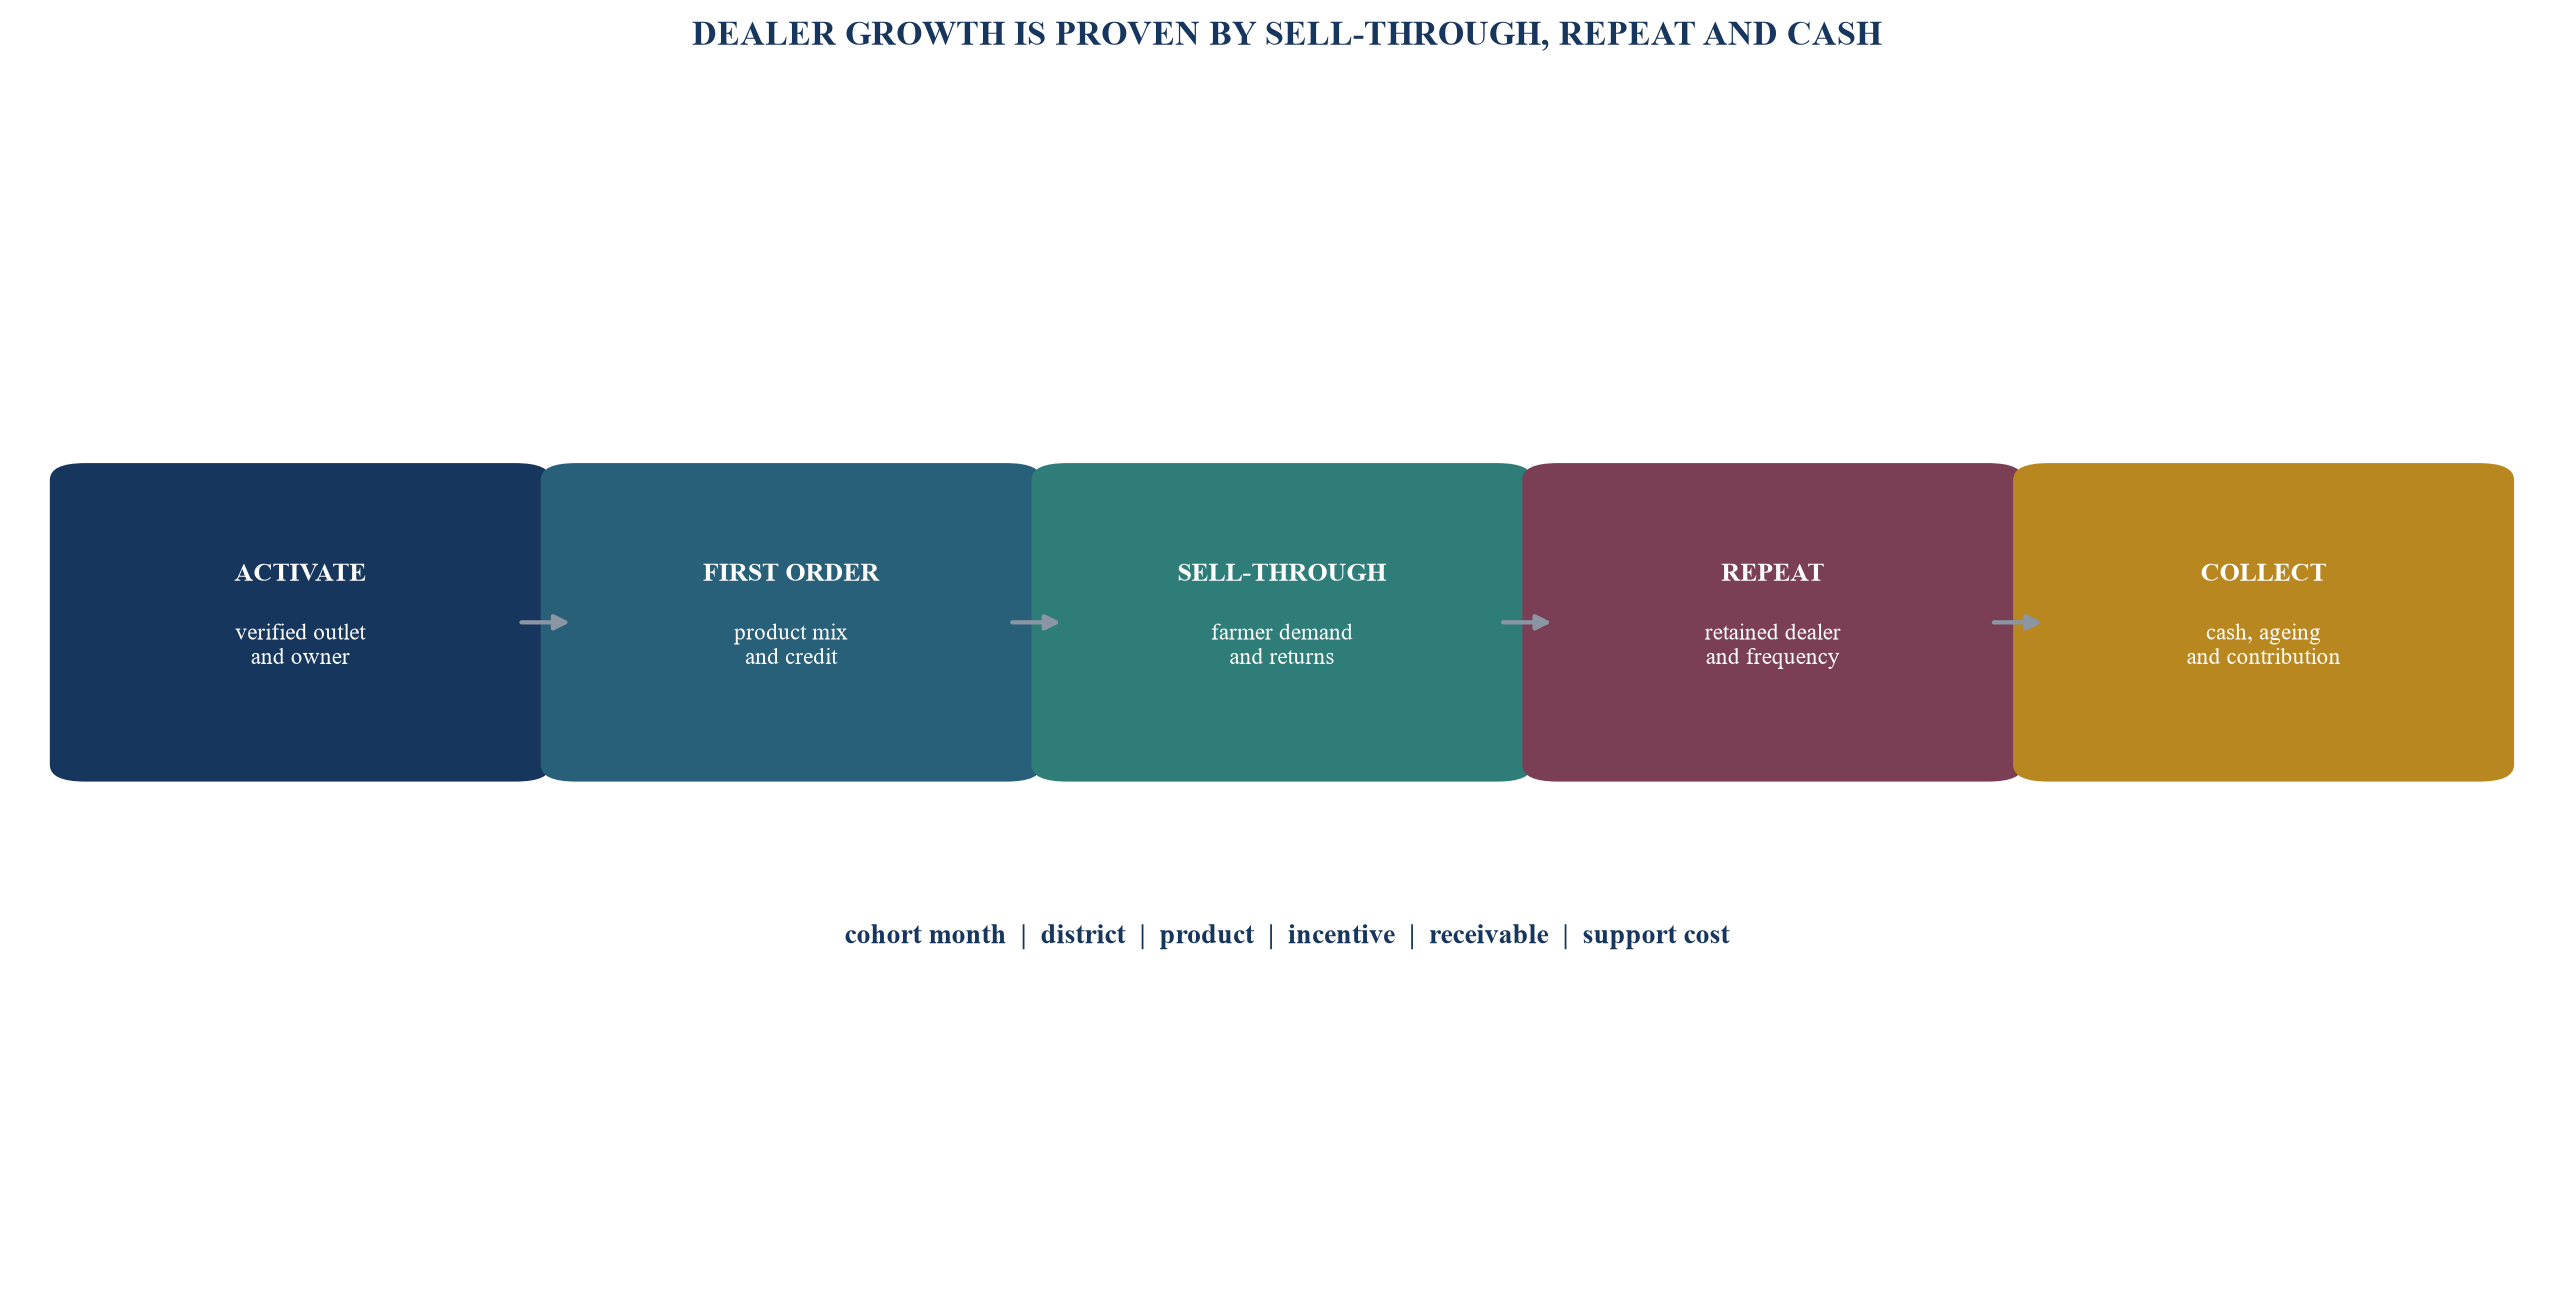
The scorecard is a diligence structure; cohort thresholds require company-specific evidence.
9. Reconstruct receivables and embedded credit
Receivables should be analysed by economic origin. Farmer advances, dealer credit, buyer invoices, warehouse finance, input loans and lending-partner exposures have different repayment sources and legal structures. The investor should map obligor, purpose, approval, documentation, disbursement, tenor, security, repayment source, ageing, modification, default and recovery for each portfolio.
Reported ageing can understate stress when due dates are extended, invoices are replaced, balances are netted against future purchases or overdue customers receive new credit. Diligence should reconstruct original contractual dates and cash receipts. Roll-rate and vintage analysis should show how balances migrate from current to overdue, cure, restructure, write-off and recovery.
Where a regulated lender funds customers, the platform may still retain risk through first-loss arrangements, guarantees, cash collateral, buybacks, service obligations, data representations or reputational pressure. The investor should read contracts and reconcile funding flows. Facilitation income should be assessed alongside retained exposure and the cost of servicing delinquent accounts.
RBI’s Priority Sector Lending Directions establish eligibility categories and conditions relevant to agriculture, infrastructure, ancillary activity and some on-lending structures.[5][6] Eligibility does not replace credit underwriting. The investee should demonstrate borrower identification, cash-flow assessment, fraud controls, end-use monitoring, collections, grievance handling and compliant data sharing.
Table 3. Credit exposure and control matrix
| Exposure | Repayment source | Leading indicator | Required control |
|---|---|---|---|
| dealer receivable | retail sell-through and collections | stock ageing and missed promise | limit, field verification and stop-supply rule |
| buyer receivable | accepted delivery and buyer cash cycle | deduction, dispute and acceptance delay | credit approval and concentration limit |
| farmer advance | contracted produce or future settlement | crop progress and delivery variance | purpose, milestone and set-off evidence |
| warehouse-backed finance | sale of controlled commodity | collateral value and coverage | custody, valuation and release control |
| partner-lender portfolio | borrower cash flow | vintage arrears and roll rate | aligned underwriting and servicing oversight |
Applicable lending, outsourcing, data, recovery and consumer-protection requirements require qualified advice.
10. Test demand through repeat behaviour and buyer quality
Demand should be established at the level where a purchase decision occurs. For inputs, this may be the farmer, dealer or FPO. For produce, it may be a processor, trader, retailer, exporter or institutional buyer. The investor should distinguish registered users, quoted orders, accepted orders, fulfilled orders, paid orders and repeat paid orders.
Repeat behaviour should be measured across complete crop cycles. A farmer may buy seed once per season, while fertiliser, crop-protection, advisory or logistics services follow different frequencies. A buyer may source only during a harvest window. Cohorts should therefore use product-appropriate recurrence rather than generic monthly retention.
Buyer quality affects cash and inventory risk. The platform should report concentration, credit terms, acceptance criteria, rejection history, deductions, disputes, order cancellation, payment performance and referenceability. A large buyer can improve volume while transferring working-capital and quality risk upstream. Customer contracts should be tested against actual operating behaviour.
Export demand requires additional evidence. APEDA reports that agricultural products contributed US$51.91 billion, or 11.86 per cent, of India’s merchandise exports in 2024-25, with more than 200 destination countries and regions.[10] An individual platform’s export case still depends on commodity, destination, sanitary and phytosanitary requirements, traceability, logistics, policy stability, foreign exchange, buyer quality and working capital.
11. Calculate rural unit economics by density and service model
National averages can conceal weak local economics. The platform should report contribution by district, cluster or service radius. Revenue and margin should be reconciled to field staff, collection centres, warehouses, vehicles, quality testing, dealer support, returns, bad debt, technology and management allocation. A new district should remain separate until repeat demand and cash conversion establish a stable pattern.
Density is a key variable. More farmers, dealers and buyers within a workable radius can improve route utilisation, field productivity, aggregation volume and service response. Density can also increase local concentration and operational complexity. The investor should measure active accounts per field employee, volume per collection point, kilometres per delivery, warehouse utilisation, service tickets and contribution per route.
The minimum viable cluster should be defined before expansion. It should specify anchor crops, target participants, expected procurement or sales, buyer access, required infrastructure, local leadership, season length and cash requirement. Expansion should pause when the cluster misses leading indicators that historically predict repeat activity and positive contribution.
The model should separate one-time launch cost from steady-state service cost. Initial training, onboarding, data capture and market development may be legitimate growth expenditure. Persistent manual reconciliation, exception handling, collections or subsidies indicate a structurally expensive model. Valuation should reflect the cost required to reproduce performance in the next group of districts.
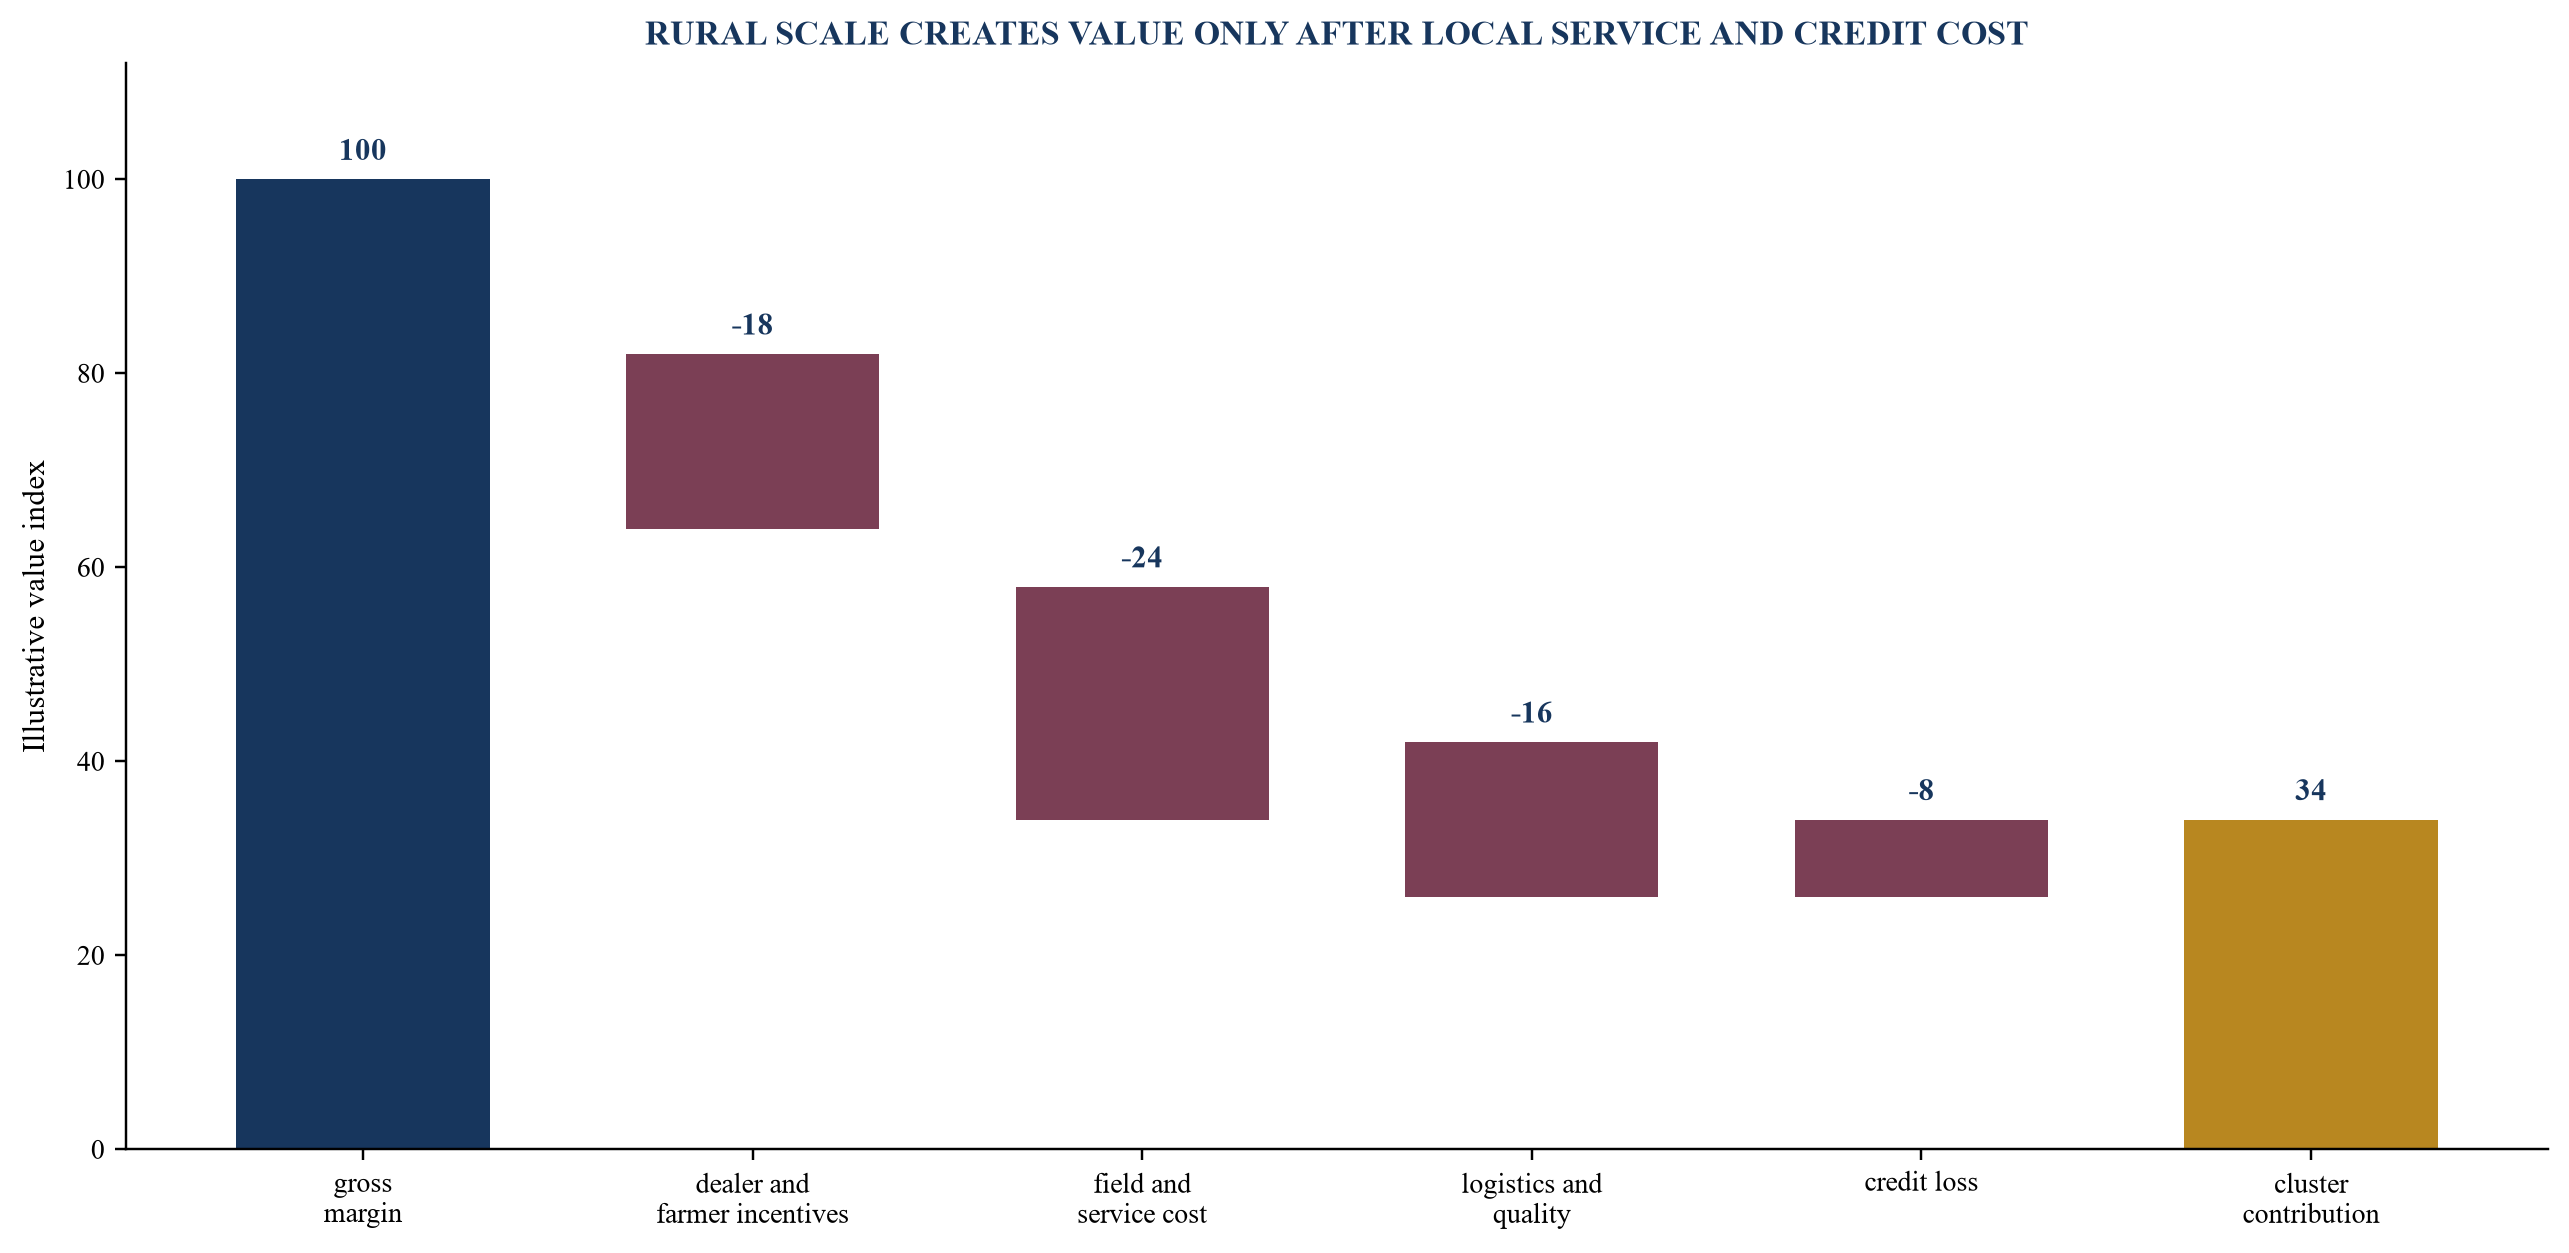
Values are hypothetical and do not represent a market benchmark or company forecast.
12. Underwrite warehouses, cold chain and logistics as operating assets
Storage and logistics affect both loss and market access. The investor should evaluate each facility or partner by location, commodity suitability, capacity, utilisation, power reliability, temperature or moisture control, quality processes, insurance, incident history, customer concentration, contract term and contribution. Capacity should be compared with seasonal throughput rather than annual averages.
Owned infrastructure can support control and margin while increasing fixed cost and capital intensity. Partnered infrastructure can improve flexibility while introducing service, custody, data and counterparty risk. The platform should explain which functions require ownership, which can be contracted and how standards are enforced across third parties.
The route model should connect origin, destination, load factor, turnaround, temperature or condition requirement, loss, delay, cost and claim. Backhaul and multi-stop optimisation may improve economics, while additional handling can raise damage or contamination risk. Reported delivery cost should include failed collection, partial load, detention, re-delivery and claims.
IFC’s warehouse-finance programme identifies controlled agricultural inventory as a basis for expanding working-capital access to producers and traders.[13] Financeability depends on credible custody, valuation, insurance and sale. The investor should test whether the company’s operating controls are strong enough to support the funding structure it assumes.
13. Evaluate technology and data as operating controls
Technology should be evaluated by the decisions and controls it improves. Useful systems can maintain lot identity, crop calendars, dealer orders, credit limits, warehouse condition, route status, quality results, farmer payments and exception queues. A digital interface without reliable underlying operations can accelerate error rather than create defensibility.
The investor should review system architecture, master data, user identity, permissions, audit logs, device conditions, offline operation, reconciliation and incident response. Rural connectivity and shared-device use can affect data quality and access control. Manual workarounds should be documented because they influence scalability, fraud exposure and staff dependence.
Data advantage should be described as a tested capability. Historical prices, agronomy, transaction behaviour, quality, logistics and repayment data may improve forecasts or underwriting. The company should demonstrate lawful collection, documented purpose, data quality, representativeness, versioning and realised performance improvement. India’s Digital Personal Data Protection Act and notified 2025 Rules create relevant obligations for digital personal data, with phased commencement specified in the Rules.[14][15]
Artificial intelligence use cases should be bounded. Demand forecasting, grading, pest detection, route optimisation, credit assessment and advisory tools require evidence appropriate to their consequence. Model outputs should be compared with a reference process, monitored by crop and region, and connected to human review and failure recovery. Marketing claims should remain separate from validated operating impact.
14. Examine management controls, fraud and related parties
Agribusiness platforms combine distributed operations, physical goods, cash, credit and local relationships. The control environment should match that complexity. The investor should review authority limits, procurement approval, price override, quality override, warehouse release, credit approval, payment master changes, write-off, related-party transactions and incident escalation.
Fraud scenarios include duplicate farmers or dealers, fictitious inventory, inflated weighment, substituted quality samples, circular trade, duplicate financing, unauthorised release, false delivery, manipulated collections and related-party pricing. The company should maintain preventive controls, detective analytics, physical verification and investigation procedures. Exceptions should have owners, ageing and closure evidence.
Related-party exposure can enter through warehouses, transporters, dealers, buyers, lenders or service vendors. Diligence should identify beneficial ownership and compare prices, credit terms, transaction volume and settlement with independent alternatives. Disclosures should reconcile board records, statutory filings, contracts, ledgers and management interviews.
Key-person risk often resides below the executive team. Regional heads, commodity traders, warehouse managers, quality leads and collection staff may hold relationships and tacit knowledge. The organisation review should assess segregation of duties, succession, incentives, whistleblowing, field audit and the transferability of operating routines.
15. Separate growth expenditure from recurring subsidy
Growth investment can legitimately fund new capacity, product development, district entry, hiring, systems and early customer acquisition. It becomes a recurring subsidy when mature cohorts require continuing discounts, free credit, manual service or below-cost logistics to retain volume. The investor should classify expenditure by cohort and maturity.
Incentives should be connected to a specific behaviour and measured after withdrawal. Dealer discounts, farmer bonuses, buyer rebates and employee targets can accelerate adoption. They can also pull demand forward, reduce price discipline or encourage low-quality transactions. Cohort analysis should show contribution before and after incentives and whether repeat behaviour persists.
Central overhead should be allocated carefully. A young cluster may appear profitable when technology, risk, finance, quality and management costs remain central. A mature cluster may absorb excessive corporate cost unrelated to its operation. The investment model should present both direct contribution and fully loaded economics, with a clear rationale for allocation.
Capital should be sized to reach a defined evidence state. A round that funds volume without resolving inventory control, collections or district economics can increase the amount at risk. The use-of-funds plan should identify which uncertainties the capital will retire and what the board will learn before the next expansion decision.
16. Design the combined equity and working-capital structure
Equity and working capital should be designed as one capital system. Equity is suited to technology, people, market development, control improvement, permanent operating capital and losses before repeatability. Revolving facilities may support eligible short-cycle inventory and receivables when borrowing-base evidence, custody and collection controls are reliable. Term debt may fund productive infrastructure with identifiable cash generation.
The funding model should prevent structural mismatch. Short-term borrowing should not fund persistent operating losses, speculative stock or slow infrastructure build. Equity should not remain trapped in financeable inventory if a well-controlled facility can recycle cash safely. The capital stack should preserve sufficient liquidity for adverse seasons and facility ineligibility.
A borrowing base can apply eligibility rules for commodity, grade, age, warehouse, insurance, title, buyer, receivable status and concentration. Advance rates should reflect liquidation value and control strength. Reserves can address price volatility, shrinkage, claims, deductions and slow collections. The platform should be able to produce the certificate from source systems and reconcile it to the general ledger.
Covenants should monitor the causal risks. Examples include minimum liquidity, inventory ageing, collateral coverage, receivable ageing, buyer concentration, credit losses, warehouse incidents and permitted open positions. Growth targets alone can pressure management to add low-quality volume. Cure rights, cash dominion and funding stops should be designed with legal and operating advice.
Table 4. Capital instrument and eligible use
| Capital instrument | Suitable use | Evidence gate | Principal misuse to avoid |
|---|---|---|---|
| growth equity | product, controls, team and district launch | approved plan and milestone budget | financing uncontrolled trade volume |
| revolving inventory line | eligible controlled stock | title, grade, ageing, custody and coverage | speculative or ineligible inventory |
| receivables facility | accepted invoices to approved buyers | invoice, acceptance and collection control | disputed or repeatedly extended balances |
| warehouse or equipment term loan | productive fixed assets | utilisation, serviceability and cash case | capacity without proven local demand |
| blended or catalytic capital | innovation with measurable development case | eligibility, additionality and outcomes | dependence on temporary subsidy |
Structure, security, tax and regulatory treatment require transaction-specific advice.
17. Convert expansion into evidence milestones
Expansion should follow an evidence sequence. The first gate establishes local demand, supply access, leadership and a credible buyer route. The second tests operations through one cycle. The third demonstrates repeat behaviour, loss control, collections and service quality. The fourth establishes positive or improving cluster contribution. Capital can then support wider replication.
Milestones should be leading and lagging. Leading indicators include verified active dealers, contracted buyers, trained field staff, warehouse readiness, system adoption and committed supply. Lagging indicators include repeat orders, realised margin, loss, collections, contribution and customer retention. Both are needed because cash outcomes arrive after operational decisions.
The board should define pause and stop conditions before launch. These may include unplanned working-capital draw, inventory ageing, repeated quality failure, overdue concentration, staff turnover, low sell-through or weak farmer retention. A stop does not always mean abandoning the market. It can trigger a narrower product, different channel, new partner or control remediation.
Portfolio reporting should compare districts on consistent definitions while preserving crop and channel differences. Management should explain variance through operating causes rather than labels. The aim is a repeatable learning system that directs capital toward proven mechanisms and closes expansion paths that do not create value.
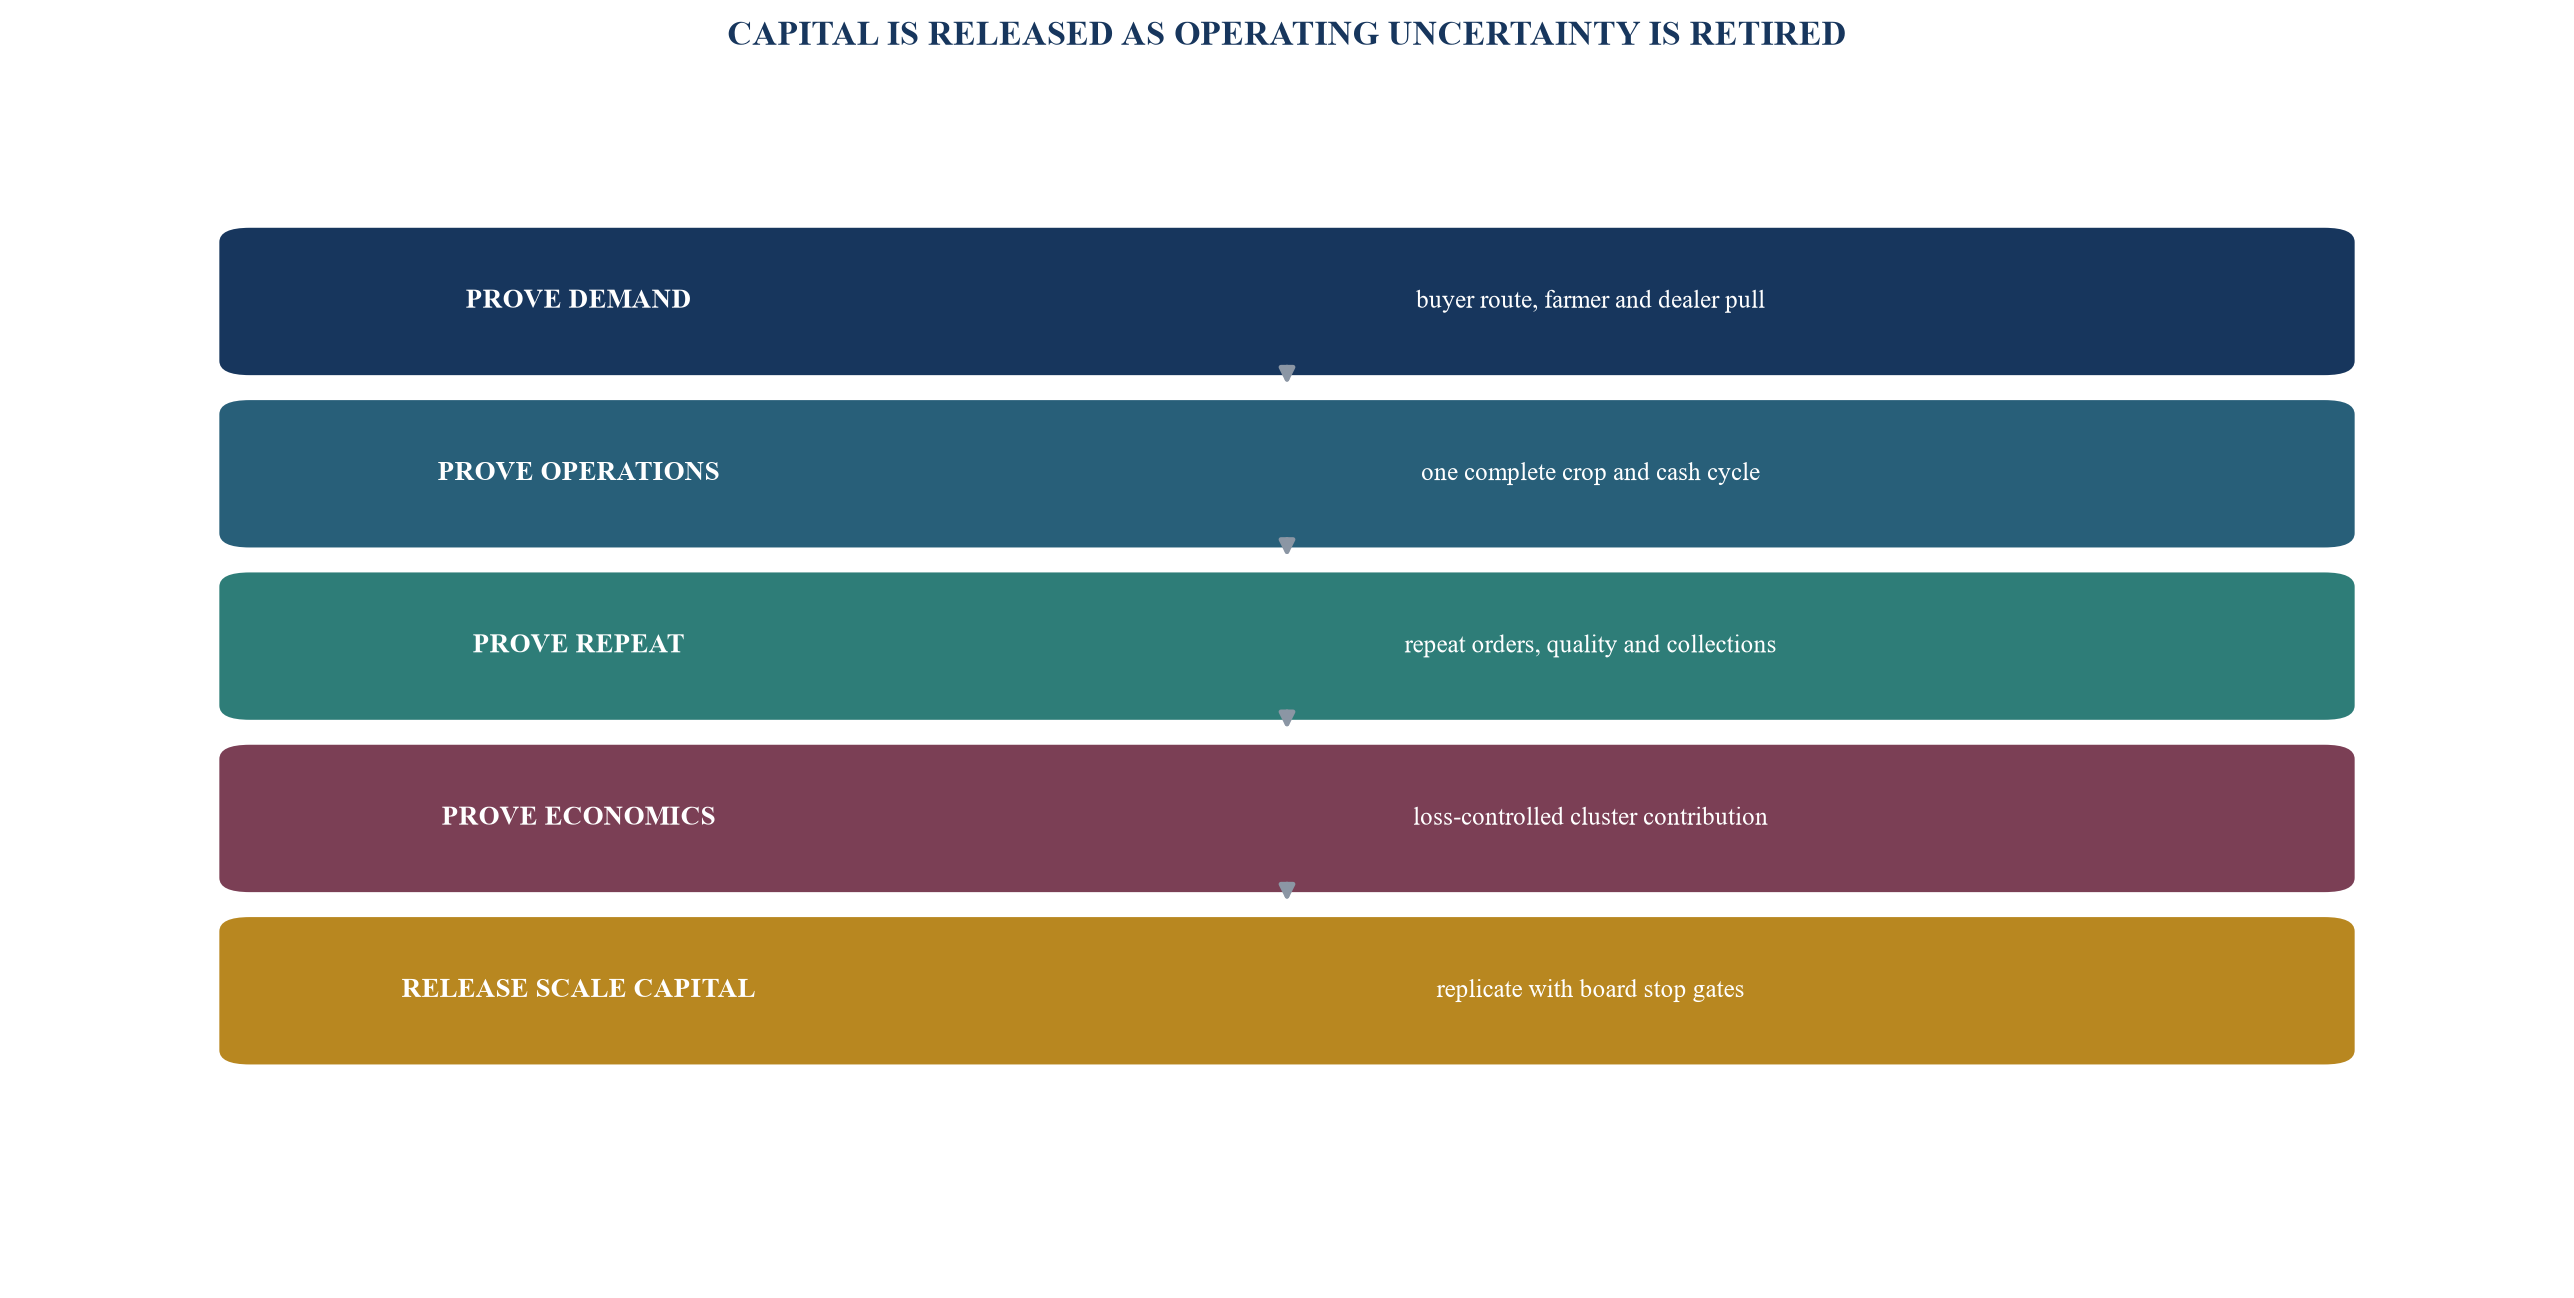
Milestones are illustrative; actual thresholds should reflect crop cycles, channel economics and risk appetite.
18. Translate diligence into valuation
Valuation should bridge reported growth to cash-generating quality. The model should separate service revenue, principal trading, financing income, processing revenue and non-recurring support. Gross margin should be adjusted for transaction losses, incentives, quality claims, logistics, warehouse cost, credit losses and realistic technology and field-service expense.
Working-capital intensity belongs in valuation. Two platforms with similar earnings can create different equity value when one converts cash quickly and the other requires increasing inventory and receivables. The investor should model peak seasonal funding, facility availability, collateral haircuts, interest, reserves and equity trapped in ineligible assets.
The scenario model should vary crop volumes, purchase and sale prices, gross spread, physical loss, dealer sell-through, collections, buyer concentration, credit loss, cluster ramp time and capital expenditure. Variables should move coherently. A weather or policy shock can affect supply, quality, price, logistics and repayment together.
Comparable-company multiples require normalisation for business model, title risk, accounting presentation, geography, commodity exposure, growth maturity, gross margin, capital intensity and governance. The investment case should identify which evidence supports a premium and which risks require a discount, structure or milestone-based consideration.
19. Convert findings into transaction protections and governance
Transaction protection should follow the evidence. Conditions to closing or funding can require inventory verification, lender consent, data and system access, related-party remediation, insurance confirmation, key contracts, control upgrades or resolution of material receivable disputes. Each condition should identify the evidence and accountable owner.
Representations should address title, encumbrances, inventory, quality, receivables, related parties, permits, contracts, data, tax, litigation, fraud and compliance. Indemnity, escrow, retention or price adjustment can address specific historical exposure. Forward-looking uncertainty is often better governed through staged capital, board controls and operating milestones.
The ownership plan should begin before signing. Initial priorities may include protecting liquidity, stabilising the seasonal funding plan, validating inventory, tightening credit limits, reconciling dealer cohorts, improving lot and cash data, retaining regional leaders and setting expansion gates. The first full crop cycle should be treated as an evidence programme.
Board reporting should combine operations and finance. A useful dashboard includes procurement commitments, inventory by grade and age, loss, open price positions, sales, accepted delivery, receivables, overdue, dealer sell-through, repeat cohorts, cluster contribution, facility headroom and unrestricted cash. Definitions and source systems should remain stable.
Table 5. Investment-committee gates and failure responses
| Gate | Required evidence | Decision owner | Failure response |
|---|---|---|---|
| seasonal liquidity | crop-level cash curve and downside headroom | finance and investment leads | resize, stage or restructure funding |
| inventory | title, custody, grade, ageing and route to sale | operations and risk leads | haircut, remediate or exclude |
| distribution | sell-through, repeat and collection cohorts | commercial and operating leads | narrow districts or revise channel |
| credit | vintage ageing, roll rates and retained exposure | credit and finance leads | tighten limits, reserve or stop |
| expansion | milestone evidence and cluster contribution | board and investment committee | pause release or redirect capital |
Decision rights and responses should reflect materiality, legal obligations and the approved investment mandate.
20. Establish rejection gates and a repeatable ownership system
Some findings should stop or narrow the investment. Examples include inability to establish inventory title, duplicate financing, unexplained physical variance, repeated relabelling of aged stock, structurally negative mature-cluster economics, dealer growth driven by overdue credit, buyer concentration without collection protection, related-party opacity, unreliable cash records or a funding plan that fails under a plausible crop-cycle delay.
Rejection gates should be explicit before management presentation. This reduces pressure to convert missing evidence into comfort. A failed gate can lead to rejection, a narrower business perimeter, a lower valuation, staged funding, a funded remediation plan or a structure that separates financeable assets from operating risk.
The diligence system should preserve a crop-calendar model, transaction spine, inventory ledger, loss bridge, dealer and farmer cohorts, credit vintages, district economics, expansion register and decision log. Each finding should include source, period, crop, geography, owner, materiality, response and closure evidence.
After investment, actual procurement timing, inventory turn, loss, collection, repeat demand, cluster ramp, cash and return on growth capital should be compared with underwriting assumptions. The feedback should show which indicators predicted value and which controls failed. Future expansion and financing decisions can then use observed evidence rather than narrative momentum.
The decision test is straightforward: can the investor reproduce how crop-cycle commitments turn into controlled inventory, repeat demand, realised margin and cash; and can the next district be funded without weakening controls or transferring hidden risk to the balance sheet? Evidence that survives this chain supports an investable growth case. Breaks in the chain identify the next diligence question or the reason to stop.
References
- Government of India, Economic Survey 2025-26, Agriculture and Food Management, https://www.indiabudget.gov.in/economicsurvey/doc/echapter.pdf
- Department of Agriculture and Farmers Welfare, Agricultural Statistics at a Glance 2024-25, https://desagri.gov.in/document-report-category/agriculture-statistics-at-a-glance/
- Ministry of Food Processing Industries, Study to Determine Post-Harvest Losses of Agri Produces in India, 2022, https://www.mofpi.gov.in/sites/default/files/phl_study_final_report_07.12.2022_2.pdf
- Ministry of Food Processing Industries, Other Reports and Infrastructure and Logistics Studies, https://www.mofpi.gov.in/documents/reports/other-reports
- Reserve Bank of India, Master Directions: Priority Sector Lending, 24 March 2025, https://rbi.org.in/Scripts/NotificationUser.aspx?Id=12799
- Reserve Bank of India, Frequently Asked Questions on Priority Sector Lending, updated 8 May 2025, https://rbi.org.in/scripts/faqview.aspx?id=87
- Small Farmers’ Agri-Business Consortium, Formation and Promotion of 10,000 Farmer Producer Organisations, https://sfacindia.com/fpos.aspx
- Small Farmers’ Agri-Business Consortium, Equity Grant and Credit Guarantee Fund Scheme, https://sfacindia.com/Equity_grant.aspx
- National Agriculture Market, e-NAM National Dashboard, https://enam.gov.in/NAMV2/dashboard/statewise.html
- Agricultural and Processed Food Products Export Development Authority, Agri Export Overview, https://farmerconnect.apeda.gov.in/Home/ExportFromIndia?PaccessID=0
- Warehousing Development and Regulatory Authority, official regulatory and electronic negotiable warehouse receipt resources, https://wdra.gov.in/
- International Finance Corporation, IFC and Arya.ag Partner to Strengthen India’s Agri Value Chains, 9 March 2025, https://www.ifc.org/en/pressroom/2026/ifc-and-technology-led-agri-platform-arya-ag-partner-to-boost-farmer-incomes-and-s
- International Finance Corporation, Global Warehouse Finance Program, https://www.ifc.org/en/what-we-do/sector-expertise/trade-and-supply-chain-finance/global-warehouse-finance-program
- Ministry of Electronics and Information Technology, Digital Personal Data Protection Act, 2023, https://www.meity.gov.in/digital-personal-data-protection-act
- Ministry of Electronics and Information Technology, Digital Personal Data Protection Rules, 2025, https://www.meity.gov.in/static/uploads/2025/11/53450e6e5dc0bfa85ebd78686cadad39.pdf
- World Bank, India: Unlocking Agribusiness for Inclusive Growth, Jobs and More, https://documents1.worldbank.org/curated/en/588891541574565351/pdf/ACS22434-WP-PUBLIC-P148921-IndiaAgribusinessforInclusiveValueChainsandJobsFINALREPORT.pdf
- World Bank, AgriConnect FAQ: Smallholder Farming, Agribusiness and Food Security, https://www.worldbank.org/ext/en/agriconnect/faq
- World Bank, From Volume to Value: Making the Most of South Asia’s Food Sector, 2026, https://blogs.worldbank.org/en/agfood/from-volume-to-value--making-the-most-of-south-asias-food-secto
- International Finance Corporation, Inclusive Agritech Facility Investments in India, 2026, https://www.ifc.org/en/insights-reports/2026/empowering-farmers-through-innovation
- Securities and Exchange Board of India, Master Circular for Alternative Investment Funds, 3 June 2026, https://www.sebi.gov.in/legal/master-circulars/jun-2026/master-circular-for-alternative-investments-funds-aifs-_101817.html
