

1. Put every proposal through one decision architecture
Capital allocation begins when scarce cash, borrowing capacity, management attention and risk capacity must be assigned among competing uses. The board may need to compare a production asset, a software platform, an acquisition, a restructuring programme and an AI deployment. Each proposal can be economically valid. The governance problem arises when each uses a different definition of benefit, risk, timing and evidence.
A common architecture does not force every proposal into identical operating detail. It requires every sponsor to answer the same board questions. What cash changes, when and through which mechanism? Which evidence supports the change? What can cause the outcome to differ? Which commitments are reversible? Which capabilities are created or consumed? Which future choices become available? Who owns delivery, control and exit?
The architecture should separate evidence, assumptions and decisions. Source documents, market data, contracts, technical studies and operating records belong in the evidence layer. Forecasts and scenarios belong in the analytical layer. Risk appetite, strategic priority and funding choices belong in the decision layer. A model can assist with the first two layers. Directors and accountable executives retain the third.
2. Define the capital-allocation perimeter
The perimeter should include every material use of capital and management capacity. It can cover maintenance and growth capex, acquisitions, joint ventures, minority investments, product development, AI and data programmes, restructuring, market entry, debt reduction and distributions. Omitting a category can create a false comparison because the excluded use still consumes cash or preserves an alternative.
Funding sources also belong inside the perimeter. Cash on hand, operating cash flow, debt, leases, supplier finance, project finance, equity and asset recycling have different costs, maturities, covenants and control consequences. A project that appears attractive without its funding pathway can be infeasible once liquidity, refinancing and covenant headroom are considered.
The board should define the legal entities, currencies, jurisdictions and time horizon covered by the allocation cycle. It should identify committed expenditure, discretionary proposals and contingent obligations. It should also reserve capacity for resilience, regulatory compliance and unforeseen events. The resulting envelope is a decision constraint, not a promise to spend.
3. Build the capital-allocation stack
The stack begins with strategy and non-negotiable obligations, then moves through evidence, economics, risk, options, portfolio constraints, governance and realised outcomes. A proposal should not advance because it has an attractive headline return while its legal right, operating dependency or funding requirement remains unresolved. Each layer creates a defined question and evidence threshold.
Strategy provides direction without replacing economics. A proposal can be strategically aligned and economically weak. Another can have positive standalone economics while distracting from scarce capabilities. The stack requires the sponsor to explain the mechanism connecting the investment to customers, cost, resilience, regulation or competitive position.
The final layer compares approved assumptions with realised cash and operating evidence. This closes the learning loop. It allows the company to improve future estimates, identify sponsor optimism, test model performance and redirect capital when milestones fail. Capital allocation therefore becomes an operating system rather than an annual ranking event.
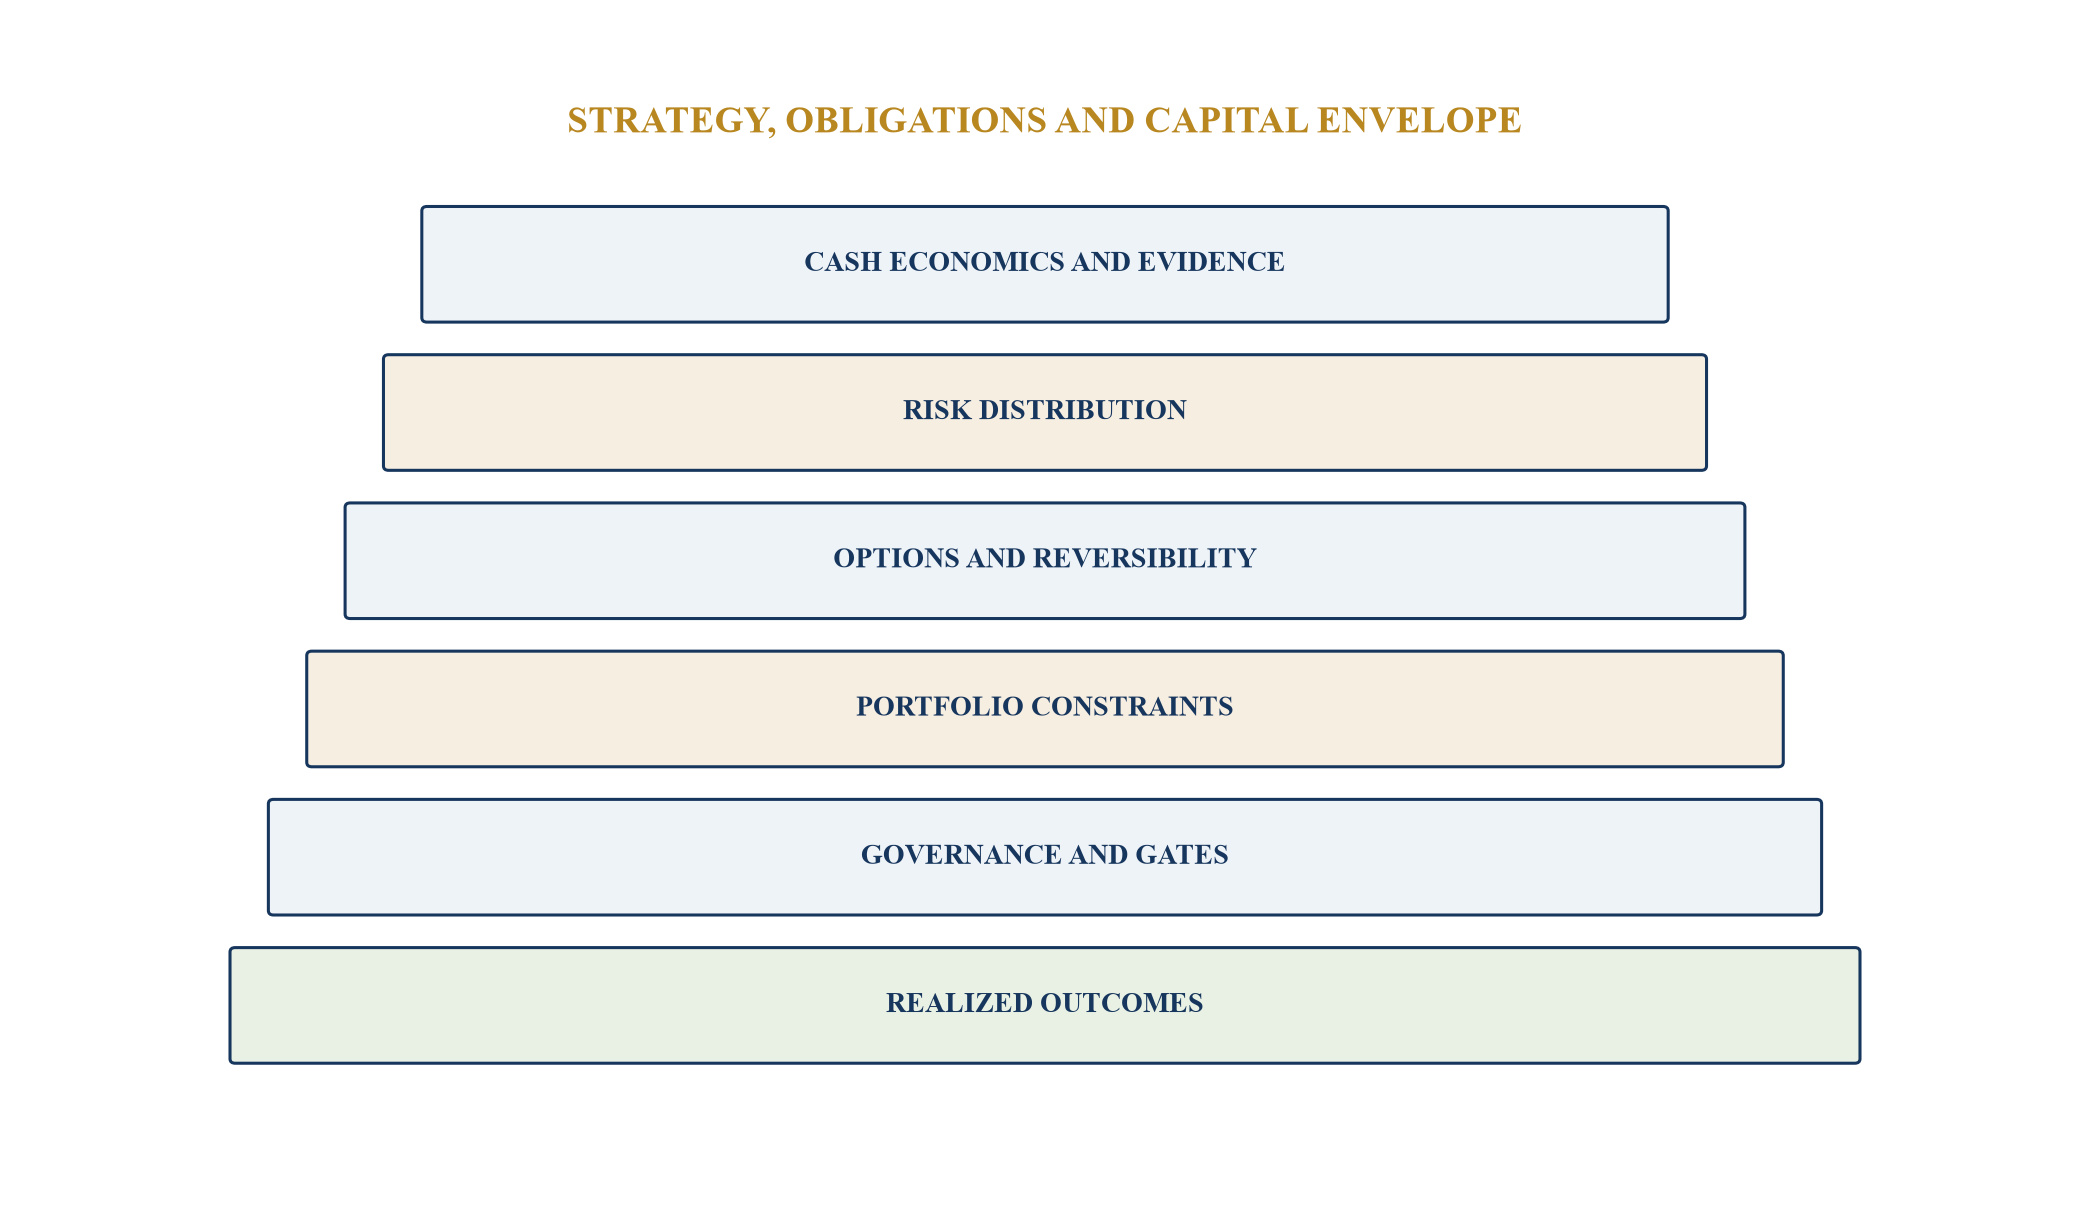
Every proposal reaches the board through the same evidence and governance layers while retaining transaction-specific diligence.
Table 1. Common proposal record
| Decision field | Common requirement | Transaction-specific extension | Board use |
|---|---|---|---|
| cash pathway | timing, amount, currency and causal driver | construction draw, purchase price, integration or adoption curve | return and liquidity |
| evidence | source, date, owner, confidence and contradiction | engineering study, diligence report, customer data or process log | claim quality |
| risk | range, trigger, mitigation and residual exposure | completion, indemnity, cyber, model or people risk | downside capacity |
| reversibility | sunk cost, exit route, abandonment cost and timing | asset resale, deal break, vendor termination or rollback | option value |
| capability | skills created, acquired, displaced or constrained | operator, target team, data rights or change capacity | execution feasibility |
| governance | sponsor, approver, gate, control and review date | investment committee, board, regulator or model owner | accountability |
The record creates comparability without removing the specialist evidence needed for each investment type.
4. Establish a controlled proposal record
Each proposal needs a stable identifier, sponsor, decision owner, business case version and evidence register. Updates should preserve history. A changed assumption should state what changed, why, who approved it and how it affects the decision. Version control prevents a business case from appearing consistently accurate after assumptions have been quietly revised.
The record should connect claims to source evidence. A projected price needs customer, contract or market support. A cost reduction needs a baseline and an operating mechanism. A synergy needs an owner, affected process, timing, implementation cost and evidence that the acquirer can deliver it. An AI productivity claim needs a defined task, eligible population, adoption pathway, quality control and cash conversion.
Contradictory evidence should remain visible. A sponsor may cite strong demand while customer interviews reveal procurement delay. A vendor benchmark may show productivity while internal data reveal limited process standardisation. Recording contradiction improves decision quality and gives the board a basis for a learning milestone rather than a false binary answer.
5. Translate every benefit into a cash pathway
The board should require an attributable pathway from operating change to cash. Revenue growth can arise from price, volume, retention, new products or capacity. Cost reduction can arise from labour, procurement, energy, defects, downtime or working capital. Risk reduction can preserve cash by lowering the probability or severity of a loss. Each pathway needs timing, dependencies and an accounting treatment.
Benefits should avoid double counting. A faster process can improve capacity, labour cost and customer response, but the model should identify which mechanism creates cash. If no headcount changes, working hours may become available without an immediate cost saving. If capacity increases, incremental demand and contribution margin determine value. If risk declines, expected-loss analysis should remain distinct from recurring EBITDA.
Cash conversion should include tax, working capital, implementation, integration, training, maintenance, financing and exit costs. The analysis should distinguish reported earnings, free cash flow and liquidity. A positive accounting result can coexist with a near-term cash deficit, while a cash release can be temporary rather than recurring.
6. Normalise the economic measures
Net present value provides a common measure of discounted incremental cash. Internal rate of return can support interpretation but can mis-rank projects with different scale, timing or reinvestment assumptions. Payback highlights exposure duration. Return on invested capital can connect projects to operating performance. No single measure captures all decision dimensions.
The model should use a consistent valuation date, currency policy, tax basis, inflation treatment and discount-rate methodology. Project-specific risk can be represented through scenarios, cash-flow adjustments or discount rates, provided the method avoids counting the same risk twice. Financing effects should be analysed consistently with the selected cash-flow definition.
Acquisitions require careful treatment of purchase price, assumed debt, fees, integration, synergies, tax, working capital and terminal value. Transformation and AI programmes require full lifecycle costs, adoption and change capacity. Capex requires construction, ramp, maintenance and residual value. Normalisation makes these differences explicit before the board compares them.
7. Use evidence quality as a decision variable
Evidence quality affects the confidence that should be placed in projected cash. The assessment can consider source authority, recency, independence, sample relevance, completeness, reproducibility and consistency. A signed customer contract generally provides stronger demand evidence than an expression of interest. A verified process baseline provides stronger cost evidence than a generic benchmark.
Evidence quality should not become a decorative score. Weak evidence can lead to a smaller initial commitment, wider outcome range, higher contingency or a requirement for further testing. Strong evidence can support faster commitment when other conditions are satisfied. The governance response therefore changes with the evidence state.
Machine assistance can index documents, extract assumptions and identify conflicting values. It should preserve source links and confidence. Material claims require accountable review because automated extraction can omit context, misread definitions or combine incompatible periods. The evidence register should record human acceptance and unresolved exceptions.
8. Construct the evidence scorecard
The scorecard should evaluate the chain from source to cash. Demand evidence asks who pays, under which terms and when. Delivery evidence asks whether the organisation can produce the change. Financial evidence asks whether the baseline, cost and conversion are controlled. Risk evidence asks whether dependencies and downside are observable. Governance evidence asks whether decisions and controls are assigned.
Scores need anchored definitions. A high demand score might require contracted or paid behaviour from representative customers. A medium score might reflect validated pilots or budgeted procurement. A low score might reflect interviews without commitment. Anchors reduce the ability of sponsors to convert narrative confidence into a high numerical score.
The board should see both the score and the evidence note. A weighted total can support triage. It should not conceal a critical failure. Regulatory permission, data rights, safety, financing, competition approval or a binding strategic constraint can remain a gate regardless of the aggregate score.
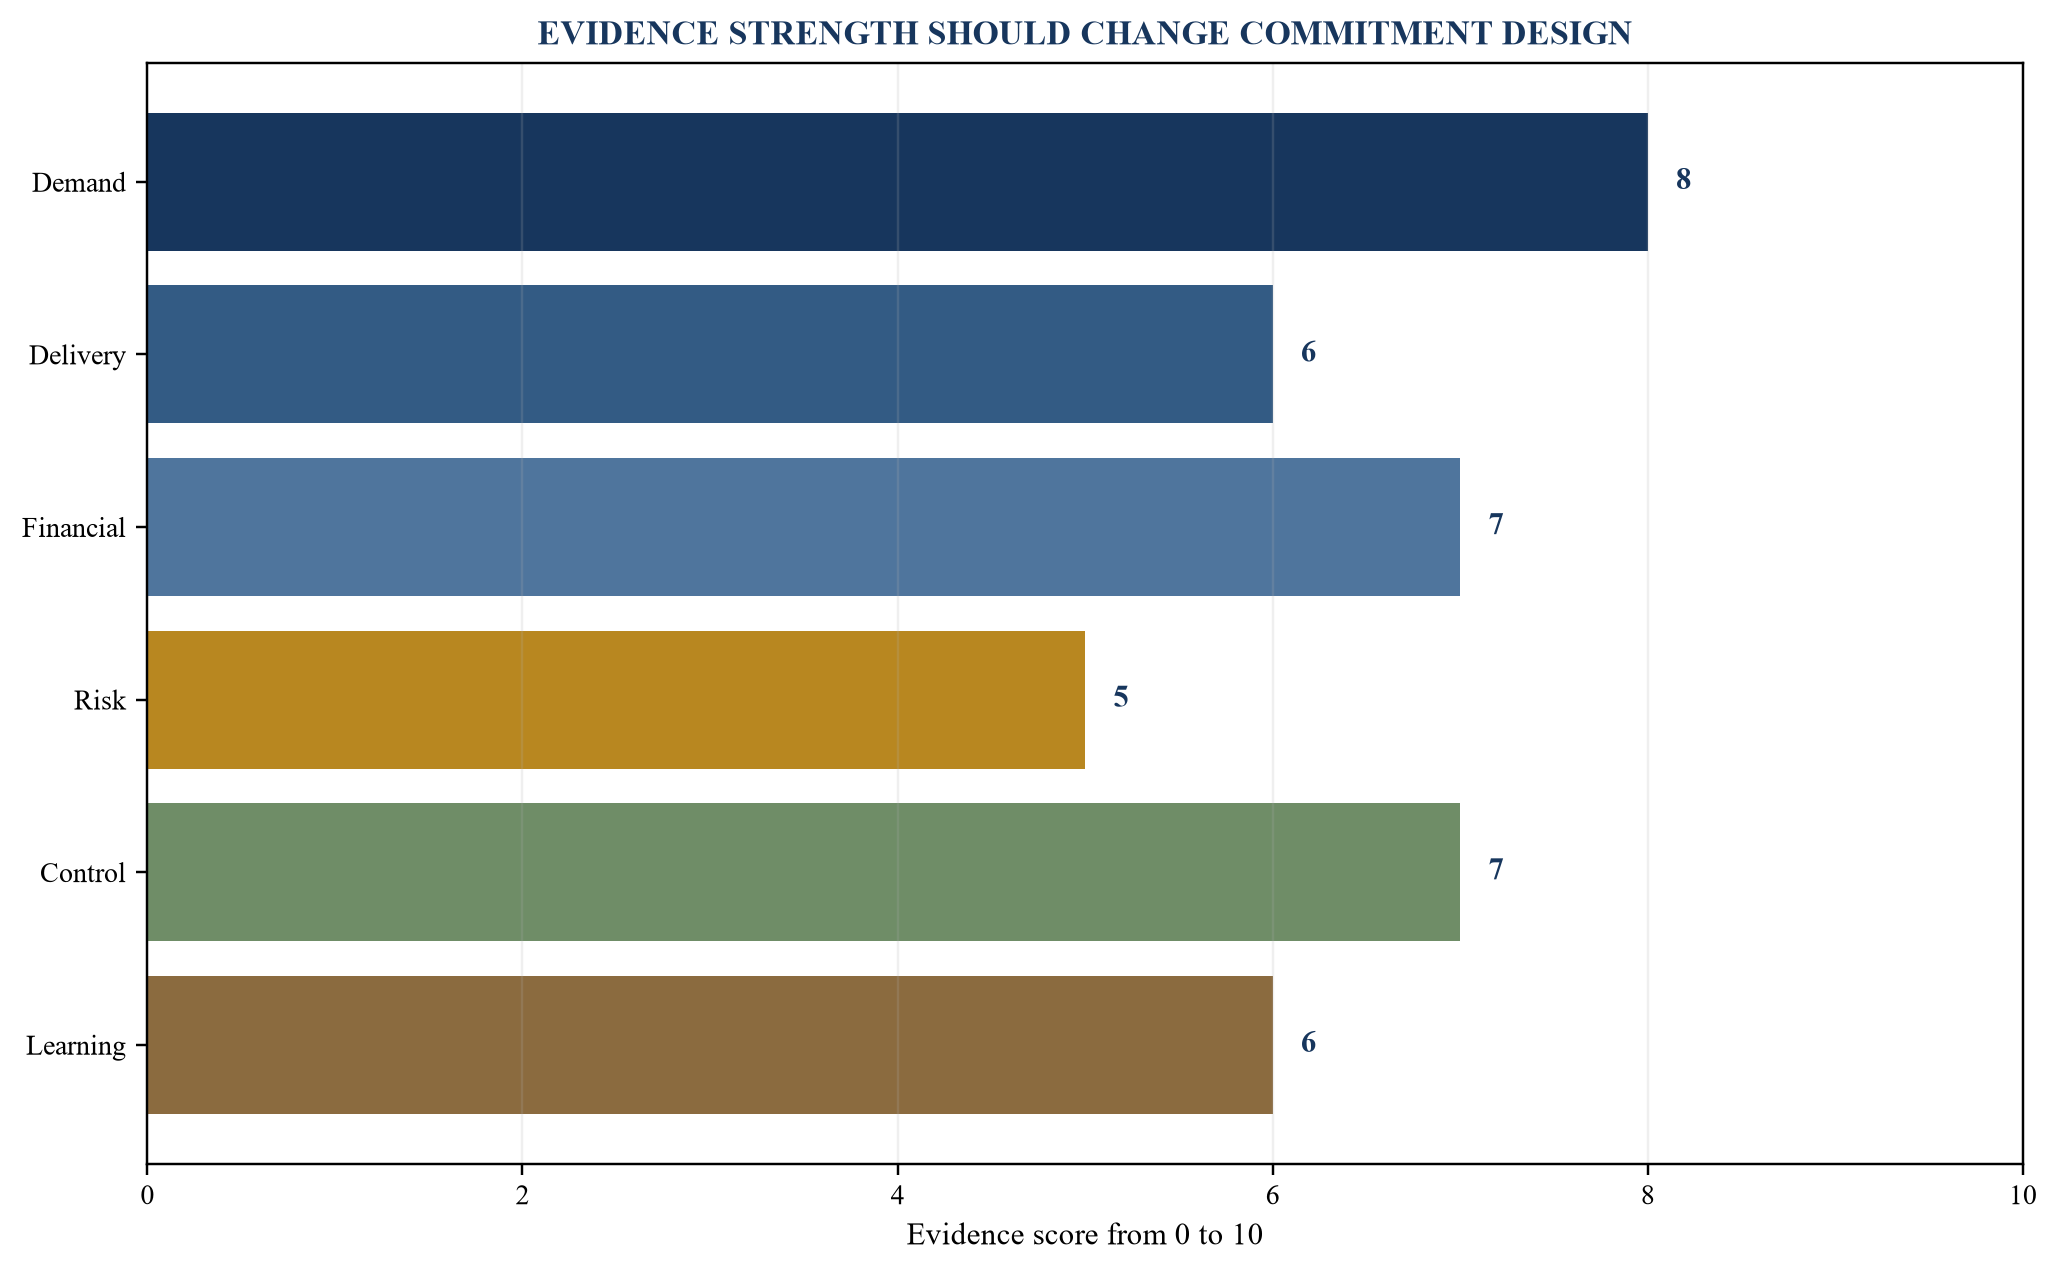
Scores are illustrative management assumptions and require anchored definitions, source links and accountable review.
Table 2. Evidence score anchors
| Dimension | Strong evidence | Weak evidence | Capital response |
|---|---|---|---|
| demand | paid use, contract or representative committed pipeline | broad market estimate or unpriced interest | validate willingness and procurement |
| delivery | proven process, named capability and realistic plan | vendor promise without internal readiness | pilot or acquire capability |
| financial | reconciled baseline and attributable cash mechanism | gross benefit without conversion | rebuild economics |
| risk | quantified distribution, triggers and tested mitigants | risk list without exposure or owner | widen downside and add gate |
| control | approved data, security, legal and operating controls | policy references without implementation | remediate before scale |
| learning | observable milestone with decision date | activity metric without decision consequence | redesign stage |
A score determines the next evidence action and commitment design; it does not replace a gate.
9. Model outcomes as distributions
A single forecast hides the range that matters to capital allocation. The proposal should present at least a base pathway, credible downside and credible upside, with the drivers that move between them. Where data allow, simulation can represent correlated uncertainties. Where data are sparse, discrete scenarios can still make assumptions visible.
The analysis should distinguish uncertainty from risk. Uncertainty reflects limited knowledge about outcomes. Risk includes identifiable events, exposures and controls. A stage gate can reduce uncertainty through learning. Insurance, contract terms, redundancy or technical controls can reduce specific risk. Neither action guarantees the result.
The board should review expected value, loss probability, maximum funding need, time under exposure and recovery pathway. A small expected gain with a severe tail can be unsuitable for a constrained company. A volatile proposal with limited initial exposure and strong learning value can be acceptable when stop conditions are credible.
10. Separate risk capacity from risk appetite
Risk appetite expresses the amount and type of risk the company is prepared to pursue. Risk capacity reflects the loss, liquidity stress, covenant pressure, operational disruption and reputational consequence the company can absorb. Capital allocation should satisfy both. An attractive expected return cannot create balance-sheet capacity.
Capacity should be measured across cash, debt, covenants, ratings, regulatory capital, customer commitments, safety and management bandwidth. Correlated projects can consume capacity together. Several AI programmes may depend on the same data platform, technical team or vendor. Several acquisitions may depend on the same integration office and financing market.
The proposal record should identify leading indicators and thresholds. A covenant buffer, construction milestone, customer adoption measure, data-quality failure or integration departure can trigger review. Limits should connect to authority: monitor, remediate, pause, reduce, sell or exit. A threshold without a decision route is only a report.
11. Value reversibility explicitly
Reversibility measures how much capital and strategic freedom can be recovered if the thesis weakens. A modular capex programme can stop between phases. A minority investment can preserve an acquisition option. A cloud pilot can end before enterprise rollout. An acquisition can be difficult to reverse after integration, customer migration and talent change.
The analysis should identify sunk cost at each decision date, termination obligations, resale or separation value, time to exit and operational disruption. Reversibility can also have a price. A cancellable contract may cost more. A staged programme may delay scale. The board should compare the cost of preserving choice with the value of learning before commitment.
Exit rights need practical evidence. A contractual termination clause has limited value if data cannot be migrated, equipment has no buyer or the organisation lacks a replacement supplier. Reversibility therefore includes legal, technical, operational and market conditions. The proposal should state who can execute the exit and how long it would take.
12. Treat learning as an investment output
Early investment can purchase information that changes a later decision. A pilot can test customer willingness, technical performance, adoption, unit economics or regulatory interpretation. Due diligence can disprove an acquisition thesis before completion. Front-end engineering can narrow capex cost and schedule ranges. The learning has value when it is timely, decision-relevant and capable of changing commitment.
A learning milestone should specify the hypothesis, evidence required, acceptance threshold, decision date and authority. Completing activities is insufficient. A pilot that generates usage without measuring quality or cash conversion may create no useful decision evidence. A diligence report that lists risks without quantifying thesis impact may not change price or terms.
Management should compare the cost of learning with the expected avoided loss or improved opportunity. The result can support a staged route even when the full programme has a positive expected value. Learning design also reduces the temptation to scale an attractive narrative before operating evidence exists.
13. Build the option-value tree
The option tree maps initial commitment, observable milestones and future choices. Each branch should state incremental cash, timing, evidence and authority. The purpose is not to assign false precision to every strategic possibility. It is to show how current design creates or removes choices.
Capex options can include expand, defer, switch input, repurpose or abandon. Acquisition options can include minority entry, commercial partnership, call right, staged consideration, integration sequence or divestment. Transformation options can include pilot, scale, change vendor, insource, narrow scope or retire. Each option depends on enforceable rights and feasible execution.
An option has limited value when management lacks cash, capability or authority to exercise it. The analysis should therefore test future funding and organisational conditions. It should also identify option decay, such as expiring exclusivity, technology obsolescence, regulatory change or competitor action.
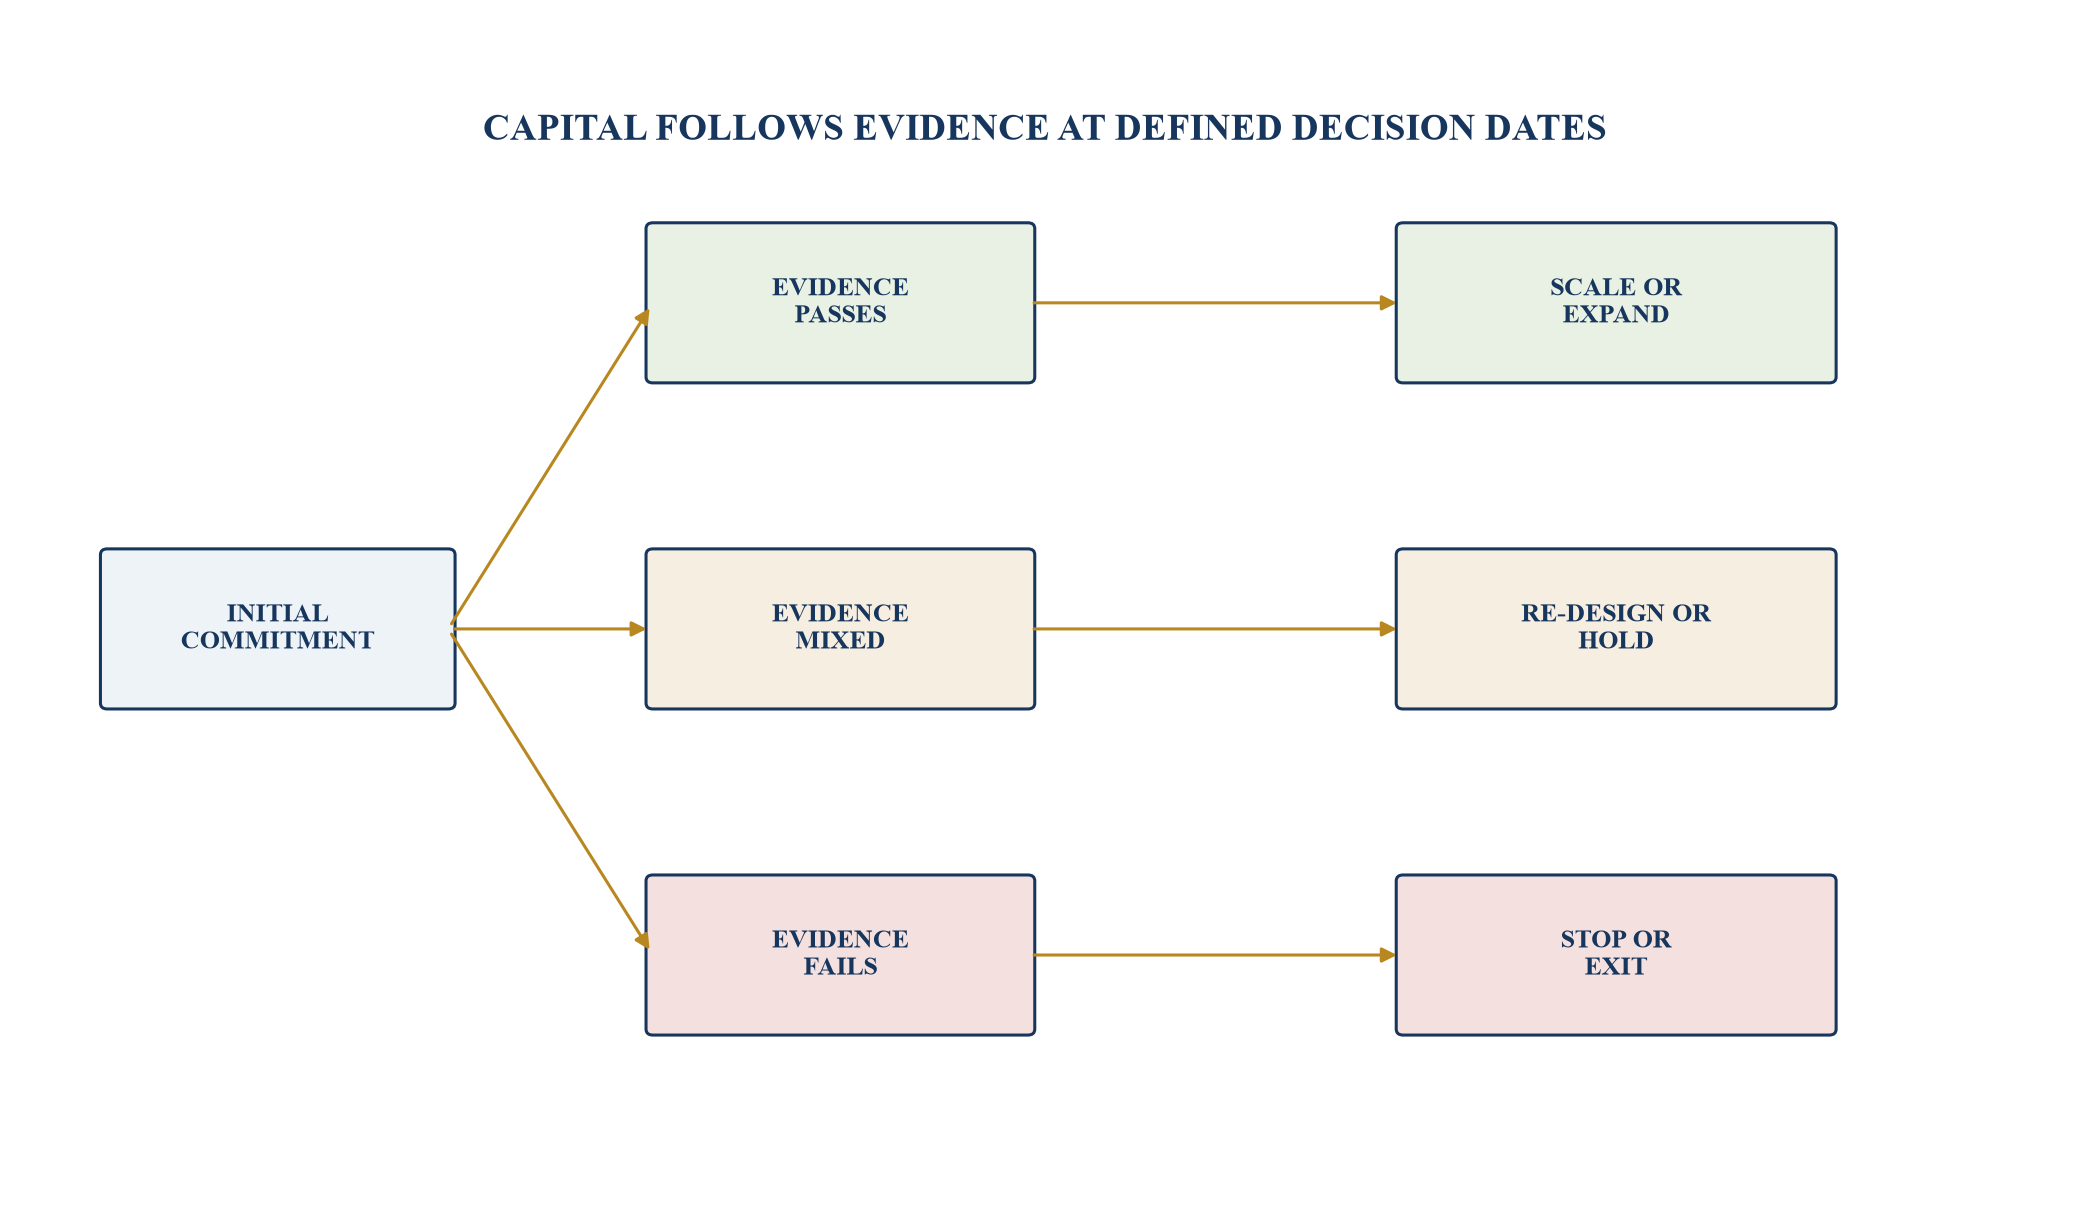
Branch values and probabilities are illustrative; an option requires observable evidence and a feasible exercise route.
14. Compare capex through completion and utilisation
Capex economics depend on more than purchase cost. The proposal should include design, permitting, site preparation, equipment, installation, commissioning, ramp, contingency, maintenance, working capital, decommissioning and residual value. Schedule delay can affect both cost and foregone cash generation.
Utilisation links physical capacity to value. A facility can meet technical performance and underperform financially when demand, throughput, yield, pricing or operating availability falls short. The business case should therefore separate construction completion, operational acceptance and commercial utilisation. Each stage needs evidence and an accountable owner.
Contract structure can allocate certain risks while retaining others. Fixed-price terms may not cover scope change, delay, counterparty failure, interface risk or force majeure. Guarantees and liquidated damages need enforceability and credit support. The board should evaluate residual exposure after contractual protection, supported by qualified review.
15. Compare acquisitions through thesis and integration
An acquisition combines the standalone business, purchase price, financing, control premium, synergies, integration cost and strategic options. The proposal should identify which value exists before ownership and which value depends on the buyer. It should also distinguish evidence obtained through diligence from assumptions dependent on future execution.
The acquisition thesis should have a limited set of value mechanisms such as customer access, capability, product, geography, cost, capacity or consolidation. Each mechanism needs an owner, baseline, timing and risk. Synergies should reconcile to operating plans and avoid double counting with the target forecast or transformation programme.
Integration capacity is a capital constraint. Leadership attention, technology migration, customer retention, talent, regulatory approvals and control remediation can determine value. A high financial return calculated before integration risk can mislead. The board should fund the integration plan and monitor thesis milestones with the same discipline as the purchase price.
Table 3. Normalising unlike investment proposals
| Field | Physical capex | Acquisition | Transformation or AI |
|---|---|---|---|
| initial commitment | design, equipment and construction | price, debt assumed, fees and closing cash | platform, data, implementation and change |
| cash mechanism | capacity, yield, cost, reliability or compliance | standalone cash, synergies and strategic access | productivity, revenue, working capital or risk |
| primary uncertainty | scope, completion, ramp and utilisation | quality of earnings, retention and integration | adoption, performance, controls and scaling |
| reversibility | phase, resale, repurpose or abandon | break, stage, divest or separate | pilot, narrow, switch, insource or retire |
| capability effect | operating and maintenance capability | acquired people, customer and technology capability | data, process, model and change capability |
| decisive evidence | engineering, contracts, permits and demand | diligence, rights, customer and integration evidence | baseline, test results, adoption and cash conversion |
Common fields support ranking; specialist diligence remains necessary for each proposal class.
16. Compare transformation through adoption and cash conversion
Transformation proposals often describe technology delivery while value depends on operating adoption. The business case should define the process, users, transaction volume, current performance, target performance and decision rights. It should identify how changed behaviour converts into revenue, cost, working capital, resilience or avoided loss.
Implementation costs include process redesign, data remediation, integration, security, testing, training, parallel operation, controls, vendor management and retirement of legacy systems. Recurring costs include licences, compute, support, monitoring and model maintenance. Omitting these costs can convert a gross productivity estimate into a misleading return.
The board should distinguish technical completion, user adoption, operating performance and realised cash. Each needs a different owner and measure. A system can be delivered on time while adoption remains low. Adoption can be high while quality failures create rework. Operating improvement can occur without cash conversion when capacity is not redeployed or demand is absent.
17. Give AI proposals an explicit value and risk model
AI programmes can support prediction, classification, generation, optimisation and decision assistance. The value mechanism should be specific to the task. A forecast model can improve inventory or staffing decisions. A document model can reduce review time while requiring quality controls. An optimisation model can change price, routing or capital deployment. Generic intelligence is not a cash pathway.
NIST's AI Risk Management Framework organises activity through govern, map, measure and manage functions. A capital-allocation process can use this structure to connect use-case context, measurement, controls and ongoing oversight. The framework is voluntary and should be adapted to the organisation's legal, regulatory and operating obligations.
AI economics need model performance, data, human review, exception handling, security, privacy, third-party and change costs. Benefits should be tested against a credible baseline. The board should also identify model decay, supplier dependency and the possibility that lower technology cost changes competitive behaviour or asset value.
18. Require a controlled baseline
Every benefit estimate depends on a baseline. The baseline should state period, population, accounting boundary, data source and adjustments. It should reflect what would happen without the proposal, including committed improvements, market change and normal replacement. Comparing a new programme with a frozen historical process can overstate value.
Acquisitions require a standalone plan that is not inflated by buyer action. Capex requires maintenance and replacement assumptions. Transformation requires current process performance, quality and workload. AI requires task-level time, error, rework and outcome data. Where the baseline is weak, the company can invest in measurement before scale.
Baseline changes should be controlled after approval. External conditions can legitimately change prices, volumes and costs. The performance review should preserve the original decision case, a current forecast and realised results. This makes attribution more credible and reveals whether the proposal, market or baseline caused the variance.
19. Price capability constraints
Capital does not execute itself. Engineering, integration, data, commercial, finance, risk, legal, technology and change capabilities can constrain the number and timing of initiatives. The portfolio should identify named critical roles, workload, succession and external dependencies. A funding surplus cannot compensate for unavailable decision capacity.
Capability can also be an investment outcome. An acquisition may buy a team and customer knowledge. A transformation may create reusable data and process infrastructure. A capex programme may develop operating expertise. The proposal should distinguish transferable capability from expertise tied to a vendor, founder or temporary adviser.
The model can assign capacity units to scarce roles and test the portfolio against them. The units are management assumptions and should be calibrated through delivery evidence. Overloaded functions create schedule risk, weak controls and hidden opportunity cost. Portfolio sequencing can be more valuable than approving every positive-NPV proposal at once.
20. Capture dependencies and correlated exposure
Projects can depend on the same grid connection, data platform, vendor, regulatory approval, customer segment, financing market or leadership team. Evaluating them independently understates concentration. The common evidence base should maintain a dependency register and show which proposals fail or delay together.
Dependencies can also create positive platform effects. A controlled data foundation can reduce the cost of several AI use cases. A distribution acquisition can improve the economics of new products. A site investment can enable later expansion. These benefits should be attributed carefully to avoid claiming the same platform value in multiple proposals.
Scenario analysis should stress common drivers such as interest rates, energy prices, demand, currency, supply, regulation and technology performance. The board should see aggregate cash and capacity under the same scenario. This converts individual business cases into a portfolio view.
21. Create the risk-adjusted return map
The return map can plot expected economic value against downside exposure, with bubble size representing capital and colour representing evidence quality or reversibility. It gives the board a visual comparison of unlike proposals. It does not determine approval because strategic obligations, gates and dependencies remain relevant.
Expected value should be based on controlled scenarios. Downside can measure a selected tail outcome, maximum funding need or loss at an agreed confidence level, depending on the proposal and available data. The definitions should remain consistent across the cycle. Changing the downside metric for one sponsor destroys comparability.
The map can identify high-value, controlled proposals; high-value, high-downside proposals needing structure; low-value proposals that should be redesigned; and obligation-led proposals that require cost-effective compliance. The next action should be visible for every quadrant.
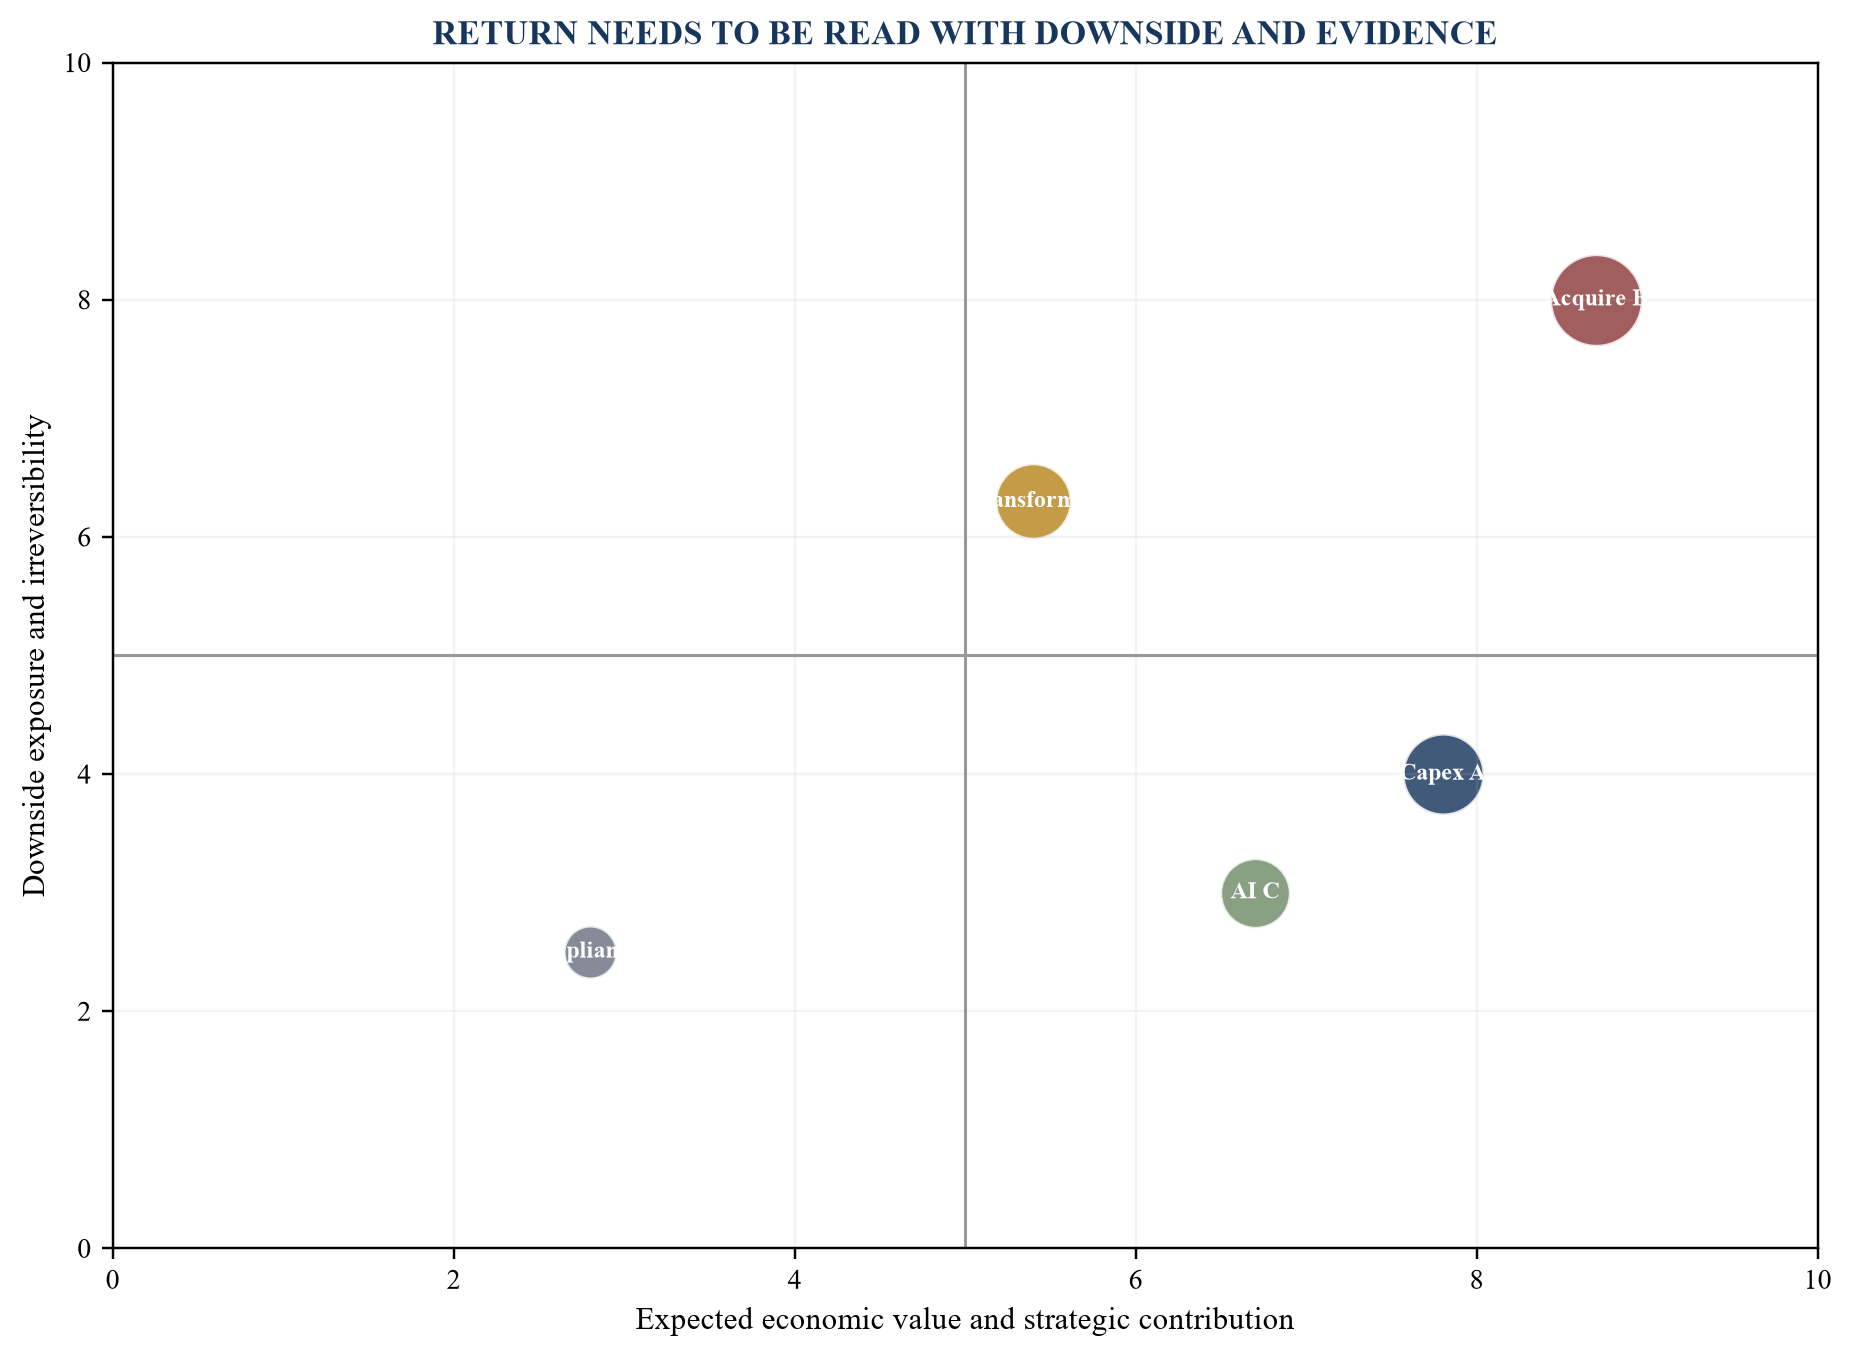
Values, exposure scores and capital amounts are hypothetical assumptions for framework illustration.
22. Apply accounting evidence without confusing it with value
Accounting standards determine recognition, measurement, presentation and disclosure. Capital allocation evaluates incremental cash, risk and strategy. The two analyses interact and remain distinct. An expenditure can create strategic value while being recognised as an expense. An asset can be recognised while its economic return subsequently deteriorates.
IAS 36 requires assets within its scope to be carried at no more than recoverable amount and defines recoverable amount through value in use and fair value less costs of disposal. IAS 38 governs intangible assets and sets conditions relevant to research and development expenditure. IFRS 3 and IFRS 13 provide requirements relevant to business combinations and fair value measurement. Qualified accounting advice is needed for transaction-specific treatment.
The proposal should state expected accounting effects, impairment indicators, useful lives and disclosure implications where material. These effects can influence covenants, tax, performance measures and stakeholder communication. They should not be manipulated to make one investment class appear economically superior.
23. Link financing to the proposal
Funding changes the feasibility and resilience of capital allocation. The analysis should identify draw timing, maturity, interest, fees, amortisation, covenants, security, guarantees, hedging and refinancing. It should also test whether the funding source remains available under downside conditions.
BIS research published in 2026 describes the scale of AI-related investment and the growing role of debt and private credit in financing infrastructure. This reinforces the need to test expected earnings, balance-sheet exposure and financing structure together. The implication for a company is transaction-specific and should not be derived from aggregate market commentary alone.
The board should compare project cash with debt service and minimum liquidity by legal entity and currency. Off-balance-sheet or special-purpose structures can still create economic dependencies, contractual commitments and reputational exposure. Legal, accounting, tax and credit analysis should reflect the actual arrangements.
24. Use cost of capital consistently
The cost of capital provides a reference for discounting risk-adjusted cash and assessing value creation. It should reflect the selected cash-flow definition, currency, market evidence and risk. A corporate hurdle rate applied mechanically to every proposal can overstate or understate value when risk and duration differ.
The company should document the risk-free rate, market premium, beta or comparable set, debt cost, capital structure, tax and country or currency adjustments used. For a project, the analysis may use comparable assets, project risk and scenario adjustments. For an acquisition, the target and buyer financing should be separated where appropriate.
Hurdle rates should not absorb risks that are already modelled in cash flows. Nor should a low discount rate compensate for weak evidence. The investment committee can present a range and show which assumptions drive the decision. Consistency supports comparability; transparency supports judgment.
25. Introduce shadow capital charges
Some proposals consume resources that do not appear in the project budget. Management attention, scarce technical talent, customer disruption, data access, regulatory bandwidth and integration capacity have opportunity costs. A shadow charge can make this consumption visible when direct pricing is impractical.
The charge should be a transparent management assumption rather than an invented accounting amount. It can use capacity units, constrained hours or portfolio limits. Its purpose is to prevent a project with a small cash budget from appearing free when it consumes the organisation's scarce execution resource.
Shadow charges should be reviewed against realised bottlenecks. If every project receives the same generic premium, the mechanism adds little value. If repeated delays arise from one data team or integration office, the portfolio can price, expand or sequence that constraint.
26. Rank proposals through decision rules
Ranking should follow a documented sequence. Mandatory legal, safety and continuity commitments first pass a necessity and least-cost test. Discretionary proposals then pass critical gates, evidence quality, economic return, downside, strategic fit, reversibility and capability review. Portfolio optimisation occurs only among proposals that survive these tests.
The rules should state when a proposal is approved, staged, deferred, redesigned or rejected. A positive NPV can be necessary and still insufficient. A critical gate can stop approval. Weak evidence can lead to a test. High downside can lead to structural protection, smaller commitment or rejection. Capacity constraints can change timing.
Exceptions need board-level transparency. A strategic proposal approved below the financial threshold should state the reason, exposure and review condition. A compliance proposal should still seek the most efficient route. Recording exceptions supports accountability and later learning.
27. Optimise the portfolio under real constraints
Portfolio selection aims to maximise value subject to cash, debt, risk, capability, timing and strategic constraints. A mathematical optimisation can support this decision when inputs are controlled. The solution should be interpreted as a scenario, because proposal values, correlations and constraints contain uncertainty.
The model can include binary choices, staged funding, dependencies, mutually exclusive routes and minimum strategic commitments. It can also impose concentration limits by sector, technology, geography, vendor or risk driver. A sequence may outperform a simple ranking because learning from one investment changes the value of another.
Management should test solution stability. If a small assumption change produces a completely different portfolio, the decision is fragile. The board can preserve flexibility, gather evidence or allocate reserves. Robust choices that remain attractive across reasonable assumptions can receive priority.
28. Draw the portfolio frontier
The portfolio frontier shows the highest expected value achievable for different levels of downside or capital. Portfolios below the frontier can potentially be improved by changing the mix. The chart helps the board see the opportunity cost of a risk limit and the incremental exposure required for a higher value target.
The frontier depends on assumptions, correlations and available proposals. It should be refreshed when evidence changes. It should also display infeasible regions created by liquidity, covenant, regulatory or capability constraints. A mathematically attractive portfolio that breaches one of these constraints is not a valid choice.
Strategic obligations can be shown as a fixed foundation, with discretionary portfolios compared above it. Reserves for uncertainty and resilience should remain explicit. This avoids allocating every unit of apparent capacity to projects and leaving the company unable to respond to adverse events.
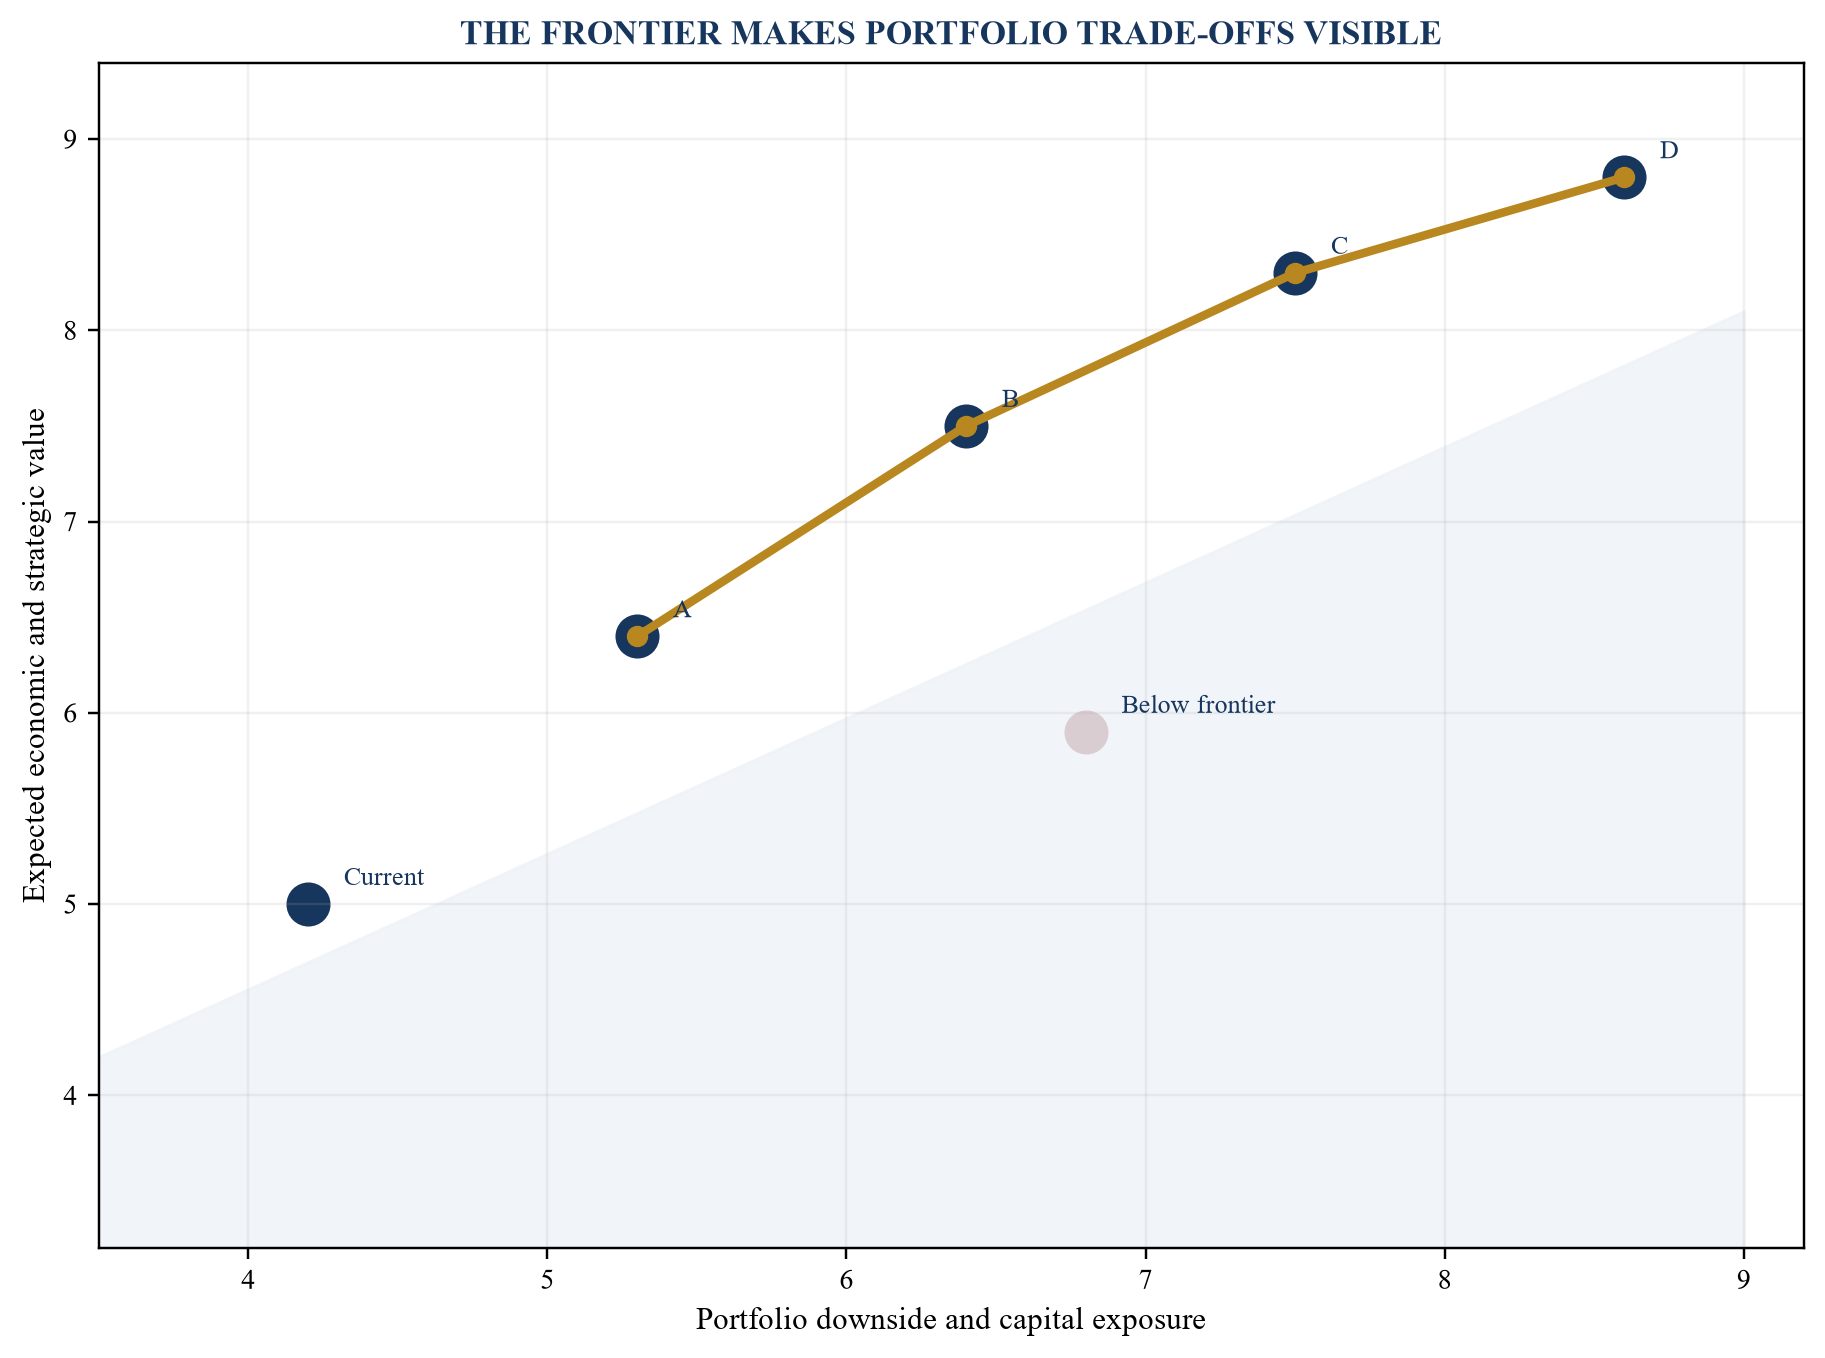
Expected values and downside units are hypothetical assumptions; the feasible frontier changes with evidence, constraints and correlations.
Table 4. Portfolio constraints and evidence
| Constraint | Evidence | Test | Decision response |
|---|---|---|---|
| liquidity | cash calendar, facilities and legal-entity access | minimum headroom under downside | phase, fund, defer or reduce |
| leverage | debt, covenants, ratings and refinancing | headroom through investment horizon | restructure funding or portfolio |
| concentration | common demand, technology, vendor and geography | aggregate exposure to one driver | diversify, hedge or limit |
| capability | critical roles, workload and implementation calendar | peak demand against available capacity | sequence, recruit or partner |
| regulatory | permissions, conditions and approval timing | route is lawful and achievable | gate until qualified confirmation |
| resilience | continuity, safety and recovery requirements | loss remains within approved capacity | add redundancy or reserve |
Constraints need current evidence, an accountable owner and a defined response to breach.
29. Design investment-committee decision rights
The investment committee should have a written mandate covering thresholds, membership, quorum, conflicts, evidence standards, delegated authority and escalation. Finance can own the common economic method. Business sponsors own operating delivery. Specialist functions retain legal, regulatory, accounting, tax, risk, cyber, data and technical responsibilities.
Decision papers should state the decision requested, alternatives, evidence gaps, economics, downside, funding, capability, controls, milestones and exit. Committee minutes should record material challenge, conditions and dissent. This creates a durable decision record and supports later evaluation without rewriting the original rationale.
Machine-generated analysis should be identified and reviewed. The committee needs access to source evidence and model limitations. A model can recommend a ranking based on configured objectives, but it cannot assume fiduciary, statutory or delegated responsibility.
30. Establish stage gates
Stage gates link incremental capital to evidence. A gate should specify deliverables, acceptance criteria, funding released, residual risk, decision authority and stop condition. The sequence may include concept, validation, design, commitment, implementation, scale and benefit realisation. Different proposal types can use different specialist evidence within the common gate architecture.
Gate discipline requires the option to stop. If every programme continues after missing a gate, the process becomes ceremonial. The sponsor should report sunk cost, remaining exposure, recovery route and revised economics. The committee can remediate, narrow, pause or end the programme based on current evidence.
Timing matters. A late gate after most expenditure has been committed creates little protection. Contracting, procurement and transaction documents should preserve the practical ability to make the gate decision. Legal review should confirm rights and consequences.
31. Define stop conditions before commitment
Stop conditions identify evidence that would invalidate or materially weaken the thesis. Examples include loss of a key customer, failure to obtain a permit, cost above a limit, performance below threshold, data rights unavailable, control failure, financing withdrawn or critical talent departure. Conditions should be observable and connected to authority.
Management can distinguish automatic stops from review triggers. A safety or legal breach may require immediate action under applicable policy and law. A commercial metric may trigger committee review. The distinction should be documented before the sponsor becomes committed to continuation.
The board should also define restart conditions. A paused programme may resume after remediation, new evidence or revised scope. This preserves rational flexibility and reduces the stigma attached to stopping a weak pathway.
32. Govern AI assistance in capital allocation
AI can assist with document classification, assumption extraction, comparable searches, anomaly detection, scenario generation, sensitivity analysis and portfolio monitoring. Each use should have a defined purpose, approved data, performance measure, human reviewer and escalation route. Outputs should link to sources where the decision depends on them.
The system should protect confidential transaction, employee, customer and vendor data. Access, retention, model provider, cross-border transfer, security and incident requirements need qualified review. Generated content can contain plausible errors, omitted context or unsupported sources. Material claims require verification.
The company should monitor model changes and performance. A tool used for summarisation creates different risk from a model that recommends capital ranking. Higher decision consequence generally requires stronger validation, challenge and oversight. NIST AI RMF and ISO/IEC 42001 can provide useful governance references when adapted to the organisation.
33. Prevent automation bias and sponsor gaming
A ranked score can create false authority. Reviewers may defer to a model even when the assumptions are weak. Sponsors may learn to optimise the inputs or language used by the system. Governance should therefore display the evidence, uncertainty, overrides and sensitivity behind every ranking.
Independent challenge can test whether definitions, baselines, ranges and correlations are comparable. Red-team review can search for disconfirming evidence, hidden dependencies, double counting and incentives. Material overrides should be documented with the accountable decision maker and reason.
The committee should monitor patterns by sponsor, project type and model version. Persistent optimism, weak benefit conversion or repeated gate extensions can inform future contingencies and evidence requirements. The purpose is learning and control, supported by fair review of the underlying circumstances.
34. Monitor delivery through leading evidence
Post-approval monitoring should focus on thesis drivers before financial results arrive. Capex can track design maturity, procurement, schedule, cost, commissioning and utilisation. Acquisitions can track customer retention, talent, integration, controls and synergies. Transformation can track data readiness, adoption, quality, process performance and cash conversion.
Each indicator needs a baseline, target, tolerance, owner and decision consequence. Reporting should distinguish observation from forecast and proposed action. A green activity status can be misleading when the economic driver is deteriorating. The dashboard should show both delivery and current expected value.
Forecast changes should reconcile from the approved case. The bridge can separate scope, timing, price, volume, cost, risk, market and management action. This keeps the committee focused on drivers rather than a revised total without explanation.
35. Measure realised value
Realised value should be measured against the controlled counterfactual. The company should compare actual cash and operating outcomes with both the approved case and a current no-investment baseline. This helps separate project contribution from market movements, inflation, currency, normal productivity and unrelated management actions.
Benefits can be recurring, one-off, avoided or capacity-based. Each category needs an agreed recognition policy. Capacity released by automation becomes cash only when redeployed to revenue, avoided hiring, reduced external spend or an approved workforce action. Risk reduction should not be recorded as realised cash unless the methodology supports the claim.
Finance should reconcile realised benefits to management accounts and cash where feasible. Business owners confirm operating causation. Internal audit or another independent function can review material programmes according to the organisation's mandate. The board should see cumulative investment, realised value, remaining forecast and confidence.
Table 5. Realised-value control register
| Benefit type | Required baseline | Recognition evidence | Common error |
|---|---|---|---|
| revenue | customer, volume, price and contribution baseline | contracted or realised incremental margin | claiming gross revenue as cash value |
| operating cost | controlled cost and activity baseline | reduced spend or approved resource change | counting released time without conversion |
| working capital | balance, event and timing baseline | attributable cash release and sustainability | claiming seasonal movement |
| risk | exposure, probability and control baseline | measured exposure reduction under approved method | presenting avoided loss as certain cash |
| capacity | throughput, quality and constraint baseline | used capacity, avoided capex or monetised output | valuing theoretical capacity twice |
| strategic option | enforceable right and exercise conditions | changed future decision set | assigning value without feasible exercise |
Benefit recognition requires an attributable mechanism, evidence and financial reconciliation.
36. Run a hypothetical worked example
Consider a hypothetical company with a USD 120 million discretionary capital envelope, separate maintenance obligations and a minimum liquidity reserve. Management submits four proposals: a manufacturing-capacity upgrade, an acquisition of a specialist technology supplier, an enterprise AI transformation and a distribution expansion. All values in this example are illustrative assumptions and do not describe a company or transaction.
The capacity upgrade requests USD 48 million and shows an illustrative base NPV of USD 19 million. Its key uncertainties are construction cost, commissioning and utilisation. The acquisition requests USD 62 million and shows an illustrative base NPV of USD 27 million after integration and synergy assumptions. Its downside is customer and talent loss. The AI programme requests USD 24 million and shows an illustrative base NPV of USD 16 million, with uncertainty around adoption and cash conversion. Distribution requests USD 35 million and shows an illustrative base NPV of USD 11 million, with demand and working-capital exposure.
A simple NPV ranking would prioritise the acquisition, capex, AI and distribution. The common evidence base changes the interpretation. Acquisition evidence is incomplete for three concentrated customers and two critical engineers. Capex has a signed equipment quote while permitting and energy capacity remain conditional. AI has a controlled baseline for one process and weak evidence for enterprise-wide adoption. Distribution has paid customer demand and significant inventory exposure.
37. Apply gates and option design to the example
The committee converts the acquisition into a diligence and retention gate before final approval. It considers price protection, retention arrangements and a staged integration plan, subject to legal and transaction advice. The capex proposal receives funding for design and permitting before major equipment commitment. The AI proposal receives a bounded deployment in the evidenced process with architecture that preserves an expansion option. Distribution is narrowed to committed customer routes with inventory limits.
The illustrative first-stage commitments total USD 54 million rather than the full USD 169 million requested. This preserves the liquidity reserve and funds evidence that can change later decisions. The remaining capital is conditional on customer, permit, performance, control and utilisation evidence. These amounts are analytical assumptions only.
The portfolio also reserves critical engineering, data and integration capacity. The acquisition and AI programme cannot draw on the same architecture team at peak workload. Sequencing reduces correlated execution risk. The board receives defined decision dates rather than open-ended programme status.
38. Stress the hypothetical portfolio
In an illustrative downside, demand is 12 per cent below the base assumption, implementation is delayed by six months and financing cost is 150 basis points higher. These are hypothetical sensitivities. The company recalculates cash, covenants, stage funding and current NPV for all proposals under the same conditions.
The capex expansion option is deferred when utilisation evidence falls below the agreed threshold. The acquisition can proceed only if price and retention structure absorb part of the customer-risk exposure. The AI programme remains within the bounded process because measured quality is acceptable while enterprise adoption evidence is absent. Distribution inventory is reduced through the pre-agreed limit.
The exercise demonstrates the value of ex ante gates. Management acts through rights and plans established before commitment. It avoids treating an adverse scenario as a prediction. The scenario is a test of whether the portfolio remains within capacity and whether its responses are executable.
39. Implement the system in ninety days
The first thirty days can define perimeter, decision rights, proposal record, economic policy, evidence taxonomy and portfolio constraints. Finance should inventory current proposals and reconcile committed cash. Risk, legal, tax, accounting, technology and operating functions should identify mandatory gates within their mandates.
Days thirty-one to sixty can rebuild a small set of live proposals through the common architecture. The company should test score anchors, downside definitions, capability constraints and stage gates. It can configure controlled machine assistance for document indexing or assumption checks after data and security approval. Manual controls remain available while the system is validated.
Days sixty-one to ninety can run the first portfolio review, approve conditions, publish decision records and establish realised-value reporting. The board should review exceptions, unresolved evidence and system limitations. The next cycle should use observed decision and delivery data to improve assumptions and workflow.
40. Make capital allocation a learning system
The quality of capital allocation depends on repeated connection between evidence, decision, delivery and realised cash. A common architecture makes proposals comparable while retaining their distinctive risks. It gives the board a way to ask consistent questions across capex, acquisitions, transformation and AI.
The central discipline is conditional commitment. Evidence quality, downside, reversibility, capability and strategic options determine how much capital is released and when. Portfolio selection then respects the combined liquidity, leverage, concentration and execution constraints of the company.
Machine assistance can make the evidence base more complete, searchable and timely. Accountability remains with directors and executives operating under applicable duties, policies and specialist advice. When every approval produces a controlled record and every outcome updates the next decision, capital allocation becomes a measurable corporate capability.
References
- Bank for International Settlements, Financing the AI Boom: From Cash Flows to Debt, BIS Bulletin 120, 2026. https://www.bis.org/publications/bulletin-120-financing-ai-boom-cash-flows-debt
- Bank for International Settlements, Financing the AI Infrastructure Boom: On- and Off-Balance Sheet Borrowing, 2026. https://www.bis.org/publications/financing-ai-infrastructure-boom-on-and-off-balance-sheet-borrowing
- Bank for International Settlements, Intelligent Financial System: How AI Is Transforming Finance, Working Paper 1194, 2024. https://www.bis.org/publications/working-paper-1194-intelligent-financial-system-how-ai-transforming-finance
- National Institute of Standards and Technology, Artificial Intelligence Risk Management Framework 1.0, 2023. https://doi.org/10.6028/NIST.AI.100-1
- National Institute of Standards and Technology, AI RMF Core. https://airc.nist.gov/airmf-resources/airmf/5-sec-core/
- National Institute of Standards and Technology, AI RMF Playbook. https://www.nist.gov/itl/ai-risk-management-framework/nist-ai-rmf-playbook
- National Institute of Standards and Technology, Artificial Intelligence Risk Management Framework: Generative Artificial Intelligence Profile, 2024. https://doi.org/10.6028/NIST.AI.600-1
- US Securities and Exchange Commission, SEC to Host Roundtable on Artificial Intelligence, 2025. https://www.sec.gov/newsroom/press-releases/2025-48
- US Securities and Exchange Commission, Remarks at the SEC Roundtable on Artificial Intelligence in the Financial Industry, 2025. https://www.sec.gov/newsroom/speeches-statements/uyeda-ai-roundtable-032725
- IFRS Foundation, IAS 36 Impairment of Assets. https://www.ifrs.org/issued-standards/list-of-standards/ias-36-impairment-of-assets/
- IFRS Foundation, IAS 38 Intangible Assets. https://www.ifrs.org/issued-standards/list-of-standards/ias-38-intangible-assets/
- IFRS Foundation, IAS 7 Statement of Cash Flows. https://www.ifrs.org/issued-standards/list-of-standards/ias-7-statement-of-cash-flows/
- IFRS Foundation, IFRS 3 Business Combinations. https://www.ifrs.org/issued-standards/list-of-standards/ifrs-3-business-combinations/
- IFRS Foundation, IFRS 13 Fair Value Measurement. https://www.ifrs.org/issued-standards/list-of-standards/ifrs-13-fair-value-measurement/
- IFRS Foundation, IFRS 18 Presentation and Disclosure in Financial Statements. https://www.ifrs.org/issued-standards/list-of-standards/ifrs-18-presentation-and-disclosure-in-financial-statements/
- Financial Stability Board, The Financial Stability Implications of Artificial Intelligence, 2024. https://www.fsb.org/2024/11/the-financial-stability-implications-of-artificial-intelligence/
- Committee of Sponsoring Organizations of the Treadway Commission, Enterprise Risk Management Framework. https://www.coso.org/enterprise-risk-management
- International Organization for Standardization, ISO 31000 Risk Management. https://www.iso.org/iso-31000-risk-management.html
- International Organization for Standardization, ISO/IEC 42001 Artificial Intelligence Management System. https://www.iso.org/standard/81230.html
- US Federal Reserve and Office of the Comptroller of the Currency, Supervisory Guidance on Model Risk Management SR 11-7 and OCC 2011-12. https://www.federalreserve.gov/supervisionreg/srletters/sr1107.htm
- OECD, OECD AI Principles. https://oecd.ai/en/ai-principles
- UK Financial Reporting Council, Guidance on the Going Concern Basis of Accounting and Related Reporting. https://www.frc.org.uk/library/standards-codes-policy/accounting-and-reporting/guidance-on-the-going-concern-basis-of-accounting-and-related-reporting/
- UK National Cyber Security Centre, Guidelines for Secure AI System Development, 2023. https://www.ncsc.gov.uk/collection/guidelines-secure-ai-system-development
- European Commission, Ethics Guidelines for Trustworthy AI, 2019. https://digital-strategy.ec.europa.eu/en/library/ethics-guidelines-trustworthy-ai
- International Valuation Standards Council, International Valuation Standards. https://www.ivsc.org/standards/
