

1. Treat AI exposure as a capital-allocation question
Boards increasingly receive proposals for copilots, automation platforms, model partnerships, data programmes and AI-enabled acquisitions. Each proposal can appear strategically urgent. The capital-allocation problem is harder: which businesses need defensive investment, which can create a new advantage, which should partner rather than build, and which may lose economic value even if their reported revenue remains stable for a time.
The review should begin with cash flows and competitive position. Artificial intelligence matters to enterprise value when it changes the quantity or price of what customers buy, the resources required to deliver it, the durability of differentiation, the risk attached to those cash flows or the capital needed to sustain them. A list of tools deployed or employees trained does not answer those questions.
The OECD's 2025 study of AI adoption in firms reports wide variation in objectives, capabilities, obstacles and organisational practice among adopters [1]. That variation cautions against using a single sector assumption. Two companies in the same industry can have different exposure because one sells labour hours while another sells an outcome, one owns exclusive data while another depends on public information, or one can redesign workflows while another adds an interface to unchanged processes.
The review should therefore produce decisions rather than a technology score. Its outputs are a ranked exposure map, a set of operating and valuation scenarios, a three-year capital envelope, an ownership recommendation for each company and a calendar of evidence gates. These outputs connect technical change to the responsibilities of boards and investment committees.
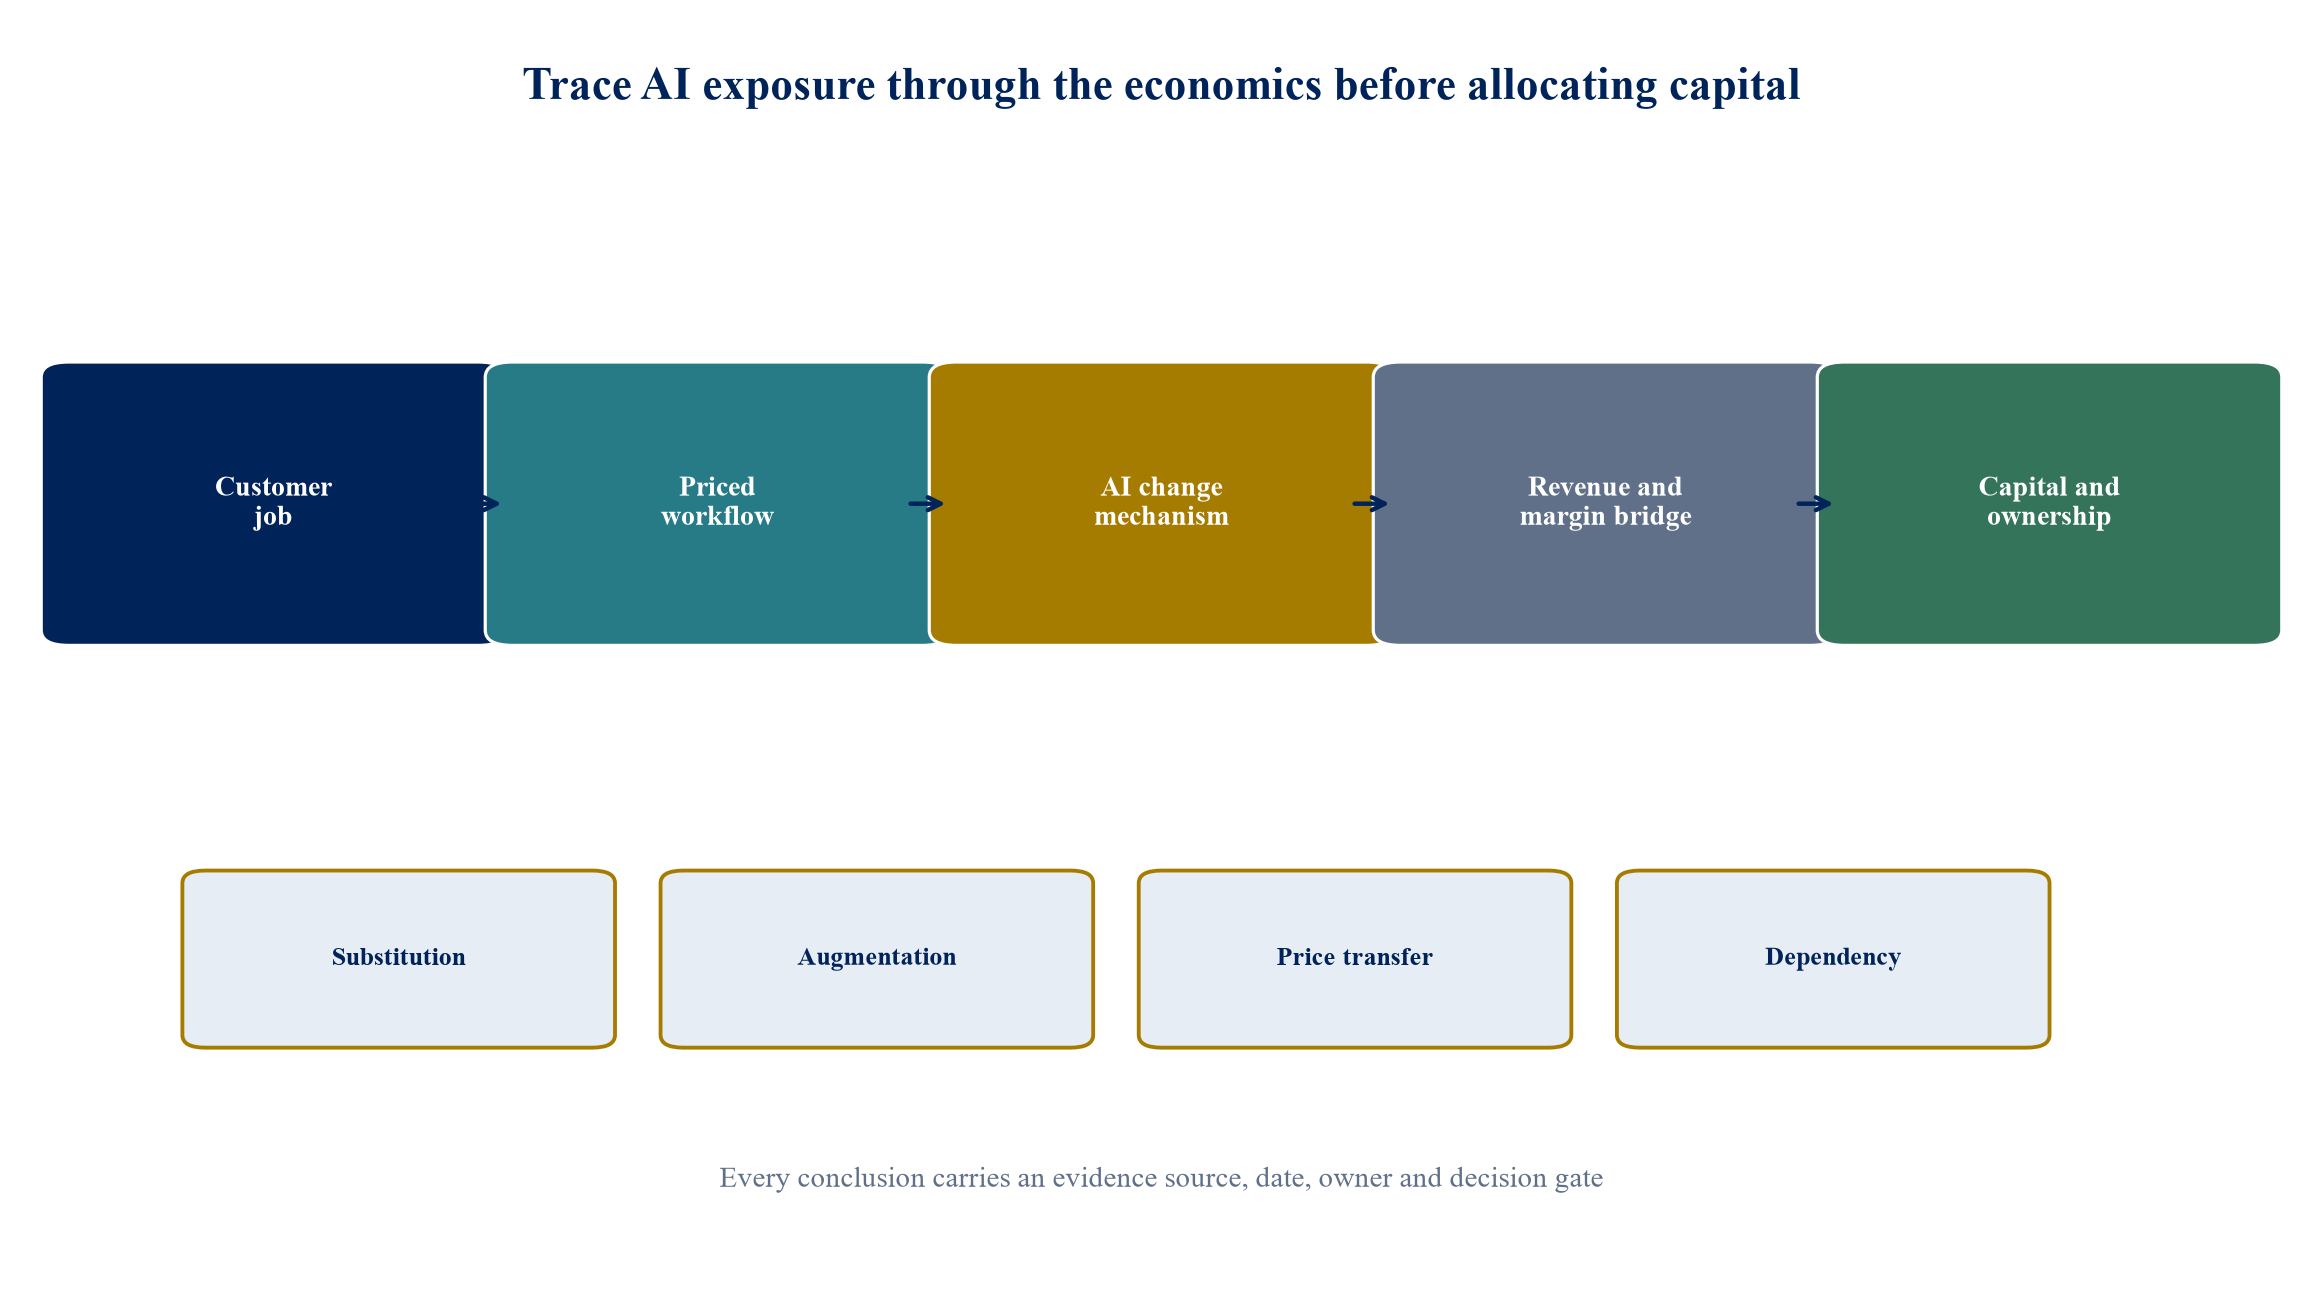
The review traces the economic mechanism; it does not award a generic technology score.
2. Establish the unit of analysis
Company-level analysis is necessary for ownership decisions, but it is too broad for diagnosing exposure. The useful unit is the value-producing workflow: a sequence of tasks that creates an output for which a customer pays or that enables the company to deliver that output. Examples include underwriting a loan, preparing a legal document, designing a component, resolving a service ticket, developing software, planning inventory or analysing medical images.
For each material workflow, the team should identify five elements. The first is the customer job and the measurable outcome. The second is the current mix of labour, software, data and physical assets. The third is the priced unit, such as an hour, seat, transaction, subscription, outcome or share of savings. The fourth is the evidence of quality, speed, risk and switching cost. The fifth is the ownership of data, models, interfaces and customer access.
Task-level exposure does not automatically mean job or company substitution. The IMF distinguishes between AI exposure and complementarity because some occupations contain tasks that technology can assist while still requiring judgement, accountability or interaction [2]. A portfolio review should make the same distinction. High exposure with high complementarity can create capacity and service improvement. High exposure with low complementarity can weaken demand for the existing output.
The analysis also needs materiality thresholds. A workflow may be technically automatable yet economically immaterial. The team should map the share of revenue, gross profit, labour cost, customer retention and regulatory risk attached to each workflow. This prevents attention from concentrating on vivid demonstrations that have little effect on enterprise value.
3. Build an evidence hierarchy before scoring companies
AI narratives can move faster than operating evidence. The review should rank evidence by proximity to realised economics. The strongest evidence is customer behaviour: signed contracts, renewal terms, usage, conversion, price, churn and willingness to pay for an AI-enabled outcome. The next tier is controlled operational evidence: cycle time, error rate, throughput, cost per output, human-review load and incident frequency. Technical benchmarks are useful, but they sit below customer and operating evidence because a benchmark may not reproduce the actual workflow.
Management claims, vendor demonstrations and general market forecasts belong in a lower evidence tier. They can generate hypotheses and identify risks. They should not support a base-case valuation without corroboration. The US Securities and Exchange Commission has brought enforcement actions concerning false and misleading statements about claimed AI use [3]. The lesson for portfolio governance is practical: every material claim about adoption, capability or financial impact needs a named owner, source, period and reconciliation to operating data.
Evidence should also be time-stamped. Model performance, vendor terms, compute prices and regulation can change during an investment period. A test completed twelve months earlier may no longer describe the production system or competitive alternatives. The review pack should state the model version, workflow configuration, data period, population tested and human oversight used.
An evidence register supports challenge. Each strategic claim should link to an observed metric, a controlled test, a contractual fact or a clearly stated scenario assumption. Unsupported claims remain hypotheses. This discipline makes the review repeatable and allows subsequent committees to see which assumptions strengthened, weakened or expired.
4. Score substitution pressure without assuming immediate revenue loss
Substitution pressure arises when customers can obtain the same acceptable outcome with materially less paid input from the company. The relevant questions are whether the output can be specified, whether quality can be verified, whether errors are tolerable, whether customers possess the required data and distribution, and whether accountability must remain with a regulated or trusted provider.
Revenue can reset through several routes. Customers may internalise work previously outsourced. A new entrant may offer the same output at a lower price. Existing competitors may use automation to expand capacity and accept lower margins. Software vendors may bundle functionality that was previously a separate product. Procurement teams may demand productivity sharing at renewal. Each route has a different timing and response.
The team should estimate an exposed revenue pool rather than applying a percentage to total company revenue. For every workflow, identify the contract base, renewal dates, price mechanism, customer concentration, alternative supply and switching friction. The scenario then specifies how much volume is displaced, how much price is repriced and how quickly those effects appear. Early warning comes from sales cycles and negotiation behaviour before it appears in recognised revenue.
Substitution can also be delayed by trust, integration, data access or regulation. Delay is commercially valuable only if management uses it to redesign the offer and cost base. A business protected by friction can still face an abrupt reset when a credible integrated alternative arrives. The portfolio review should therefore distinguish structural protection from temporary implementation barriers.
5. Measure augmentation as an operating-system change
Augmentation improves the productivity or decision quality of people who remain responsible for the output. Its value depends on workflow redesign, adoption and control. Providing a copilot licence without changing responsibilities, data access, quality assurance or incentives can create activity without durable economics.
The operating case should measure the complete process. A faster first draft may save little if review time, correction, escalation or customer communication increases. A model that improves average productivity may create tail risks that require more senior oversight. NIST's Generative AI Profile identifies risks involving confabulation, information integrity, privacy, security, intellectual property, bias and third-party components [4]. Those risks should be costed through controls, testing, monitoring and incident response.
The value bridge begins with baseline volume, labour time, error and service level. It then records the assisted workflow, adoption rate, time saved, rework, quality, review burden and capacity use. Management must state how released capacity will create value: reduced headcount, avoided hiring, higher volume, faster response, improved conversion or a differentiated service. Time saved without a deployment decision is not a cash benefit.
Augmentation can strengthen revenue as well as margin. A company may respond faster, personalise an offer, increase coverage or improve decision consistency. The revenue claim needs controlled evidence, such as conversion tests, renewal uplift or a paid premium. The investment committee should stage capital behind observed unit economics rather than assume that technical capability will become customer value.
6. Determine who captures the productivity benefit
A productivity gain can accrue to the company, employees, customers, vendors or competitors. Capital allocation requires a view on that distribution. A business may lower delivery cost and retain the saving when switching costs are high and outcomes are differentiated. Procurement may capture most of the benefit when contracts are rebid frequently and labour inputs are visible. A model provider may capture value through usage fees, minimum commitments or price increases.
The pricing analysis should examine the priced unit. Hourly or full-time-equivalent pricing exposes the revenue base when the same output needs fewer hours. Fixed-fee pricing can initially retain savings, subject to competitive repricing. Outcome pricing can align price with customer value but requires attribution and risk sharing. Subscription pricing can protect recurring revenue while feature bundling changes willingness to pay.
The team should model a productivity-sharing rate. If a workflow saves USD 10 of delivery cost, the base case might assume that USD 4 remains as margin, USD 3 is passed to customers, USD 2 funds controls and technology, and USD 1 is absorbed by transition friction. Those are scenario assumptions and should be varied. The model becomes misleading if all gross savings are treated as EBITDA.
Price transmission should be linked to renewal cohorts. A company with three-year contracts may show temporary margin expansion before customers demand new economics. A business with monthly subscriptions can experience repricing or churn sooner. The review should show the time lag between operating gain and commercial reset.
Table 1. Economic channels in an AI-exposed workflow
| Channel | Evidence required | Leading indicator | Principal valuation effect |
|---|---|---|---|
| Substitution | Customer alternatives, renewal behaviour, comparable output quality | Pipeline loss, insourcing, shorter commitments | Revenue decline and lower terminal growth |
| Augmentation | Controlled workflow test, adoption, quality and capacity use | Cycle time, rework, throughput, conversion | Margin, growth or working-capital improvement |
| Price transfer | Contract structure, procurement behaviour, competitive bids | Discounts, revised priced units, bundling | Lower revenue yield or temporary margin gain |
| Dependency | Vendor terms, portability, data rights, concentration | Usage-cost increase, service restriction, lock-in | Higher cost, risk premium and capital need |
| Defensibility | Exclusive data, embedded workflow, switching cost, regulatory permission | Retention, paid premium, model improvement | Longer advantage period and stronger cash flows |
The channels should be modelled separately before they are combined in valuation.
7. Map model, data and infrastructure dependency
An AI-enabled company may appear more capable while becoming dependent on a small number of external providers. The review should map foundation models, cloud platforms, data suppliers, vector databases, orchestration tools, safety systems and specialist contractors. For each dependency, record commercial terms, minimum commitments, data-use rights, service levels, termination, portability and replacement time.
The UK Competition and Markets Authority's foundation-model work describes a value chain with important inputs in compute, data, expertise and distribution, and identifies risks involving control of critical inputs, powerful incumbents and partnerships [5]. A joint statement by competition authorities in the United Kingdom, European Union and United States also highlights fair dealing, interoperability and choice as relevant principles [6]. These concerns translate directly into portfolio diligence.
Unit economics should be tested against usage growth and vendor pricing. A feature can improve customer retention while producing a negative contribution margin at high usage. Model routing, caching, smaller models and human review can change the cost curve. The board needs cost per completed customer outcome, not cost per token in isolation.
Portability is an economic asset. A company should know which prompts, evaluation sets, retrieval systems, fine-tuning data and interfaces can move between providers. Exclusive dependence may be rational where capability is differentiated, but the value case should include switching cost and continuity plans. A dependency map also identifies acquisition targets, partnership opportunities and negotiation priorities.
8. Test whether proprietary data creates a defensible advantage
Data is valuable when rights, quality, coverage and workflow use allow the company to produce a better outcome or lower cost than alternatives. Volume alone does not establish advantage. Publicly available, duplicable or poorly governed data may provide little protection. Data collected through an embedded workflow can be more valuable when it is current, labelled by outcomes and legally usable for improvement.
The diligence should document origin, consent, licence, permitted purpose, retention, geography, quality, bias, lineage and customer restrictions. It should separate data needed to operate the service from data permitted for model training or product development. A portfolio company may control access useful information while lacking the contractual right to reuse it.
The review then tests the learning loop. Does additional use generate labelled outcomes? Do those outcomes improve performance in a measurable way? Does improved performance attract more use or better customers? Can a competitor reproduce the loop through public data, partnerships or synthetic data? The answers determine whether data supports a durable advantage or a temporary lead.
NIST recommends governance across the AI lifecycle and attention to third-party components, data provenance and evaluation [4]. These controls have a commercial purpose. A company that cannot explain data rights and model behaviour may lose customers, face remediation cost or delay an exit. A documented data asset can support diligence, partnership and valuation.
9. Translate regulation and trust into cash-flow effects
Regulation affects revenue timing, operating cost, product eligibility and liability. The European Union's AI framework applies progressively and distinguishes prohibited practices, transparency obligations, general-purpose models and high-risk systems [7]. The exact treatment depends on the role, use case and dates applicable to the product. Portfolio companies should obtain jurisdiction-specific advice rather than rely on a generic compliance label.
The review should map each material use case by provider, deployer, importer, distributor or affected operator; geography; customer sector; data type; decision consequence; and human oversight. It should then estimate the cost and time of documentation, testing, monitoring, incident handling, procurement assurance and conformity work. A product that can reach market quickly in one jurisdiction may require a different release plan elsewhere.
Trust can create value before formal enforcement. Enterprise customers may require model cards, security reviews, data-processing terms, audit rights, human escalation and evidence of evaluation. A company that has operationalised these controls can shorten diligence and access regulated customers. A company that treats them as a late legal review can slow sales and increase remediation.
The cost model should avoid false precision. Control requirements and enforcement practice can evolve. Management should use a range, state the legal assumptions and identify gating dates. The capital plan should include contingency for model replacement, data remediation and delayed launch where the exposure is material.
10. Build a revenue-at-risk bridge
The revenue bridge starts with current recurring, project and transactional revenue by workflow. It then applies four effects: volume substitution, price transfer, new AI-enabled revenue and retention or conversion change. Each effect should be tied to customer cohorts and dates. This creates an auditable path from operational exposure to the income statement.
The base case should use evidence already observed or supported by contracted changes. The delay case assumes slower customer adoption and slower benefit realisation. The downside case accelerates substitution, passes more productivity to customers and increases implementation cost. An opportunity case can be shown separately where paid demand and delivery evidence support it. Management should avoid averaging incompatible futures into a single precise forecast.
Quality of earnings matters because the transition can distort familiar indicators. Temporary implementation services can lift revenue while recurring economics weaken. Capitalised development may support EBITDA while cash outflow rises. Vendor credits may reduce initial cost. A review should reconcile reported growth to price, volume, mix, implementation revenue, churn and cash collection.
For portfolio comparison, the bridge can express exposure as a share of revenue and enterprise value. The metric needs context. A company with 30 percent exposed revenue and strong repricing capacity can be safer than a company with 10 percent exposed revenue concentrated in one renewing customer. The committee should retain the workflow evidence behind every summary score.
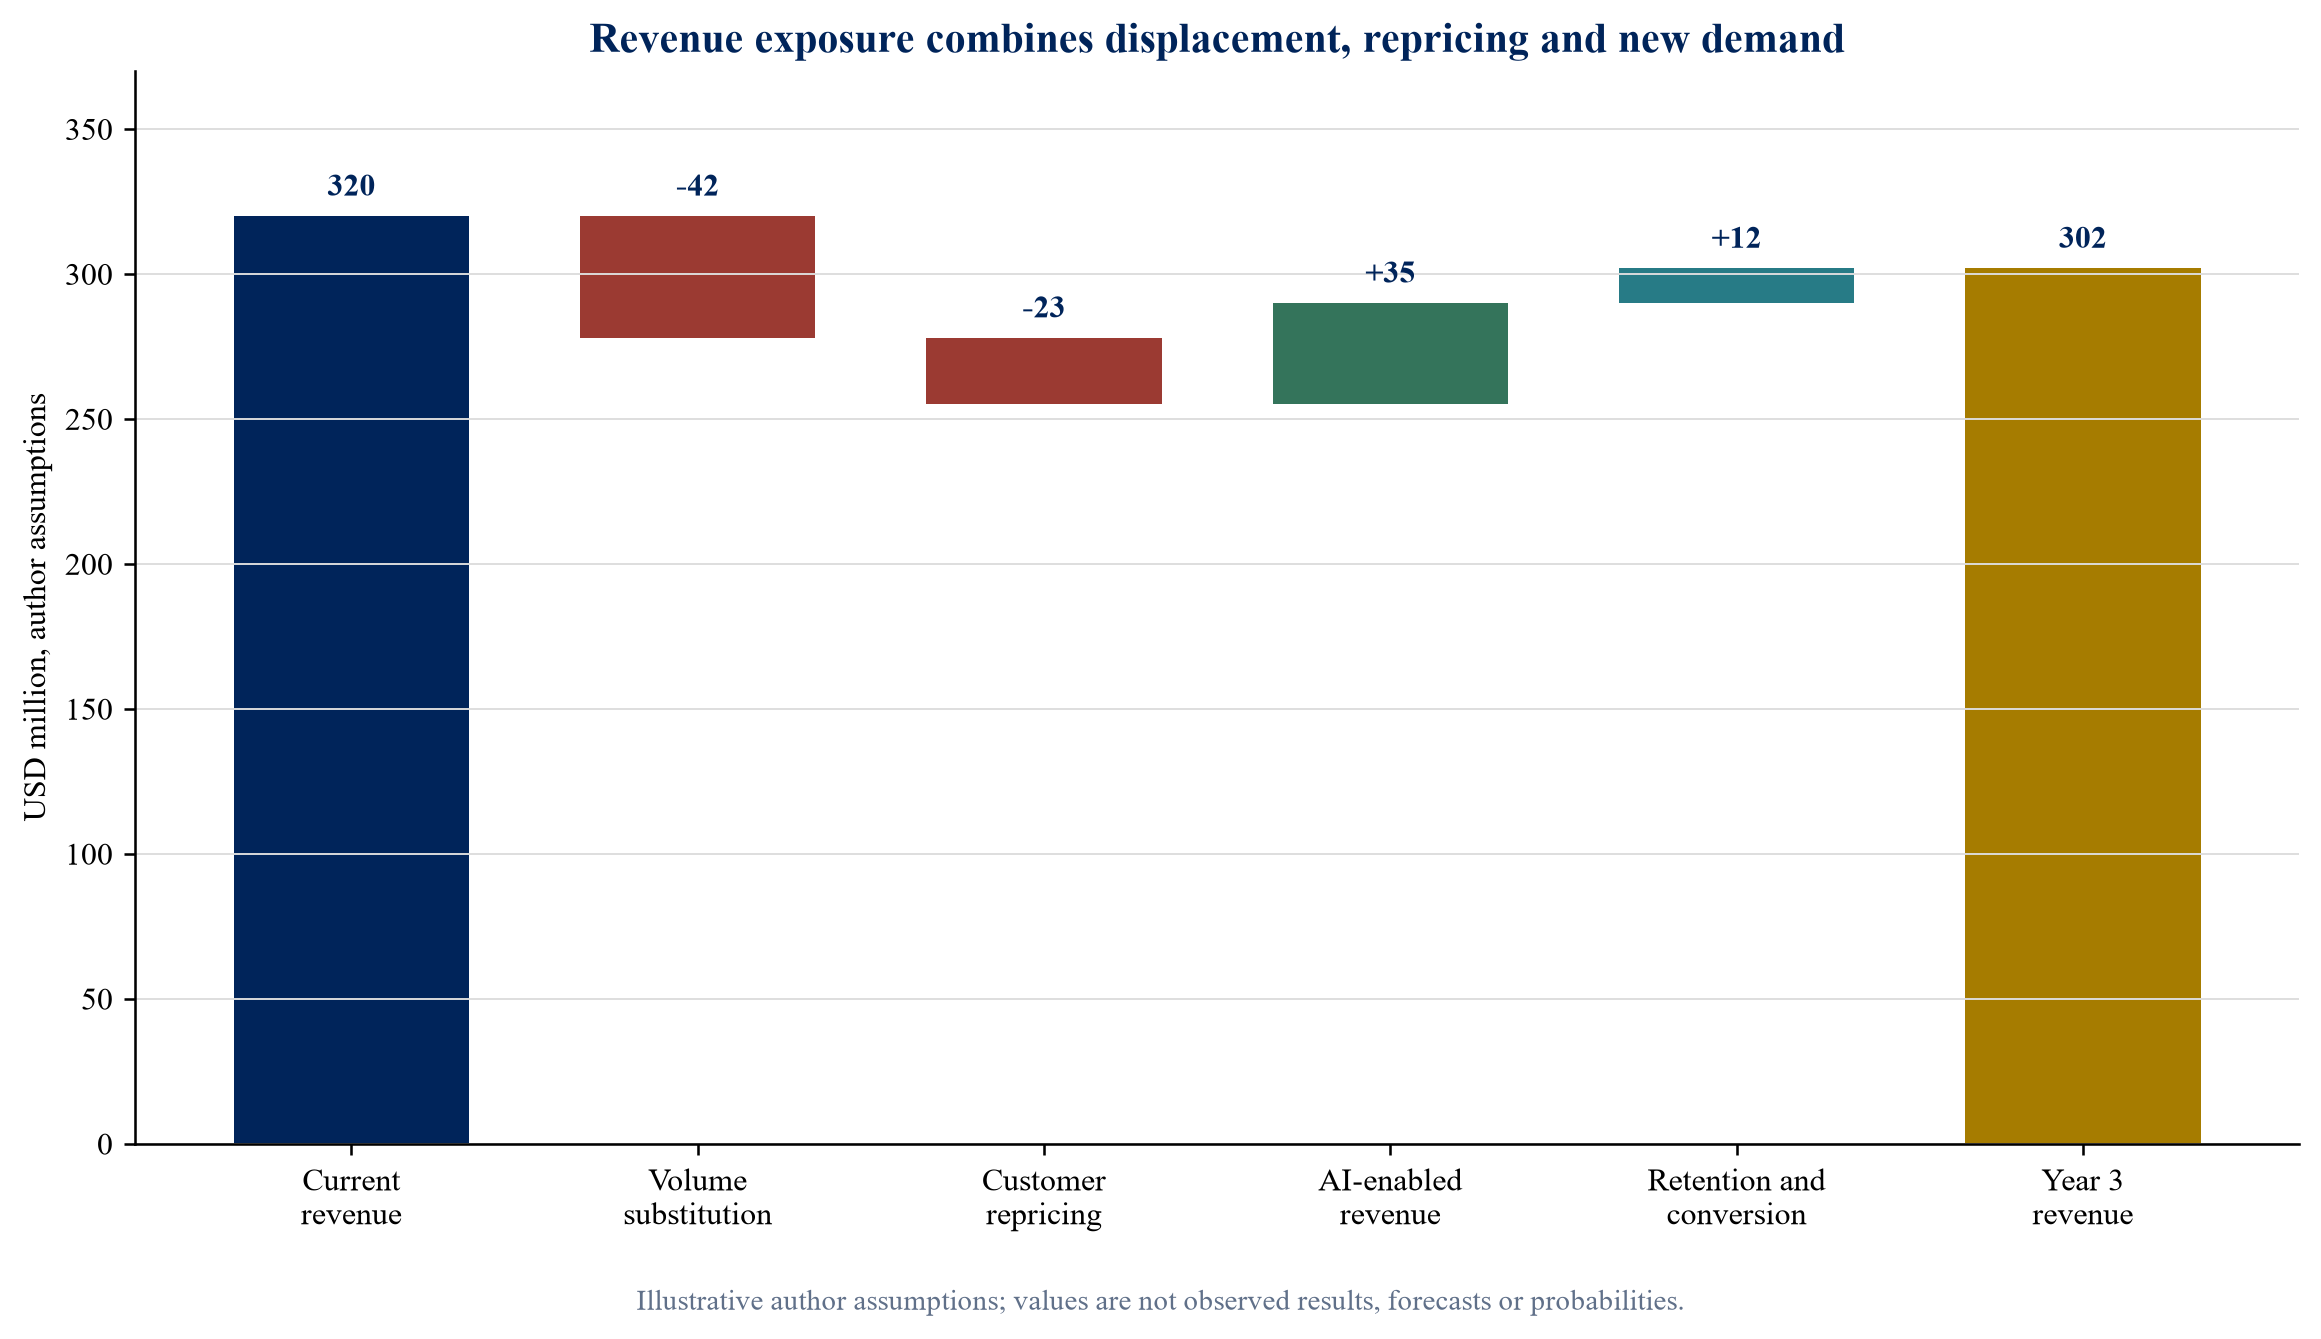
Author assumptions for a hypothetical company; values are not observed results, market forecasts or probabilities.
11. Build a margin-reset bridge
The margin bridge should separate gross productivity, customer sharing, technology run cost, control cost, transition cost, workforce action and growth reinvestment. These items have different timing and cash consequences. A portfolio company can show an attractive steady-state margin while requiring significant near-term expenditure and organisational disruption.
Technology cost includes model usage, cloud infrastructure, data acquisition, integration, monitoring, security and vendor support. Control cost includes evaluation, human review, legal and compliance work, audit, incident management and insurance where relevant. Transition cost includes process redesign, severance, recruitment, training, parallel running and customer migration.
Workforce assumptions require operational specificity. Which tasks change, which roles remain accountable, which skills become scarce and how will released capacity be used? IMF research on AI exposure and occupational mobility shows that exposure can interact with complementarity, education and local labour structures in different ways [2]. A flat headcount-reduction percentage lacks this operational foundation.
Margin resilience should be tested under lower model performance, reduced adoption, greater human review and faster customer repricing. A project remains attractive when benefits survive those frictions and cash payback fits the ownership period. The bridge should also reveal when investment creates strategic option value without near-term EBITDA; committees can then decide explicitly how much option value they are willing to fund.
Table 2. Illustrative margin-reset bridge
| Item | Year 1 | Year 2 | Year 3 | Evidence gate |
|---|---|---|---|---|
| Gross workflow productivity | 6 | 17 | 29 | Controlled tests and adoption |
| Customer price transfer | (1) | (5) | (10) | Renewal and bid evidence |
| Technology and data run cost | (5) | (8) | (10) | Production usage and contracts |
| Control and assurance cost | (3) | (4) | (4) | Approved operating design |
| Transition and workforce cost | (8) | (5) | (2) | Executable implementation plan |
| Net EBITDA effect | (11) | (5) | 3 | Reconciled operating and financial data |
USD million author assumptions for one hypothetical portfolio company; figures are not observed data or forecasts.
12. Revisit valuation and impairment indicators
AI exposure can affect forecast cash flows, useful lives, competitive advantage periods, discount rates and transaction multiples. It can also create impairment indicators before revenue declines are fully visible. IAS 36 requires assets to be carried at no more than recoverable amount and requires annual testing for goodwill and certain intangible assets, with additional testing when indicators arise [8]. Portfolio owners should coordinate strategic review, valuation and financial reporting.
The valuation model should show how exposure changes price, volume, margin, reinvestment and terminal value. A short-term productivity benefit should not be capitalised as a permanent margin advantage when competition is likely to pass it to customers. A data advantage should not receive a long life without evidence of rights, learning and continued differentiation. Conversely, a company with embedded workflows and trusted distribution may preserve value even when underlying models become widely available.
Comparable-company multiples need interpretation. Companies may use similar AI language while having different revenue quality, capital intensity and dependence. Transaction evidence can also lag a rapid change in customer behaviour. Discounted cash flow and scenario analysis are useful because they force the mechanism and timing into view. Market evidence remains important as a reasonableness check.
The committee should identify decision thresholds: the revenue decline, renewal outcome, cost overrun, regulatory barrier or funding requirement that changes the ownership recommendation. This turns valuation from an annual output into a monitoring tool.
13. Allocate capital through staged commitments
The capital envelope should be divided among defend, transform, scale and option categories. Defensive capital protects existing revenue through integration, control, data remediation or product parity. Transformation capital redesigns workflows and the operating model. Scale capital expands an already evidenced offer. Option capital funds bounded experiments, partnerships or diligence on potential acquisitions.
Each commitment needs a milestone tied to economics. Examples include a minimum adoption rate, a reduction in cycle time with stable quality, a paid customer cohort, a contribution-margin threshold, completion of required assurance or proof that data rights support the intended use. Release of the next tranche depends on the milestone, not on completion of a technology workstream.
Staging reduces the risk of committing the full programme before performance, price and adoption are known. It also disciplines management to stop, redesign or partner when evidence is weak. A company with limited internal capability may create more value by acquiring a workflow product or partnering with a specialist. A company with proprietary data and distribution may justify building a differentiated layer.
Portfolio-level allocation should consider shared capabilities. Common evaluation, security, procurement, data governance and vendor negotiation can reduce duplication. Shared platforms should remain accountable to company economics; a central programme that allocates cost without measurable operating outcomes can obscure value.
14. Choose among build, buy, partner and abstain
Build is appropriate where the workflow is strategically differentiating, proprietary data can be used lawfully, integration matters and the company has product and risk capability. Buy can accelerate access to scarce talent, intellectual property, customers or an embedded workflow. Partner can reduce time and capital when the capability is available and portability can be protected. Abstention is rational where the use case is immaterial, control cost exceeds value or evidence remains weak.
The choice should include total cost, time to evidence, control, dependency, integration and exit implications. A low initial vendor price can create costly lock-in. An acquisition can bring capability while creating product overlap, cultural risk, retention needs and uncertain model durability. Internal development can consume management attention and delay customer learning.
Competition analysis matters for AI acquisitions. The 2023 US Merger Guidelines discuss platforms, data and access to competitively significant inputs [9]. The CMA's foundation-model work also examines partnerships and control across the value chain [5]. Transaction planning should consider relevant merger-control, foreign-investment, data and sector approvals early.
The committee should require a counterfactual. What happens to the company if it does nothing for twelve or twenty-four months? What option expires? What capital remains available? The counterfactual reveals whether urgency comes from customer evidence, competitor action or management fear.
Table 3. Strategic route decision matrix
| Route | Best fit | Principal advantage | Principal risk | Proof before commitment |
|---|---|---|---|---|
| Build | Differentiating workflow and usable proprietary data | Control and deeper integration | Execution delay and uncertain adoption | Working prototype with customer and unit-economics evidence |
| Buy | Scarce capability, product or distribution can accelerate strategy | Speed and ownership | Overpayment, integration and obsolescence | Synergy bridge, retention plan and technical diligence |
| Partner | Capability is available and switching can be preserved | Lower capital and faster learning | Dependency and value capture by supplier | Contract, portability test and contribution margin |
| Abstain or defer | Materiality or evidence is low | Preserves capital and management focus | Missed learning or later catch-up cost | Defined monitoring indicators and review date |
Qualitative guide; transaction, legal and technical conclusions require company-specific diligence.
15. Convert diagnosis into ownership actions
The review should end with one of six provisional actions for each company: invest to defend, invest to transform, scale an evidenced advantage, acquire or partner, harvest cash, or prepare an exit. The action is provisional because evidence and markets change. It should include a twelve-month operating mandate, capital limit, board metrics and a date for reconsidering ownership.
An invest-to-defend company has meaningful exposure but a credible route to protect customers and economics. A transform company requires deeper operating change and accepts near-term cost for a measurable new model. A scale company has customer and unit-economic proof. A harvest company may remain cash generative while long-term advantage weakens; capital should be constrained and cash conversion prioritised. An exit candidate has a widening capability gap, limited evidence of adaptation or capital needs that exceed the owner's risk appetite.
The action must account for buyer perception. Strategic acquirers may value data, distribution or talent that the current owner cannot fully exploit. Financial buyers may price execution risk conservatively. A company can also become an acquisition platform if it has governance and integration capability. The review should map likely buyer theses and diligence objections without assuming a transaction will be available.
Ownership action should be linked to valuation thresholds and liquidity. A portfolio owner may retain a challenged asset if the price discounts more damage than the downside scenario supports. It may still sell a strong business when another owner can capture greater synergies. The committee should document the reason for action in expected cash value, risk and portfolio fit.
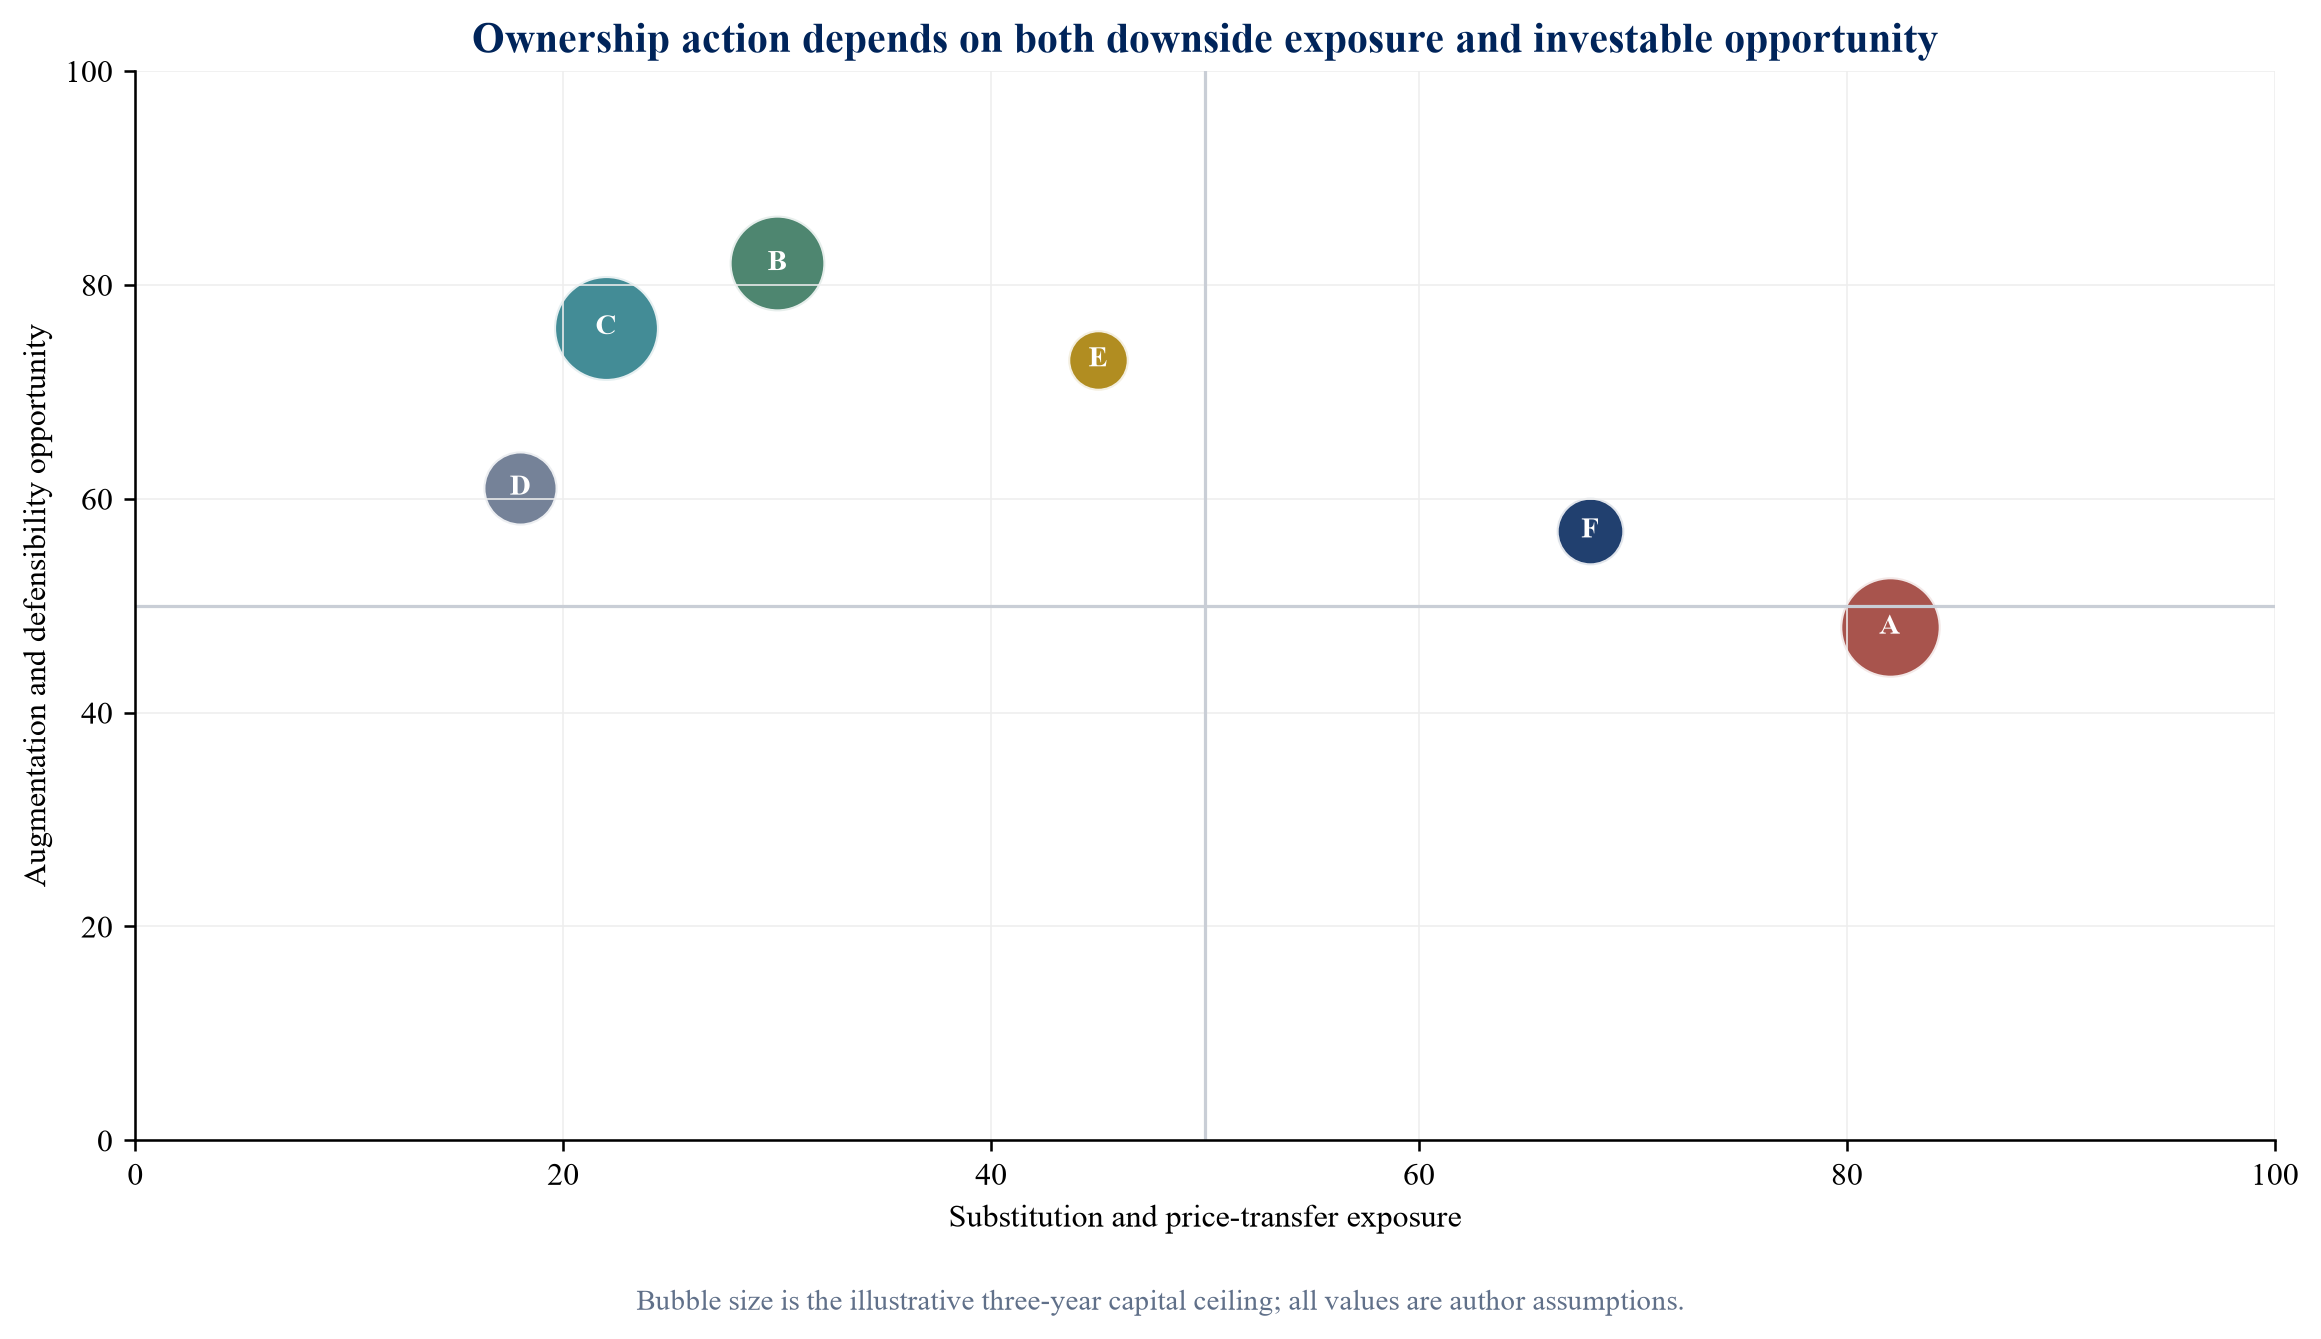
Author assumptions for six hypothetical companies; scores and capital amounts are not observed portfolio data.
16. Run a board-level review with clear decision rights
AI exposure crosses strategy, operations, technology, risk, finance, legal, people and transactions. A board process needs clear ownership. Management owns the operating evidence and plan. The board challenges material assumptions, approves risk appetite and capital, and monitors results. The investment committee decides portfolio allocation and ownership. Specialists test technical, legal, cyber, data and valuation conclusions.
The review pack should be short enough to support decisions and deep enough to trace evidence. A recommended structure is: exposure heat map; customer and competitive evidence; revenue and margin bridges; dependency and control map; capital request; strategic alternatives; valuation scenarios; recommendation; and open issues. Detailed technical evidence remains available in appendices or the data room.
The SEC's disclosure staff has noted that existing requirements may call for material information about AI use, risks, financial effects and board oversight [10]. Even for private companies, this provides a useful governance principle: external claims should reconcile with internal evidence and board understanding. Portfolio owners should review marketing language, investor reporting and transaction materials for consistency.
Decision rights should include stop authority. Security, data-rights, regulatory or customer-harm findings can pause deployment. A missed economic milestone can stop capital even when the system functions technically. A committee should also pre-authorise limited experiments within boundaries so that governance does not prevent learning.
17. Use a recurring decision calendar
A one-time review becomes stale quickly. The portfolio should operate a quarterly decision calendar with monthly monitoring for the most exposed companies. The calendar should align with contract renewals, budgets, product releases, regulatory dates, valuation cycles, debt tests and exit planning. These dates determine when evidence can change value.
Leading indicators include customer requests for price reductions, pipeline conversion, references to insourcing, vendor unit cost, model quality, adoption, rework, incident frequency, data-rights exceptions, competitor releases, hiring changes and capital consumption. Lagging indicators include revenue, EBITDA and impairment. Committees should see both.
Every metric needs a trigger and response. A renewal discount beyond an approved threshold may require a revised revenue case. A model-cost increase may trigger routing or vendor negotiation. A material incident may pause deployment and reassess liability. Failure to reach paid adoption can halt the next capital tranche. The response should be designed before the trigger occurs.
The calendar also supports transaction readiness. Data rights, architecture, evaluation results and customer economics are common diligence issues. Maintaining them continuously can reduce delay in a financing, acquisition or sale. The operating review and transaction data room should draw from the same evidence base.
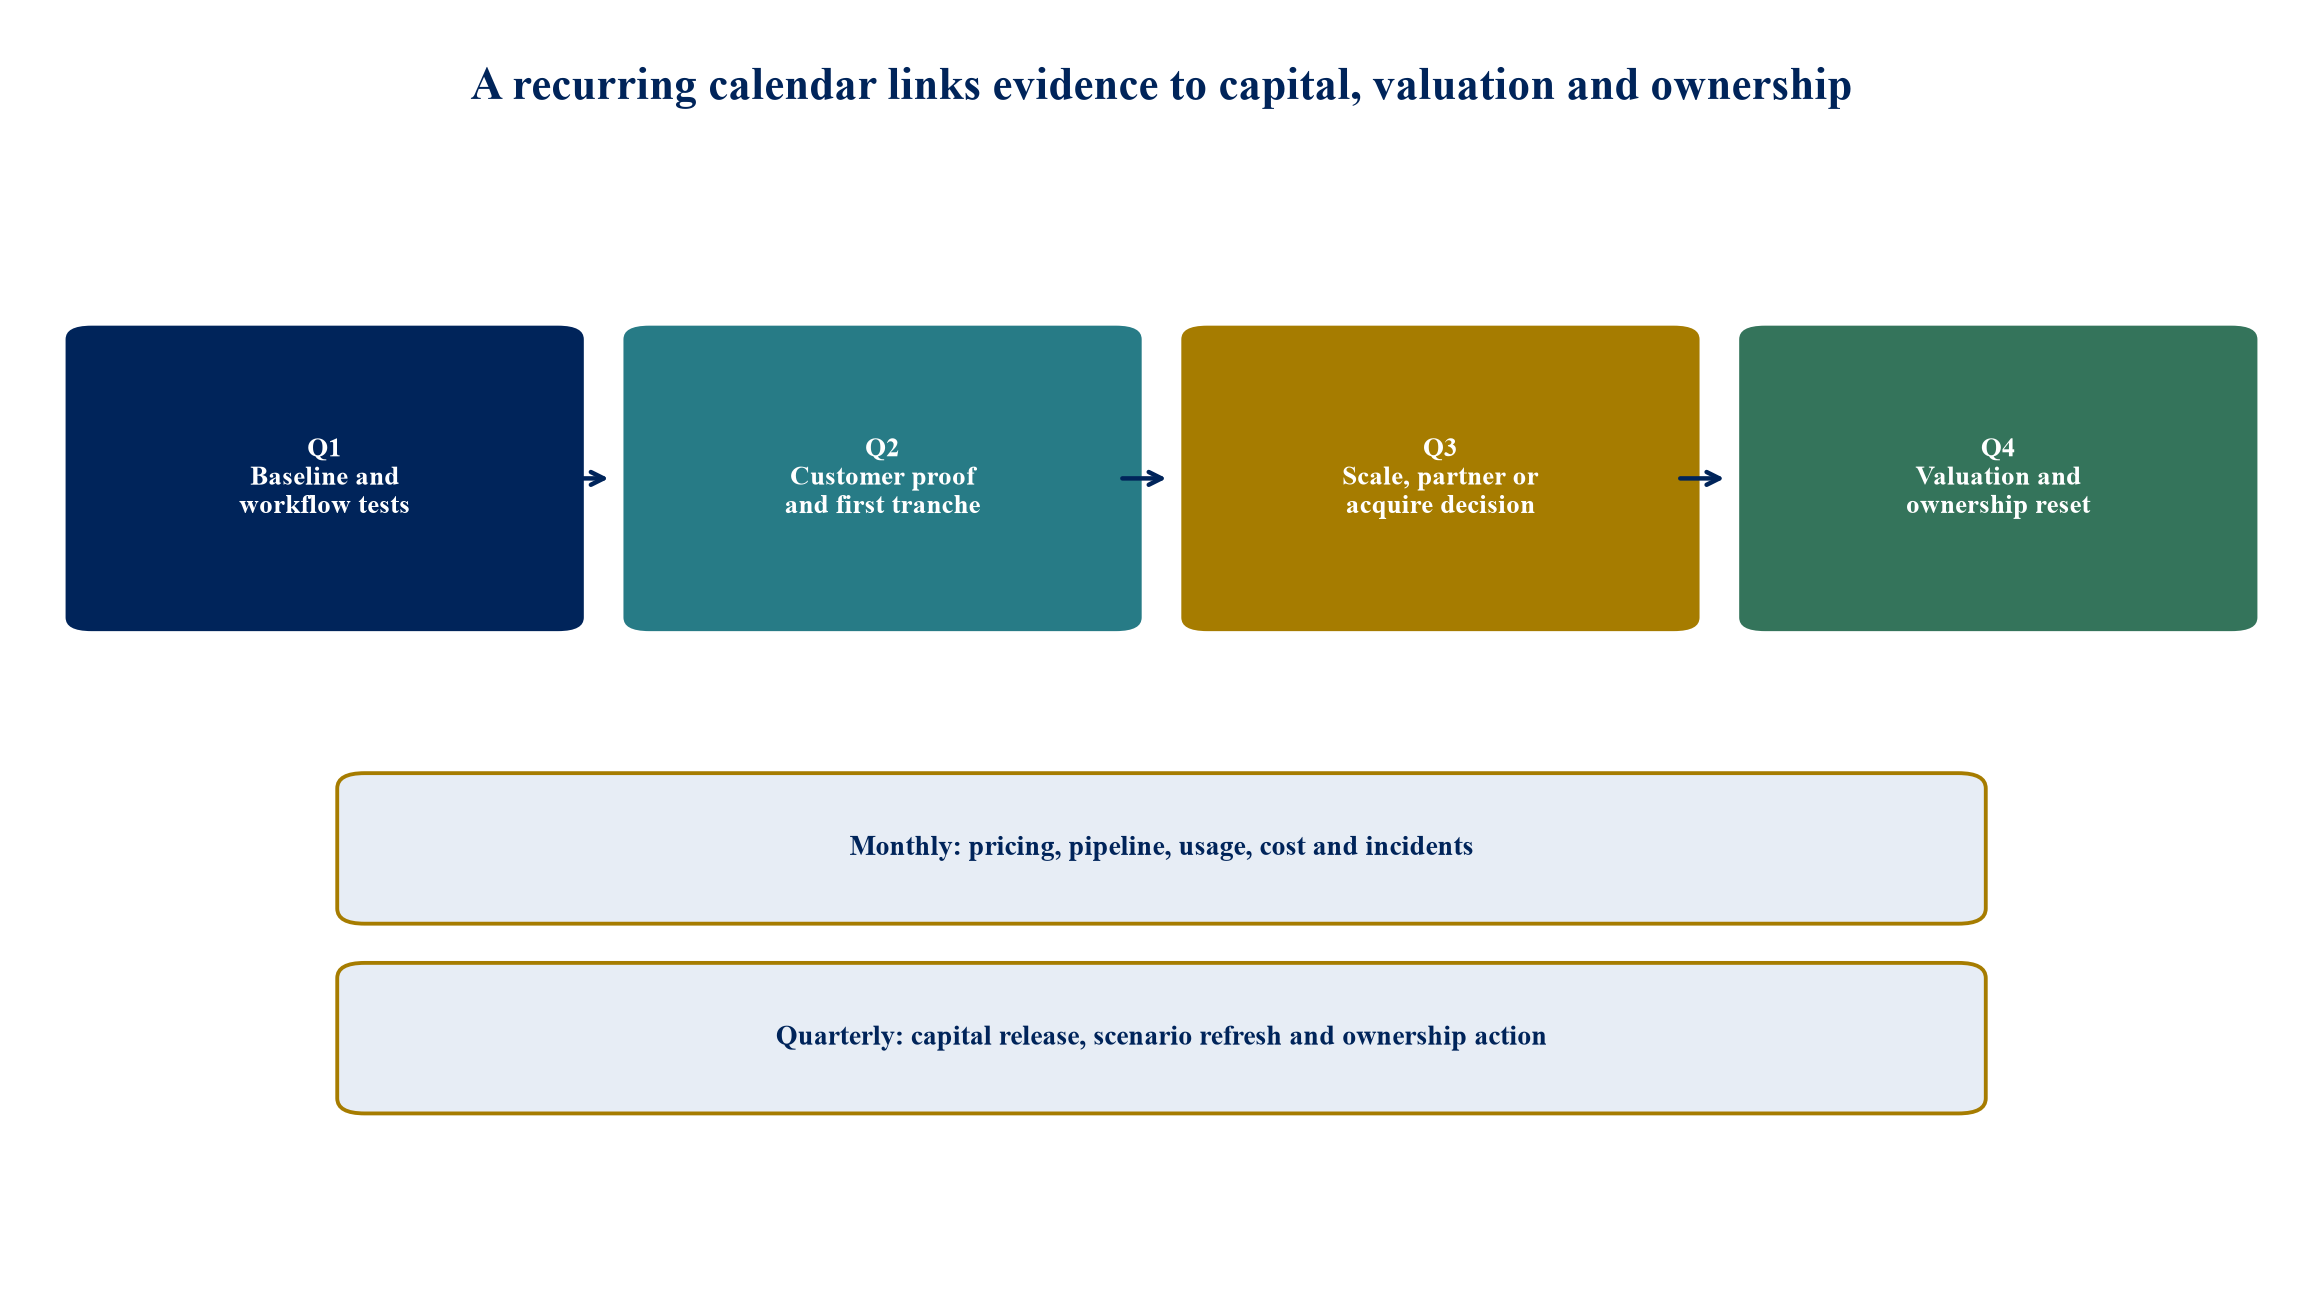
The calendar links operating evidence to capital, valuation and ownership decisions.
18. Illustrative portfolio application
Assume a six-company portfolio with USD 1.85 billion of annual revenue, USD 285 million of EBITDA and a discretionary three-year capital envelope of USD 240 million. Company A provides labour-intensive business services under unit-based contracts. Company B sells vertical software embedded in customer workflows. Company C operates a regulated information service with proprietary labelled data. Company D manufactures engineered products with long design cycles. Company E runs a digital marketplace dependent on external models and cloud infrastructure. Company F provides project-based professional services.
The initial screen assigns no aggregate winner or loser label. Company A has high substitution and price-transfer exposure, moderate augmentation potential and limited proprietary data. Its action is a staged transformation with renewal monitoring and a contingency exit plan. Company B has high augmentation potential and embedded distribution; capital is released after paid usage and contribution-margin gates. Company C has defensible data and regulatory trust, subject to confirmation of rights and model governance; it receives scale capital and acquisition-screening resources.
Company D has lower near-term revenue substitution but meaningful opportunity in design, maintenance and procurement. Its programme focuses on working capital and engineering throughput. Company E can launch features quickly but carries high supplier dependency and uncertain unit economics; the recommended route is a portable partnership with strict cost gates. Company F faces exposure in repeatable deliverables while retaining value in judgement, accountability and client access; its plan redesigns pricing and workforce deployment before automating production.
Under the author’s illustrative allocation, USD 65 million funds defensive and control work, USD 90 million funds evidenced transformation, USD 45 million funds scale opportunities, USD 20 million funds shared capabilities and USD 20 million remains uncommitted. Capital is released in tranches. The downside case assumes faster price transfer, slower adoption and 30 percent higher implementation cost. The ownership map changes if a company misses two consecutive commercial gates or requires capital above its approved ceiling.
Table 4. Illustrative six-company portfolio allocation
| Company | Dominant exposure | Initial action | Three-year capital ceiling | Ownership trigger |
|---|---|---|---|---|
| A Business services | Substitution and customer price transfer | Transform with exit contingency | 55 | Renewal loss or payback beyond ownership period |
| B Vertical software | Augmentation and workflow expansion | Scale after paid proof | 50 | Negative contribution margin at production usage |
| C Regulated information | Data defensibility and assurance | Scale and screen acquisitions | 60 | Rights failure or loss of customer trust |
| D Engineering products | Augmentation and working-capital opportunity | Targeted operating investment | 30 | No verified throughput or cash-conversion benefit |
| E Digital marketplace | Model and cloud dependency | Partner with portability | 20 | Supplier economics breach approved threshold |
| F Professional services | Deliverable substitution and pricing reset | Redesign offer and workforce | 25 | Price compression exceeds productivity retained |
USD million author assumptions; the table is a worked example rather than investment advice or a forecast.
19. Implementation sequence
The first thirty days establish scope and evidence. Select material workflows, reconcile customer and operating data, inventory AI systems and dependencies, record regulatory roles, and build the initial revenue and margin bridges. The team should identify immediate disclosure, security, data-rights or customer risks and pause affected deployments where required by governance.
Days thirty-one to sixty test the economics. Run controlled workflow evaluations, interview customers, analyse contract cohorts, validate contribution margin and model dependencies, and estimate implementation and control cost. Build the portfolio heat map and alternative actions. Finance should reconcile benefits and costs to the plan, cash flow and valuation model.
Days sixty-one to ninety convert analysis into decisions. Approve company actions, capital ceilings, milestones, owners, stop conditions and the twelve-month calendar. Launch only the first capital tranches. Prepare partnership or acquisition workstreams where evidence favours external capability. Begin exit-readiness work where the ownership thesis has weakened.
The portfolio review should then repeat quarterly. Each iteration replaces assumptions with evidence, compares outcomes with prior gates and reallocates unused capital. This creates a controlled response to technology change without requiring a single forecast to be correct.
20. Limitations and conclusion
The framework does not predict the pace or direction of AI capability, customer adoption, regulation, vendor economics or competition. It does not replace technical testing, legal advice, cyber assessment, accounting judgement, valuation work or company-specific commercial diligence. The illustrative portfolio and financial values are author assumptions designed to demonstrate the method.
The method is most useful when workflow and financial data can be reconciled. It is less reliable where customer contracts, cost allocation, data rights or operating metrics are incomplete. Some benefits and risks emerge through organisational behaviour that is difficult to quantify. Committees should preserve ranges, record uncertainty and revisit decisions as evidence changes.
Artificial intelligence can create both capability and exposure inside the same company. The investment question is the mechanism by which those changes reach customer behaviour, unit economics, cash flow and strategic position. A disciplined portfolio review maps that mechanism, stages capital behind proof and keeps ownership choices open.
The board-level result is practical: a company-specific mandate, a bounded capital commitment, a set of commercial and control gates, and a date when the decision will be reviewed again. That process allows capital to move before financial statements fully reflect a reset while keeping the decision accountable to evidence.
