

1. Define the valuation decision
The work should begin with the decision being made. Acquisition pricing, sell-side preparation, growth investment, debt underwriting and a post-close transformation plan require different evidence, horizons and risk treatment. The valuation date, legal perimeter, channels, locations, customer groups, supplier arrangements, inventory ownership and expected integration should be explicit.
The central question is how much incremental, transferable and durable cash arises from a defined change in pricing, cross-sell or inventory management after full operating cost and customer response. A model score, recommendation acceptance rate or gross-margin percentage does not establish enterprise value by itself. Evidence should connect the intervention to an outcome and then to reconciled cash.
Observed results, funded actions, forecast opportunities and strategic options should remain separate. A buyer may use structure or staged recognition when evidence will mature after signing. The decision record should state who owns each assumption, the source period, sensitivity and consequence for price, protection, integration or the decision to stop.
2. Map industrial-distribution economics
Industrial distributors earn a spread by aggregating demand, carrying assortment, sourcing reliably, financing stock, providing technical selection, placing inventory near use and fulfilling small or urgent orders. Revenue quality depends on repeat consumption, embedded workflows, service credibility, switching cost and supplier access. A low-value component can carry high customer consequence, while a high-revenue account can destroy value through discounts, expedites, returns, bespoke stock and slow payment.
The economic model should reconcile gross sales to pocket contribution and cash. Product cost, supplier rebates, freight, handling, branch and warehouse labour, inventory financing, bad debt, returns, warranty, technical support, sales compensation and allocated technology cost can change customer profitability materially. Measures should be reproducible at the level at which a decision is made.
AI value should follow the distributor constraint. Pricing may matter when discount discretion is high; cross-sell may matter when account share is low; inventory may matter when availability and working capital are poorly balanced. Applying every use case to every branch can consume implementation capacity without improving the limiting economics.
3. Establish the controlled perimeter
The perimeter should identify customers, products, suppliers, locations, legal entities, channels, contracts, currencies, tax treatments, sales teams, warehouses, transport arrangements, data systems and models included in the claim. Acquisitions frequently contain separate product hierarchies, duplicated customers, inconsistent units and local commercial practices. A consolidated dashboard can hide that fragmentation.
Control rights matter. A target may use vendor software, supplier catalogues, customer-owned demand data or salesperson knowledge that does not transfer on closing. Data licences, model access, source code, interfaces, key staff, change-of-control consent and transitional services should be mapped before attributing standalone value.
The cash perimeter should reconcile revenue, cost of goods, rebates, logistics, labour, inventory, receivables, payables, technology, implementation, governance, security and remediation. Buyer-specific purchasing scale, distribution reach or data enrichment belongs in a separate synergy case unless a competitive process requires value sharing.
4. Build the evidence ledger
Table 1. Industrial-distribution AI evidence ledger
| Layer | Controlled evidence | Buyer test |
|---|---|---|
| commercial unit | customer, product, site, channel and contract | what economic relationship changed? |
| intervention | model, recommendation, user, time and override | what caused the decision? |
| outcome | realised price, order, fill, lead time and retention | what was observed? |
| full cost | product, freight, labour, technology and working capital | what did the outcome cost? |
| cash | invoice, rebate, collection, inventory and supplier payment | what reached cash flow? |
| durability | rights, adoption, competition, data and service | what survives ownership change? |
Each claim should connect a controlled decision to customer economics and cash.
The ledger should retain definition, source, unit, version, population, period, owner and approval history. Corrections should preserve the prior record. Management estimates and illustrative scenarios should remain distinguishable from observed operating results inside the transaction workpapers.
A buyer should be able to select a valuation adjustment and trace it through cash, customer outcome, order line, recommendation, baseline and underlying source record. Broken links, excluded exceptions and unresolved reconciliations should enter the downside case rather than disappear inside an average.
5. Construct the customer-product-location graph
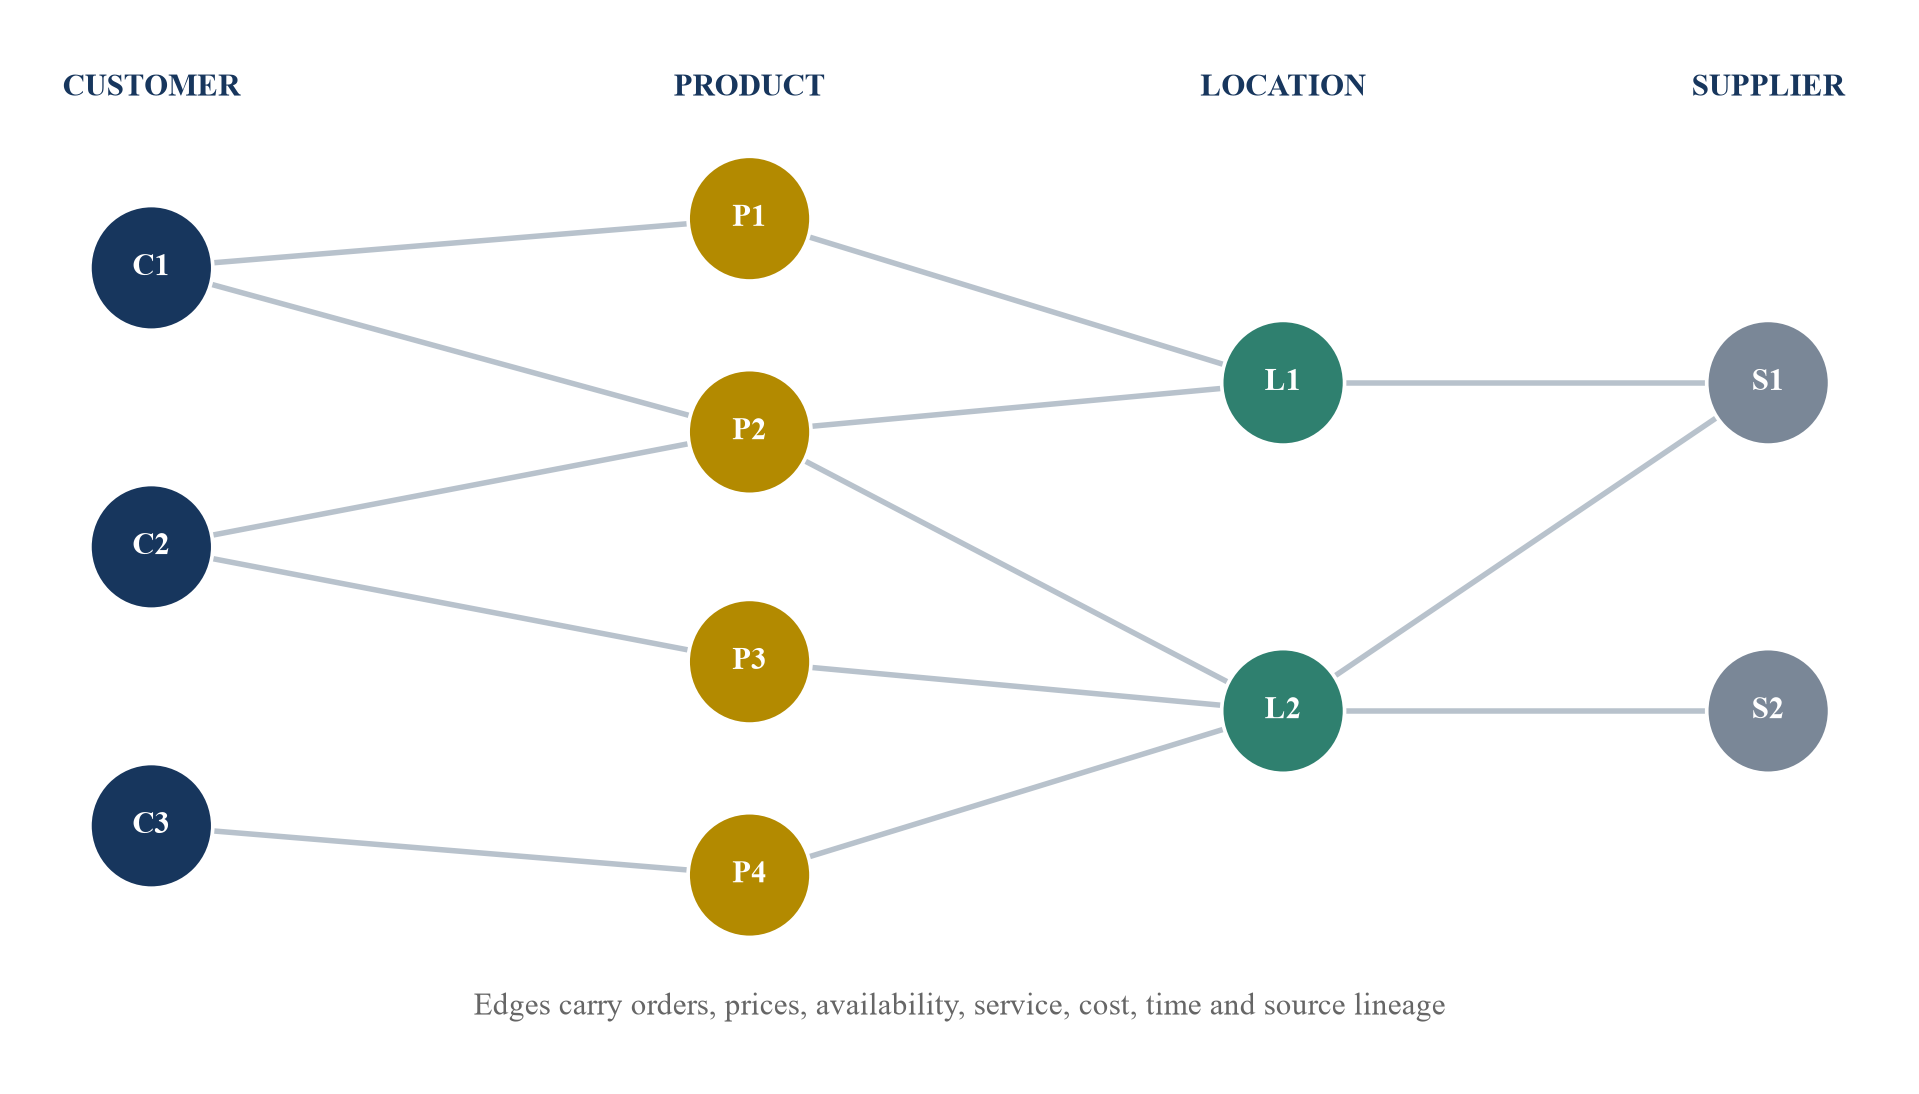
The graph should preserve economic relationships, time, ownership and source lineage.
The graph should join customer identities, sites, products, substitutes, applications, locations, suppliers, contracts, orders, quotes, prices, inventory, service events and returns. Time must remain explicit because assortment, ownership, cost and availability change. A static customer-product matrix cannot explain which version of the commercial relationship produced an outcome.
Entity resolution is a financial control. Duplicate customers can distort share-of-wallet estimates; duplicate products can hide substitutes; inconsistent units can create false demand; and stale hierarchies can assign margin to the wrong category. Probabilistic matches should retain confidence, source and human approval for material decisions.
The graph can support recommendation, pricing and stocking decisions, yet its purpose is a governed economic representation. Data access should follow role and purpose. Customer-confidential demand, personal data and supplier terms require lawful use, security, retention and audit controls.
6. Freeze the baseline protocol
The baseline should state period, customer population, product scope, order and quote definitions, price basis, cost basis, service level, inventory policy, sales coverage, channel, seasonality and exceptional events. It should reconcile to source systems and the financial accounts. Price lists or modelled demand should not replace realised transactions.
Cost inflation, supplier shortages, acquisitions, lost accounts, product launches, branch changes and currency movements can alter outcomes during rollout. Adjustments should be defined before results are inspected. The buyer should retain reported and transaction-normalised views with a documented bridge.
Comparable populations matter. An AI pilot applied to active, digitally engaged accounts should not be compared with the entire customer base. New products, dormant accounts, one-off projects and emergency orders may require separate cohorts. A frozen baseline should include quality, service and customer outcomes so a margin gain cannot be created by transferring cost or risk elsewhere.
The baseline should also preserve the operating calendar. Industrial demand can follow maintenance shutdowns, construction programmes, harvests, weather, public budgets and customer production cycles. Calendar alignment should be defined before evaluation and applied consistently to treatment and control. Where the target acquired a branch or changed its enterprise system, the review should bridge legacy and new records rather than splice unmatched periods. The final baseline pack should contain definitions, reconciliations, exclusions, sensitivity ranges and named approvals so another reviewer can reproduce the starting point without relying on management memory.
7. Reconstruct the realised price waterfall
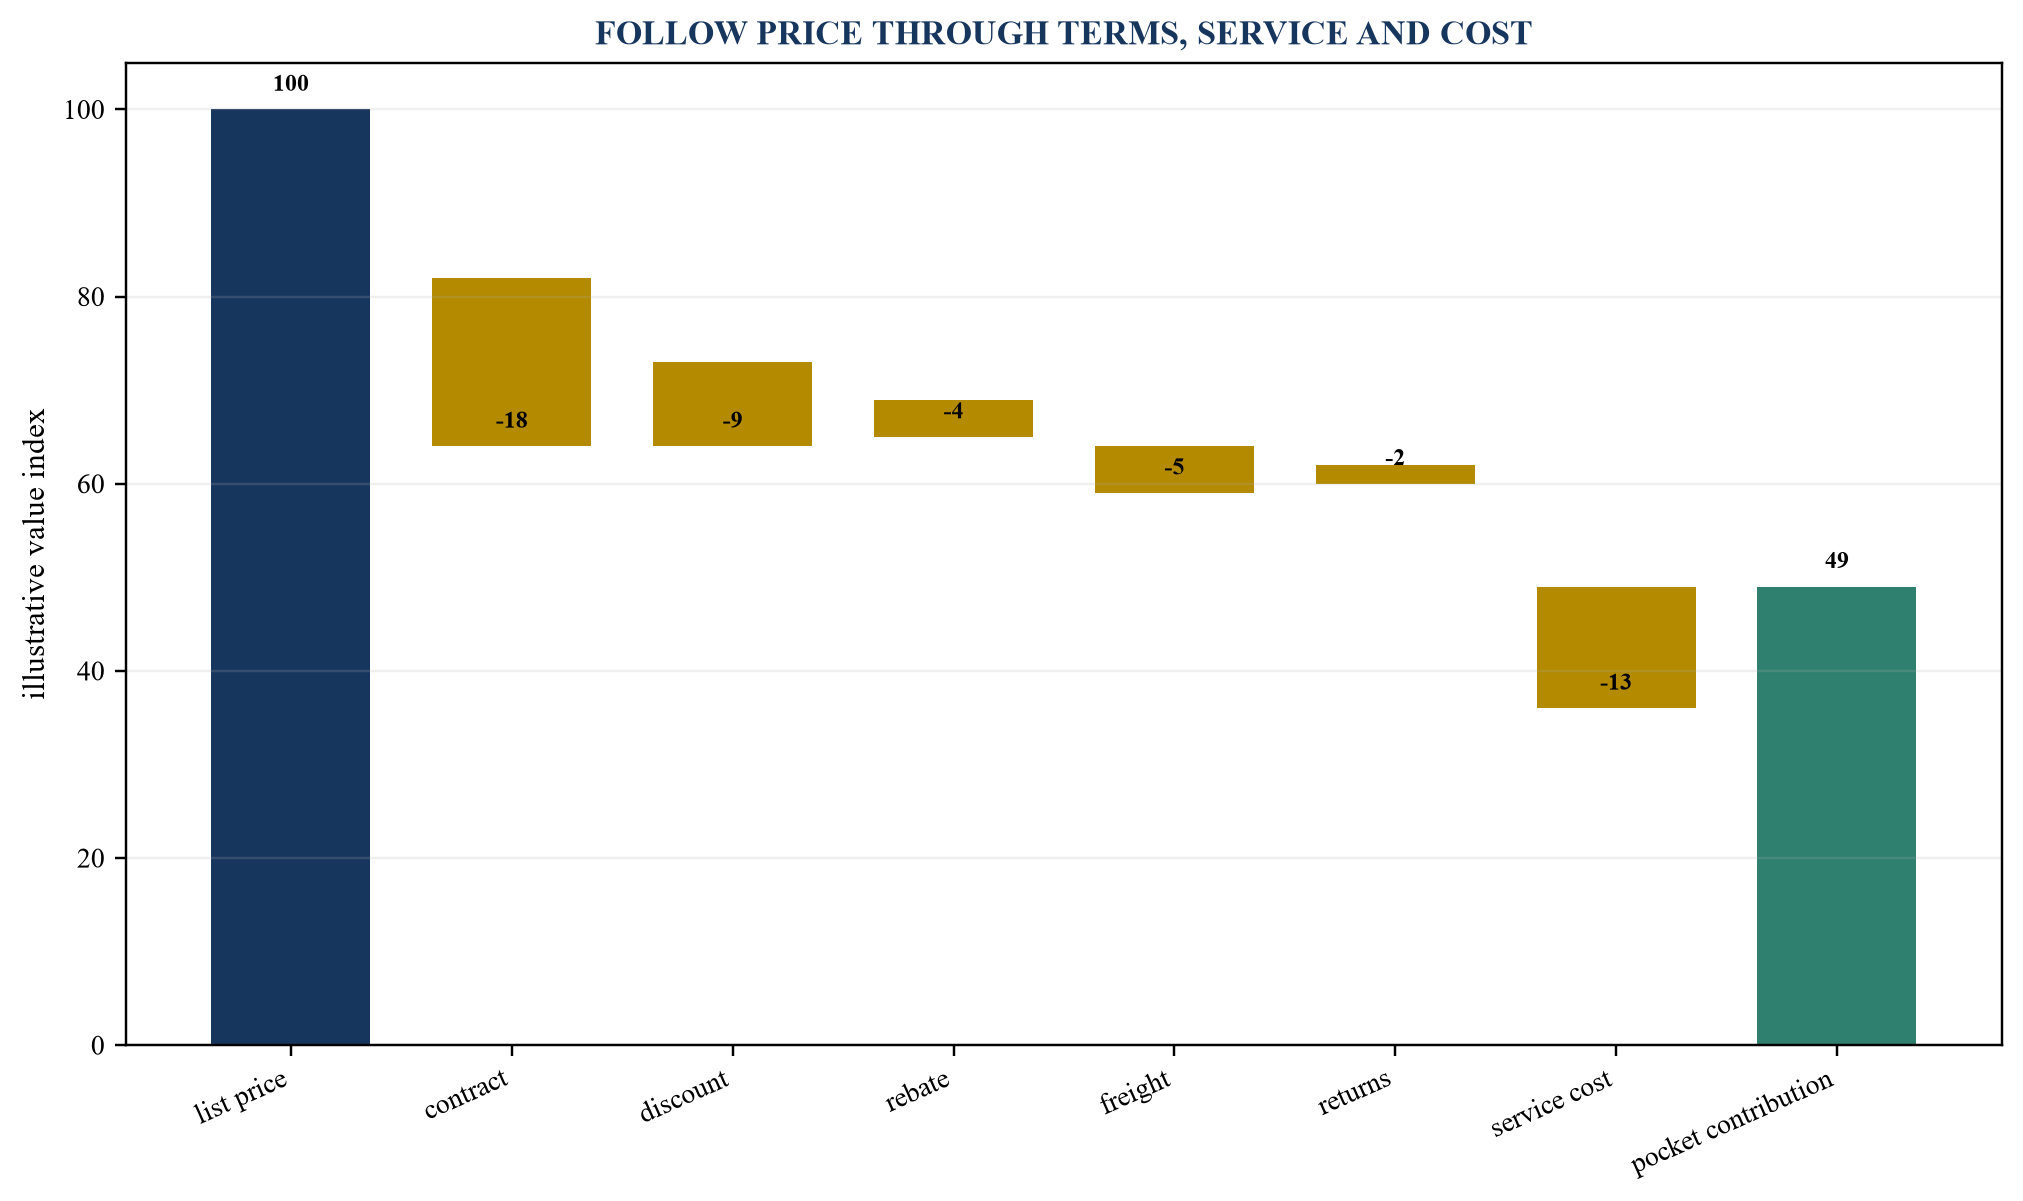
Illustrative values should be replaced with transaction and ledger evidence.
The waterfall should begin with the relevant reference price and move through contract terms, quantity breaks, discretionary discount, promotion, rebate, freight, surcharge, return, credit, service and fulfilment cost. The result should be pocket contribution at order-line and customer level. List-price change can coexist with declining realised economics when discounts or cost-to-serve rise.
Timing and accruals require care. Supplier rebates may depend on future volume; customer rebates may be paid later; freight recovery can sit in another ledger; and returns can arrive after commission. The waterfall should reconcile the original quote, approved exception, invoice, credit note, rebate and cash collection.
AI recommendations should be evaluated against the realised waterfall, not the displayed price. The analysis should identify recommendation, acceptance, override, reason, approver, customer response and subsequent purchasing. A recommended increase that loses a valuable basket may destroy more value than it creates on one line.
8. Measure price realisation causally
Price realisation should compare a controlled outcome with a credible counterfactual. Randomised holdouts, phased rollout, matched accounts, discontinuities in authority or difference-in-differences can be appropriate depending on commercial constraints. The unit may be customer-product pair, quote, salesperson, branch or time window, provided spillovers and selection are addressed.
The outcome should include win rate, order frequency, volume, mix, churn, service calls, returns, contribution and cash over a period consistent with the buying cycle. A model may raise price among customers who would have accepted an increase anyway. It may also appear successful because salespeople choose only low-risk recommendations.
Report effect size, uncertainty, duration and population. Intention-to-treat analysis can preserve assignment integrity; treatment-on-the-treated analysis requires stronger assumptions. Pre-specified measures, version control, negative outcomes and repeated tests reduce selective reporting. Material estimates with weak identification should receive a wider valuation range.
9. Govern pricing recommendations and overrides
Table 2. Pricing recommendation control matrix
| Decision | Required evidence | Control |
|---|---|---|
| routine renewal | realised waterfall and contract | bounded recommendation |
| cost pass-through | supplier evidence and timing | documented rule and review |
| strategic account | lifetime contribution and service | senior commercial approval |
| scarce or urgent item | availability and customer consequence | fairness and escalation check |
| exception | reason, value and duration | named approver and expiry |
| automated execution | tested scope and monitoring | kill switch and audit trail |
Authority should follow economic materiality, customer consequence and legal risk.
Pricing authority should define recommendation bounds, minimum economics, strategic-account rules, protected customers, prohibited inputs, approval thresholds, override reasons and expiry. The control should identify who can change logic, training data, cost inputs and commercial constraints. Emergency or scarcity pricing requires heightened review because customer dependence and reputation can outweigh a short-term gain.
Overrides are evidence rather than noise. Repeated overrides can reveal contract terms, local competition, substitute quality, relationship risk or poor data. The team should examine outcome by override reason and user. A low acceptance rate may indicate bad recommendations, weak training, misaligned incentives or conservative rollout.
Automation should match consequence. Bounded recommendations with human approval may be suitable before autonomous execution. Monitoring should detect price anomalies, margin leakage, discriminatory outcomes, stale costs and correlated responses across competitors.
10. Address competition, transparency and fairness
Pricing systems should operate within applicable competition, consumer, contract, sector and data-protection rules. Industrial distribution is often business-to-business, yet customers can include small enterprises, public bodies or individual purchasers. The legal analysis should follow actual buyers, data, terms and jurisdictions.
Shared vendors and pooled market data require review. A common algorithm can expose or infer competitively sensitive prices, capacity, stock or future strategy. The business should understand inputs, outputs, data separation, vendor access and whether recommendations could facilitate coordination. Independent pricing decisions and documented commercial rationale remain important.
Personalisation should be governed by purpose and customer expectation. Price differences can reflect volume, service, contract, risk or channel economics; opaque use of unrelated behavioural or personal data can create legal and trust risk. The buyer should test protected characteristics, proxies, outliers, complaint patterns and disclosure. Remediation cost and constrained use should enter cash flow and valuation.
11. Separate elasticity from model confidence
Model confidence describes predictive uncertainty; elasticity describes customer response to price. A highly confident prediction can still support a poor commercial decision when the response model is biased, the customer has alternatives or the product is part of a broader basket. The two measures should remain separate.
Elasticity should be estimated at an economically coherent level. Sparse industrial demand, negotiated contracts, irregular projects and bundled orders can make item-level estimates unstable. Hierarchical models can borrow strength across related products or customers, while preserving uncertainty and avoiding false precision. Sales knowledge may add information when captured with reasons and tested outcomes.
The buyer should test non-linear response, thresholds, substitutes, complementary items, urgency, switching cost and contract renewal. A price increase may pull demand forward, defer purchases or shift the basket. Long-run retention and contribution matter more than immediate acceptance.
12. Isolate mix, cost and market effects
Realised margin can move because of product mix, customer mix, supplier cost, freight, currency, volume, rebates, acquisition accounting or a pricing intervention. A controlled bridge should attribute each effect using consistent definitions. Residual interaction should remain visible rather than be assigned conveniently to AI.
Cost inputs should reflect timing and recoverability. Standard cost, last purchase cost and replacement cost answer different questions. A recommendation based on stale cost can create apparent margin while future replenishment destroys it. Supplier rebates and freight should follow the commercial terms and probability of achievement.
Market shortages can raise price without model contribution; falling input cost can raise gross margin even when pricing discipline weakens. The evidence should compare model-assisted decisions with a counterfactual and examine whether benefit persists through different cost and demand regimes.
13. Define the cross-sell decision
Cross-sell should solve a customer need and improve lifetime contribution. The decision may be which complementary product, substitute, service, replenishment programme or technical support to present, through which channel and at what time. A larger basket is valuable only when the incremental order is relevant, profitable, fulfilled and retained.
The addressable population should exclude products already sourced through another business unit, contractually unavailable items, incompatible specifications, low-stock items and recommendations outside salesperson or customer consent. Product relationships can arise from engineering compatibility, application, co-purchase, maintenance sequence or site standards; co-occurrence alone can encode historical selling bias.
The economic case should include recommendation cost, sales time, fulfilment, incremental inventory, returns, support, cannibalisation and working capital. A recommendation that diverts demand from a higher-contribution item or increases complexity can reduce value.
The opportunity set should be constrained by customer permission and commercial responsibility. A distributor may know that two products are frequently bought together without knowing whether the customer already sources one under a global contract, manufactures it internally or excludes it for technical reasons. Account plans, lost-quote evidence, application data and product-specialist review can distinguish an attainable need from a statistical association. The system should record why a recommendation was eligible, why it was presented and what the customer subsequently did. This creates evidence for both commercial improvement and model validation.
14. Measure recommendation quality
Offline accuracy is insufficient. Recommendation quality should include relevance, compatibility, availability, price, expected contribution, diversity, novelty, customer acceptance, return, complaint and repurchase. The system should distinguish a useful substitute during a stock-out from an unrelated product that happens to share purchasing history.
Coverage matters because models can concentrate on popular products and large customers. The business should measure performance by customer size, sector, location, channel, tenure and product category. Cold-start treatment for new customers and products should be explicit.
Human review should capture reasons for rejection and correction. Product specialists can identify safety, specification or application constraints absent from transaction data. Repeated corrections should update data and governance. The valuation should include specialist labour and the expected maintenance cycle.
15. Test cross-sell through controlled cohorts
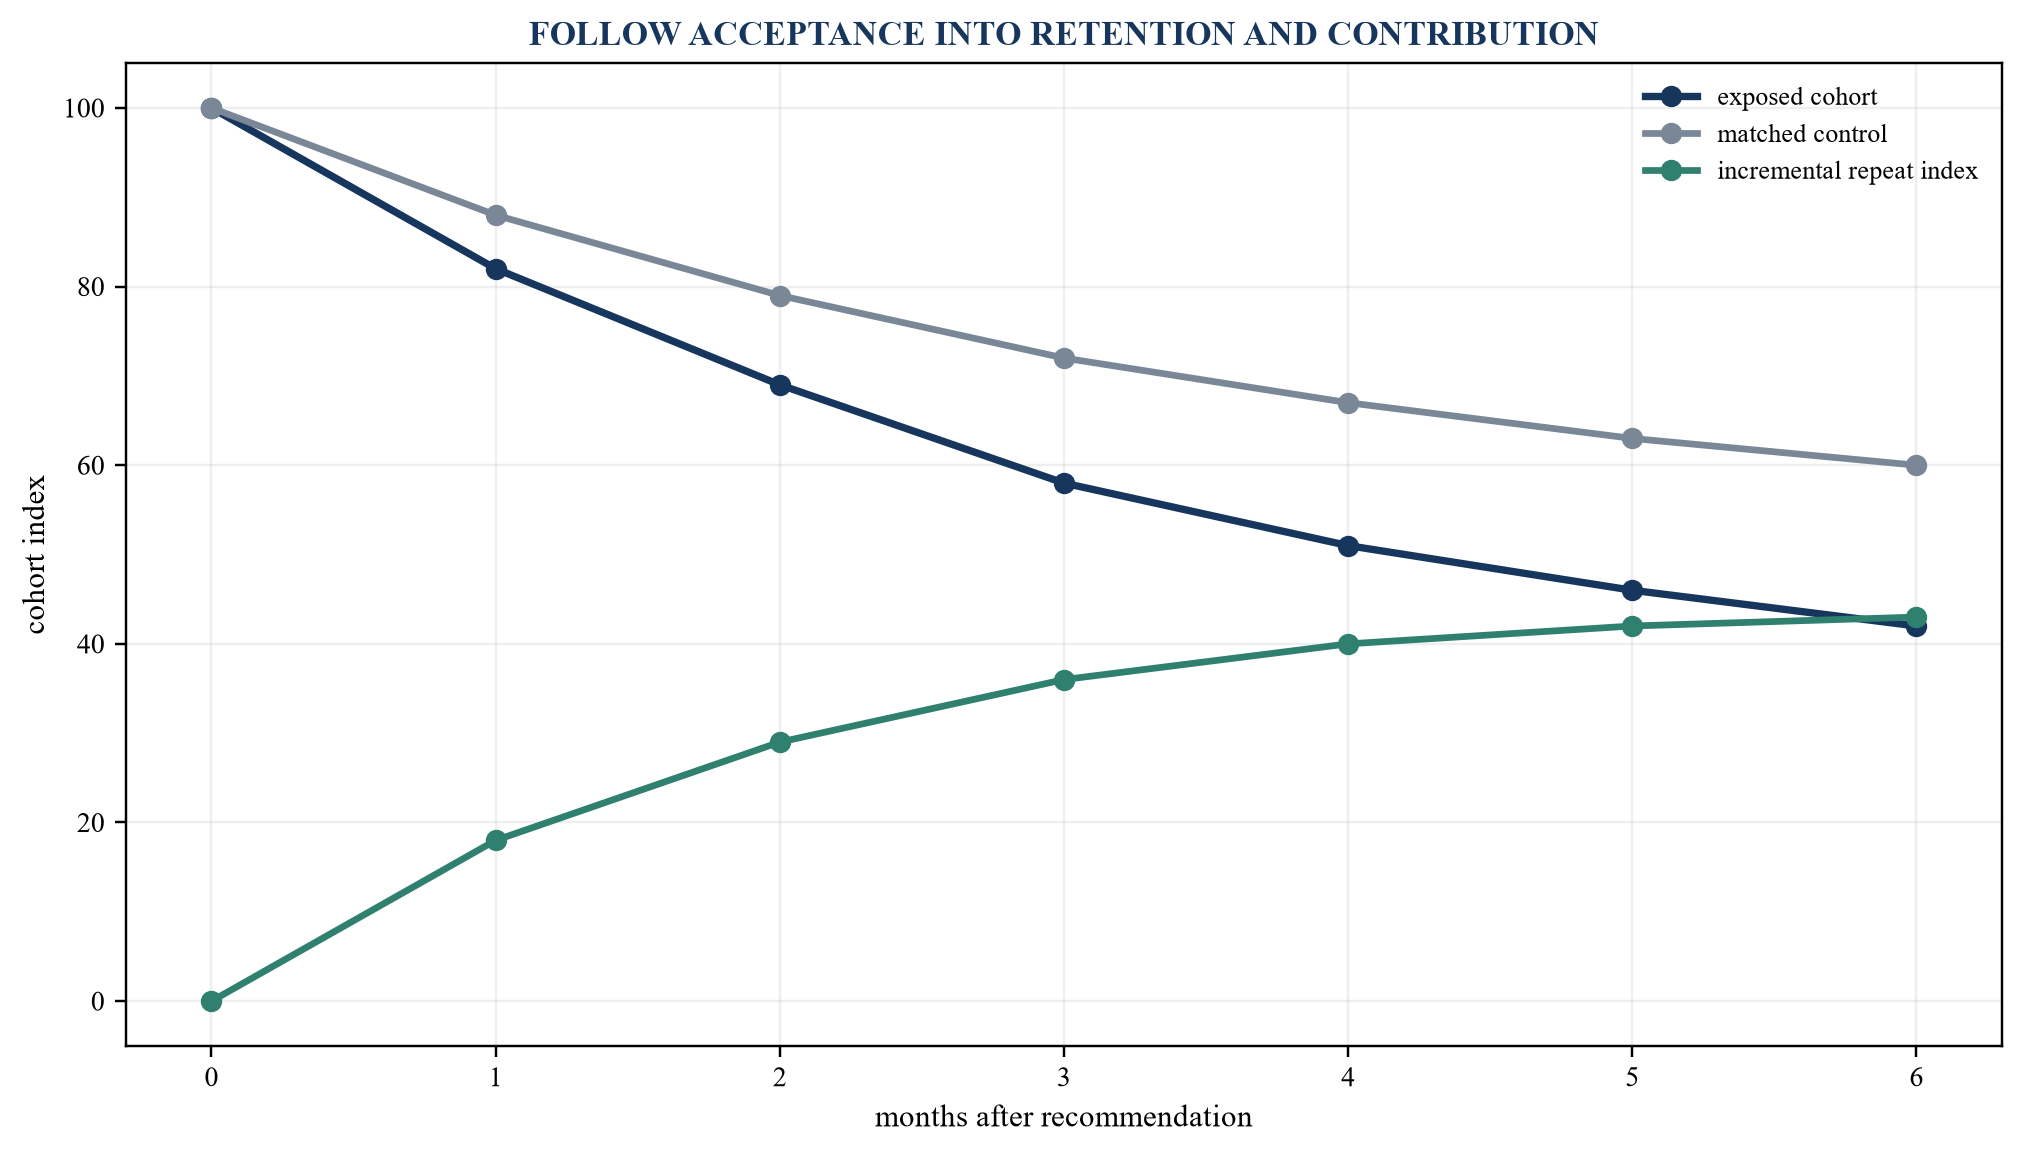
Replace curves with controlled incremental contribution and repurchase evidence.
The trial should define eligible customers, candidate products, timing, channel, treatment, control and outcome before launch. Randomised or phased designs can estimate incrementality when operationally feasible. If salespeople select exposure, matched or instrumental methods may be required and residual selection risk should remain visible.
Measures should include recommendation exposure, engagement, quote, order, contribution, return, complaint, repurchase, retention and displacement of other products. The observation period should match replenishment cycles. One first order can reflect curiosity or discount and should not be capitalised as recurring value.
Customer-level concentration should be inspected. A few project orders can dominate average uplift. Results should be reported by cohort, category, salesperson and confidence range. Scale approval should depend on reproducibility and available inventory, not only statistical significance.
16. Protect retention and relationship value
Industrial relationships often depend on trust, technical competence, response and continuity. Excessive recommendations can make a salesperson less relevant or expose that the distributor misunderstands the customer. Frequency caps, relevance thresholds, protected accounts and clear human ownership should govern outreach.
Retention should be decomposed into logo, revenue, gross margin, pocket contribution and product-category retention. Price and cross-sell interventions can improve one measure while weakening another. Cohorts should control for tenure, sector, contract, sales coverage, supply events and acquisition effects.
The buyer should examine complaints, opt-outs, lost quotes, declining share, reduced order frequency and service escalation alongside model metrics. Customer interviews can test whether digital tools strengthen embeddedness or merely shift ordering channel. Durable value requires a relationship that remains useful after ownership change.
17. Define availability as a customer promise
Availability should be measured at the service promise relevant to the customer: immediate branch stock, same-day shipment, next-day delivery, scheduled replenishment or project delivery. Aggregate in-stock percentages can hide failure on critical items, locations or customers. Fill rate, line fill, order fill, complete-and-on-time delivery and backorder duration answer different questions.
The inventory decision should distinguish stock that protects customer operations from stock held because forecasts are weak or purchasing incentives favour volume. Criticality, substitute quality, supplier lead time, demand variability, failure consequence and customer commitment should inform service tiers.
AI can improve forecasts and allocation, yet value follows fulfilled demand and customer economics. A forecast that reduces error on slow items can be less valuable than one that prevents a critical stock-out. The objective function should weight consequence, margin, relationship and cash.
18. Build the inventory-service frontier
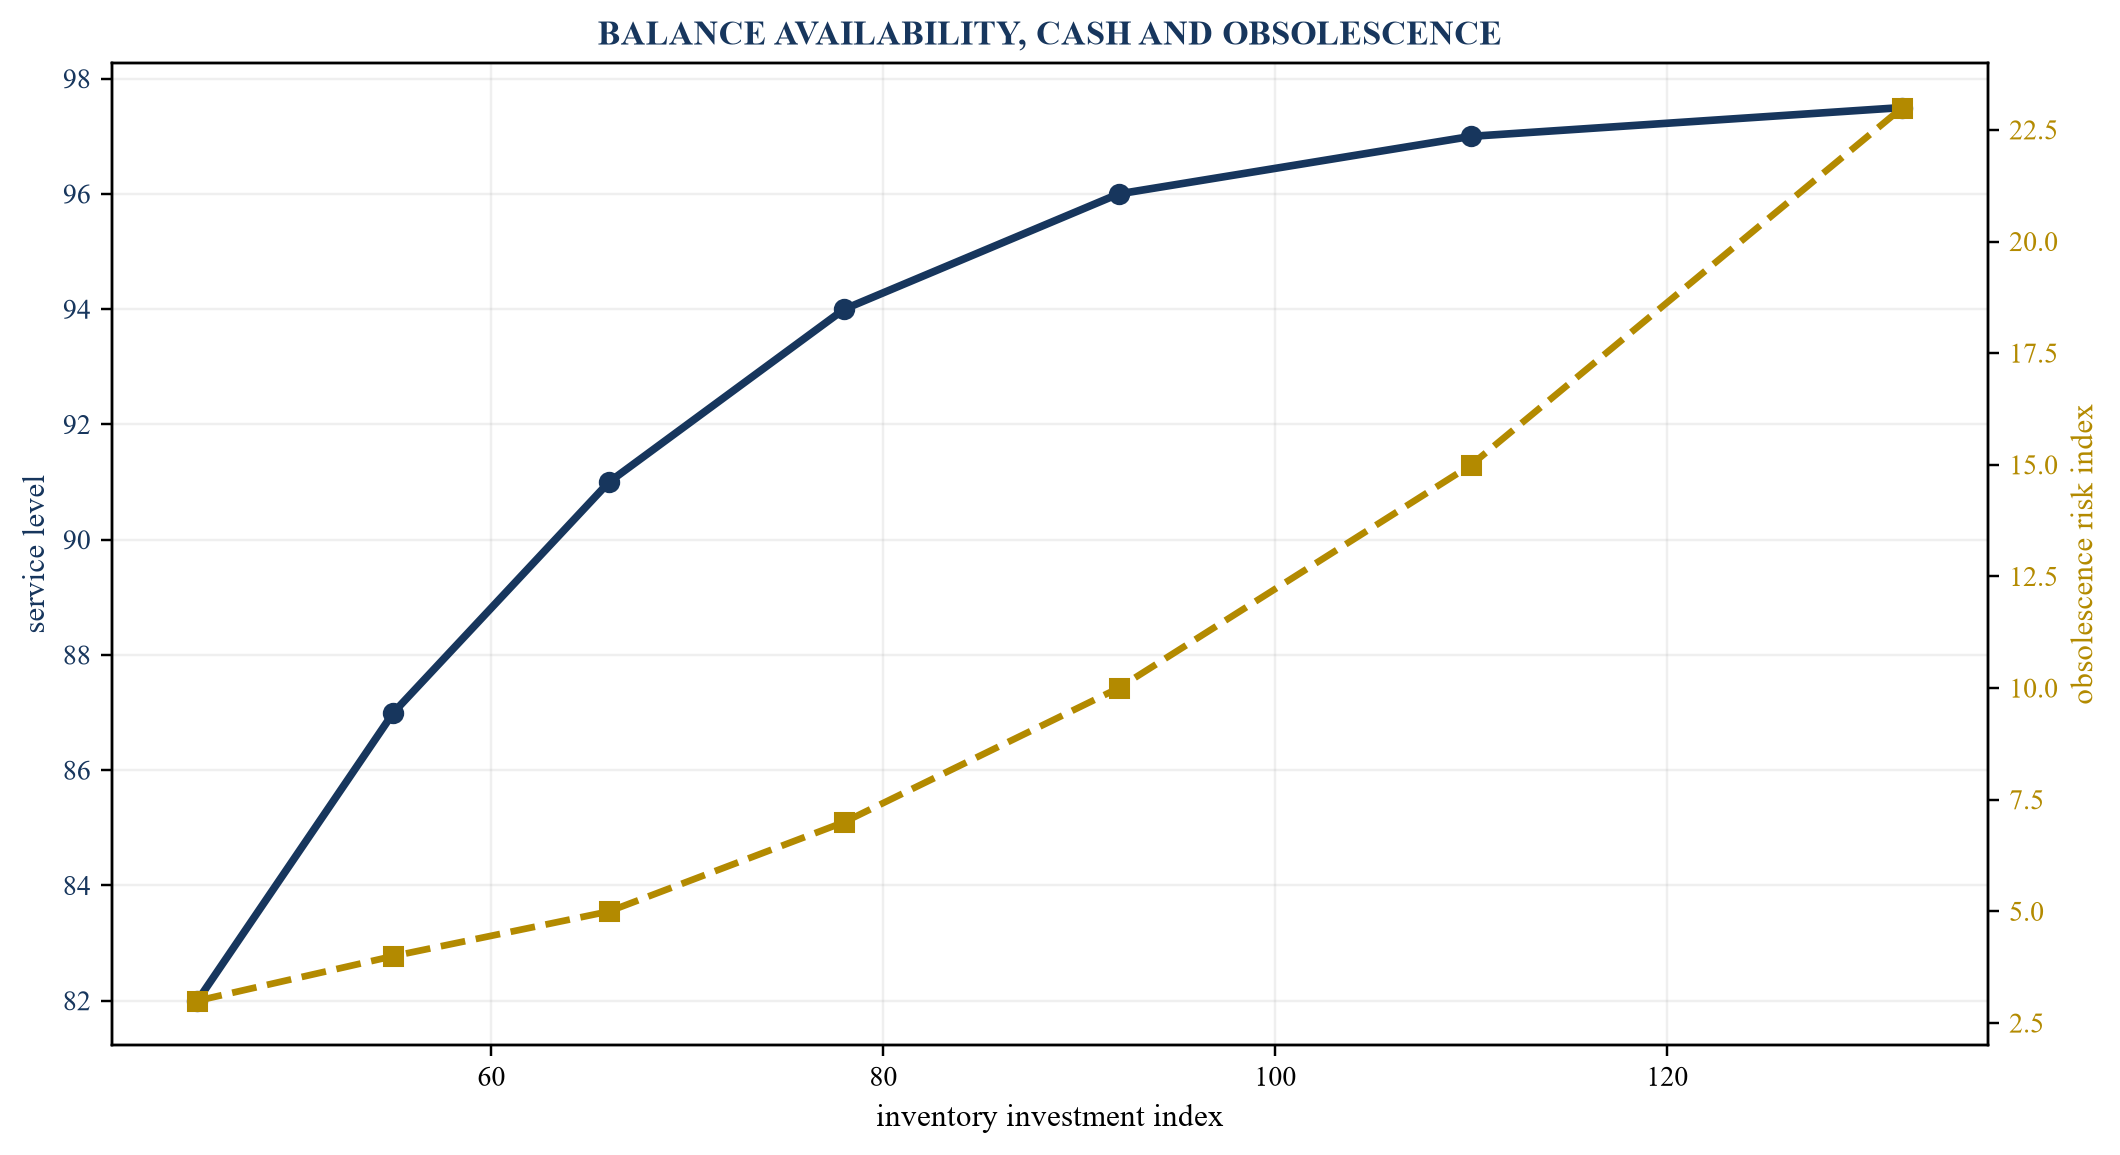
The efficient frontier should be estimated by service tier, location and demand regime.
The frontier should show the least inventory required for a defined service level under a stated demand and supply regime. It should be built by service tier, product-location pair and lead-time class. One corporate curve can conceal branches with excess stock and customers with chronic shortages.
Safety stock should reflect demand variability, lead-time variability, review cycle, order constraints, substitution and required service. Model uncertainty should be included rather than replaced by a point forecast. Scarcity, supplier unreliability and geopolitical disruption can justify resilience stock when the customer consequence is material.
The buyer should test whether service improvement converts to retention, price, share or avoided expediting. Inventory reduction should convert to cash without raising lost sales, emergency freight, split shipments or customer disruption. The efficient decision balances both sides.
Frontier analysis should include operating capacity. More stock does not improve service when receiving, put-away, picking, transport or customer-site replenishment is the bottleneck. Conversely, faster fulfilment can lower the stock required for a given promise. The model should therefore test inventory, labour, warehouse capacity, route frequency and supplier response together. Scenario outputs should show the customer groups and products that bear any deterioration. A corporate average can remain stable while critical accounts experience a material decline, creating hidden retention and liability exposure.
19. Evaluate demand forecasts economically
Forecast accuracy should be assessed at the decision level and horizon used for replenishment. Weighted absolute error, bias, quantile loss and service-weighted measures can complement common percentage errors that fail on intermittent demand. Accuracy should be segmented by product, location, lifecycle and demand regime.
An economically useful forecast reduces shortage, excess, expediting or planning effort after ordering constraints and supplier behaviour. The evaluation should simulate or observe actual policy outcomes rather than assume every error improvement creates equal value. Large errors on critical or high-contribution items can matter disproportionately.
Promotions, projects, outages, customer shutdowns, acquisitions and product substitutions should be represented as events. Forecast overrides require reason codes and outcome review. A model that appears more accurate because planners correct it depends on that human system; labour and continuity should enter valuation.
20. Govern replenishment decisions
Replenishment should connect forecast, on-hand stock, open demand, inbound supply, lead time, minimum order, pack size, shelf life, capacity, supplier terms and service tier. Recommendations should be bounded by cash authority, storage, obsolescence and customer commitments. Transfers between locations may outperform new purchasing.
Approval thresholds should reflect value and consequence. Routine stable items can support greater automation; uncertain, high-value, hazardous, regulated or customer-specific stock requires review. The system should preserve the recommendation, user action, exception and resulting service and cash outcome.
Supplier constraints can invalidate an optimal policy. Allocations, unreliable dates, quantity discounts, rebates and cancellation rights should be modelled explicitly. A lower unit cost from bulk purchase can be offset by carrying cost, obsolescence and reduced flexibility. The buyer should test total landed and lifecycle economics.
21. Manage the long tail and intermittent demand
Industrial assortments can contain hundreds of thousands of items with sparse, irregular or location-specific demand. Conventional averages can produce false precision and unnecessary stock. The policy should distinguish stable consumption, intermittent maintenance demand, project demand, new items, superseded items and critical insurance stock.
The long tail should be segmented by customer consequence, substitutability, lead time, unit value, supplier reliability and information quality. Some products should be stocked centrally, sourced on demand, substituted, consigned, returned to suppliers or removed. A model should recommend the service model as well as the quantity.
History may understate latent demand when prior stock-outs suppressed sales. Lost-quote, backorder, substitution and customer-search data can improve the demand view when definitions are controlled. The buyer should test whether the data survives system migration and whether the target owns the right to use it.
22. Integrate supplier lead time and reliability
Purchase-order dates can be poor evidence when confirmations change, partial deliveries occur or receipts are posted late. Lead-time models should preserve requested, confirmed, shipped, received and available dates, quantities and reasons. Supplier reliability should be measured by product and route, not only at vendor level.
The replenishment policy should use distributions rather than one average. Tail delay matters for service and safety stock. Supplier concentration, production location, logistics, customs, quality holds, payment terms and geopolitical exposure can create correlated risk across apparently separate products.
AI may identify early warning signals or alternative suppliers, yet qualification, contractual rights and technical compatibility determine actionability. A theoretical substitute without approval or available capacity does not protect service. The evidence should connect warning, decision, execution and avoided customer loss.
23. Convert inventory improvement into cash
Inventory reduction creates cash when purchases, transfers, returns, disposals and sales reduce the funded balance. A lower planning-system target is not cash. The bridge should reconcile opening stock, receipts, cost of sales, transfers, write-downs, disposals, currency and closing stock by location and category.
Working-capital value depends on supplier terms, customer collections, seasonality and financing cost. Lower inventory can be offset by earlier supplier payment, emergency purchases or slower customer service. The cash-flow model should preserve the timing of each component and avoid capitalising a one-time release as recurring earnings.
Buyers should distinguish structural working-capital improvement from a closing-date squeeze. Normalisation should reflect service commitments, growth, lead time and replenishment. Transaction documents may use a target or collar, yet the operating plan should protect the inventory required to sustain customer economics.
24. Govern obsolescence and net realisable value
Obsolescence analysis should combine age, demand, product lifecycle, supersession, return rights, customer commitment, alternative use, disposal cost and expected selling price. Slow movement alone does not prove impairment when an item protects a critical installed base; recent movement does not prove recoverability when price or specification has changed.
IAS 2 measures inventory at the lower of cost and net realisable value. The accounting assessment and the operating stocking decision are related and distinct. A model can inform expected demand and selling cost, while management retains responsibility for evidence, estimates, controls and disclosures under the applicable framework.
The buyer should test reserve history, subsequent sales, write-offs, supplier returns, scrap recovery and policy changes. AI-driven assortment expansion can defer recognition of weak stock by predicting future demand. Downside should include disposal, remediation, storage and customer support obligations.
25. Align sales adoption and incentives
Pricing and cross-sell tools create value through sales behaviour. Adoption should distinguish access, recommendation exposure, review, acceptance, override, customer presentation, order and sustained use. One adoption percentage can hide passive login or concentration among a few champions.
Incentives should reward realised pocket contribution, retention, cash and service rather than gross sales or accepted recommendations. Short measurement periods can encourage price increases, unnecessary products or inventory placement that later reverses. Quality and customer outcomes should share the scorecard.
Training should explain the economic logic, data limits, customer conversation and escalation path. Local feedback should enter product and data governance. A model that requires constant specialist intervention may still be valuable, but the labour, dependency and scale constraint should enter the valuation case.
26. Manage channel and account conflict
Industrial distributors may sell through branches, field sales, inside sales, ecommerce, marketplaces, integrators and customer-site inventory programmes. The same customer can appear across channels with different prices, service and ownership. AI recommendations can create conflict when they ignore account hierarchy or delegated rights.
The customer master should connect parent, site, buying group, contract, ship-to and payer. Channel attribution should reflect who originated, advised, fulfilled and retained the relationship. Incentives and price authority should avoid duplicate credit and uncontrolled undercutting.
Digital cross-sell can complement sales coverage by surfacing routine needs, while specialists focus on complex applications. The buyer should test whether channel migration lowers cost, improves availability and preserves relationship quality. A shift to online ordering is not automatically incremental revenue.
27. Make data quality an operating control
Product descriptions, units, pack sizes, cost, price, substitutes, customer identities, lead times and inventory balances are core economic data. Missing or inconsistent fields can create unsafe recommendations and false value. Data quality should have named owners, thresholds, remediation queues and financial consequences.
Lineage should connect model features to source systems, transformations and approvals. Manual spreadsheets, salesperson notes and supplier files may be material. The target should document refresh, validation, access, retention and failure handling. Acquisition integration should preserve the original baseline while mappings are rebuilt.
The buyer should reproduce selected recommendations from raw records. Sampling should cover normal, high-value, exception and failed cases. Reconciliations should include financial accounts, physical stock and customer documents. Unexplained differences belong in remediation cost and downside.
Data quality remediation should be prioritised by economic consequence. A missing product image may have limited financial effect, while an incorrect pack size, hazardous classification, substitute relationship or customer contract can cause loss, service failure or legal exposure. The data programme should connect each defect class to affected decisions, cash at risk, responsible owner and correction evidence. Post-close integration should use the same control so data migration progress reflects usable commercial records rather than the percentage of fields technically transferred.
28. Validate models and decision controls
Validation should cover accuracy, calibration, bias, robustness, drift, explainability where required, workflow fit and economic outcome. Test data should be distinct from development data and representative of deployment. Thresholds should reflect customer and financial consequence.
Model inventory should identify owner, purpose, version, training data, dependencies, limits, approvals, users and monitoring. Overrides, incidents and retraining should link to the production version. Vendor models require sufficient documentation, audit rights, service commitments and exit arrangements.
Monitoring should combine technical and commercial indicators. Prediction error, confidence, rejection, exception, price dispersion, churn, stock-outs, excess stock and realised cash can reveal deterioration. Triggered actions may include review, narrower scope, rollback, retraining or suspension.
29. Protect cyber, privacy and operational resilience
Pricing, customer and inventory systems can expose confidential contracts, demand, stock, supplier terms and personal data. Controls should include identity, least privilege, segmentation, encryption, secure development, logging, change approval, backups, recovery and incident response. Interfaces to ecommerce, warehouse and customer systems require particular scrutiny.
Prompt injection, poisoned catalogues, compromised credentials, malicious supplier files and model or vendor outages can alter decisions. Human approval should match consequence. Fallback rules should preserve fulfilment and price integrity when the model or data is unavailable.
The buyer should test recovery, data portability and vendor substitution. A nominal second provider is not resilience when switching requires months of integration. Insurance, liability limits and contract exclusions can leave material cash exposure.
30. Build the operating value bridge
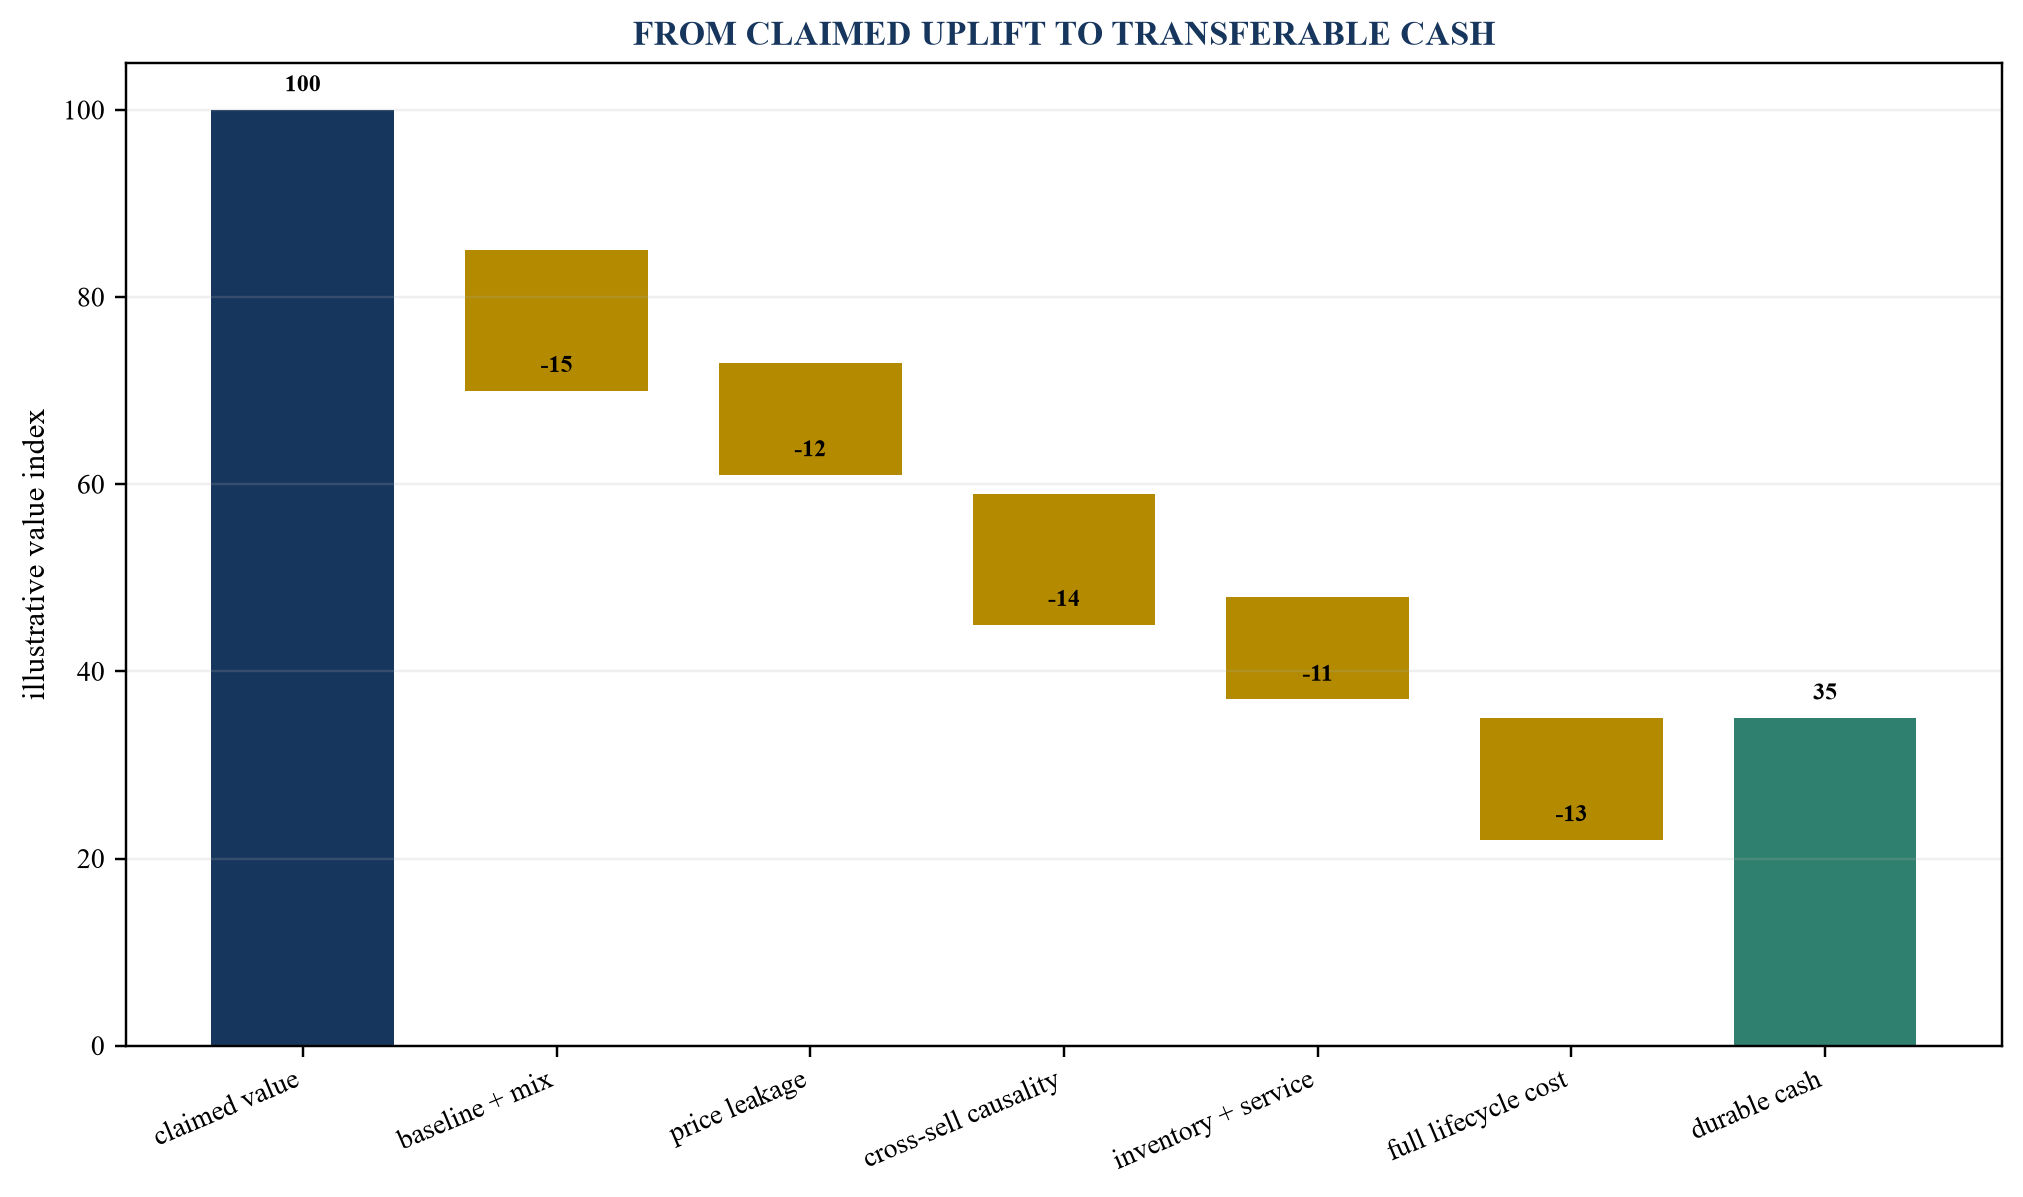
Illustrative adjustments should be replaced with controlled operating and financial evidence.
The bridge should begin with the claimed uplift and deduct unsupported baseline, mix, attribution, adoption, customer response, service leakage, working capital, implementation, recurring cost and residual risk. It should be built by use case and consolidated without double counting.
Price, cross-sell and inventory interact. Higher price can reduce demand and stock; better availability can support price and retention; cross-sell can require new inventory. Separate models can count the same customer or product benefit more than once. The consolidated case should preserve shared dependencies and capacity constraints.
Observed recurring cash can support base valuation when it transfers and persists. Funded improvements may enter a probability-weighted case. Uncommitted concepts belong in option value or a separate upside case.
Timing should be explicit. Price benefit can appear quickly and then fade at renewal; cross-sell can require several replenishment cycles before repeatability is known; inventory release can create immediate cash while service consequences emerge later. The valuation bridge should align each benefit with the evidence period, implementation sequence and review gate. It should also separate one-time cash, recurring earnings and terminal assumptions. A working-capital release should not be multiplied as EBITDA, and a recurring margin claim should not include the same inventory benefit twice through cost and cash.
31. Select the valuation method
Discounted cash flow can model incremental revenue, contribution, inventory, implementation, tax, risk and terminal value by use case. Comparable-company and transaction multiples can provide a market cross-check, while differences in product mix, service model, customer concentration, inventory intensity and digital maturity require explanation.
The method should follow the economic source of value. A technology-asset method may be useful when rights and cash can be isolated. Relief-from-royalty, excess-earnings, replacement-cost and option approaches require method-specific evidence and should not double-count benefits already in forecast cash.
Terminal assumptions should include continuing investment in data, models, integration, cyber, skills and commercial differentiation. A temporary algorithmic advantage should not support perpetual margin. Scenarios should align adoption, customer response, service, cost and reinvestment.
32. Prepare buyer diligence
The request should cover customer and product masters, order lines, quotes, price changes, discounts, contracts, rebates, freight, returns, complaints, recommendations, overrides, inventory, stock-outs, forecasts, purchase orders, receipts, suppliers, lead times, model inventory, incidents, costs, users and financial reconciliations.
Samples should include successful, weak, exception and failed periods. Native records, version history and timestamps should be preserved. Curated demonstrations should reconcile to production logs, customer documents, inventory movements and cash.
Interviews should include commercial, pricing, sales, product, procurement, planning, warehouse, finance, technology, security, legal and customer-facing owners. Inconsistent definitions should be resolved before valuation. An independent reviewer should reproduce selected claims end to end.
33. Build coherent downside cases
Downside should combine causally related events. Price recommendations can reduce retention; cross-sell can increase returns and inventory; forecast error can raise stock-outs, expediting and customer loss. Vendor price increases, regulation, data restrictions, integration delay and staff turnover can affect several use cases together.
Scenarios should stress benefit, timing, implementation, service, working capital, supplier reliability, competition, quality and remediation. A probability-weighted case should not imply precision unsupported by evidence. Liquidity should cover the path through delayed or failed rollout.
Management cases should be compared with observed ranges and independent evidence. The buyer should identify stop, narrow, redirect and rollback decisions. Flexible contracts and modular architecture can reduce downside when commitments are not fixed.
34. Use transaction structure for evidence gaps
Earn-outs, holdbacks, staged consideration, warranties, indemnities, escrows, covenants and closing conditions can allocate specific uncertainty. Metrics should be defined from controlled records and resist manipulation after closing. Gross revenue alone can reward discounting or low-quality cross-sell.
A margin or cash metric can be affected by integration allocations, inventory policy and buyer decisions. The agreement should define perimeter, accounting, cost, working capital, customer losses, management control, audit and dispute resolution. Rights to data, models, vendor support and key staff may require conditions or transitional arrangements.
Structure should reflect evidence and legal feasibility. Fundamental service, safety, data-right or competition issues may require remediation before closing. The valuation case and transaction documents should use consistent definitions.
35. Create the buyer data room
Table 3. Buyer diligence data room for AI-enabled distribution
| Workstream | Priority evidence | Reproduction test |
|---|---|---|
| pricing | quote, waterfall, approval and invoice | recreate realised pocket contribution |
| cross-sell | exposure, control, order and repurchase | estimate incremental contribution |
| inventory | forecast, policy, movement and service | reproduce stock and service outcome |
| technology | models, data, versions and interfaces | rerun representative decisions |
| finance | ledgers, rebates, working capital and cash | reconcile benefit to accounts |
| governance | rights, overrides, incidents and controls | identify accountable owners |
Completeness should be tested against the transaction perimeter and valuation date.
The data room should preserve native files, ownership, dates, definitions and version history. Summaries should link to source records. Access should protect confidential customer, supplier, employee and regulated information.
Completeness tests should reconcile customer, product, location and period populations. Missing orders, rejected recommendations, cancelled lines and stock-out demand can bias benefit. The buyer should maintain an issue ledger that links each gap to price, protection, remediation, integration or a stop decision.
36. Classify buyer adjustments
Table 4. Buyer treatment of distribution value claims
| Claim class | Required evidence | Illustrative treatment |
|---|---|---|
| realised price cash | reconciled waterfall and retained volume | base earnings or cash flow |
| evidenced cross-sell | controlled incremental contribution and repeat | risk-adjusted forecast |
| inventory release | cash bridge with service protected | one-time cash adjustment |
| funded operating plan | owners, milestones, cost and capacity | probability and timing adjustment |
| buyer synergy | buyer-specific capability and cost | separate synergy case |
| unresolved risk | customer, data, model or stock exposure | downside, reserve or structure |
Treatment follows evidence, transferability and durability.
Classification should remain consistent across commercial diligence, quality of earnings, valuation, financing and transaction documents. Re-labelling a forecast as run-rate should not change its evidence requirements.
Each adjustment should identify amount, owner, source, period, sensitivity, transferability and expected review date. This creates a defensible bridge from diligence to price and then to post-close accountability.
37. Design board and integration reporting
Reporting should connect customer, product, location, price, recommendation, inventory, service, cost and cash. Definitions, cut-offs and reconciliations should remain stable. Cohorts, model versions and overrides should be visible.
The board should see concentration by account, category, branch, supplier, use case and value driver. Leading indicators can include adoption, recommendation quality, forecast bias, service and data health. Lagging indicators should include pocket contribution, retention, working capital, write-downs and cash.
Integration reporting should preserve the target baseline and identify buyer actions separately. This supports fair earn-out measurement, synergy analysis and learning. Material incidents, customer losses and model changes should have decision rights and escalation.
38. Execute a one-hundred-day plan
Table 5. One-hundred-day distribution value plan
| Period | Primary work | Decision gate |
|---|---|---|
| days 1–30 | freeze perimeter, baseline, rights, models and reconciliations | confirm operating truth |
| days 31–60 | reproduce price, cross-sell, service and cash outcomes | approve capitalisable cases |
| days 61–100 | implement controls, ownership and funded actions | move to board reporting |
Sequence should reflect transaction timing, customer risk and evidence gaps.
The first month should preserve source records, confirm customer and product identities, reconcile price and inventory, secure critical rights and identify urgent customer or cyber risk. Existing models should remain controlled while evidence is rebuilt.
The second phase should reproduce representative outcomes and quantify the consolidated value bridge. The final phase should implement approved actions with owners, funding, thresholds, training, monitoring and stop rules. Expansion should follow evidence and capacity.
39. Identify red flags
Red flags include list-price uplift presented as realised margin, gross sales without pocket contribution, recommendations without controls, selected success cases, missing overrides, cross-sell without retention, forecast accuracy without policy outcomes, inventory reduction without service evidence and a terminal margin without reinvestment.
Other signals include duplicate masters, unexplained cost changes, non-transferable licences, weak data rights, shared pricing vendors without safeguards, stock balances that do not reconcile, unsupported AI marketing, unresolved incidents and forecasts that exceed observed adoption.
A red flag is a diligence prompt. Its valuation effect depends on evidence, materiality, remediation and transaction protection. Clusters of related red flags may indicate that the operating system is not reproducible after closing.
40. Conclusion
Industrial-distribution AI should be valued through a controlled path from customer-product-location decisions to cash. Pricing must pass through the realised waterfall; cross-sell must be incremental, relevant and retained; inventory must balance service, working capital and obsolescence.
The practical standard is reproducibility. An independent reviewer should be able to recreate the commercial unit, baseline, recommendation, action, outcome, cost and cash consequence. Full lifecycle cost, customer response, supplier constraints, data rights, adoption and model governance determine how much value transfers and persists.
Strong evidence can support efficient pricing, focused investment and targeted transaction structure. Weak evidence should reduce value, increase protection or delay recognition. The resulting system gives buyers and operators one language for diligence, valuation, integration and board accountability.
For transaction committees, the final output should be a concise bridge from management claim to buyer treatment, supported by an auditable evidence pack. It should state what is observed, what remains dependent on action, which benefits transfer, what reinvestment sustains them and how downside is protected.
References
- United States Census Bureau, Monthly Wholesale Trade Report, https://www.census.gov/wholesale/current/index.html
- United States Securities and Exchange Commission, Fastenal Company Annual Report on Form 10-K for 2025, https://www.sec.gov/Archives/edgar/data/815556/000081555626000009/fast-20251231.htm
- United States Securities and Exchange Commission, W.W. Grainger Annual Report on Form 10-K for 2025, https://www.sec.gov/Archives/edgar/data/277135/000027713526000011/gww-20251231.htm
- IFRS Foundation, IAS 2 Inventories, https://www.ifrs.org/issued-standards/list-of-standards/ias-2-inventories/
- IFRS Foundation, IFRS 15 Revenue from Contracts with Customers, https://www.ifrs.org/issued-standards/list-of-standards/ifrs-15-revenue-from-contracts-with-customers/
- IFRS Foundation, IFRS 13 Fair Value Measurement, https://www.ifrs.org/issued-standards/list-of-standards/ifrs-13-fair-value-measurement/
- National Institute of Standards and Technology, Artificial Intelligence Risk Management Framework 1.0, https://www.nist.gov/publications/artificial-intelligence-risk-management-framework-ai-rmf-10
- National Institute of Standards and Technology, AI RMF Playbook, https://www.nist.gov/itl/ai-risk-management-framework/nist-ai-rmf-playbook
- United States Federal Trade Commission, Surveillance Pricing Study Initial Findings, https://www.ftc.gov/news-events/news/press-releases/2025/01/ftc-surveillance-pricing-study-indicates-wide-range-personal-data-used-set-individualized-consumer
- United States Federal Trade Commission, Issue Spotlight: The Rise of Surveillance Pricing, https://www.ftc.gov/system/files/ftc_gov/pdf/sp6b-issue-spotlight.pdf
- United Kingdom Competition and Markets Authority, Pricing Algorithms and Competition Law, https://competitionandmarkets.blog.gov.uk/2024/11/08/pricing-algorithms-and-competition-law-what-you-need-to-know/
- United Kingdom Competition and Markets Authority, AI and Collusion: Frontiers, Opportunities and Challenges, https://competitionandmarkets.blog.gov.uk/2026/03/04/ai-and-collusion-frontiers-opportunities-and-challenges/
- United Kingdom Competition and Markets Authority, Dynamic Pricing Project, https://www.gov.uk/cma-cases/dynamic-pricing-project
- United Kingdom Competition and Markets Authority, Price Transparency Guidance, https://www.gov.uk/government/publications/price-transparency-cma209
- European Union, Regulation (EU) 2024/1689 laying down harmonised rules on artificial intelligence, https://eur-lex.europa.eu/eli/reg/2024/1689/oj
- European Commission, Guidelines on prohibited artificial intelligence practices, https://digital-strategy.ec.europa.eu/en/library/commission-publishes-guidelines-prohibited-artificial-intelligence-ai-practices-defined-ai-act
- United Kingdom Information Commissioner's Office, Guidance on AI and data protection, https://ico.org.uk/for-organisations/uk-gdpr-guidance-and-resources/artificial-intelligence/guidance-on-ai-and-data-protection/
- Organisation for Economic Co-operation and Development, The Impact of Artificial Intelligence on Productivity, Distribution and Growth, https://www.oecd.org/en/publications/the-impact-of-artificial-intelligence-on-productivity-distribution-and-growth_8d900037-en.html
- Bank for International Settlements, AI Adoption, Productivity and Employment: Evidence from European Firms, https://www.bis.org/publications/working-paper-1325-ai-adoption-productivity-and-employment-evidence-european-firms
- Brynjolfsson, Li and Raymond, Generative AI at Work, NBER Working Paper 31161, https://www.nber.org/papers/w31161
- United States Census Bureau, Quarterly Financial Report, https://www.census.gov/econ/qfr/
- International Valuation Standards Council, International Valuation Standards, https://ivsc.org/standards/
- International Organization for Standardization, ISO/IEC 42001 Artificial intelligence management systems, https://www.iso.org/standard/81230.html
- National Institute of Standards and Technology, Cybersecurity Framework 2.0, https://www.nist.gov/cyberframework
- United States Securities and Exchange Commission, Remarks at the Roundtable on Artificial Intelligence in the Financial Industry, https://www.sec.gov/newsroom/speeches-statements/uyeda-ai-roundtable-032725
- United States Federal Trade Commission, Keep Your AI Claims in Check, https://www.ftc.gov/business-guidance/blog/2023/02/keep-your-ai-claims-check
