

1. Define the transaction decision
The analysis should begin with the decision being made. Acquisition pricing, sell-side preparation, fairness analysis, growth investment, debt underwriting and post-merger value creation require different evidence and risk allocation. The valuation date, transaction perimeter, ownership change, forecast horizon, funding structure and expected integration should be explicit.
The central question is how much incremental, transferable and durable cash arises from defined AI-enabled workflows after all costs, risks and commercial responses. A model demo, user licence count or task-time reduction does not by itself establish enterprise margin.
Evidence should be frozen at a defined date. Resolvable gaps belong in diligence; residual uncertainty belongs in scenarios, structure, holdbacks, covenants or price. Observed outcomes, approved initiatives and aspirational use cases should remain separate.
2. Establish the economic and control perimeter
The perimeter should identify the business units, legal entities, workflows, products, geographies, employees, vendors, data, models, software, infrastructure and contracts included in the claimed uplift. Shared services and related-party arrangements require transparent allocation.
Control matters. The target may own code and data, licence a model, consume a software service or depend on a founder, integrator or customer system. Benefits that require non-transferable rights or informal access can disappear after closing.
The economic perimeter should reconcile revenue, labour, contractors, cloud, licences, implementation, data, governance, security, compliance, remediation, working capital and capital expenditure. Savings outside the acquired perimeter should not enter target value without an enforceable mechanism.
3. Build the AI value evidence ledger
Table 1. AI margin evidence ledger
| Layer | Controlled evidence | Buyer question |
|---|---|---|
| workflow | process, volume, people, systems and control | what activity changed? |
| intervention | model, release, users, timing and adoption | what caused the change? |
| outcome | time, throughput, error, quality and revenue | what was observed? |
| cost | build, licence, compute, data, change and control | what did the outcome cost? |
| cash | payroll, supplier, price, volume and working capital | what reached cash flow? |
| durability | rights, adoption, drift, competition and regulation | what survives ownership change? |
Each value claim should link to a controlled baseline, operating record, owner and cash consequence.
The ledger should preserve source, definition, unit, period, population, version and approver. Corrections should retain the original record. Management estimates should be labelled inside the transaction workpapers even when reader-facing reports use plain-language scenario descriptions.
A buyer should be able to select a valuation adjustment and trace it backwards through cash, operating outcome, intervention, baseline and underlying data. Broken links should enter the downside case.
4. Define the AI-enabled workflow
The workflow should be described before the model. Inputs, decisions, outputs, controls, handoffs, exceptions, customer effects and accountable roles determine whether a technical capability changes enterprise economics.
Use cases can include customer support, sales assistance, coding, document processing, forecasting, fraud detection, maintenance, quality control, pricing and product design. Each has different latency, accuracy, human-review, liability and adoption requirements.
The buyer should identify the constrained step. Faster drafting has limited value when approval, customer acquisition or implementation remains the bottleneck. Value follows the end-to-end workflow rather than the isolated task.
5. Freeze the baseline protocol
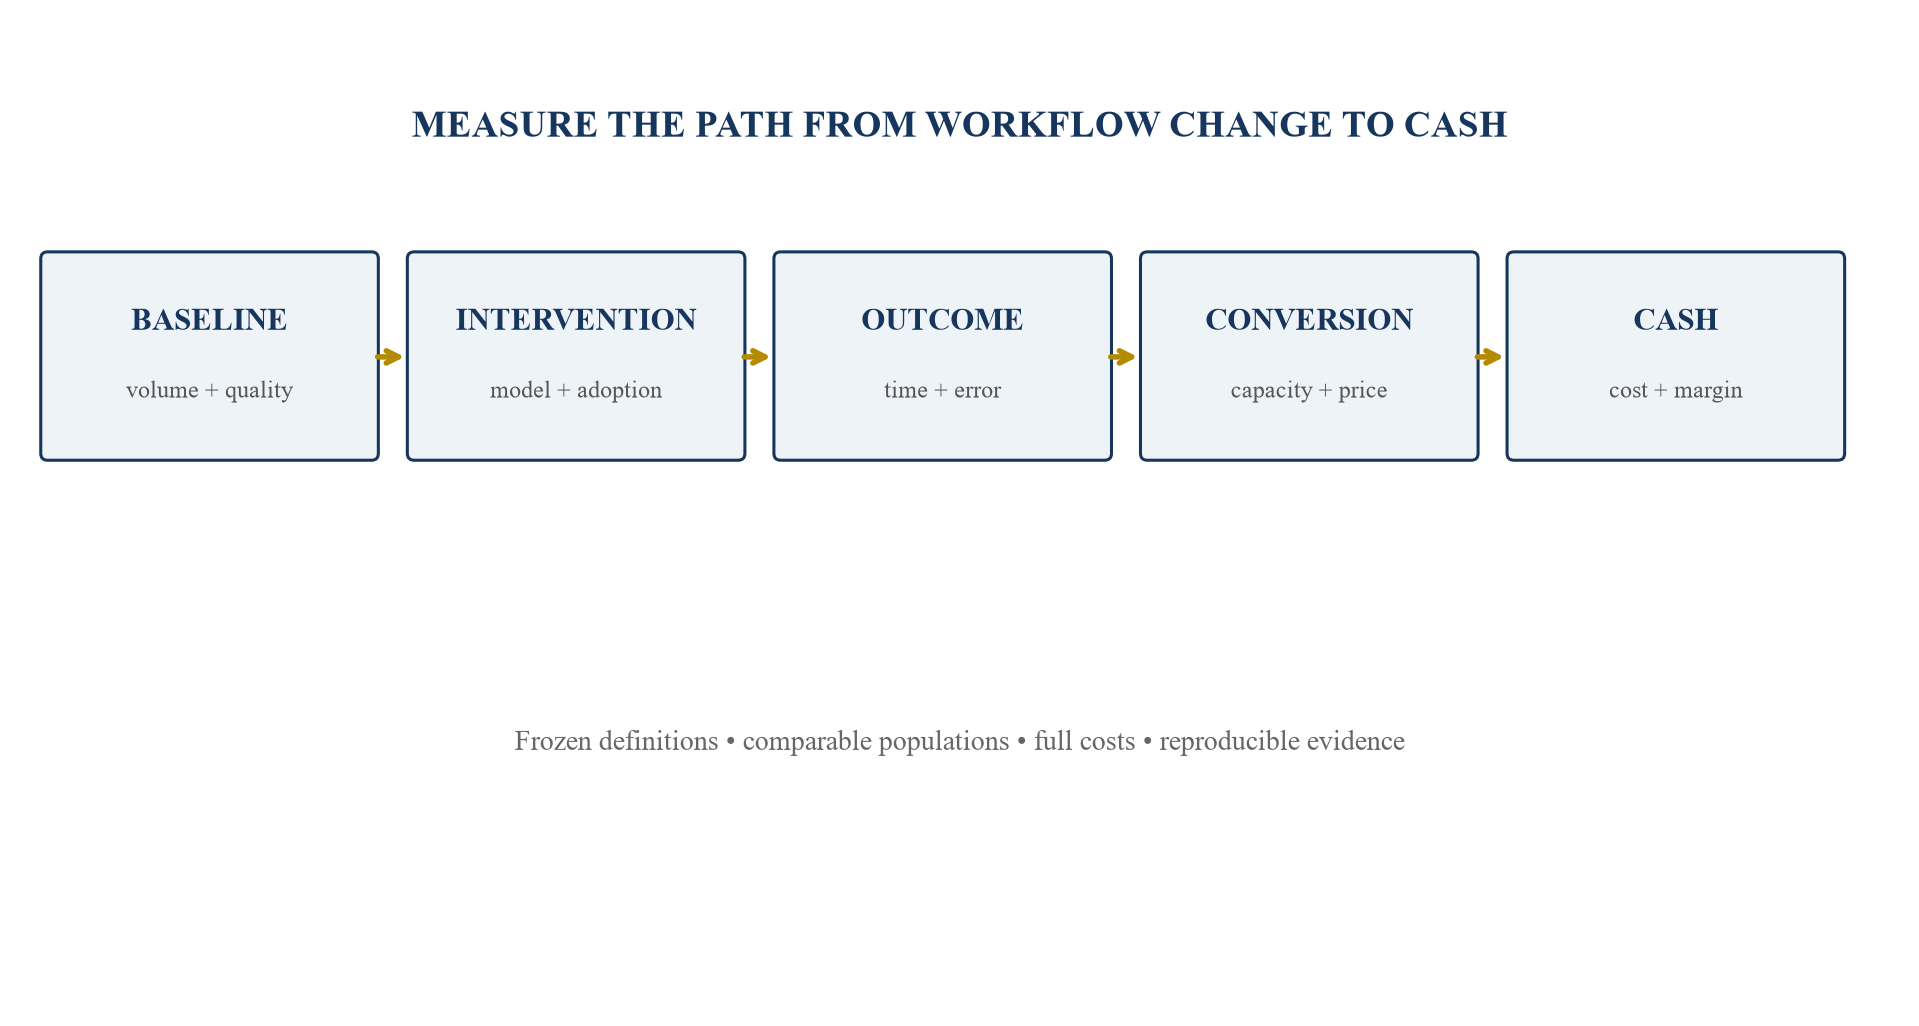
The protocol should be adapted to the workflow, decision horizon and available counterfactual.
The baseline should state the period, population, volume, service level, quality, mix, staffing, cost, price, system and exceptional events. It should use definitions that can be reproduced from source records.
Seasonality, growth, backlog, inflation, restructuring and other technology changes can move the same metrics. The protocol should define adjustments before results are inspected. A convenient prior month is rarely a sufficient counterfactual.
Baseline governance should identify who can alter definitions and how restatements are approved. Source-system changes, reorganisations and revised allocation rules can make later periods appear better without an operating gain. The buyer should retain both the reported baseline and a transaction-normalised version, with a bridge between them. Financial measures should reconcile to the relevant ledger accounts; operational measures should reconcile to controlled event records. Sampling may be proportionate for high-volume activity, subject to representative design and exception testing.
Capacity and quality should share the same boundary. If baseline handling time excludes research, escalation or after-call work while the AI period includes only the model-assisted step, the comparison is biased. Queueing and demand effects also matter: lower handling time during weak demand can leave throughput unchanged. The protocol should therefore measure end-to-end completion, backlog, service level and resource utilisation alongside task time. Any assumed future baseline deterioration, such as wage inflation or rising volume, should remain a forecast driver rather than contaminate observed uplift.
6. Select an identification method
Randomised rollout, phased adoption, matched control, difference-in-differences, interrupted time series and controlled before-and-after analysis offer different levels of causal evidence. The method should fit operating constraints and data quality.
Selection bias matters because stronger teams or more enthusiastic users often adopt first. Comparing adopters with non-adopters can therefore attribute pre-existing performance differences to AI. Spillovers can contaminate the control group when users share outputs or practices.
The analysis should report effect size, uncertainty, duration and population. Statistical significance does not establish financial materiality, and a material estimate with weak identification should receive a larger valuation range.
Randomisation can occur at user, team, customer, case or time-window level. The unit should reflect spillover and operational independence. Clustered assignment may reduce contamination and also reduce statistical power. Phased rollout can be practical when implementation capacity is limited, provided timing is not selected by expected performance. Difference-in-differences requires evidence that treatment and control would have followed comparable trends absent the intervention. Event-study plots can expose pre-trends and delayed effects.
The diligence team should inspect attrition, missing records, treatment non-compliance and changes to metric collection. Intention-to-treat estimates measure the effect of offering the tool; treatment-on-the-treated estimates require stronger assumptions and can be useful for a future adoption case. Multiple outcomes and repeated model tuning increase the chance of selective positive results. The report should state pre-specified measures, sensitivity tests and negative outcomes. Where controlled identification is impossible, triangulation across time, teams, systems, interviews and cash provides a more honest evidence range than a single precise percentage.
7. Separate task productivity from enterprise productivity
Task time can decline without reducing cost or increasing revenue. Employees may use released time for review, coordination, customer work, learning or idle capacity. Headcount can remain fixed while service improves.
The NBER field study of a generative assistant for customer-support agents reported an average productivity increase with substantial heterogeneity by experience. This is evidence for a specific workflow and setting. It is not an automatic margin assumption for another company.
The buyer should map task gain through workflow throughput, bottleneck, utilisation, capacity decision and cash. The weakest conversion link limits capitalisable value.
Enterprise productivity should use an output denominator that reflects customer or business value. Documents produced, lines of code or contacts attempted can rise while accepted releases, customer conversion or contribution stagnates. Output mix should be controlled because simpler work can migrate toward the measured population after rollout. A buyer can examine distributions, not only means: variance, tail errors and escalation can reveal costs hidden by average speed.
Released capacity has several uses. It can absorb growth without hiring, reduce overtime or contractors, support a service improvement, shorten lead time, increase selling activity or permit workforce reduction. Each path has different timing, cost and certainty. The financial model should select an explicit route by cohort and period. It should also preserve capacity required for review, learning, resilience and demand peaks. When management plans redeployment, the receiving activity should have demand, accountability and a measurable contribution; otherwise the saving remains an operational opportunity.
8. Measure adoption by cohort
Adoption should distinguish licence assignment, login, eligible use, active use, accepted output, compliant use and sustained workflow integration. One aggregate user percentage can hide inactive licences and concentrated power users.
Cohorts should be defined by start date, role, location, manager, baseline performance, workflow and model version. Retention curves can show whether initial experimentation becomes durable practice.
Benefits often differ by experience. A buyer should avoid applying the strongest novice cohort result to every employee. Cohort-weighted outcomes should use the future workforce mix.
9. Build the adoption-to-value curve
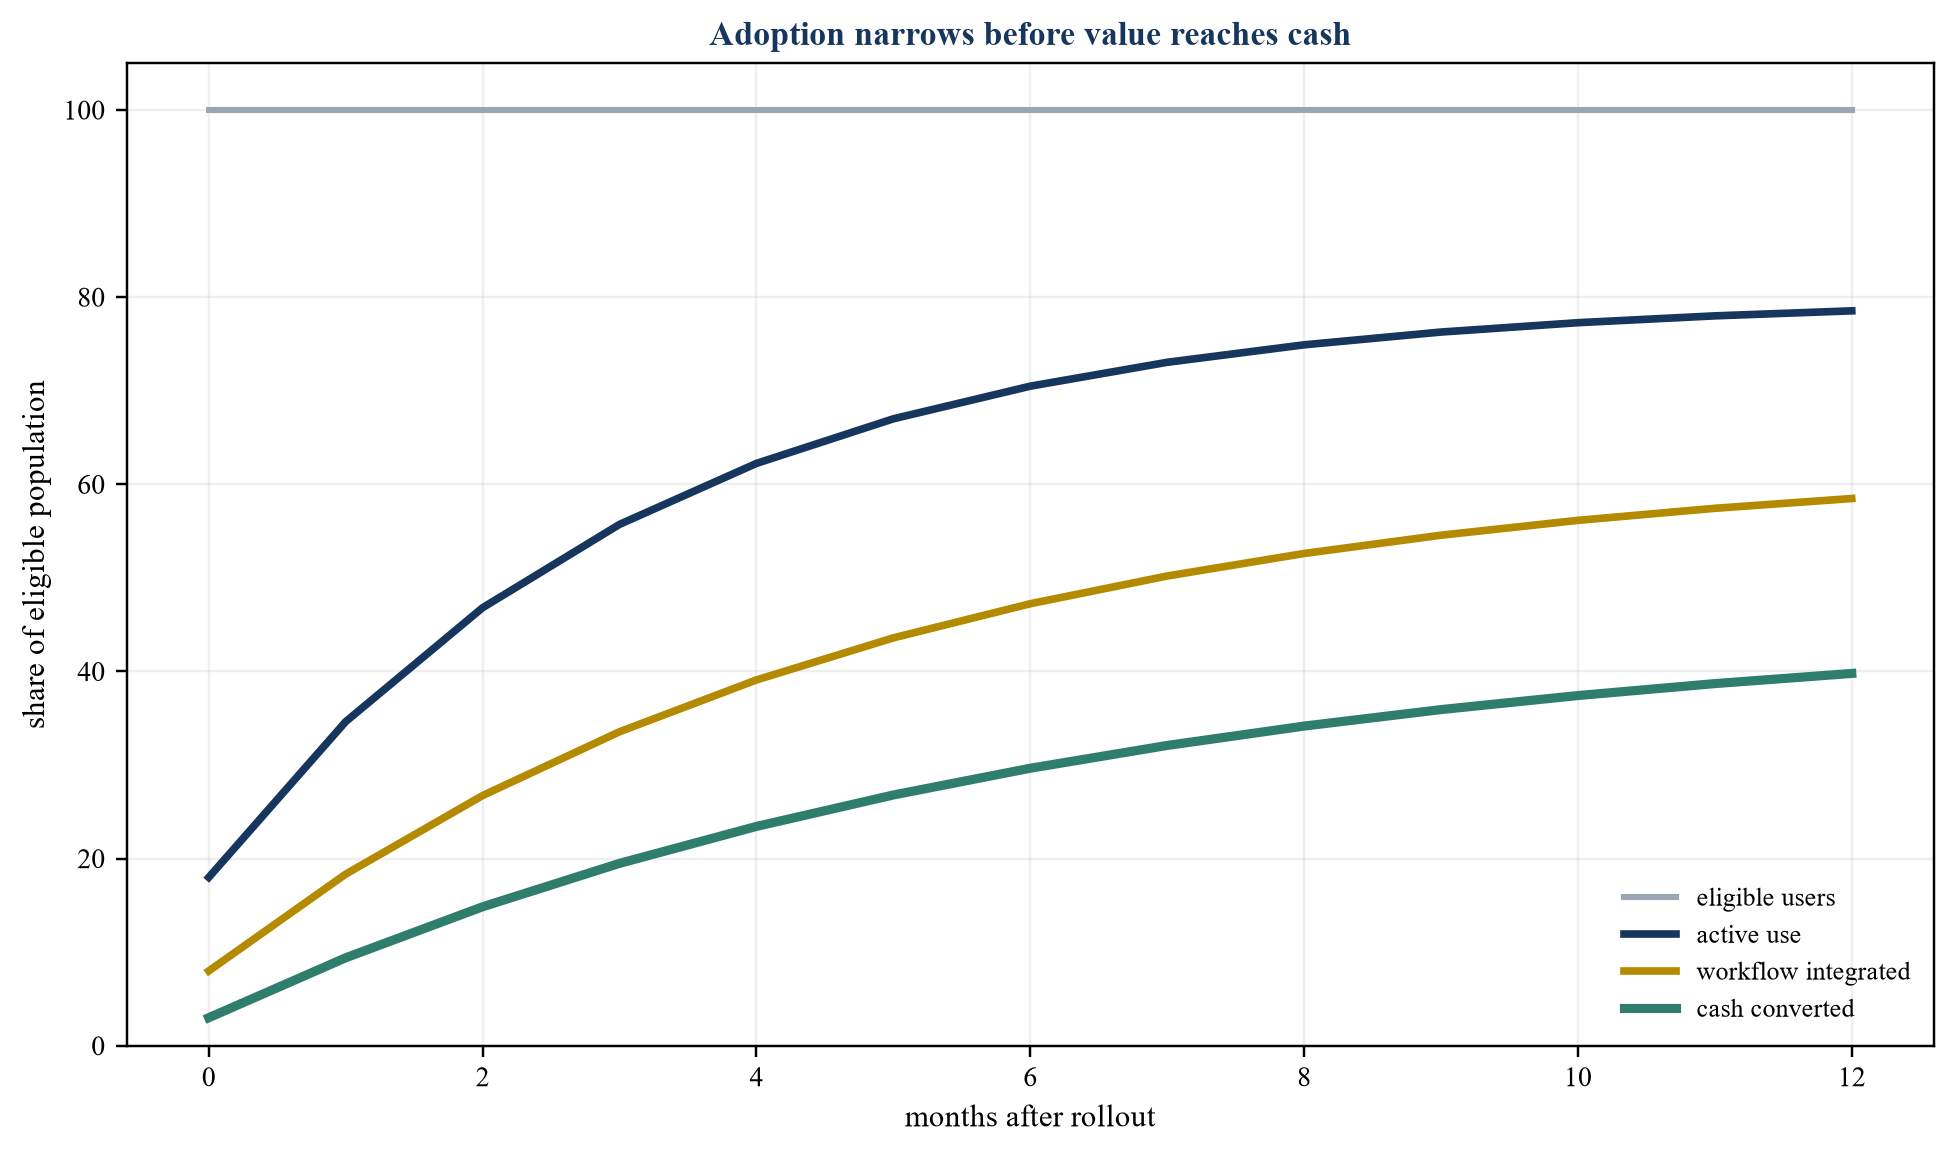
Replace the curve with observed eligible users, sustained adoption, workflow use and cash conversion.
The conversion curve should reconcile eligible population to active, integrated and cash-converting use. Drop-off can arise from access, trust, training, quality, latency, policy, manager support or workflow mismatch.
Forecast adoption should use observed transition rates and planned interventions. A sudden move to full adoption without training, process redesign or incentives deserves explicit downside.
10. Define the outcome hierarchy
Outcomes should be classified as input, activity, operational result, customer result and cash. Licences and prompts are inputs; completed tasks and accepted suggestions are activity; time, error and throughput are operational results; retention and conversion are customer results; payroll, price, volume and working capital reach cash.
Leading indicators can support management action and should not be capitalised as if cash has already occurred. The valuation bridge should state the conversion assumption between each layer.
Quality and risk sit alongside speed. Faster output that increases correction, complaint, rework or liability can destroy the apparent gain.
11. Reconcile the savings bridge
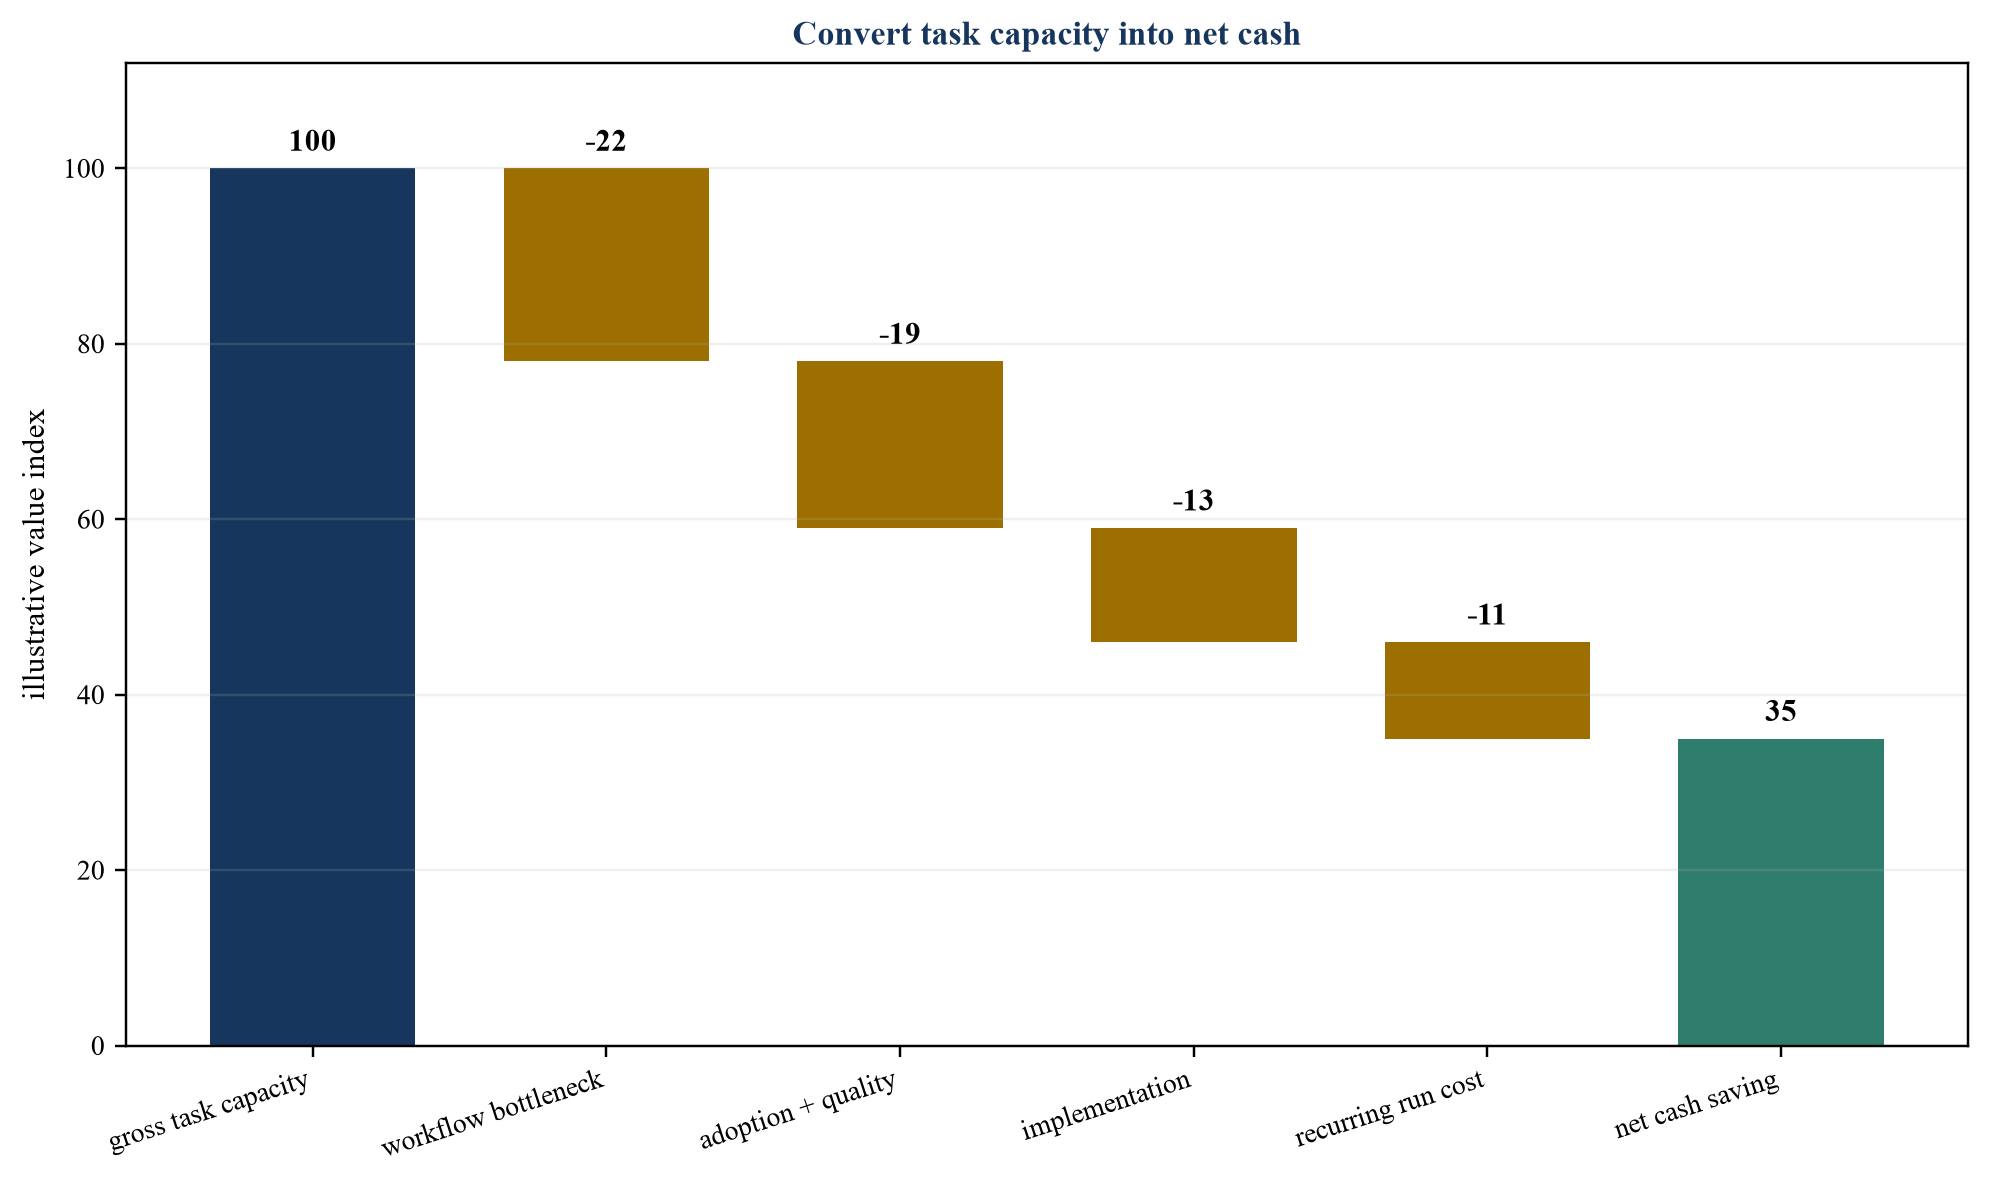
Values are illustrative; transaction adjustments should come from controlled operating and financial records.
The bridge should begin with observed task capacity and deduct bottlenecks, incomplete adoption, quality loss, implementation and recurring cost. It should then identify the approved action that converts capacity to cash.
Savings should not be counted twice through both reduced headcount and increased output unless the workflow can support both. The bridge should reconcile to the financial forecast and cash-flow statement.
Gross task capacity should be calculated from eligible volume, observed time change and quality-adjusted completion. It should exclude work that the model cannot handle, cases rejected by users and capacity consumed by prompt preparation, review and remediation. Workflow conversion then applies the constrained step, staffing schedule, service level, demand and management action. Financial conversion applies wage, contractor, supplier or contribution economics at the actual marginal rate rather than average revenue per employee.
The bridge should reconcile period by period. Implementation can create an initial productivity dip while training and integration occur. Savings can ramp with adoption and then fade through competition or model change. Severance, contract termination, duplicated systems and retention measures can delay payback. The buyer should show gross benefit, cost, net cash and cumulative investment, together with the point at which the programme becomes self-funding. This prevents a steady-state run-rate from being treated as current earnings.
12. Distinguish realised, avoided and forecast cost
Realised cost reduction appears in payroll, contractor, supplier or other cash records after implementation. Avoided cost is a credible future spend that the company no longer needs. Forecast saving depends on an action that has not completed.
Avoided hiring requires an approved workforce plan, demand forecast and evidence that service can be delivered without the role. A vacancy or management ambition does not establish avoided cash.
Valuation should give the strongest treatment to recurring realised cash, then evidence-backed avoided cost, then risk-adjusted forecast benefit. Option value belongs outside base earnings unless a transaction method explicitly prices it.
13. Test workforce conversion
The workforce bridge should reconcile full-time-equivalent capacity, actual roles, attrition, hiring, severance, redeployment, overtime and contractor spend. Organisational redesign and consultation can delay cash conversion.
Knowledge transfer can change performance distribution. AI may help less-experienced workers approach stronger peers while providing limited benefit to experts. Workforce forecasts should retain required review, escalation and domain expertise.
Employee relations, employment law and incentive effects require local review. Aggressive savings assumptions can damage adoption or increase control risk.
14. Preserve quality and customer outcomes
Quality measures should be defined before rollout. Accuracy, first-time resolution, defects, rework, complaint, churn, satisfaction, safety and regulatory exceptions can offset speed.
Human review can preserve quality and reduce the time saving. Review intensity should reflect risk and observed model performance. A forecast should not assume both full automation and unchanged review cost without evidence.
Customer response can affect revenue. Faster service may improve retention, while generic or incorrect output can weaken trust. Outcomes should be measured by cohort and compared with a credible control.
15. Attribute revenue uplift
Revenue claims can arise from greater sales capacity, better targeting, faster response, higher conversion, improved pricing, product innovation or retention. Each route needs a controlled link from intervention to customer action and cash.
Pipeline activity is not revenue. Leads, proposals and engagement should reconcile to orders, delivery, invoices, collections and incremental margin. Existing demand and sales incentives can confound attribution.
Incremental revenue should use contribution margin after fulfilment, commissions, support, cloud, refunds and working capital. Applying a revenue multiple to gross AI-associated pipeline can materially overstate value.
Sales experiments should control territory, account potential, representative, campaign, product availability and pricing authority. AI-assisted outreach can increase activity while reducing relevance or brand quality. Lead scoring can redirect effort toward customers already likely to buy, improving measured conversion without creating incremental demand. Holdout groups, randomised recommendations or phased deployment can strengthen attribution. Customer-level effects should be reviewed for concentration; one large renewal can dominate an apparent uplift.
Pricing use cases require additional care. A higher realised price can reflect mix, scarcity, contract timing or reduced discount authority rather than a model. The buyer should examine price, volume, churn, win rate, service cost and lifetime contribution together. Recommendation systems can shift demand among the target's own products, creating gross uplift without incremental group value. Forecast revenue should also include sales-cycle timing and collections. A booked order that requires greater implementation or carries cancellation rights should not receive the same value as collected recurring margin.
16. Test competitive pass-through
An efficiency gain can increase margin, support lower prices, improve service or fund new features. The outcome depends on competition, customer bargaining, contract renewal and differentiation.
If peers access similar tools, some savings may pass to customers through price or required service. The buyer should stress price, retention and share rather than assume the entire cost gain persists in EBITDA.
Defensibility can come from proprietary data, workflow integration, switching cost, distribution, brand, regulation, scale or learning. A model licence available to competitors offers limited standalone moat.
Pass-through can occur through formal tenders, contract renewal, customer negotiation or a higher expected service level. The speed depends on contract duration, disclosure, customer concentration and the visibility of cost structure. Cost-plus arrangements may pass savings rapidly; fixed-price contracts can retain benefit until repricing; regulated or benchmarked markets can impose separate sharing. The commercial model should map the mechanism rather than apply one generic fade.
Competitors may use AI to lower price, shorten delivery, add features or target the same customers. The target can retain value by reinvesting part of the saving in differentiation. This creates a deliberate split between margin and growth investment. Buyer cases should compare a harvest strategy with a defend-and-grow strategy, including customer response and required spend. A moat claim should be tested through rights, data uniqueness, embedded workflow, evidence accumulation and switching cost. Scale alone is weak when model and data costs fall broadly across the market.
17. Build the full implementation cost stack
Table 2. AI implementation and recurring cost stack
| Cost layer | Examples | Valuation treatment |
|---|---|---|
| discovery | process mapping, data audit and pilots | sunk or remaining programme cost |
| build | integration, customisation, testing and migration | capex or expense subject to policy |
| adoption | training, change, supervision and productivity dip | implementation cash and timing |
| run | licence, model, cloud, support and monitoring | recurring operating cost |
| control | security, privacy, compliance, assurance and audit | recurring and event-driven cost |
| renewal | retraining, replacement, remediation and exit | lifecycle and terminal cost |
Costs should be assigned by workflow, phase and accounting treatment.
Implementation costs should include internal labour and business disruption. Capitalising accounting cost does not remove cash or execution risk. Remaining spend should be linked to milestones and capacity.
Shared platform cost requires an allocation consistent with expected use. Vendor discounts, minimum commitments and currency can change unit economics as volume moves.
18. Model recurring unit economics
Recurring economics should measure cost per accepted, compliant and useful outcome rather than per token or model call alone. Failed, rejected and repeated outputs consume resources.
Licence, inference, storage, retrieval, data, observability, human review, support and security can scale differently. Pricing can change after introductory periods or vendor renegotiation.
Unit economics should be stressed for higher volume, longer context, model substitution, service-level requirements and data residency. Cost savings should survive plausible vendor terms.
19. Govern data, privacy and intellectual property
The buyer should map data source, consent, purpose, quality, access, retention, transfer and deletion. Sensitive customer, employee and regulated data can constrain use and create remediation cost.
Training, retrieval and output rights should be reviewed across employment, vendor, open-source, customer and partner agreements. Ownership of code or prompts does not necessarily confer rights to underlying data or generated material.
Privacy, confidentiality and intellectual-property risk should enter both cash flow and transaction protection. Unsupported commitments or unlawful processing can impair the use case after closing.
20. Apply accounting discipline
Accounting recognition and valuation are related and distinct. IAS 38 requires an identifiable controlled resource and recognition criteria for an intangible asset. Configuration or customisation in a cloud arrangement may remain a service cost when the customer does not control an asset.
The buyer should reconcile capitalised development, expensed research, licences, prepaid services, impairment and useful life. EBITDA improvement can be flattered by cost classification without changing cash.
Purchase accounting may identify technology, customer and other intangible assets under applicable standards. The transaction valuation should avoid double-counting the same benefit in both forecast cash and a separate asset premium.
Quality-of-earnings work should bridge reported EBITDA to cash and identify where development cost, cloud commitments, internal labour and vendor credits appear. A company can report higher EBITDA after capitalising eligible development expenditure while cash outflow rises. Conversely, expensed investment can depress current earnings while supporting future cash. The buyer should normalise with a policy consistent across historical and forecast periods and preserve the applicable accounting requirements.
Purchase-price allocation and transaction valuation serve different purposes. Identified technology may be valued through cost, income or market methods under the applicable reporting framework. Customer relationships may already reflect AI-supported retention in their forecast. Contributory-asset charges and useful lives should avoid overlap. Impairment analysis after closing can expose a business case that relied on adoption or growth which does not materialise. The deal model should therefore retain the assumptions that support both price and future reporting, with governance for changes.
21. Establish transferability and control
Value transfers when the buyer obtains the rights, systems, data, people, contracts and operating knowledge required to continue the outcome. Founder knowledge, informal vendor access or a customer-specific exception can be fragile.
The diligence team should identify change-of-control consent, licence assignment, data portability, model access, source code, documentation, key staff, subcontractors and exit assistance. A benefit dependent on seller-retained infrastructure requires a transitional arrangement and cost.
Transferability should be tested through a controlled recovery or handover exercise where proportionate. Documentation volume is weaker evidence than the ability of an authorised team to operate and reproduce results.
22. Validate models and decision controls
Validation should cover accuracy, calibration, bias, robustness, drift, explainability where required, workflow fit, security and financial outcome. It should use data and conditions distinct from development.
Model inventory should identify owner, purpose, version, dependency, data, approval, limits and monitoring. Production artefacts should link to the approved version. Overrides and exceptions should be retained.
NIST's AI Risk Management Framework and ISO/IEC 42001 provide governance concepts that can inform proportionate controls. Compliance with a framework should be evidenced through operating practice rather than a policy statement alone.
Validation should test the system in the workflow in which value is claimed. Offline accuracy may not capture latency, retrieval failure, user interpretation, automation bias or interaction with approval rules. Test populations should cover normal, difficult, high-value and high-risk cases. Acceptance thresholds should be approved by the accountable business and risk owners. Where a model recommends price, credit, employment, safety or another consequential decision, the governance and legal standard may be materially higher than for drafting assistance.
Monitoring should combine leading and lagging indicators. Input drift, confidence, rejection, override and exception can signal deterioration before cash loss appears. Rework, complaint, customer outcome, compliance breach and realised margin confirm effect. Thresholds should trigger defined action: additional review, reduced scope, rollback, retraining or suspension. Repeated manual correction can reveal that apparent automation remains dependent on expert labour. The valuation should include that labour and the expected renewal cycle.
23. Test vendor and infrastructure concentration
AI workflows can depend on model providers, cloud, vector databases, data vendors and integration partners. Outage, price change, policy, model retirement or acquisition can alter economics.
Contracts should define service, security, data use, intellectual property, audit, liability, change, termination and transition. Minimum spend and volume tiers should reconcile to the forecast.
Substitution tests should consider output quality, latency, integration, retraining, approvals and customer obligations. A nominal second provider is not resilience when switching requires months of redevelopment.
24. Assess cyber and operational resilience
Attack paths can include prompt injection, data leakage, poisoned retrieval, compromised credentials, malicious tools and vulnerable integrations. A system that acts on records or external services can create direct operational loss.
Controls should include identity, least privilege, segmentation, input and output handling, monitoring, rate limits, change approval, backups, recovery and incident response. Human approval should match potential consequence.
Resilience cost belongs in the operating model. Insurance and vendor liability can leave material exclusions or caps; the buyer should stress residual cash exposure.
25. Build the persistence test
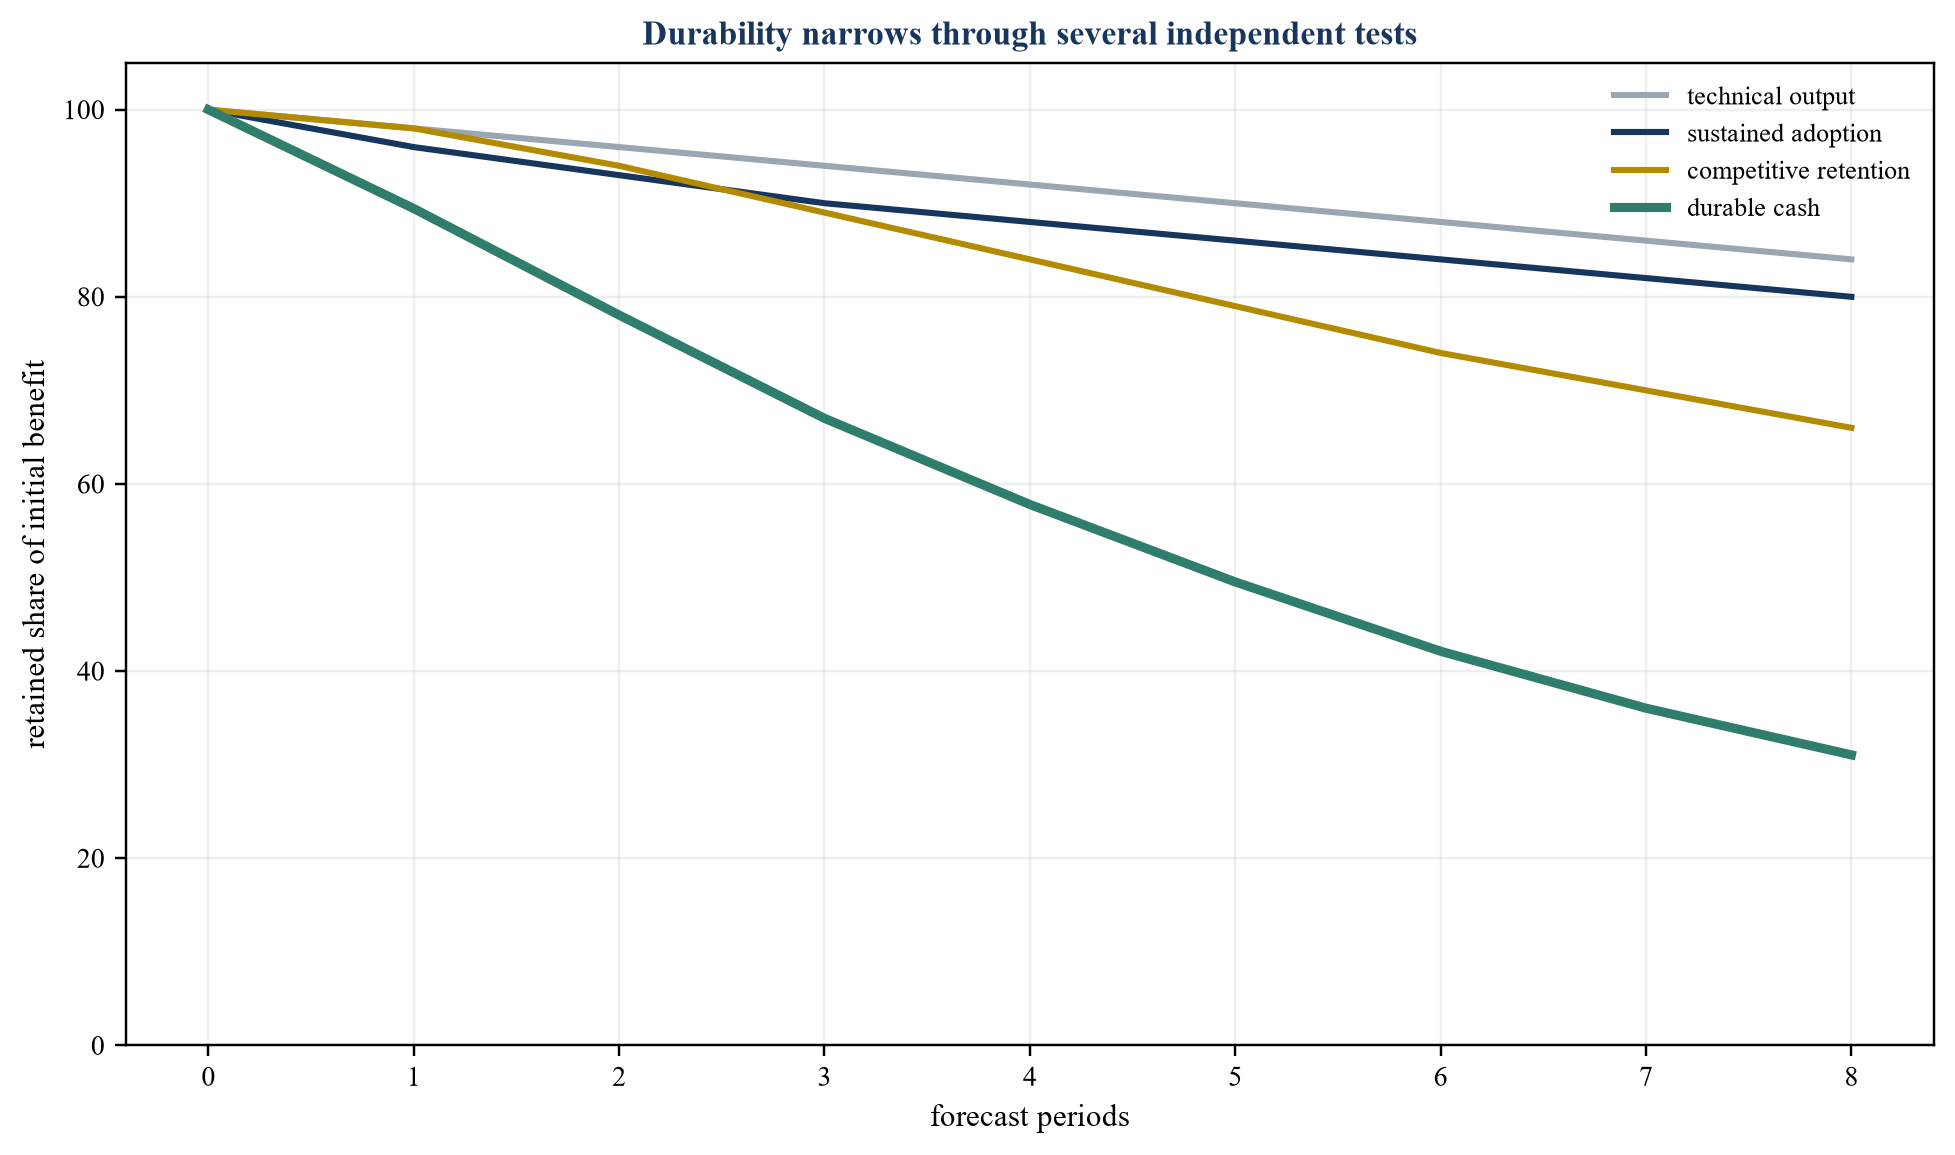
Replace the illustrative curve with observed cash, adoption, model, customer and cost evidence.
Persistence should be tested across technical performance, adoption, workflow integration, customer response, competition, vendor cost, regulation and organisational capability. One flat fade factor hides different causes.
Each driver should have observable indicators and an owner. The forecast can then update as evidence matures. A buyer should avoid a terminal margin that exceeds the durability supported by rights and market structure.
Technical persistence should be measured against the business outcome, rather than a frozen test set alone. Input populations, language, products and customer behaviour can move. Model upgrades can improve average quality while changing tone, latency, cost or edge-case behaviour. Regression suites should include commercially material and high-risk cases. Workflow persistence requires stable interfaces, approvals, training, support and manager reinforcement. Cohort decay can signal that the tool adds friction or that early users were unrepresentative.
Cash persistence should reconcile renewal, price, cost and maintenance. A benefit can remain operationally visible while vendor cost increases or customers capture it. The model should estimate reinvestment required to preserve data, integrations, controls and skills. Persistence periods should align with contract and technology evidence, rather than the standard forecast horizon by convention. Transaction structure can respond to evidence that will mature after closing through staged consideration or measurable covenants.
26. Separate model drift from commercial decay
Model drift occurs when data or relationships change and technical performance weakens. Commercial decay occurs when competitors imitate, customers demand price, volumes shift or the workflow loses strategic relevance.
The remedies differ. Retraining may restore accuracy and cannot restore a lost price premium. Product and commercial teams should therefore monitor value alongside model metrics.
Valuation scenarios should distinguish remediable degradation, recurring renewal cost and structural erosion. Terminal assumptions should reflect the expected reinvestment required to sustain advantage.
27. Test scale and integration constraints
A pilot can operate on curated data, selected users and manual support. Enterprise rollout introduces legacy systems, edge cases, peak load, jurisdiction, access control and service commitments.
Scale evidence should include representative volume, exception rate, latency, availability, support effort, unit cost and control performance. Pilot success should not be multiplied by total enterprise volume without these tests.
Integration with finance, customer, supply-chain and operational systems can create both value and lock-in. Remaining interfaces, data remediation and process redesign should enter cost and timing.
28. Separate standalone benefit from buyer synergy
Standalone value should reflect the target under its current ownership with supportable initiatives. Buyer-specific synergy can arise from scale, data, distribution, procurement, platforms, customer access or removal of duplication.
The valuation should avoid paying the seller for synergy that only the buyer can create unless competitive process or negotiation requires sharing. Costs, timing and execution risk should accompany each synergy.
Dis-synergies should also be modelled. Integration can interrupt workflows, change licences, trigger consent, reduce employee adoption or create data restrictions.
29. Select the valuation method
Discounted cash flow can model incremental AI-enabled revenue, cost, investment, risk and terminal value. Comparable-company or transaction multiples can provide a market cross-check and may embed different AI exposure and accounting.
A separate technology asset method can be useful when rights and cash can be isolated. Relief-from-royalty, excess-earnings, replacement-cost and option approaches require method-specific evidence and should not double-count forecast benefits.
The method should follow the economic source of value. A broad premium for an AI label is weak when durable cash, rights and differentiation are not demonstrated.
The discounted cash-flow model should build value by use case or workflow where material, then reconcile to the consolidated forecast. Revenue, cost, investment, tax, working capital and terminal assumptions should share the same adoption and persistence drivers. Scenarios should preserve dependencies: higher use can increase both benefit and model cost; faster automation can increase severance and control spend; stronger competitive response can reduce price while raising required innovation.
Market evidence should be normalised for growth, profitability, recurring revenue, customer concentration, capital intensity, accounting and business model. Companies described as AI businesses may own technology, resell infrastructure, apply AI internally or simply market the label. Transaction premiums can reflect scarcity, strategic control or process competition rather than reusable margin. A buyer should use market multiples as a reasonableness range and explain any incremental premium through cash, rights or structure.
30. Build the buyer valuation waterfall
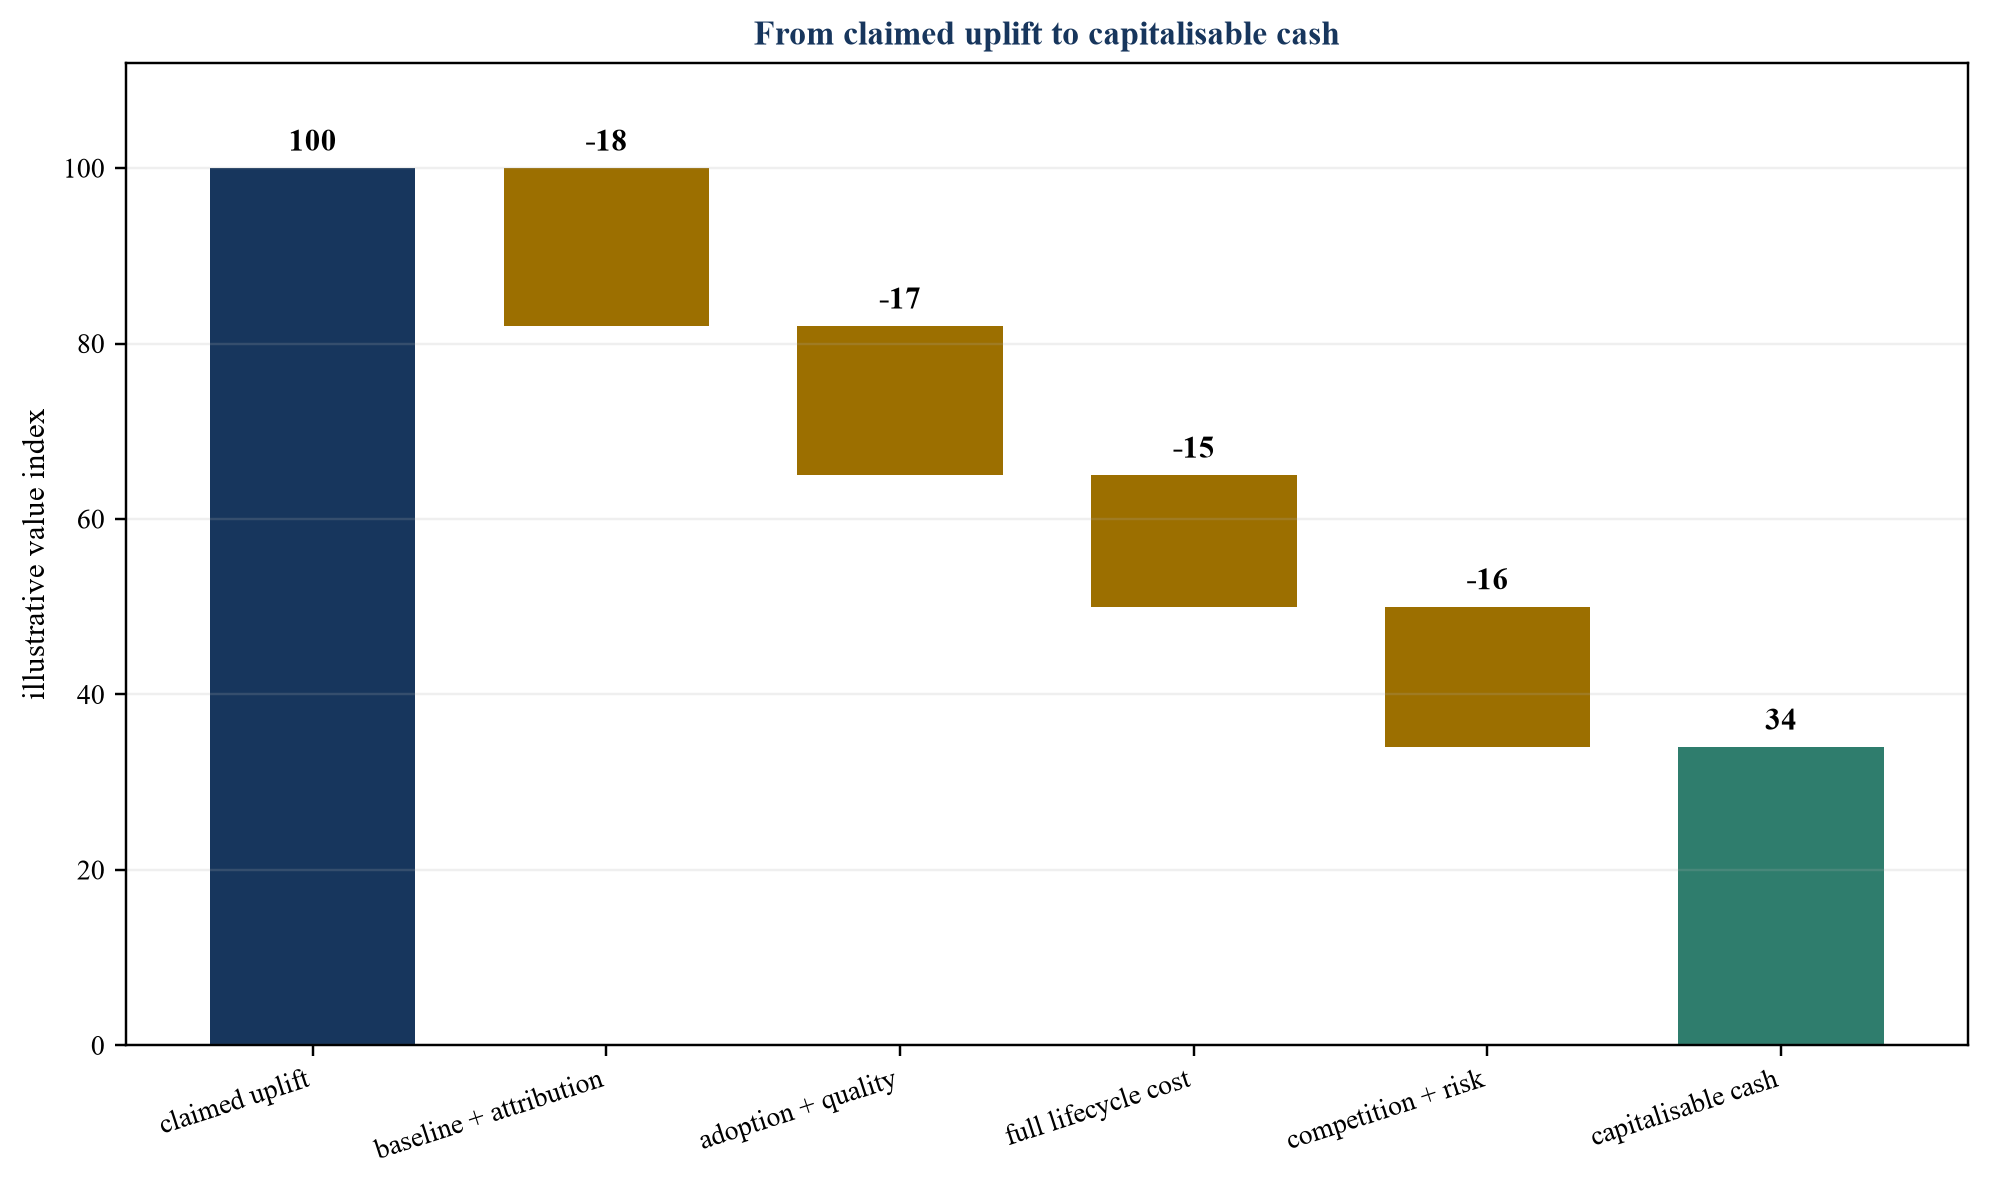
Values are illustrative; deductions should be supported by transaction evidence and coherent scenarios.
The waterfall should begin with the claimed uplift and deduct unsupported baseline, attribution uncertainty, incomplete adoption, quality leakage, lifecycle cost, competitive pass-through and residual risk. The output should reconcile to valuation cash flows.
Adjustments should avoid overlap. A risk already modelled through lower cash should not be duplicated through an identical multiple reduction unless residual uncertainty remains.
The waterfall should be built for each material use case and then consolidated. A portfolio total can hide one mature cash-generating workflow and several speculative pilots. Shared platform cost should be allocated consistently, while common risks such as a model provider or data source should be stressed across all dependent use cases. The bridge should show observed, run-rate and forecast periods separately. A run-rate should require completed actions, current capability and evidence that the period is representative.
Buyer adjustments can also be positive when diligence finds underused capacity with verified demand and a funded conversion plan. Such value remains forecast until adoption and cash are observed. The report should state the evidence required for release into base value, the responsible owner and the expected review date. This creates a living underwriting case that can support integration governance, earn-out calculations and future impairment review.
31. Build coherent downside cases
Downside should combine causally related events. Lower adoption can reduce licence and compute cost while delaying workforce action. Model underperformance can increase review cost and weaken customer outcomes together.
Scenarios should stress benefit, timing, implementation, recurring cost, vendor price, regulation, competition, quality and remediation. Liquidity should cover the path through a failed or delayed rollout.
Management cases should be compared with observed ranges and independent evidence. A probability-weighted case should not imply precision unsupported by the underlying drivers.
Downside design should start with failure modes. Data rights can restrict the workflow; a model change can reduce quality; a vendor can raise price; users can reject the tool; regulators or customers can require review; integration can slip; workforce action can cost more; and competitors can pass gains to price. Each failure mode should map to affected use cases, timing, cash, remediation and control. Portfolio diversification across several use cases should reflect shared vendors, data, change capacity and governance.
Liquidity analysis should include committed licences, cloud minimums, contractors, remediation, severance, duplicated systems and working-capital effects. A failed initiative can preserve staff cost while retaining technology commitments. Recovery may require a model substitution or workflow rollback that itself costs cash and interrupts service. The buyer should identify decision points where investment can be stopped, redirected or expanded. This real operating flexibility can reduce downside when contracts and architecture support it; it should not be assumed where commitments are fixed.
32. Protect terminal value
Terminal value should assume continuing investment in models, data, integration, security, skills and compliance. An AI-enabled margin cannot persist indefinitely without renewal when technology and competition change.
The buyer should distinguish durable workflow capability from a particular model version. Portability, data rights and organisational learning can survive vendor change; a temporary model advantage may not.
Exit assumptions should consider whether another buyer can reproduce the cash and obtain the required rights. Unsupported strategic premiums should remain outside base value.
33. Use transaction structure for evidence gaps
Earn-outs, holdbacks, staged consideration, warranties, indemnities, escrows and covenants can allocate specific uncertainty. Metrics should be defined from controlled records and resistant to manipulation after closing.
An earn-out based on gross revenue can reward discounting or cost growth. A margin or cash measure can be affected by integration allocation. The agreement should define perimeter, accounting, investment, management control and dispute resolution.
Structure should not replace diligence on legality, safety, data rights or fundamental feasibility. Some gaps require remediation before closing.
34. Prepare the diligence request
The request should cover workflow maps, business cases, baseline data, rollout records, model inventory, validation, users, adoption, outputs, quality, workforce, customers, vendors, costs, incidents, financial results and forecasts.
Samples should include successful, weak, exception and failed periods. Native records should be preserved. Curated demonstrations should be reconciled to production logs and cash.
Interviews should include workflow owners, users, finance, technology, security, legal, compliance, HR, sales and customers where permitted. Inconsistent definitions should be resolved before valuation.
35. Create the buyer data room
Table 3. AI-enabled margin diligence data room
| Workstream | Priority evidence | Reproducibility test |
|---|---|---|
| workflow | process, volume, baseline and bottleneck | recreate operating baseline |
| technology | models, data, integrations and validation | rerun representative outputs |
| adoption | cohorts, users, training and overrides | reproduce sustained use |
| commercial | customers, price, conversion and quality | link outcome to revenue |
| finance | costs, payroll, invoices and cash | reconcile uplift to accounts |
| governance | rights, approvals, incidents and controls | identify accountable owners |
Completeness should be tested against the transaction perimeter and valuation date.
The data room should preserve native files, owners, dates and version history. Summaries should link to source records. Access should protect personal, confidential and regulated information.
An independent reviewer should reproduce selected claims from raw workflow data through financial consequence. Gaps should enter price, condition or structure.
36. Classify buyer adjustments
Table 4. Buyer treatment of AI-enabled value claims
| Claim class | Required evidence | Illustrative treatment |
|---|---|---|
| realised recurring cash | reconciled accounts and sustained operation | base earnings or cash flow |
| evidenced avoided cost | approved plan, demand and capacity proof | risk-adjusted forecast |
| committed initiative | funded plan, milestones and accountable owner | probability and timing adjustment |
| uncommitted use case | concept, pilot or incomplete rights | option or excluded value |
| buyer synergy | buyer-specific capability and cost | separate synergy case |
| risk or liability | incident, breach, remediation or dependency | downside, reserve or structure |
Treatment depends on evidence, transferability and durability rather than the label attached to the initiative.
Classification should be consistent across the valuation, quality-of-earnings review and transaction documents. Re-labelling a forecast as run-rate should not change evidence requirements.
The buyer should document each adjustment, owner, source, sensitivity and treatment. This creates a defensible bridge from diligence to price.
37. Design board and integration reporting
Reporting should connect workflow, adoption, quality, customer, cost and cash. Metrics need stable definitions, cut-offs and reconciliation to accounts. Cohorts and model versions should remain visible.
The board should see concentration by use case, vendor, data source, customer and value driver. It should also see incidents, overrides, drift, residual implementation cost and benefits that remain forecast.
Integration reporting should preserve the original baseline and identify buyer actions separately. This supports fair earn-out, synergy and post-deal performance analysis.
38. Identify red flags
Red flags include a claimed percentage without a baseline, perfect-hindsight back-tests, selected users, missing quality, gross capacity treated as cash, omitted internal labour, capitalised cost presented as saving, and a terminal margin without reinvestment.
Other signals include non-transferable licences, weak data rights, unlogged model changes, vendor concentration, unsupported AI marketing, unresolved incidents and forecasts that exceed observed adoption.
A red flag is a diligence prompt. Its valuation effect depends on evidence, materiality, remediation and structure.
39. Execute a one-hundred-day buyer plan
Table 5. One-hundred-day AI margin verification plan
| Period | Primary work | Decision gate |
|---|---|---|
| days 1–30 | freeze baseline, rights, costs, models and cohorts | confirm operating truth |
| days 31–60 | reproduce outcomes, cash conversion and downside | approve capitalisable case |
| days 61–100 | implement controls, ownership and funded actions | move to board reporting |
Sequence should reflect transaction timing, risk, evidence gaps and integration dependencies.
The first month should reconcile definitions, systems, contracts, operating records and cash. Immediate legal, security, customer and control gaps take priority.
The second phase should reproduce representative results and quantify the valuation bridge. The final phase should implement approved actions with owners, funding, baselines and monitoring.
40. Conclusion
AI-enabled margin should be valued through evidence from workflow to cash. A credible case freezes the baseline, identifies causality, measures adoption and quality, converts capacity through an approved action and includes full lifecycle cost.
Task productivity is an input to enterprise value. Bottlenecks, workforce action, customer response, competition, model performance, rights and governance determine the amount that reaches durable margin.
Observed recurring cash can support base valuation when it transfers and persists. Avoided cost, committed initiatives and option value require progressively stronger risk adjustment. Buyer-specific synergy belongs in a separate case.
The practical standard is reproducibility. An independent reviewer should be able to select a claimed benefit, recreate the baseline, identify the intervention, measure the outcome, inspect adoption and quality, reconcile cost and trace the net result to cash.
Strong evidence can support efficient pricing and targeted structure. Weak evidence should reduce value, increase protection or delay recognition. This discipline allows buyers and sellers to discuss AI through operating and financial reality rather than labels.
The framework should be applied proportionately. A small internal assistant with low consequence needs fewer controls than an autonomous customer, pricing or credit workflow. Materiality depends on cash, customer, safety, legal and reputational exposure. Proportionate work still requires a clear baseline, full cost and an accountable owner. Sophistication in model architecture does not compensate for weak operating evidence.
As the business matures, the buyer can replace broad assumptions with cohort adoption, controlled outcomes, unit cost, customer behaviour and cash. This improves capital allocation across use cases. Programmes that do not meet evidence gates can be redesigned or stopped; stronger workflows can receive funding and integration priority. The resulting discipline treats AI as an operating portfolio whose value is earned through repeatable execution.
For transaction committees, the final output should be a short bridge from management claim to buyer treatment, supported by an auditable evidence pack. It should state what is realised, what remains dependent on management action, which benefits transfer, what reinvestment sustains them and how downside is protected. That bridge can flow consistently into quality of earnings, commercial diligence, technology diligence, legal review, valuation, financing and transaction documents. Consistency across those workstreams is itself a control: a benefit should not appear as proven in the valuation while remaining unresolved in technology, contracts or operating plans.
The resulting record should also identify the accountable owner, review date and evidence refresh required before signing, completion and each post-close value review.
References
- Bank for International Settlements, AI adoption, productivity and employment: evidence from European firms, https://www.bis.org/publications/working-paper-1325-ai-adoption-productivity-and-employment-evidence-european-firms
- OECD, Miracle or Myth? Assessing the macroeconomic productivity gains from Artificial Intelligence, https://www.oecd.org/en/publications/miracle-or-myth-assessing-the-macroeconomic-productivity-gains-from-artificial-intelligence_b524a072-en.html
- OECD, The impact of Artificial Intelligence on productivity, distribution and growth, https://www.oecd.org/en/publications/the-impact-of-artificial-intelligence-on-productivity-distribution-and-growth_8d900037-en.html
- OECD, Macroeconomic productivity gains from Artificial Intelligence in G7 economies, https://www.oecd.org/en/publications/macroeconomic-productivity-gains-from-artificial-intelligence-in-g7-economies_a5319ab5-en.html
- Eurostat, The use of artificial intelligence technologies in the European Union: Key results, 2026 edition, https://ec.europa.eu/eurostat/web/products-statistical-reports/w/ks-01-26-009
- Eurostat, Use of artificial intelligence in enterprises, https://ec.europa.eu/eurostat/statistics-explained/index.php?title=Use_of_artificial_intelligence_in_enterprises
- Brynjolfsson, Li and Raymond, Generative AI at Work, NBER Working Paper 31161, https://www.nber.org/papers/w31161
- NBER, Measuring the Productivity Impact of Generative AI, https://www.nber.org/digest/20236/measuring-productivity-impact-generative-ai
- Noy and Zhang, Experimental Evidence on the Productivity Effects of Generative Artificial Intelligence, Science, https://www.science.org/doi/10.1126/science.adh2586
- United States Census Bureau, Business Trends and Outlook Survey, https://www.census.gov/hfp/btos/data_downloads
- Stanford Institute for Human-Centered AI, AI Index Report 2026, https://hai.stanford.edu/ai-index/2026-ai-index-report
- United States Securities and Exchange Commission, Remarks at the SEC Roundtable on Artificial Intelligence in the Financial Industry, https://www.sec.gov/newsroom/speeches-statements/uyeda-ai-roundtable-032725
- United States Securities and Exchange Commission, Remarks by Commissioner Crenshaw at the AI Roundtable, https://www.sec.gov/newsroom/speeches-statements/crenshaw-remarks-ai-roundtable-032725
- United States Federal Trade Commission, Keep your AI claims in check, https://www.ftc.gov/business-guidance/blog/2023/02/keep-your-ai-claims-check
- United States Federal Trade Commission, AI companies: uphold your privacy and confidentiality commitments, https://www.ftc.gov/policy/advocacy-research/tech-at-ftc/2024/01/ai-companies-uphold-your-privacy-confidentiality-commitments
- United States National Institute of Standards and Technology, Artificial Intelligence Risk Management Framework, https://www.nist.gov/itl/ai-risk-management-framework
- European Union, Regulation (EU) 2024/1689 laying down harmonised rules on artificial intelligence, https://eur-lex.europa.eu/eli/reg/2024/1689/oj
- United Kingdom Information Commissioner's Office, Guidance on AI and data protection, https://ico.org.uk/for-organisations/uk-gdpr-guidance-and-resources/artificial-intelligence/guidance-on-ai-and-data-protection/
- United Kingdom Competition and Markets Authority, AI Foundation Models update report, https://www.gov.uk/government/publications/ai-foundation-models-update-report
- IFRS Foundation, Intangible Assets project, https://www.ifrs.org/projects/work-plan/intangible-assets/
- IFRS Foundation, Configuration or Customisation Costs in a Cloud Computing Arrangement, https://www.ifrs.org/projects/completed-projects/2021/configuration-or-customisation-costs-in-a-cloud-computing-arrangement-ias-38/
- IFRS Foundation, IFRS 3 Business Combinations, https://www.ifrs.org/issued-standards/list-of-standards/ifrs-3-business-combinations/
- IFRS Foundation, IFRS 13 Fair Value Measurement, https://www.ifrs.org/issued-standards/list-of-standards/ifrs-13-fair-value-measurement/
- IFRS Foundation, IAS 36 Impairment of Assets, https://www.ifrs.org/issued-standards/list-of-standards/ias-36-impairment-of-assets/
- International Organization for Standardization, ISO/IEC 42001 Artificial intelligence management systems, https://www.iso.org/standard/81230.html
- International Valuation Standards Council, International Valuation Standards, https://ivsc.org/standards/
