

1. Define the transaction decision
The analysis should begin with the decision that the evidence must support. An acquisition, joint venture, strategic investment, project financing, growth-equity raise or refinancing requires a stated valuation date, consideration, funding need, use of proceeds, ramp plan, milestone set and decision timetable. Quality-control claims should be tied to that decision and separated from research demonstrations, pilot cells and planned production features.
The central question is whether the factory can convert installed equipment, qualified materials and operating knowledge into accepted saleable output and durable cash. The transaction model should include commissioning, qualification, yield ramp, scrap, rework, labour, energy, maintenance, warranties and working capital. Benefits should enter the base case when their measurement, attribution, ownership and scaling path are documented.
Decision evidence should be frozen and dated. Claim maturity, customer acceptance, line configuration, chemistry, cell format, currency and accounting basis should be stated. Uncertainties that can be resolved before signing should enter diligence; residual uncertainty can influence price, conditions, warranties, earn-outs, covenants or staged funding. This discipline converts a broad automation story into a transaction timetable.
2. Define the factory and economic perimeter
The perimeter should identify the legal entity, site, line, building, utilities, formation and ageing capacity, laboratories, warehouses, recycling arrangements and shared services. It should show which equipment is owned, leased, vendor-financed or supplied by a joint-venture partner. Customer-owned tooling and government-supported assets require separate treatment.
The economic perimeter should distinguish cell, module and pack production and should identify whether electrodes, separators, electrolyte, cans, foils or active materials are produced internally. Transfer prices, tolling, offtake, licensing, grants, production credits and minimum-purchase commitments can materially change cash economics. The valuation should reconcile the perimeter used in operations, contracts and financial reporting.
Capacity located outside the controlled perimeter should not be presented as owned output. Shared infrastructure can create benefit and dependency. Diligence should identify decision rights, service levels, expansion rights, step-in rights and change-of-control restrictions. The forecast should use the capacity and economics that the transaction actually conveys.
3. Define the product, chemistry and qualification state
Battery manufacturing performance depends on chemistry, form factor, design, application and customer specification. Cylindrical, pouch and prismatic cells use different processes and inspection opportunities. Lithium iron phosphate, nickel-rich cathodes, sodium-ion and emerging solid-state systems have different materials, safety characteristics and maturity. A plant-wide average can conceal material variation.
The product register should state design revision, bill of materials, rated performance, safety standard, customer programme, qualification stage and approved manufacturing line. Engineering samples, qualification output and serial production should remain separate. Transfer of yield or model performance between designs requires evidence. A line producing several products should allocate time, changeover, scrap and bottleneck capacity consistently.
Customer acceptance determines whether technically complete output is saleable. Qualification can include sample builds, process capability, audit, performance, reliability and change approval. The transaction case should show qualified volume, conditional volume and unqualified nameplate separately. Revenue should follow the customer and product state supported by contracts.
4. Map the end-to-end manufacturing process
The process map should follow incoming material, mixing, coating, drying, calendaring, slitting, electrode preparation, stacking or winding, assembly, electrolyte filling, sealing, formation, ageing, grading, module or pack integration and final test. It should identify material flows, process parameters, inspection, hold points, rework, scrap and release authority.
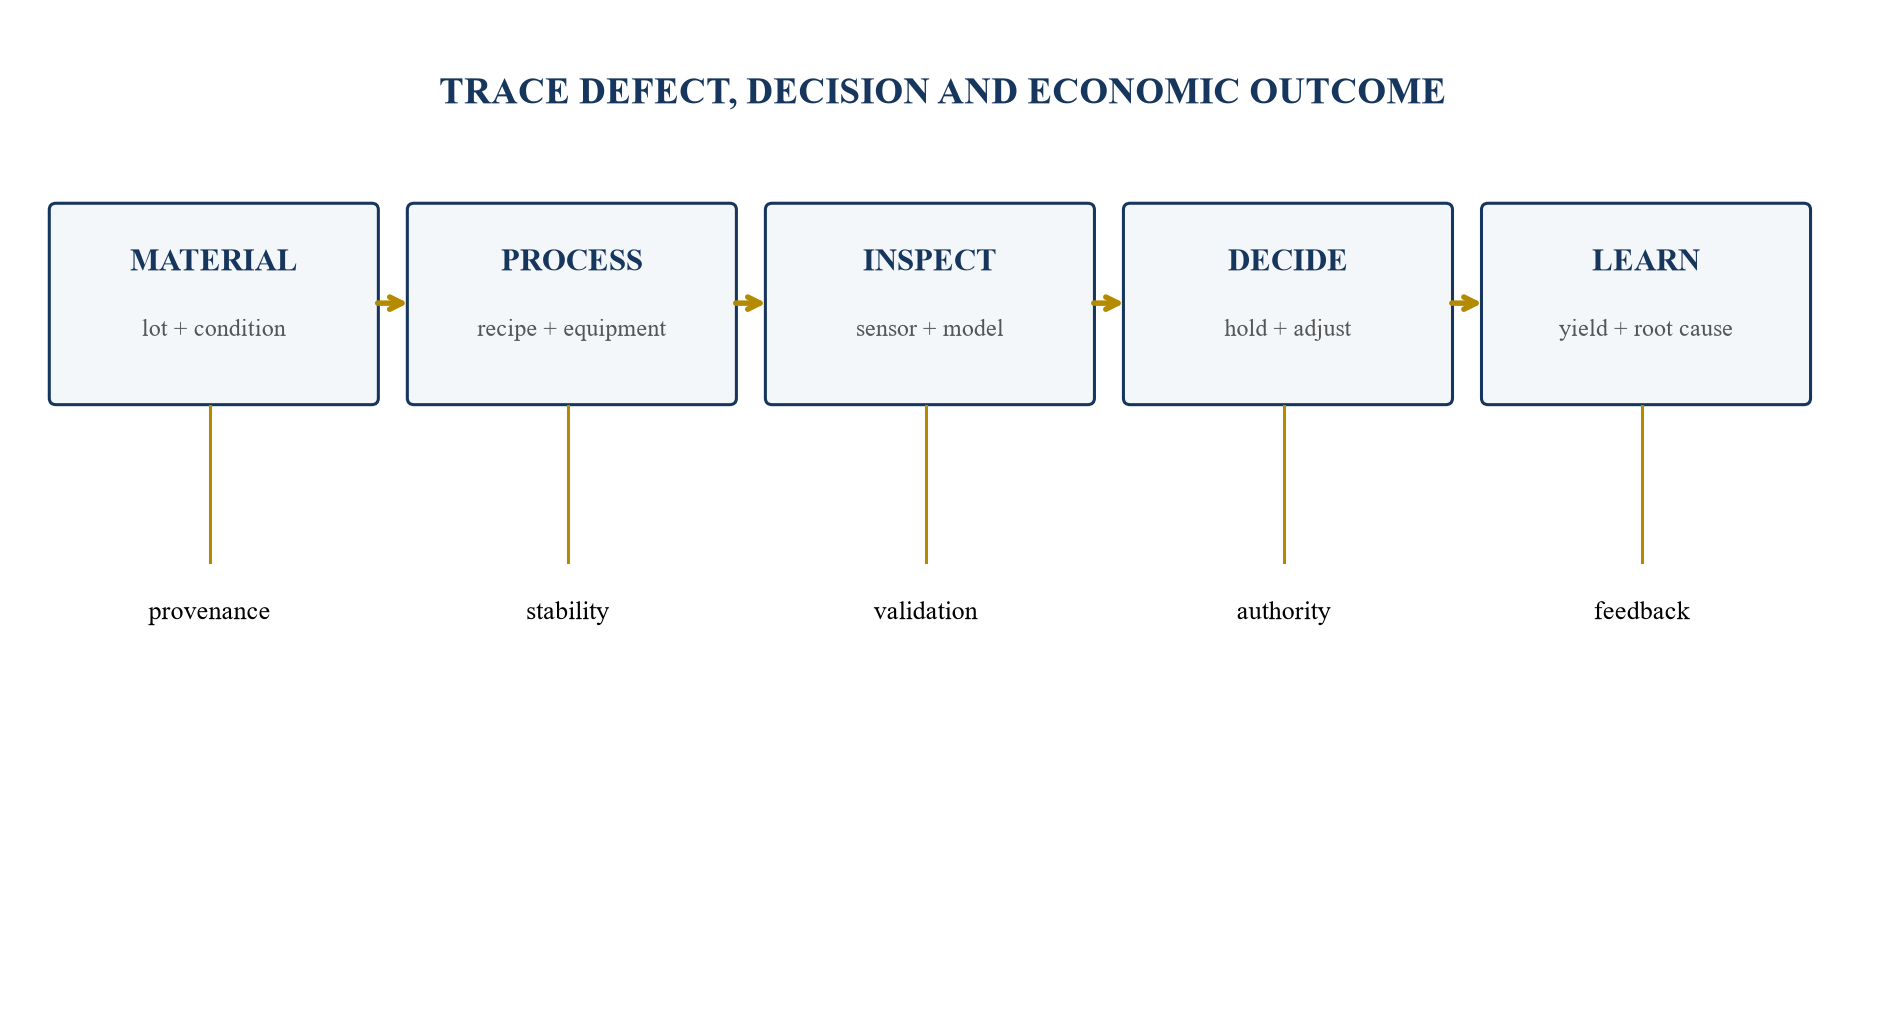
Populate the loop with site-specific processes, sensors, specifications, decision rights and evidence.
Counts, mass and energy should reconcile at each stage. Inspection that finds a downstream defect should link back to the relevant upstream lot, recipe and equipment state. The map provides the denominator for yield, capacity, quality cost and investor reporting.
5. Build the manufacturing evidence ledger
Table 1. Gigafactory manufacturing evidence ledger
| Element | Primary evidence | Transaction question |
|---|---|---|
| input | lot, specification and condition | was qualified material available? |
| process | recipe, equipment and environment | was the step in control? |
| inspection | sensor, model and test result | can the defect decision be reproduced? |
| disposition | release, rework, hold or scrap | who exercised authority? |
| output | accepted cell, module or pack | did output meet customer requirements? |
| economics | material, conversion, warranty and cash | what value changed and when? |
Fields should be adapted to the chemistry, line, customer and applicable quality system.
Each record should carry time, line, tool, product, revision, input lot, process parameters, model version, operator action, quality disposition and downstream outcome. Corrections should preserve original values and effective dates. The ledger should connect operational data to inventory, cost and customer acceptance without exposing unnecessary confidential information.
Two-way traceability matters. Reviewers should move from a reported yield benefit to the cell and material population and from a selected defect back to the image, sensor, model, process and disposition. Reconciliation exceptions should remain visible. Evidence quality should distinguish controlled system records, laboratory results, management spreadsheets and estimates.
6. Establish the pre-AI baseline
The baseline should measure production before the relevant quality-control change using stable definitions. It should include input mass, work in progress, stage yield, first-pass yield, final yield, rework, scrap, throughput, downtime, energy, labour, customer rejection, warranty and safety events. Existing deterministic inspection and statistical process control should remain visible.
Baseline periods should cover product mix, shifts, supplier lots, maintenance cycles and ramp maturity. A new line can improve rapidly through ordinary commissioning and workforce learning. The AI effect should not absorb those changes. Where a historical comparison is weak, a controlled shadow deployment, phased rollout or matched line can support attribution.
Definitions should be approved before the principal comparison. A baseline reconstructed after favourable results is vulnerable to hindsight bias. Exclusions, reclassifications and data gaps should be disclosed. The valuation should use a confidence range when the comparison population is small or immature.
Baseline governance should preserve the original extraction and calculation. The review team should reconcile reported production with manufacturing execution, warehouse movements, laboratory release, invoices and customer acceptance. Where systems disagree, the difference should be quantified and assigned. A management target, an engineering simulation and an observed result belong in separate fields. This distinction prevents the ramp case from silently converting aspiration into historical performance.
7. Define yield consistently
Yield is a family of measures. Material yield relates usable material to input. Process-step yield relates acceptable output to input at a step. First-pass yield excludes rework. Final yield can include recovered units. Customer-accepted yield applies contractual release. Financial yield reflects saleable output after credits, returns and warranty expectations. These measures should not be mixed.
The metric dictionary should state numerator, denominator, timing, unit, product, line, treatment of rework, treatment of downgraded output and owner. Yield measured by cell count can differ from energy capacity or material value. A few high-capacity cells can matter more than many small units. Transaction reporting should show relevant count, mass, energy and monetary bases.
Yield should be calculated at each process and cumulatively. Small losses across several steps compound. A final plant-wide ratio can hide the limiting process and make improvement difficult to attribute. The evidence should preserve the sequence from material input to customer-accepted output.
8. Separate first-pass, final and customer-accepted yield
First-pass yield measures output that clears the defined process without rework. It can reveal process stability and the burden hidden by final yield. Final yield adds successfully reworked units and should deduct any later failure under the approved window. Customer-accepted yield includes specification, audit and delivery outcomes beyond factory release.
Rework can recover material and can consume bottleneck time, energy, labour and quality capacity. A process that increases final yield through extensive rework may reduce economic output. The model should record rework path, cycle, success rate, incremental cost and effect on reliability. Repeat rework should be controlled.
Customer rejection, return and warranty outcomes should be linked to the original production cohort. Yield should mature over a product-appropriate horizon. A cell that passes end-of-line inspection and later fails qualification is not durable accepted output. The forecast should use the measure tied to revenue and cash.
9. Reconcile mass, cell and energy balances
Battery factories transform valuable powders, solvents, foils, separators, electrolyte and components. A physical balance should reconcile opening stock, receipts, input, work in progress, accepted output, recoverable scrap, hazardous waste and closing stock. Measurement loss and sampling should be explicit. The balance should align with inventory and environmental records.
Cell-count reconciliation should trace built, tested, graded, held, reworked, rejected, shipped and returned units. Energy-capacity reconciliation should reflect cell design and grade. These bases can move differently. A mix shift toward larger cells can improve gigawatt-hour output without improving cell-count yield.
Material-balance gaps can reveal poor measurement, hidden scrap, inventory error or process loss. AI quality claims should use the same reconciled denominator as finance. A lower recorded scrap rate without a matching mass and inventory effect should not enter valuation as realised benefit.
10. Build a defect taxonomy
Defects should be defined by process, physical characteristic, severity, detectability, disposition and downstream consequence. Examples include coating non-uniformity, particle contamination, burrs, misalignment, wrinkles, weld weakness, seal failure, fill variation, moisture, electrical abnormality and formation behaviour. Site and product experts should approve the taxonomy.
The taxonomy should distinguish defect, symptom and root cause. A visible mark can arise from several process conditions; a process deviation can create several downstream effects. Severity should connect to release, reliability, safety and customer requirements. Ambiguous labels should remain reviewable rather than forced into a convenient class.
Definitions should be versioned. Process and design changes can create new defect modes or change their materiality. Investor reporting should not combine incompatible taxonomies across lines without mapping. A stable taxonomy supports model validation, root-cause analysis, cost attribution and acquisition integration.
11. Govern data lineage and temporal integrity
Manufacturing AI can use images, spectra, acoustic signals, vibration, temperature, humidity, pressure, electrical tests, recipes, maintenance and laboratory results. Data lineage should record sensor identity, calibration, sampling, timestamp, transformation, unit, retention and link to the physical product. Time synchronisation matters across high-speed processes.
Training leakage occurs when information available only after the production decision enters development or validation. Later formation results, customer qualification and warranty outcomes can be useful labels and were unavailable at the earlier inspection point. Historical replay should reproduce the information set that existed when the decision was made.
Missing or delayed data can reflect a sensor failure, network outage or process event. The model should distinguish absence as information from absence as error. Diligence should trace representative units from raw source through feature, model, disposition and outcome. Data rights should survive the intended transaction and commercial scale.
Genealogy completeness should be measured. A unit with missing material, recipe, equipment or inspection links cannot support full root-cause or warranty analysis. The company should report the share of accepted output with complete lineage and the controls used when links fail. Historical migrations and clock corrections should preserve provenance. An acquirer should test whether data can be exported and understood without the seller's informal knowledge.
12. Design the metrology and inspection architecture
Inspection architecture should state what is measured, where, at what resolution, speed and environmental condition. In-line systems can provide broad coverage; laboratory tests can provide deeper evidence on samples. Destructive and non-destructive tests serve different purposes. Sampling plans should reflect defect risk and process capability.
Measurement-system analysis should address repeatability, reproducibility, calibration, bias, resolution and stability. A model cannot exceed the usable evidence in its sensors and labels. Camera angle, lighting, lens condition, vibration and line speed can alter performance. Maintenance and calibration belong in the run-rate cost.
The architecture should connect detection timing to avoidable loss. A defect found after formation may have consumed material, energy and bottleneck capacity. Earlier sensing can create more value when it supports a controlled upstream decision. The business case should identify the process action enabled by each inspection.
13. Validate computer-vision defect detection
Vision systems can inspect coating, surfaces, edges, alignment, welds, seals and assembly. Validation should use representative production images across lines, shifts, products, lots and environmental conditions. The reference label should be independently defined and, where practical, confirmed by downstream or destructive evidence.
Performance should include precision, recall, false rejection, defect escape, confidence and throughput. Rare critical defects require targeted challenge sets in addition to average metrics. The test set should be separated from development. Image augmentation should not replace real process diversity. Model and camera changes should be versioned together.
Operational validation should test latency, failed capture, blur, obstruction and network loss. The inspection system must keep pace with production or invoke a controlled fallback. An accurate offline model that cannot operate at line speed does not support nameplate economics. Production monitoring should link model output to disposition and later quality.
Challenge testing should include contamination, lighting change, tool wear, unusual geometry, overlapping defects and deliberately difficult borderline examples. Critical classes should be assessed by severity and not diluted by common easy cases. Reviewers should compare the model with the existing inspection process and the combined control. Improvement over a weak comparator is useful evidence and does not establish that the remaining escape risk is acceptable.
14. Combine sensor and process evidence
Some defects are not visible at a single station. Sensor fusion can combine images, equipment signals, environmental data, material properties and electrical tests. The model should state which data exist at the decision point and how missing channels are treated. Correlated sensors do not necessarily add independent evidence.
Process context can improve detection and can create spurious shortcuts. A model may learn a line, supplier or shift proxy instead of the physical defect. Validation should test transfer across relevant conditions and should examine feature dependence. Engineering review should assess whether the relationships are physically plausible.
Fusion should support an actionable decision: hold, inspect, adjust, rework or continue. Complexity that does not improve controlled economic outcomes adds maintenance and validation burden. The valuation should include sensor, compute, integration and specialist costs and should reflect the evidence actually available across all forecast lines.
15. Create reliable labels and ground truth
Ground truth can come from qualified inspectors, laboratory tests, destructive analysis, downstream electrical performance, customer rejection or field outcome. Each source has uncertainty, cost and delay. The label protocol should state the evidence hierarchy and conflict resolution. Expert disagreement should be measured.
Sampling should represent ordinary production and known rare defects. Enriched defect datasets support learning and can distort prevalence if used directly for operating metrics. Validation should restore the real production base rate. Labels created after process changes should record the applicable design and recipe.
The company should preserve the raw observation, label, reviewer, rationale and later correction. Weak labels can make model performance look precise while failing to support factory decisions. Transaction diligence should inspect label governance and independently review selected examples.
16. Build the model-validation scorecard
Table 2. Manufacturing AI validation scorecard
| Domain | Evidence | Economic relevance |
|---|---|---|
| detection | precision, recall and severity coverage | controls escape and rejection cost |
| transfer | line, product, lot and shift performance | supports scalable deployment |
| stability | drift, calibration and change response | supports durable operation |
| latency | capture-to-decision time and availability | protects throughput |
| action | disposition and process response | connects signal to realised value |
| outcome | yield, scrap, warranty and safety | supports transaction attribution |
Acceptance thresholds require product-specific engineering, quality and customer approval.
The scorecard should show baseline, threshold, current result, source, owner and test period. It should include negative indicators such as data gaps, overrides, unexplained drift and model rollback. A strong average should not offset failure on a critical safety-related defect.
Independent validation should assess conceptual design, data, implementation, performance and operational controls. Findings should have severity, owner and closure evidence. Material limitations should enter deployment scope, forecast and transaction disclosure. Acceptance should be approved by the accountable quality and operations functions.
17. Value false rejection and defect escape together
A false rejection removes conforming output from sale or sends it through additional review. It consumes material, capacity and labour and can reduce customer volume. A defect escape allows non-conforming output to proceed and can create downstream scrap, customer rejection, warranty, recall or safety exposure. The threshold should balance these consequences within approved quality requirements.
The economic model should weight errors by product value, defect severity, detection stage and downstream cost. A single average error rate is insufficient. Critical defects may require a conservative threshold and secondary inspection. Low-severity cosmetic findings can tolerate a different operating point.
Threshold changes should be controlled and back-tested. Reported scrap reduction can arise from accepting more marginal output, while a higher rejection rate can reflect tighter customer specifications. Durable value requires stable customer and reliability outcomes. The forecast should include quality assurance and remediation work.
The decision curve should show accepted output, review queue, scrap, escape and cost at candidate thresholds. The chosen point may differ by product and defect severity. Operations should not move thresholds simply to meet a shipment target. A temporary commercial override can create a later quality and warranty liability. Transaction diligence should inspect threshold history alongside production pressure, customer complaints and subsequent field results.
18. Monitor drift and production change
Manufacturing conditions change through material lots, supplier, tool wear, maintenance, software, lighting, environment, recipe, product revision and line speed. Monitoring should observe input populations, model scores, dispositions, yields and downstream outcomes. Technical drift without outcome change and outcome deterioration without obvious technical drift both require investigation.
Change management should classify impact and define when revalidation, customer notification or approval is required. A model update should be traceable to data, code, test, decision and release. Rollback should restore the compatible model, sensor and process configuration. Temporary overrides should have expiry and accountable approval.
Transaction diligence should assess whether model performance depends on a narrow historical state. A scalable platform should show controlled transfer and change evidence. The forecast should include the time and cost of adapting models to new products, suppliers and lines rather than assume automatic reuse.
19. Control the closed-loop process response
Detection creates value when it changes a process or disposition safely. Closed-loop systems can adjust parameters, stop equipment, divert material or trigger inspection. The control design should state allowable actions, limits, authority, response time and fallback. Safety and equipment interlocks should remain independent where required.
The company should distinguish recommendation from autonomous control. Human review should have sufficient information and authority for material decisions. Automated changes should be logged with before-and-after state, outcome and rollback path. Unstable feedback can amplify variation and should be prevented through engineering validation.
The economic case should measure realised process improvement after action, not alerts generated. It should include lost production during holds and false alarms. A controlled response that reduces propagation of defects can improve material yield and bottleneck capacity. The causal chain should be reproducible from source records.
20. Define human authority and operating accountability
Quality release, deviation, rework, scrap and process change require defined decision rights. The responsibility matrix should identify operators, engineers, quality, maintenance, information technology, cybersecurity, suppliers and customer representatives. Approval levels should reflect severity and contractual requirements.
Overrides should record reason, direction, evidence, user and outcome. Concentrated overrides can reveal poor model performance, inadequate training or production pressure. Quality assurance should sample automated and human decisions. Staffing plans should include monitoring, label review, validation and root-cause capability.
Authority should survive shift changes, absence, outage and ramp pressure. Users should understand model limitations and challenge mechanisms. The valuation should retain necessary control labour rather than assume AI removes engineering judgement. Dependence on a few individuals should enter integration and retention planning.
21. Link detection to root cause
Defect detection identifies an abnormal output. Root-cause analysis connects the outcome to material, process, equipment, environment, method or human factors. The company should use a documented problem-solving method and should distinguish correlation from a verified mechanism. Corrective action should include effectiveness review.
The digital thread can accelerate investigation by linking product genealogy, process parameters, maintenance and inspection. Machine learning can prioritise relationships and should not replace engineering evidence. Designed experiments, physical analysis and controlled process change can test causality.
Benefits should distinguish containment, correction and prevention. Sorting an affected lot limits escape but does not improve the process. A verified root-cause action can reduce recurrence and create durable yield value. Investor materials should trace claimed savings through completed actions and sustained outcomes.
22. Build the yield-learning curve
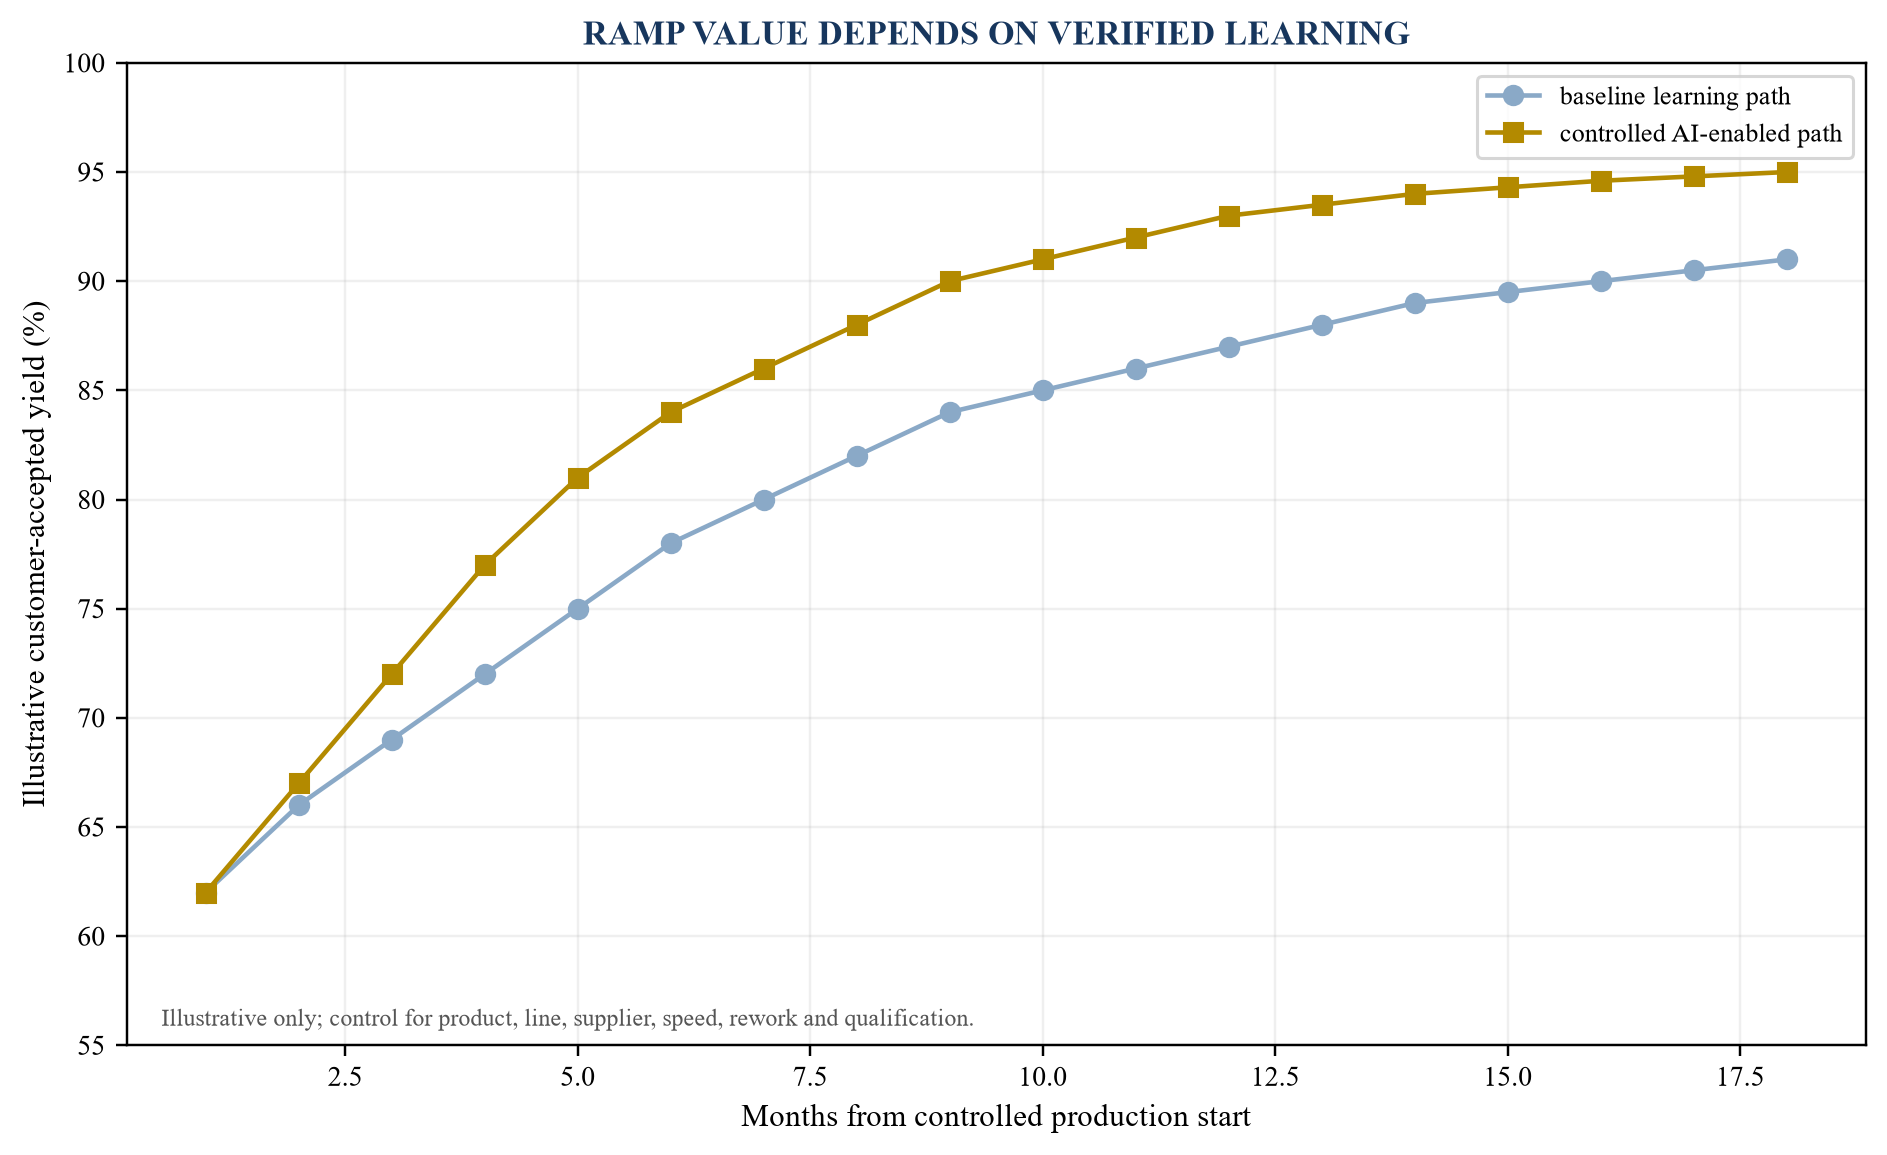
Illustrative values only; replace with reconciled line, product and customer-accepted yield evidence.
The learning curve should begin at a defined production state and show yield by step, final acceptance and maturity. It should explain process, product, supplier, workforce and quality-system changes. A fitted curve is a planning tool, not proof of future performance.
AI attribution should use phased deployment, matched lines, controlled change or another supportable method. The forecast should include confidence and plateau. Accelerated ramp can create material value through earlier saleable output and lower cash burn. The model should avoid extending early gains beyond demonstrated process capability.
Learning should also be tested for retention. A line can improve during intensive engineering support and regress when experts leave, products change or maintenance is deferred. The evidence should show stability after the intervention and across shifts. Management should identify the operating routines, model monitoring, supplier controls and workforce capability that preserve the gain. These recurring costs belong in the mature margin case.
23. Build the scrap waterfall
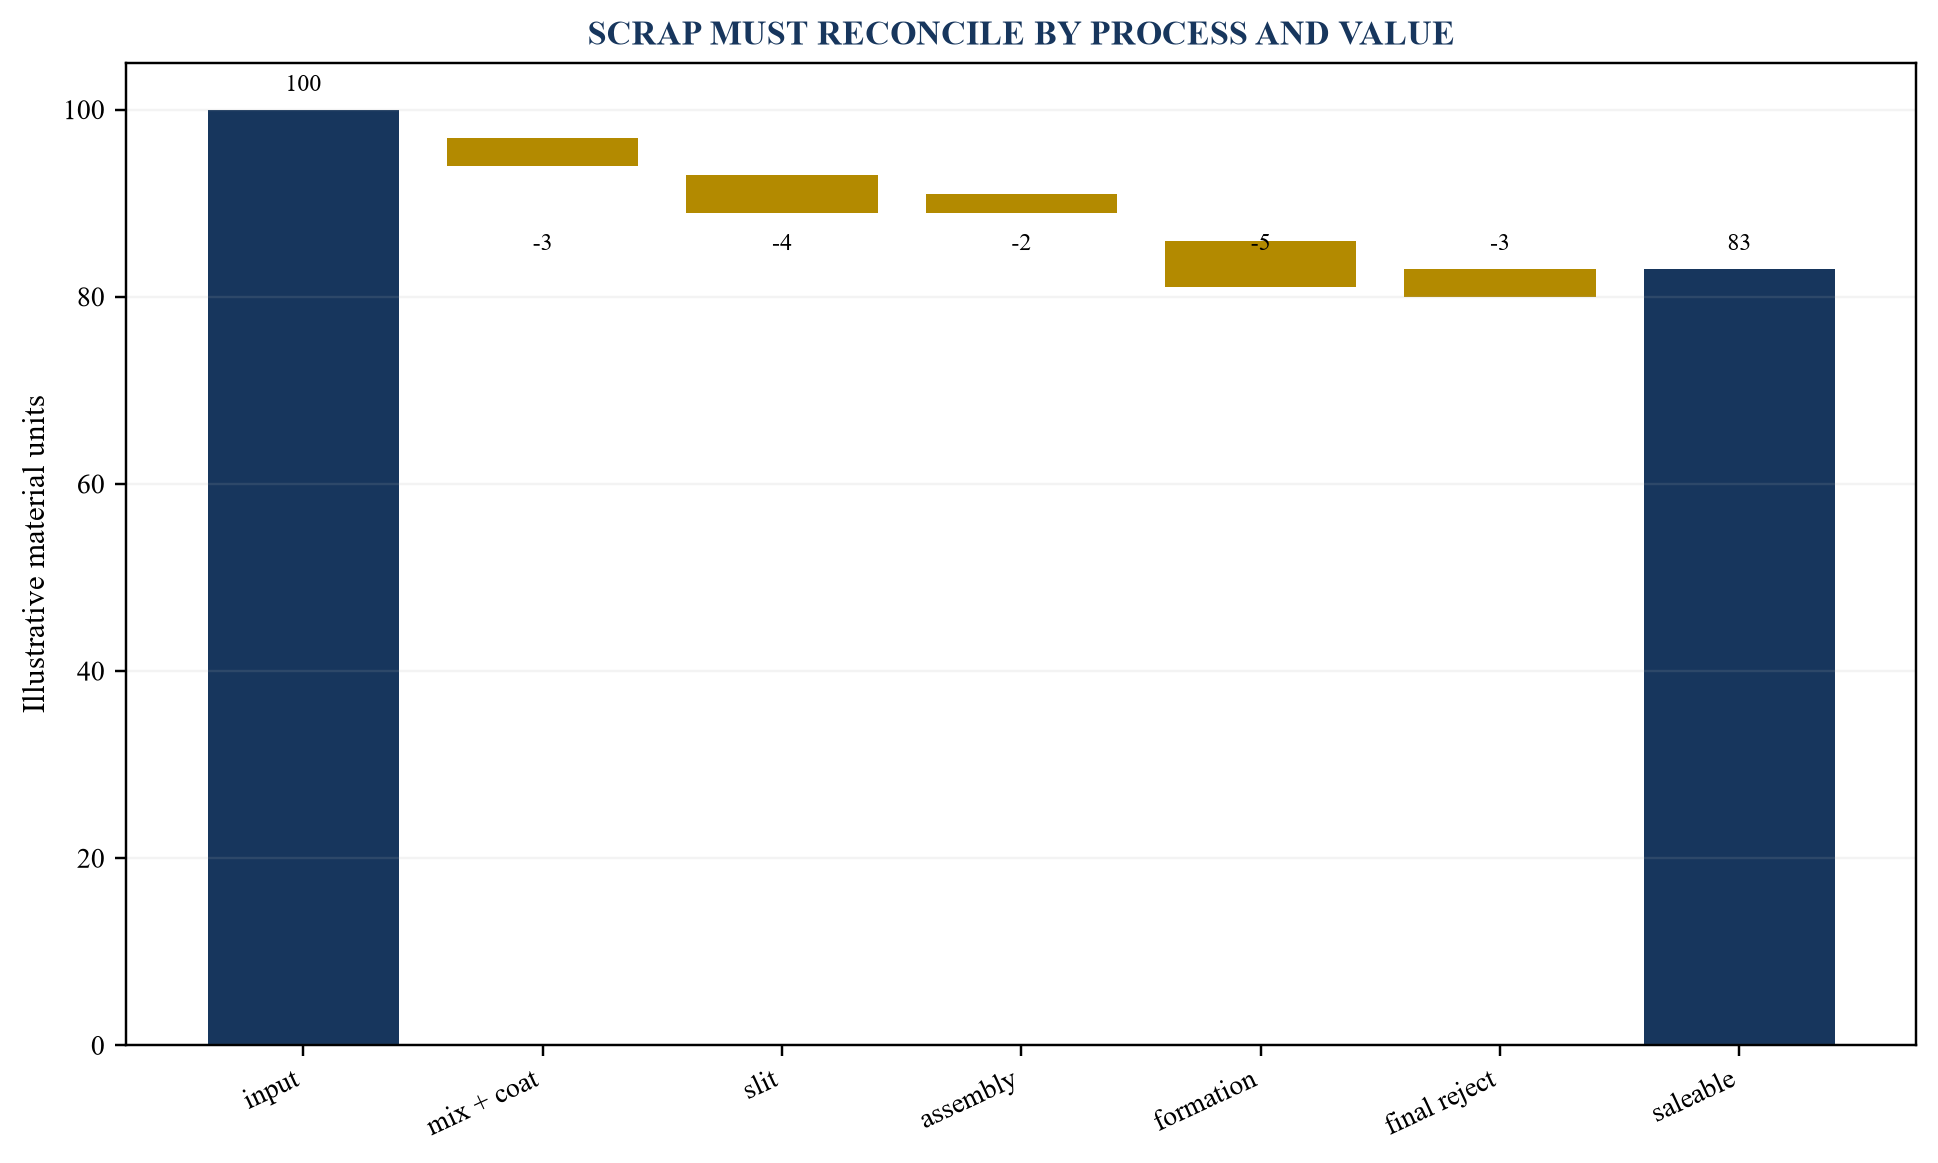
Illustrative material units only; replace with verified mass, energy and financial balances.
The waterfall should reconcile input to saleable output and separate edge trim, off-spec material, damaged work in progress, rejected cells and other waste. It should state which material can be reused internally, recycled externally, downgraded or disposed. Transfer timing and recovery value matter.
AI quality control can reduce propagation by identifying problems earlier. It can also increase recorded scrap by detecting previously missed defects. The investment case should distinguish better visibility from physical reduction. Material savings should reconcile to purchases, inventory and cash after recovery, handling and disposal cost.
24. Value scrap recovery and recycling
Production scrap can contain valuable lithium, nickel, cobalt, graphite, copper and aluminium, depending on chemistry and stage. Recovery value depends on composition, contamination, logistics, contract, market price and processing yield. The IEA identifies production scrap as an important current recycling feedstock. Gross material value is not equivalent to net cash recovery.
The factory should record scrap type, mass, custody, storage, shipment, invoice and recovered material where applicable. Closed-loop arrangements can improve supply resilience and create working-capital or accounting complexity. Environmental and hazardous-material obligations should be incorporated.
The valuation should separate avoided virgin input, external sale, tolling cost, disposal cost and future recycling claim. A forecast should use contract and process evidence, with sensitivities for commodity price and recovery yield. Scrap reduction can lower recycler feedstock and should not be double-counted with recovery revenue.
25. Convert yield into economic capacity
Nameplate capacity describes equipment potential under stated conditions. Economic capacity depends on operating time, rate, utilisation, yield, product mix, qualification and customer acceptance. Formation, ageing, dry-room, coating or another step can constrain output. The bottleneck can move as yield improves.
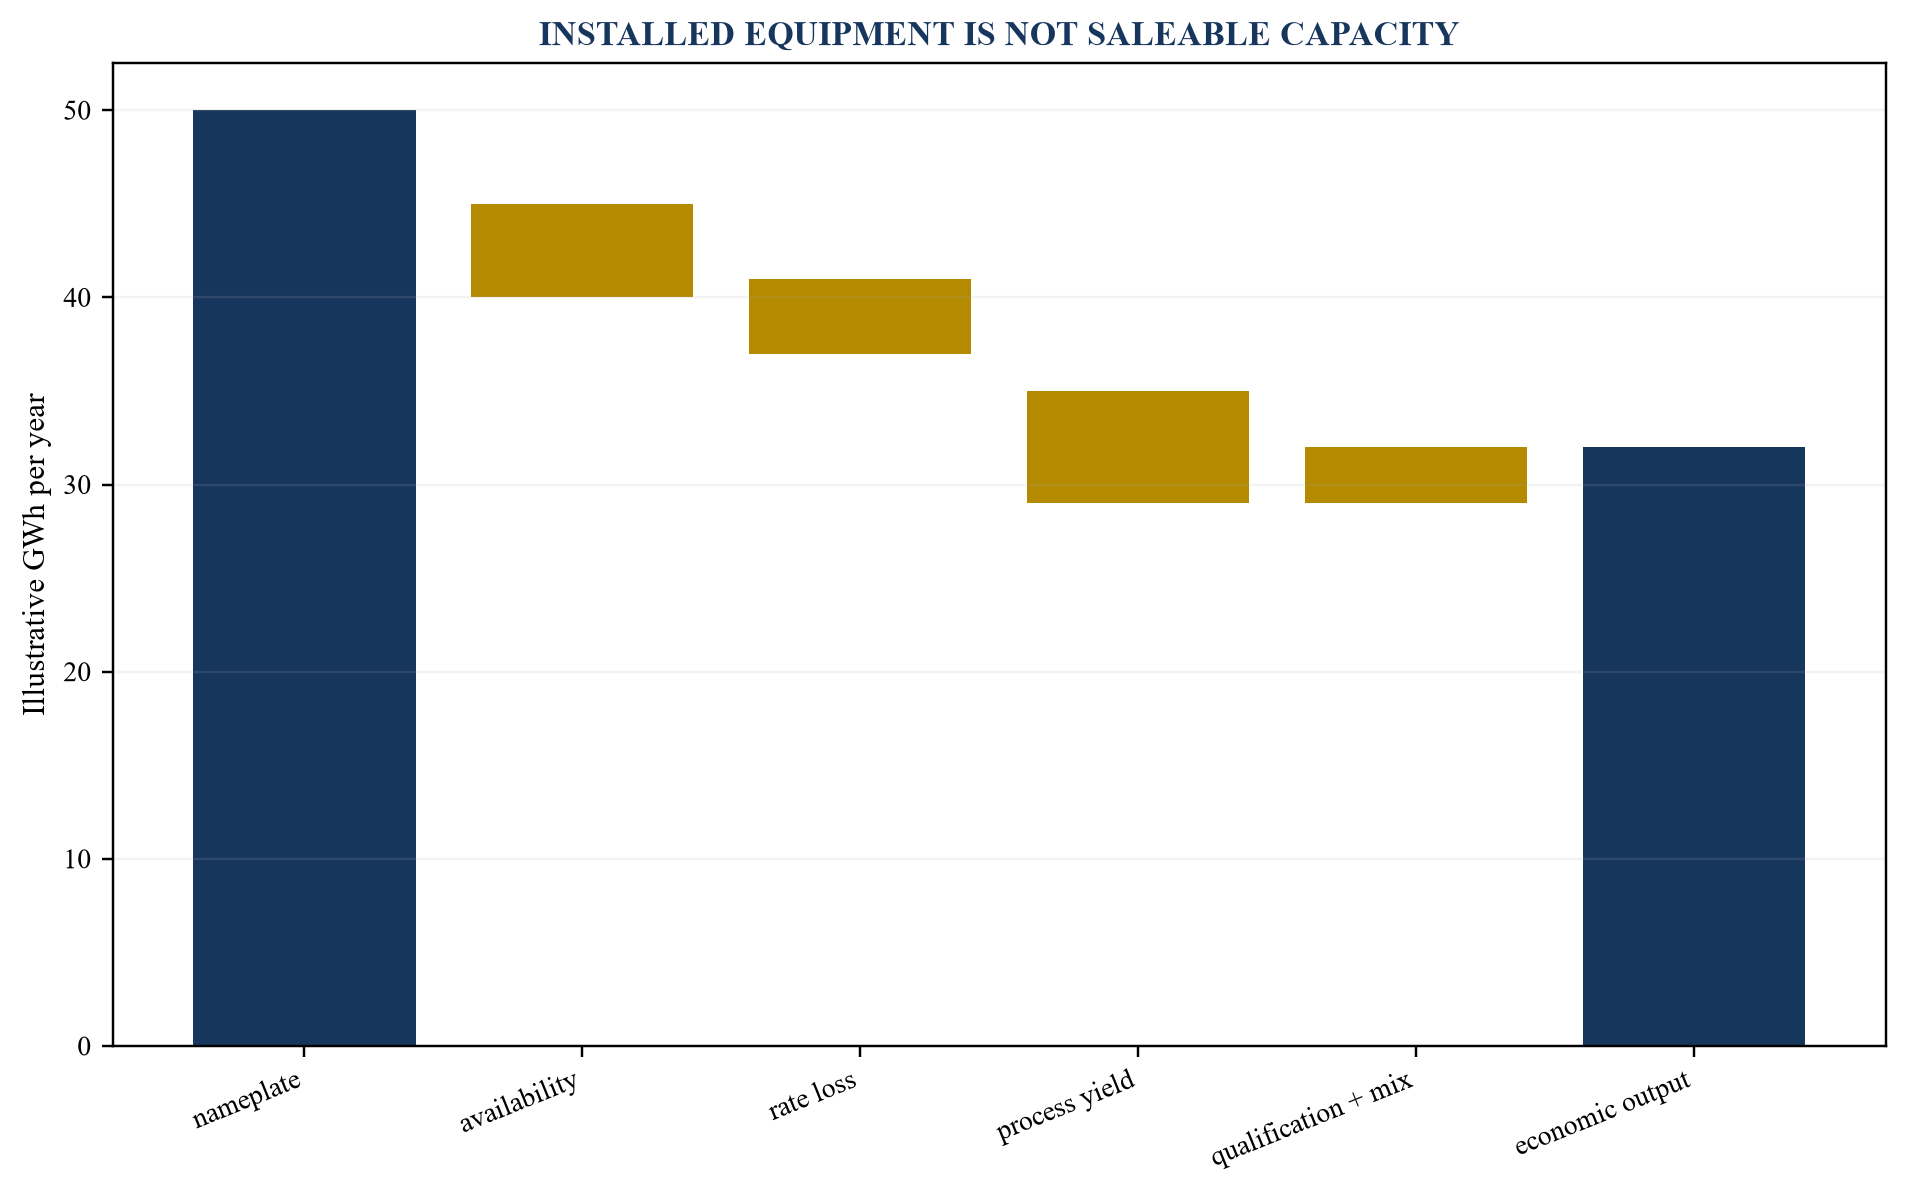
Illustrative gigawatt-hour values only; replace with verified equipment, utilisation, yield and acceptance evidence.
The capacity model should use hours, cycle time, tool count, changeover, planned and unplanned downtime, step yield and product routing. It should reconcile with actual production and customer shipments. Yield gains at a non-bottleneck step can save material without increasing throughput.
Capital value arises when improvement changes saleable output, avoids equipment, reduces cost or shortens ramp. The model should identify which mechanism applies. Expansion plans should use demonstrated rates and include commissioning and qualification rather than apply mature output immediately.
Capacity debottlenecking should follow the process network. Improving coating yield can increase formation demand and create a new queue. If downstream capacity is fixed, additional upstream good output may become inventory rather than sales. The transaction model should recalculate every major step after a yield change and identify incremental labour, energy and handling. Avoided capital should be claimed only when forecast demand would otherwise require a defined investment.
26. Reconcile utilisation, rate and overall equipment effectiveness
Availability, performance rate and quality are commonly combined in overall equipment effectiveness. The definitions should be site-approved and consistent. Planned downtime, engineering trials, customer holds and lack of demand should remain visible. A high utilisation ratio can be achieved while producing unsaleable output.
The transaction model should distinguish demand-constrained and production-constrained periods. Idle equipment caused by weak orders should not be valued as a quality problem. Bottleneck utilisation should be reported alongside upstream and downstream buffers. Excess work in progress can conceal imbalance and consume cash.
AI can support predictive maintenance, process stability and quality and should be attributed by use case. Benefits at separate stages should not be double-counted. The forecast should reconcile line hours, output, staffing and energy and should identify the capital or cash consequence of each improvement.
27. Build the manufacturing cost bridge
Table 3. Yield-to-cost bridge
| Cost driver | Yield effect | Transaction treatment |
|---|---|---|
| active materials | compounded process loss | reconcile to purchase and mass balance |
| components | rejected or reworked units | measure by stage and product value |
| conversion | labour, energy and consumables | allocate to accepted output |
| bottleneck capacity | lost saleable throughput | value only with demand and acceptance |
| quality cost | inspection, hold and analysis | retain recurring control work |
| downstream risk | return, warranty and recall | use mature cohort and sensitivity |
Replace categories with verified bills of material, routings, payroll, energy, depreciation and recovery evidence.
Cost per accepted kilowatt-hour should connect material, conversion, fixed cost, recovery and accepted output. A yield increase can lower unit cost even when total spend remains stable because more output absorbs fixed cost. Cash and accounting effects should be separated. Depreciation is not a cash saving, while avoided material purchase can be.
The bridge should show timing. Early defect detection can avoid downstream energy and bottleneck use. A recovered scrap credit may arrive later. The valuation should use observed or engineered evidence and should avoid multiplying a percentage yield gain by gross revenue without cost, demand and capacity constraints.
Variance analysis should separate purchase price, consumption, yield, rate, utilisation, mix and fixed-cost absorption. This makes the monthly financial effect traceable to operations. A favourable cost per unit can arise from accounting absorption while total cash burn rises. The board should see both. Engineering estimates should reconcile with standard cost and actual procurement so that the transaction model reflects the site's real material and conversion economics.
28. Model working capital and cash burn
Ramp consumes material before accepted output and cash collection. Low yield increases input purchases, work in progress, scrap and delayed customer acceptance. Long formation, qualification and payment cycles can create substantial funding need. Inventory valuation and impairment policies should reflect quality state.
The cash model should connect purchase terms, safety stock, process time, yield, holds, shipments, receivables and recovery. Government incentives and customer advances should be timed to evidence. A higher accounting margin does not solve a near-term liquidity gap if qualification or collection is delayed.
AI quality control can shorten feedback and reduce work in progress. The benefit should be measured through inventory days and cash, not only process time. Downside cases should include material price, yield delay, rejected lots, customer hold and slower recovery. Financing headroom should survive a realistic ramp variance.
29. Connect quality to warranty, reliability and safety
Factory yield measures production disposition. Warranty and field performance test whether released products remain reliable and safe. Latent defects can appear after cycling, environmental exposure or integration. Cohorts should connect manufacturing genealogy to customer and field outcome over an appropriate horizon.
Warranty provisions, returns, replacements, investigation, logistics, recall and customer penalties should be reconciled. Early production cohorts may lack maturity. The valuation should use sensitivity rather than assume absence of observed failure proves durability. Safety-critical findings require competent escalation and cannot be traded for throughput.
AI quality control can improve detection and process understanding. It can also create correlated escape if one model controls a large population. Independent tests, layered controls and traceability reduce this risk. The transaction data room should identify open investigations and customer notifications.
30. Control supplier and material variability
Incoming active materials, foils, separator, electrolyte and components influence process stability and cell performance. Specifications, certificates and sample tests should connect to lot genealogy. Supplier changes and dual sourcing can require process adjustment and customer approval. The forecast should not assume instant transfer.
Models can detect patterns linked to material lots and should avoid treating supplier identity as a substitute for physical evidence. Root-cause analysis should distinguish material, storage, handling and process. Commercial allocation of non-conformance should follow contracts and verified evidence.
Supplier concentration, qualification lead time, minimum order, price and quality history affect transaction risk. Yield improvement that relies on premium material may raise cost or constrain scale. The integrated model should connect material specification, yield, price, working capital and resilience.
31. Use digital twins and process models responsibly
Digital twins can connect process physics, equipment, material and data to simulate settings, predict outcomes and plan experiments. Their purpose, boundary, calibration and validation should be stated. A dashboard or data replica is not automatically a decision-grade twin.
Models can reduce physical trials and support scale-up when they reproduce relevant behaviour. Validation should compare predictions with production under representative conditions and should identify extrapolation. Parameters and assumptions should be versioned. Engineering judgement remains necessary for novel materials and equipment states.
The business case should measure trials avoided, development time, yield, energy or capital decision improved. Compute, software, integration and specialist cost should be included. Intellectual-property and vendor rights can affect transaction value and continuity.
32. Secure operational technology and manufacturing data
Quality systems connect cameras, sensors, programmable controllers, manufacturing execution, laboratories, cloud services and enterprise systems. Security should cover segmentation, identity, least privilege, patching, logging, secure development, supplier access, incident response and recovery. Production availability and safety should guide controls.
Model and recipe integrity matter. Unauthorised changes can affect quality without obvious equipment failure. Release packages should be signed, approved and traceable. Backup and recovery should preserve compatible data, model and process versions. Manual fallback needs trained capacity and reconciliation.
Transaction diligence should inspect architecture, penetration tests, incidents, open findings, recovery exercises and third-party dependencies. Unresolved material findings should affect deployment scope, integration planning and valuation. Cyber insurance does not replace control.
33. Protect intellectual property and data rights
Competitive advantage can arise from process know-how, labelled data, model performance, integration, customer qualification and speed of learning. General access to an AI model is not a durable moat. The company should show why its system produces a superior controlled outcome in the target factory.
Intellectual-property diligence should identify patents, trade secrets, code, model, data, recipe and employee or contractor assignment. Equipment and software licences, open-source obligations and customer restrictions should be reviewed. Joint-development agreements can allocate improvements in ways that limit transaction value.
Data rights should cover training, validation, benchmarking, cross-line reuse, retention and transfer after change of control. Supplier and customer data may have narrow permitted uses. The valuation should reflect the rights actually conveyed and the cost of replacing constrained data or technology.
34. Integrate environmental and regulatory evidence
Battery manufacturing uses energy, water, solvents and critical materials and creates scrap and hazardous waste. The operating model should connect permits, monitoring, emissions, waste custody, recycling, worker protection and emergency response to production. Yield improvement can reduce material and embodied impact per accepted unit.
The EU Batteries Regulation introduces requirements concerning sustainability, carbon footprint, information and due diligence for relevant batteries and operators. Applicability and timing require qualified review. Product and plant data should support required evidence without assuming a future compliance claim is already satisfied.
Environmental benefit should be calculated on a consistent life-cycle and production basis. Lower scrap can reduce input and waste and can change recycling flows. Investors should distinguish measured performance, regulatory obligation and aspirational target. Remediation and permit constraints should enter capacity and valuation sensitivity.
35. Build the integrated operating forecast
The forecast should connect qualified demand, price, product mix, line hours, rate, availability, step yield, rework, accepted output, material, conversion cost, warranty, inventory and cash. Capacity should be constrained by the actual bottleneck. Customer qualification and contract timing should govern revenue.
Base, downside and milestone cases should be explicit. The downside should include slower yield ramp, material variability, inspection revalidation, supplier delay, customer hold, lower utilisation and higher warranty. The model should show monthly liquidity and funding headroom. Improvement should enter only when supported by completed action and observed evidence.
The forecast should reconcile to production plans, purchase orders, payroll, utilities and capital expenditure. A coherent model allows engineering and finance to use the same definitions. Variances should identify volume, mix, rate, yield, price and cost rather than a single unexplained margin movement.
Forecast governance should include a controlled assumption register. Each material input should state source, date, owner, base case, downside and update trigger. Yield and line-rate assumptions should connect to observed cohorts; customer demand should connect to contracts or qualified pipeline; incentive assumptions should connect to eligibility and evidence. Monthly actuals should roll through the same bridge used in diligence so that the board can act before liquidity becomes constrained.
36. Translate yield and scrap into valuation
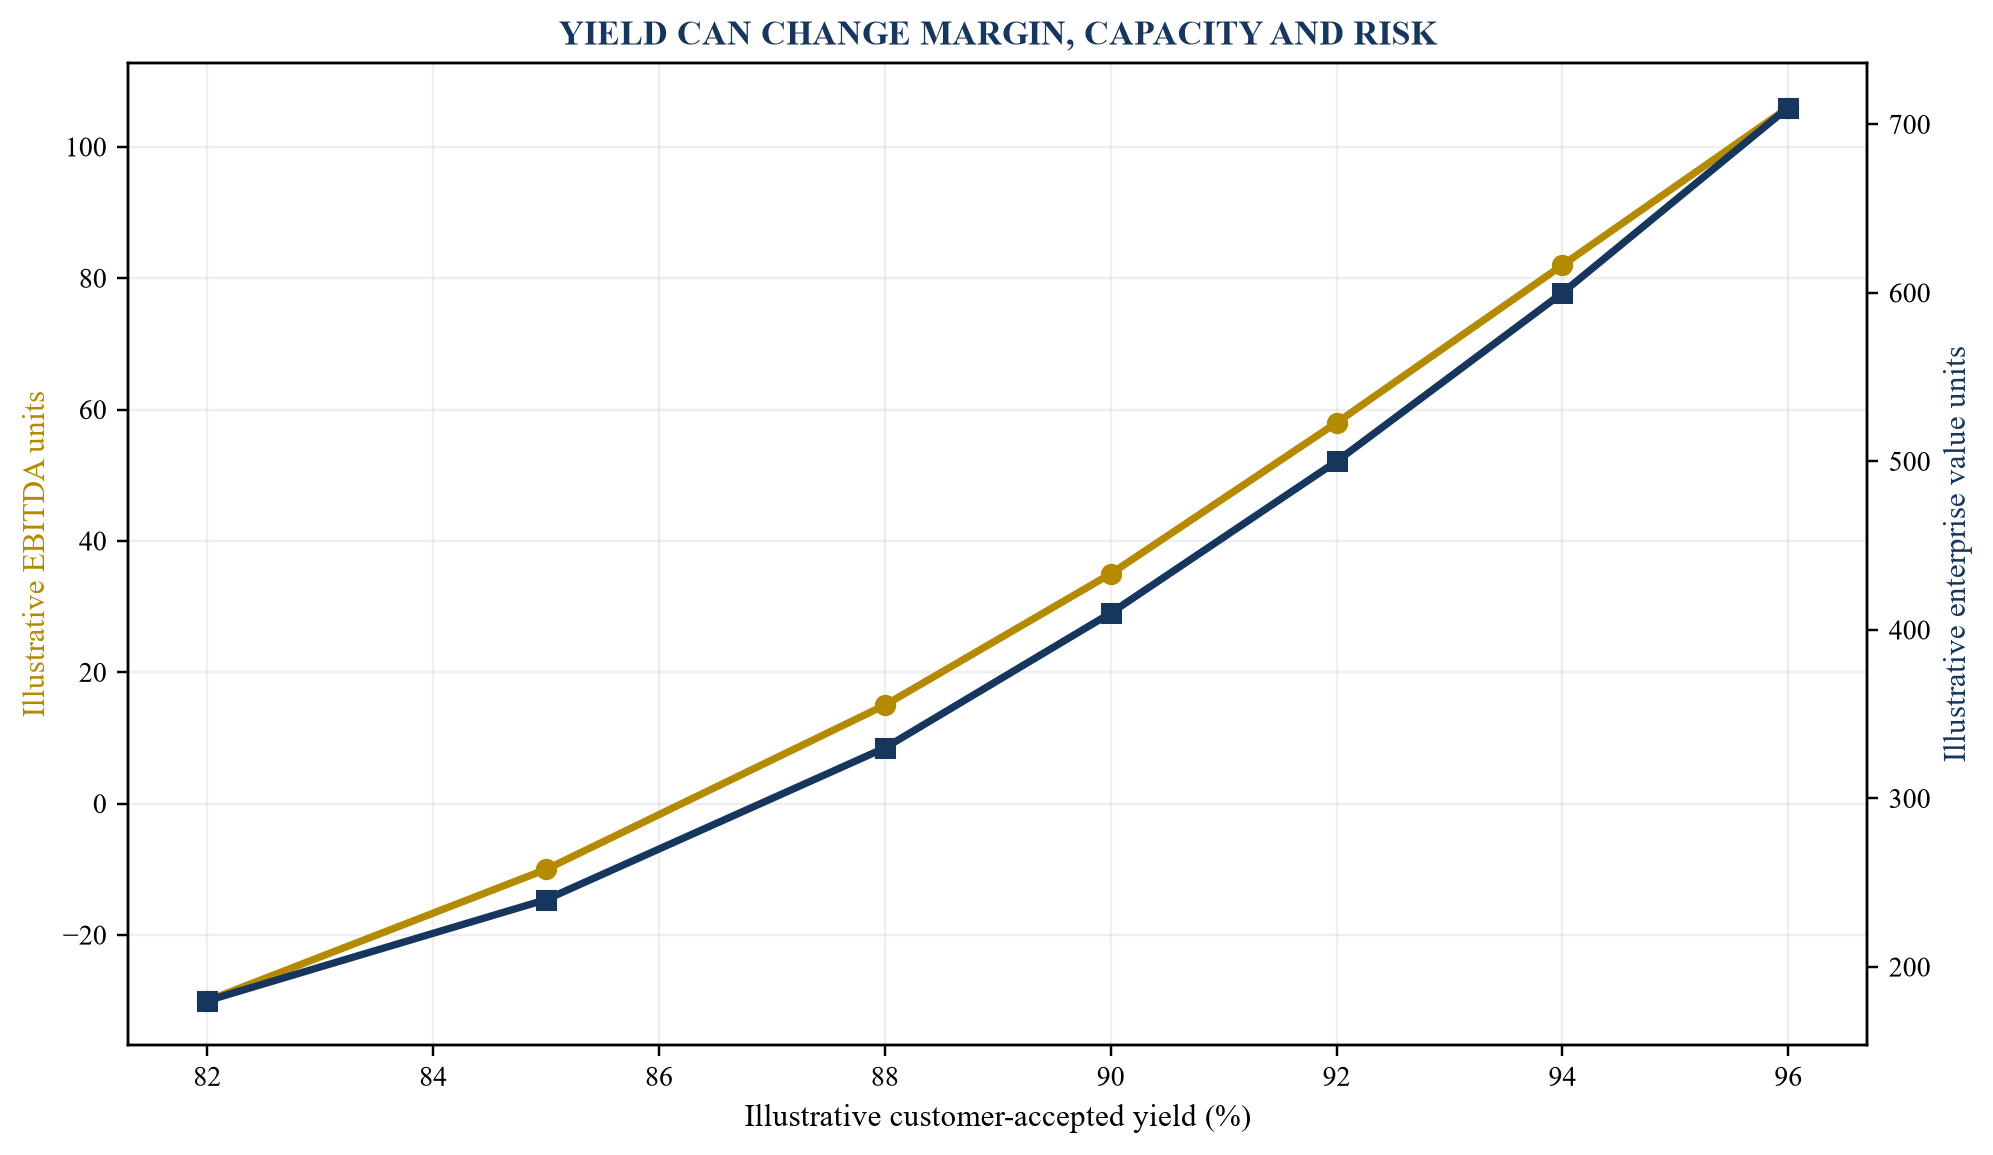
Illustrative values only; replace with transaction-specific demand, margin, tax, capital and discount-rate assumptions.
Valuation should connect evidence to cash flows and risk. Yield can affect material cost, conversion cost, saleable capacity, working capital and warranty. These channels should be modelled separately to avoid double-counting. Demand and qualification can limit the value of additional output.
Comparable multiples require similar product maturity, growth, margin, utilisation, customer concentration, chemistry and support. A ramping plant should not be valued as mature capacity without risk adjustment. Discounted cash flow should use scenario probabilities and explicit capital needs. Strategic synergies require an integration plan and should be separated from standalone value.
The valuation range should identify the evidence required to move between cases. Completion of customer qualification, sustained yield, closure of a critical model finding or proof of warranty stability can reduce risk and release value. A buyer can reflect this through price, contingent consideration or staged capital. Downside value should include the cash needed to remediate and ramp, because a technically recoverable plant may still require substantial additional funding before it produces durable free cash flow.
Valuation should also distinguish the value of the operating factory from the value of its digital quality platform. Factory cash flow includes physical capacity, contracts, people and working capital. The platform may support transfer to additional lines or sites only when data rights, validation, integration and customer approvals permit that use. A buyer should avoid capitalising the same yield benefit in the plant forecast and again as a separate software asset. Transfer value should be supported by observed deployment effort, performance retention and the economics of the next implementation. This separation clarifies which benefits belong to the acquired site, which can scale across a portfolio and which remain an option requiring further investment.
37. Run M&A and investment diligence
Table 4. Gigafactory transaction data room
| Workstream | Core evidence | Verification test |
|---|---|---|
| product | design, qualification and customer status | trace approved saleable output |
| process | routing, tool, recipe and control plan | walk material through each step |
| quality AI | data, model, validation and release | replay representative decisions |
| economics | mass balance, yield, cost and cash | reconcile plant to financial records |
| commercial | contracts, orders, claims and acceptance | trace output to invoice and collection |
| risk | safety, warranty, permits, cyber and IP | inspect findings and contingent exposure |
Access should be controlled and evidence should be reconciled to source systems.
Reviewers should select samples independently: accepted production, a false rejection, an escaped defect, a scrapped lot, a rework case and a customer claim. Each should connect material, process, inspection, decision, inventory, cost and outcome. The exercise tests whether operational and financial records tell the same story.
Site observation should compare documented and actual practice across shifts. Diligence should identify bottlenecks, temporary controls, manual work, engineering debt and single-person dependencies. Findings should enter price, structure, warranties, integration and the funding plan rather than remain in a technical appendix.
The diligence team should reconcile at least three periods: the latest month, a representative stable month and a difficult ramp or disruption month. This reveals how controls behave under pressure. It should also test a newly introduced product and an established product. Management explanations should be linked to work orders, process changes, quality records and financial consequences. Open issues should state materiality, owner, remedy, cost and completion evidence.
38. Structure financing around evidence milestones
Funding should retire the risks that prevent accepted output and cash. Milestones can include line commissioning, gauge capability, validated inspection, stable process window, specified first-pass yield, customer qualification, sustained accepted output, cost threshold and warranty maturity. Each requires a source, owner, date and acceptance test.
Equity can absorb technology and ramp uncertainty; project or asset-backed debt requires credible completion, offtake, cash flow and security. Strategic or customer capital can align qualification and demand and can create restrictions. Tranched structures can connect capital to independent evidence.
Terms should be assessed for dilution, control, covenant, completion support, reserve account, information rights and follow-on capacity. The financing model should preserve sufficient runway to reach the next verified milestone under a downside ramp. A production target without yield, qualification and cash evidence is an incomplete funding condition.
39. Use a one-hundred-day value plan
Table 5. One-hundred-day transaction and value plan
| Period | Priority | Gated output |
|---|---|---|
| days 1-15 | perimeter and metric dictionary | reconciled decision scope |
| days 16-30 | genealogy and mass balance | controlled production denominator |
| days 31-50 | model and metrology validation | accepted limits and findings |
| days 51-70 | root cause and yield bridge | verified improvement actions |
| days 71-85 | capacity, cost and cash model | integrated transaction forecast |
| days 86-100 | valuation and financing package | board-approved evidence case |
Timing is illustrative and should reflect product maturity, customer approval and transaction scope.
The plan should run through accountable engineering, operations, quality, commercial and finance owners. A weekly evidence review should reconcile definitions and close critical gaps. The board should approve the transaction perimeter, material claims, risk appetite and disclosure of limitations.
Readiness is reached when an independent reviewer can reproduce central yield, scrap, capacity and value claims from controlled records. Mixed performance can still support a transaction when uncertainty is explicit and appropriately structured. The plan should continue after closing through consistent definitions and variance reporting.
40. Conclusion
AI quality control can create material gigafactory value through earlier defect detection, faster root-cause learning, controlled process response and better use of material and bottleneck capacity. The value is defensible when each claim connects input, process, model, decision, accepted output and cash. Automation activity and lower recorded scrap are insufficient without this chain.
Boards and investors should distinguish first-pass, final and customer-accepted yield; reconcile mass, cell and energy; and value false rejection with defect escape. They should test model transfer, data rights, metrology, closed-loop authority, warranty, safety and environmental obligations. Nameplate should be converted into economic capacity using validated line evidence.
The transaction case should connect controlled outcomes to cost, working capital, forecast, valuation and financing milestones. This framework turns a broad factory-AI proposition into a decision-ready view of capacity, margin, risk and enterprise value, with explicit routes to stronger evidence.
The evidence should remain reproducible.
References
- International Energy Agency, Global EV Outlook 2026: Electric vehicle batteries, https://www.iea.org/reports/global-ev-outlook-2026/electric-vehicle-batteries
- International Energy Agency, Global EV Outlook 2026: Manufacturing and trade, https://www.iea.org/reports/global-ev-outlook-2026/manufacturing-and-trade
- International Energy Agency, Global EV Outlook 2025: Electric vehicle batteries, https://www.iea.org/reports/global-ev-outlook-2025/electric-vehicle-batteries
- International Energy Agency, Global EV Outlook 2024: Outlook for battery and energy demand, https://www.iea.org/reports/global-ev-outlook-2024/outlook-for-battery-and-energy-demand
- United States Department of Energy, Platform Technologies for Transformative Battery Manufacturing funding selections, https://www.energy.gov/cmei/ammto/funding-selections-platform-technologies-transformative-battery-manufacturing
- United States Department of Energy, Battery Manufacturing and Recycling Grants, https://www.energy.gov/cmei/manufacturing/battery-manufacturing-and-recycling-grants
- Argonne National Laboratory, BatPaC Model Software, https://www.anl.gov/amd/batpac-model-software
- Argonne National Laboratory, Estimated Cost of EV Batteries, 2024, https://www.anl.gov/sites/www/files/2024-11/GPRA2024_06Nov2024.pdf
- Argonne National Laboratory, BatPaC: Battery Manufacturing and Costs, https://publications.anl.gov/anlpubs/2022/07/176234.pdf
- National Renewable Energy Laboratory, Multi-Scale Modeling of Battery Physics, https://www.nrel.gov/transportation/multi-scale-battery-physics-modeling.html
- National Renewable Energy Laboratory, Supply Chain and Cost Analysis of Advanced Technologies, https://www.nrel.gov/manufacturing/advanced-tech.html
- National Institute of Standards and Technology, The Rise of Artificial Intelligence in U.S. Manufacturing, https://www.nist.gov/mep/rise-artificial-intelligence-ai-us-manufacturing-text-only
- National Institute of Standards and Technology, AI-Enhanced Monitoring in Manufacturing Processes, https://www.nist.gov/news-events/news/2024/05/nist-pursues-ai-enhanced-monitoring-manufacturing-processes
- National Institute of Standards and Technology, Industrial Artificial Intelligence: Key Considerations and Effective Implementation Strategies, https://www.nist.gov/mep/manufacturing-reports/best-practices/artificial-intelligence-key-consideration-and-effective
- National Institute of Standards and Technology, Artificial Intelligence Risk Management Framework 1.0, https://www.nist.gov/itl/ai-risk-management-framework
- National Institute of Standards and Technology, AI Risk Management Framework Playbook, https://airc.nist.gov/airmf-resources/playbook/
- European Union, Regulation (EU) 2023/1542 concerning batteries and waste batteries, https://eur-lex.europa.eu/legal-content/EN/TXT/?uri=CELEX:32023R1542
- European Union, Regulation (EU) 2024/1689 laying down harmonised rules on artificial intelligence, https://eur-lex.europa.eu/eli/reg/2024/1689/oj
- International Organization for Standardization, ISO 9001 Quality management systems, https://www.iso.org/standard/62085.html
- International Organization for Standardization, ISO/IEC 42001 Artificial intelligence management systems, https://www.iso.org/standard/81230.html
- International Electrotechnical Commission, IEC 62660 secondary lithium-ion cells for electric road vehicles, https://webstore.iec.ch/en/iec-search/result?query=IEC%2062660
- United Nations Economic Commission for Europe, UN Regulation No. 100, https://unece.org/transport/documents/2023/05/standards/un-regulation-no-100-rev3
- United Nations, Recommendations on the Transport of Dangerous Goods, Manual of Tests and Criteria, subsection 38.3, https://unece.org/transport/dangerous-goods/rev7-files
- United States Department of Energy, National Blueprint for Lithium Batteries 2021-2030, https://www.energy.gov/sites/default/files/2021-06/FCAB%20National%20Blueprint%20Lithium%20Batteries%200621_0.pdf
- International Energy Agency, Global Critical Minerals Outlook 2026: Market overview, https://www.iea.org/reports/global-critical-minerals-outlook-2026/market-overview
- International Valuation Standards Council, International Valuation Standards, https://ivsc.org/standards/
