

Introduction
Electric-vehicle charging has moved from early deployment to network scale in several markets. Governments have supported corridors, local authorities, workplaces and private operators through grants, tax relief, grid investment and mandatory coverage. Manufacturers, energy companies, infrastructure funds and technology platforms have also invested. The resulting industry contains different business models, asset ownership structures and maturity levels.
Scale now creates an M&A question. Some networks hold scarce motorway, retail or urban sites with secured power and rising utilisation. Others contain dispersed chargers whose installation was supported before customer demand matured. A portfolio can combine owned stations, host-owned equipment, software subscriptions, managed services and roaming contracts. Public charger count does not identify who owns the equipment, controls the customer or receives the cash.
Current market evidence shows both growth and variation. The International Energy Agency estimated more than 4 million public slow chargers globally in 2025, with China representing around 60%, and expects utilisation to rise as vehicle numbers grow faster than charger stock in several scenarios.[1] The United Kingdom reported 121,171 public chargers at 1 July 2026, including 28,887 rated at 50 kW or above.[2] Company disclosures also show different economics: Fastned reported 13.2% network utilisation in 2025 and €331,000 annual charging revenue per station, while EVgo reported average daily public-network throughput of 292 kWh per stall in the fourth quarter of 2025.[3][4]
These figures describe specific definitions and portfolios. A buyer needs site-level evidence. This paper addresses the investment decision: which assets, rights and cash flows justify acquisition value after subsidy-led expansion, and how should a buyer execute consolidation without destroying customer, grid or operating value?
1. Define the transaction thesis
The thesis should state the value mechanism. Common mechanisms include acquiring scarce sites, increasing utilisation, lowering equipment and energy cost, consolidating software, adding customer access, entering a geography, securing fleet demand or obtaining a development pipeline. Each mechanism requires different evidence.
Avoid using sector growth as a substitute for a transaction thesis. Electric-vehicle adoption can rise while a particular network loses share, operates weak locations or requires repeated capital. A buyer should identify the specific asset or capability it can improve.
Translate the thesis into measurable value drivers and a timeframe. Examples include energy throughput per charger, gross margin per kWh, uptime, service cost, subscriber retention, fleet volumes, station expansion and working-capital improvement. The integration plan should own each driver.
2. Establish the actual transaction perimeter
Charging businesses often cross legal entities and contracts. The perimeter may include land leases, licences, grid connections, transformers, chargers, software, customer applications, roaming agreements, employees, data, trademarks, development rights, grants and tax attributes.
Create an asset-and-rights schedule. Identify legal owner, operator, contracting party, location, transfer restriction, security interest and required consent. Reconcile it to fixed-asset registers, invoices, site surveys and regulatory data.
A share acquisition can transfer entities and liabilities while leaving change-of-control rights. An asset acquisition can select assets but require assignment of every site, connection and customer contract. The chosen perimeter should follow the thesis and feasible transfer path.
3. Separate owned, operated and accessible chargers
Marketing may refer to a network of chargers that includes owned equipment, host-owned chargers managed by the operator, third-party chargers reached through roaming and inactive locations. These categories have different value.
Owned chargers can produce energy or service margin and require maintenance capital. Managed chargers can produce recurring software or operating fees with limited asset ownership. Roaming access expands customer reach while providing less control and margin.
Reconcile charger counts by ownership, status, power, location and activity. Remove duplicates, decommissioned units and inaccessible equipment. Use the count only after the economic category is known.
4. Map the charging value chain
The operating system includes site host, landowner, distribution network, energy supplier, charger owner, charge-point operator, software provider, payment processor, roaming platform, maintenance provider, customer and vehicle manufacturer. Several roles can sit within one group or be outsourced.
Map cash and control. A site host may receive rent or revenue share. The operator may set price. The energy supplier may pass through costs. A software vendor can control authentication and settlement. The roaming platform can own the customer relationship.
Transaction value depends on the rights acquired across this chain. Equipment without a site right has limited utility. A site lease without grid capacity can require material capital. A customer application without dependable charging can lose users.
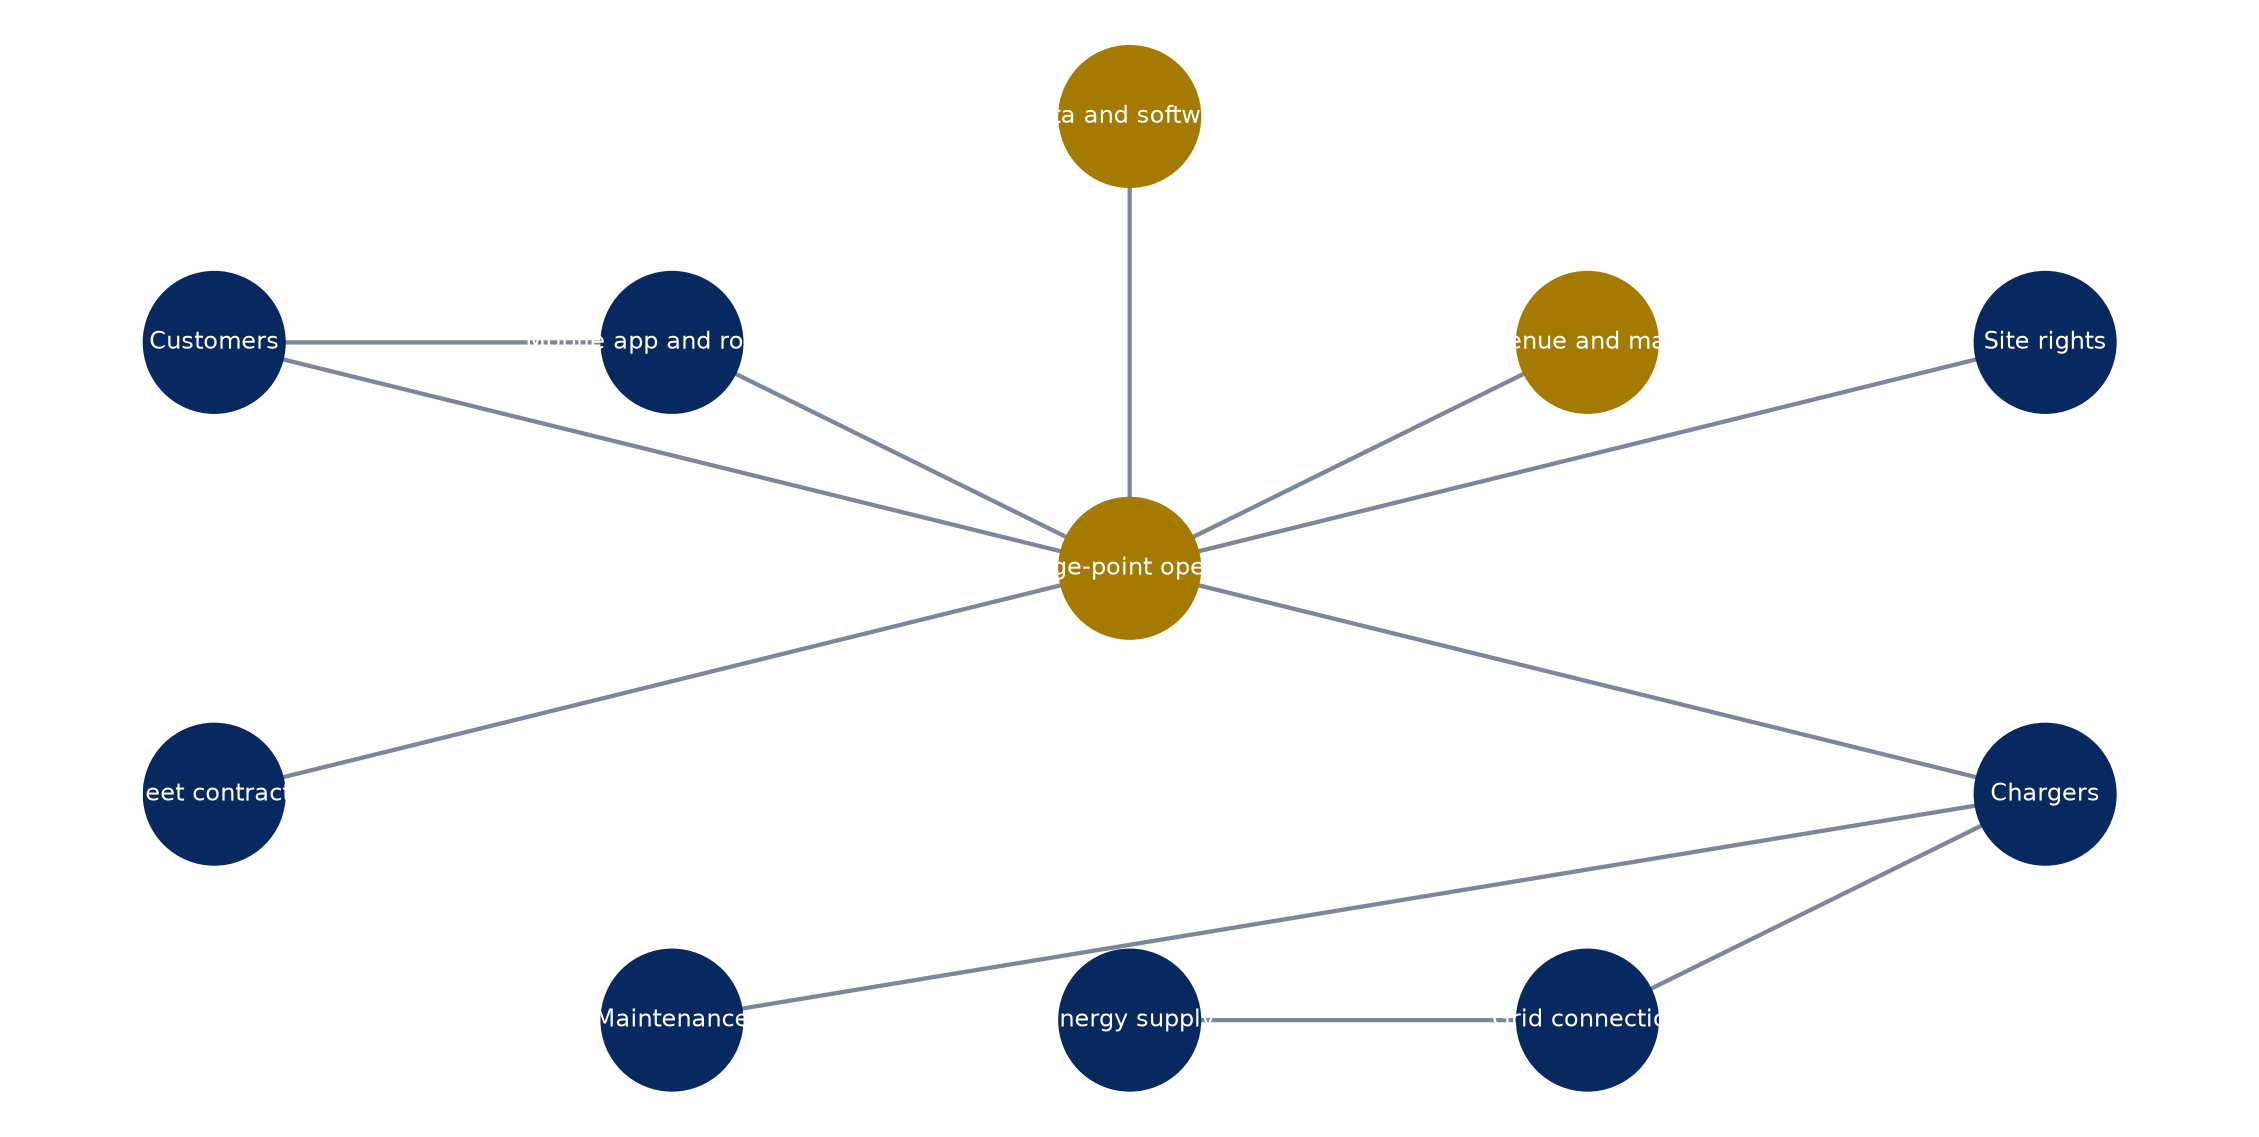
Proposed perimeter map; actual ownership, contracts and regulatory rights vary by transaction.
5. Build the site-level data room
The primary diligence unit is the charging site and, where relevant, each charging point or connector. Create a standard record covering location, coordinates, host, tenure, exclusivity, power, grid capacity, charger make, software, commissioning date, availability, sessions, energy, price, revenue, energy cost, maintenance, subsidy and planned capital.
Tie every field to evidence. Use signed agreements, utility documents, invoices, meter data, charger logs, payment records and physical inspection. Management spreadsheets can guide the process and require verification.
Preserve monthly history. Annual averages can hide rapid ramp-up, seasonal demand, outages or deteriorating reliability. Cohort analysis by commissioning date allows a buyer to distinguish young sites from structurally weak sites.
6. Test site rights
Location can be the scarce asset. Review lease or licence term, renewal, break, rent, revenue share, permitted use, access hours, parking control, signage, exclusivity, expansion rights and change of control. Confirm whether the contract covers chargers, transformer, cables and customer bays.
Compare contract life with equipment and valuation life. A ten-year model cannot rely on a site agreement that ends in three years without a credible renewal. Host termination after change of control can impair the perimeter.
Assess host concentration and quality. Motorway, retail, fuel, municipal and workplace hosts create different traffic and renewal dynamics. A portfolio concentrated with one host can offer scale and negotiation risk.
7. Verify grid connection value
Grid rights can require long lead times and material upgrade payments. Confirm contracted import capacity, energisation status, voltage, connection charges, curtailment, reinforcement obligations and expansion rights. Inspect whether the right transfers with the site or legal entity.
Compare charger nameplate power with site capacity. A station advertising several ultra-fast chargers may not deliver full simultaneous power. Load management can improve utilisation and reduce connection cost while affecting customer experience.
Treat secured capacity and an application differently. Development value should advance only as utility milestones are met. Identify deposits at risk and remaining capital.
8. Reconstruct historical subsidies
Create a subsidy register by site and programme. Record amount, eligible assets, matching contribution, payment date, operating period, reporting, pricing, open-access, domestic-content, maintenance and clawback terms.
Reconcile subsidy accounting to bank receipts and fixed assets. Determine whether proceeds reduced asset cost, funded revenue or created deferred income. The valuation should not capitalise a non-recurring grant as recurring operating cash.
Identify change-of-control and transfer requirements. A transaction can trigger consent or repayment. Include unresolved reporting and audit exposure in the purchase agreement and price mechanism.
9. Separate support from commercial economics
Subsidy can close an early funding gap, support coverage and reduce private capital. It can also mask low utilisation or uneconomic service obligations. Rebuild site economics before subsidy and after subsidy.
Show capital funded by the buyer, public support, host contributions and grid support. Then show recurring revenue, energy margin, operating cost, maintenance and replacement. A site can have positive cash contribution after support and weak return on total economic capital.
Use both views. The buyer pays for remaining cash flows and assumes obligations. Public funding history can matter for compliance and future competition without becoming an indefinite valuation multiple.
10. Measure utilisation consistently
Utilisation can mean occupied minutes divided by available connector minutes, delivered kWh divided by rated energy capacity, sessions per connector, or throughput per stall. Definitions produce different results.
Fastned defined time-based utilisation using session duration, sessions per day, charger count and 24 hours; it reported 13.2% network utilisation in 2025.[3] EVgo reported 292 kWh average daily throughput per stall for its public network in the fourth quarter of 2025.[4] These disclosures illustrate useful measures and remain company-specific.
Adopt one primary and several supporting measures. Reconcile them to source data. Report unavailable time separately so poor uptime does not mechanically increase utilisation of the remaining hours.
11. Analyse utilisation by cohort
Group sites by opening quarter, location type, power and geography. Plot energy and sessions from commissioning. Mature sites should show whether demand continues to grow, stabilises or declines.
Compare the portfolio average with weighted and unweighted site medians. A small number of high-volume stations can conceal a long tail of weak assets. Identify the share of gross margin produced by the top sites.
Use cohort curves to value recent openings. Apply performance from comparable mature sites after adjusting for local electric-vehicle penetration, traffic, competition and grid capacity. Keep development-stage assumptions separate.
12. Test demand drivers
Demand arises from local electric-vehicle stock, traffic, home-charging access, fleet routes, dwell time, nearby competition, pricing, amenities and charger reliability. Collect evidence for each site.
Public charging remains particularly important for drivers without private parking and for long journeys.[1] A motorway service area has different capture dynamics from an urban kerbside or supermarket. Avoid using one demand curve across formats.
Model vehicle compatibility and charge rate. The IEA reported that only a minority of available models can use the highest ultra-fast power, despite continued expansion of such equipment.[1] Nameplate power should not automatically produce premium pricing or throughput.
13. Examine pricing and energy margin
Reconstruct realised revenue per kWh after tax, roaming commission, discounts, subscriptions, idle fees and refunds. Compare it with energy purchase, network charges, demand charges, losses and hedging.
Price can vary by customer channel and time. Direct-app customers may generate different margin from roaming users or fleets. A subscription can shift revenue from energy to recurring fees.
Stress wholesale energy, network tariffs and competitive price response. A buyer with a larger energy book may improve procurement. That synergy requires contract transfer, forecasting and credit support.
14. Test reliability
Reliability affects demand, regulation and brand. Use charger logs to calculate availability by connector and site. Separate planned maintenance, grid outage, communications, payment, software and hardware faults.
The UK Public Charge Point Regulations require a 99% annual-average reliability measure for rapid public networks and specific reporting, open-data, payment and helpline obligations.[5] A buyer should verify current and historical compliance and the quality of source statuses.
Inspect repeat-failure equipment and spare-parts availability. A headline network average can conceal chronically unavailable sites. Value should recognise replacement capital and lost customer trust.
15. Review hardware condition
Inventory manufacturer, model, power, connector, warranty, firmware, commissioning date and service history. Conduct sample physical inspections and expand testing when anomalies appear.
Assess remaining support and parts. Early hardware may be functional and expensive to maintain, unable to meet payment or accessibility requirements, or incompatible with current software. Replacement can require civil work and recertification.
Create a lifecycle capital plan. Separate routine maintenance, major repair, technology upgrade and complete replacement. Deduct the present value from enterprise value when current cash flow depends on future spend.
16. Review software architecture
The platform manages charger communication, authentication, pricing, payment, roaming, monitoring, remote repair, customer service, data and reporting. Identify ownership and licences for each component.
Assess protocol support, APIs, data model, uptime, scalability, cyber controls and release process. Determine whether hardware is locked to a backend and what migration requires. Review third-party termination and change-of-control.
Software can create recurring subscription value or operating leverage. It can also carry technical debt and duplicated functionality after consolidation. Build a target architecture before assigning synergy.
17. Test interoperability and roaming
Roaming expands accessible coverage and can reduce customer friction. It also introduces clearing fees, data dependencies and settlement disputes. Identify the customer's contractual relationship and margin by channel.
Regulation (EU) 2023/1804 establishes common requirements for user information, payment, data and technical interoperability across alternative-fuels infrastructure.[6] The UK regime also requires payment roaming and open data in specified circumstances.[5]
Map every roaming and mobility-service agreement. Review exclusivity, pricing authority, data access, receivables, termination and migration. A buyer should avoid paying twice for the same customer relationship.
18. Reconcile customers and contracts
Segment ad hoc drivers, subscribers, fleets, manufacturers, site hosts and managed-service customers. Reconcile registered accounts to active, paying customers and charging sessions.
Review fleet minimums, price, indexation, service level, vehicle rollout, termination and credit. Manufacturer programmes can fund charging credits or guarantee throughput for a defined period. Separate sponsored demand from retained customer economics.
Analyse retention and cohort behaviour. Customer counts without sessions or margin provide limited value. Preserve privacy and lawful data-transfer rights during the transaction.
19. Analyse competition site by site
Competition operates within a site, between nearby sites and across customer platforms. Map rival chargers by power, price, amenities, uptime and accessibility. Include planned capacity when evidence is credible.
The UK Competition and Markets Authority identified limited motorway competition, grid constraints and long-term exclusivity as important barriers in its charging market study.[7] It later accepted commitments addressing specified exclusive arrangements.[8]
A transaction that increases local concentration can attract scrutiny or reduce host choice. Conduct competition analysis early. Consider access, divestment or contract remedies in the valuation and timetable.
20. Review subsidy-led overbuild
Subsidy criteria can prioritise geographic coverage or capital installation. Commercial demand may mature later. Identify sites whose purpose was coverage, compliance or corridor continuity rather than near-term return.
Coverage sites can create network value and public benefit. Value them through strategic contribution, contractual support and future demand. Avoid applying mature-site multiples to low-use sites without a time and capital path.
Assess whether nearby subsidised competitors can constrain price and utilisation. Future tenders may add capacity. Include publicly announced programmes and utility plans in the market map.
21. Build the diligence heatmap
Score each site and central platform across title, contracts, grid, hardware, utilisation, margin, reliability, software, regulation, subsidies, competition and capital needs. Use evidence quality and risk severity separately.
A red score can indicate missing evidence or an adverse fact. The response differs. Missing grid documents require verification; an expiring site right requires valuation adjustment or contract action.
Aggregate heatmaps should preserve site-level exceptions. A portfolio average can obscure a critical motorway lease or a subsidy clawback. Assign owners and decision dates to every red item.
Table 1. Charging-network M&A diligence heatmap
| Area | Evidence | Green condition | Red condition | Transaction response |
|---|---|---|---|---|
| Site rights | leases, licences and consents | tenure covers valuation life | near-term expiry or transfer restriction | consent, extension, carve-out or price adjustment |
| Grid | connection agreement and bills | energised transferable capacity | application only, curtailment or upgrade liability | condition precedent and capex reserve |
| Assets | register, invoices and inspection | verified title and supported hardware | disputed title, ageing or unsupported equipment | perimeter correction and replacement plan |
| Utilisation | interval sessions and kWh | coherent cohort growth | low use, unexplained gaps or concentration | revised forecast and site triage |
| Reliability | logs and regulatory reports | stable uptime and fast repair | chronic failures or weak status data | remediation covenant and holdback |
| Subsidies | grant files and reporting | compliant and transferable | clawback, missing reports or restricted transfer | indemnity, escrow or exclusion |
| Software and data | architecture, licences and security | portable data and supported interfaces | lock-in, technical debt or control weakness | migration plan and specific protection |
| Competition | local map and contracts | defensible location without harmful exclusivity | local concentration or restrictive terms | clearance strategy and remedy case |
Proposed heatmap; ratings require transaction-specific evidence and professional review.
22. Reconstruct site economics
For each site, calculate revenue, energy cost, payment and roaming fees, host payment, network charges, maintenance, customer service, software allocation, insurance and local operating cost. Show contribution before and after central overhead.
Allocate costs using operational drivers. Charger count may allocate monitoring, while sessions allocate payment support and energy allocates losses. Avoid placing all central cost on mature sites and treating new sites as free options.
Reconcile to financial statements and cash. Site models should explain portfolio gross margin, working capital and capital additions. Differences require resolution before valuation.
23. Separate business models
Owner-operator networks earn charging margin and bear site and asset capital. Asset-light software providers sell hardware, subscriptions or managed services. Fleet-depot developers can earn construction and operations revenue. Roaming platforms earn transaction fees.
A consolidated group can contain all models. Use segment economics and appropriate valuation methods. Hardware sales, recurring software, owned-infrastructure cash flow and development pipeline should not share one multiple without analysis.
Identify intercompany transactions. A platform may sell equipment to an affiliate or capitalise development margin. Recast to a buyer's perimeter and accounting.
24. Analyse working capital
Customers may prepay wallets or subscriptions. Roaming settlement can create receivables and payables. Energy bills, host revenue shares, grants and tax can have different timing.
Determine whether customer funds are restricted, refundable or earned. Protect them in the transaction. Review ageing and disputes by roaming counterparty and fleet.
Set a normal working-capital target using seasonality and growth. Development businesses can hold equipment inventory and supplier deposits that require separate treatment.
25. Inspect reported earnings quality
Reconcile EBITDA to site contribution and cash. Remove non-recurring grants, asset-sale gains, development fair values, capitalised costs and transaction items. Identify recurring stock compensation and central platform spend.
Maintenance can be capitalised or expensed depending on policy. Review whether charger replacement is sustaining capital. Cash conversion matters in a hardware-intensive network.
Use monthly and site-level evidence. Management adjustments should have a defined basis. Keep planned synergies outside historical earnings.
26. Define the development pipeline
Pipeline labels can include prospects, signed hosts, grid applications, permitted sites, energised construction and operational stations. Define stages and attrition. Verify each project.
Value advanced sites through expected cash after remaining capital and probability. Early prospects can support strategic narrative and should receive limited value without exclusive rights.
Review deposits, construction contracts, equipment commitments, deadlines and subsidy milestones. A large pipeline can create funding obligations before it creates cash.
27. Review land and host concentration
Charging networks can depend on motorway service groups, fuel retailers, supermarkets, local authorities or property managers. Calculate revenue and installed capacity by host.
Review negotiation leverage, renewal, expansion, rent and service performance. Consolidation can improve the buyer's offer to hosts and can cause concentration concerns or contractual conflicts.
Identify overlapping rights. Two acquired networks may have competing exclusivity or minimum-build commitments with the same host. Resolve these before closing or include a separation plan.
28. Examine grid and equipment commitments
Outstanding connection charges, transformer purchases, minimum equipment orders and construction contracts can exceed reported debt. Build a committed-capital schedule.
Classify cancelable and non-cancelable obligations. Review supplier termination, indexation and performance security. Identify equipment ordered for sites without final host or grid rights.
Treat committed capital as part of enterprise value analysis. The buyer should understand which obligations support the thesis and which represent stranded development.
29. Assess cyber, payment and privacy risk
Charging platforms process payment, account, vehicle, location and operational data while controlling distributed electrical equipment. Review security architecture, access, encryption, patching, monitoring, incidents and recovery.
Inspect payment-card compliance, refunds, chargebacks and fraud. Contactless terminals and roaming expand dependencies. Regulatory reliability can include payment availability.[5]
Confirm legal basis and transfer for customer data. Build an integration plan that preserves consent, retention and breach response. Price unresolved incidents and control gaps.
30. Review regulation by geography
Regulatory obligations can cover pricing, payment, roaming, open data, reliability, accessibility, metering, cybersecurity, construction, energy resale and consumer protection. Map them by asset.
The European Union's Alternative Fuels Infrastructure Regulation includes deployment, user-information, payment, data and interoperability requirements.[6] National rules can add obligations. The US NEVI programme applies minimum standards to funded projects and issued revised guidance in August 2025.[9]
Include compliance capital and operating cost. A target operating across several jurisdictions needs consistent controls and local accountability.
31. Build the standalone valuation
Value mature owned sites through site-level cash flow and remaining capital. Value recurring software or management contracts through their contract economics, retention and platform cost. Value development sites through probability-weighted cash after future investment.
Use market multiples only after matching business model, growth, margin, capital intensity, geography and accounting. Public charging companies can report materially different revenue mixes and profitability.
Apply corporate costs, debt, leases, working capital, tax and contingent liabilities. Reconcile enterprise and equity value with the transaction perimeter.
32. Create the valuation bridge
Begin with reported enterprise value or headline EBITDA. Adjust for perimeter, recurring subsidy, earnings quality, site cohort, maintenance capital, grid commitments, working capital and liabilities. Add only evidenced synergies net of cost and delay.
The hypothetical bridge below uses an index with headline enterprise value of 100. It illustrates direction and discipline. It is not an observed valuation.
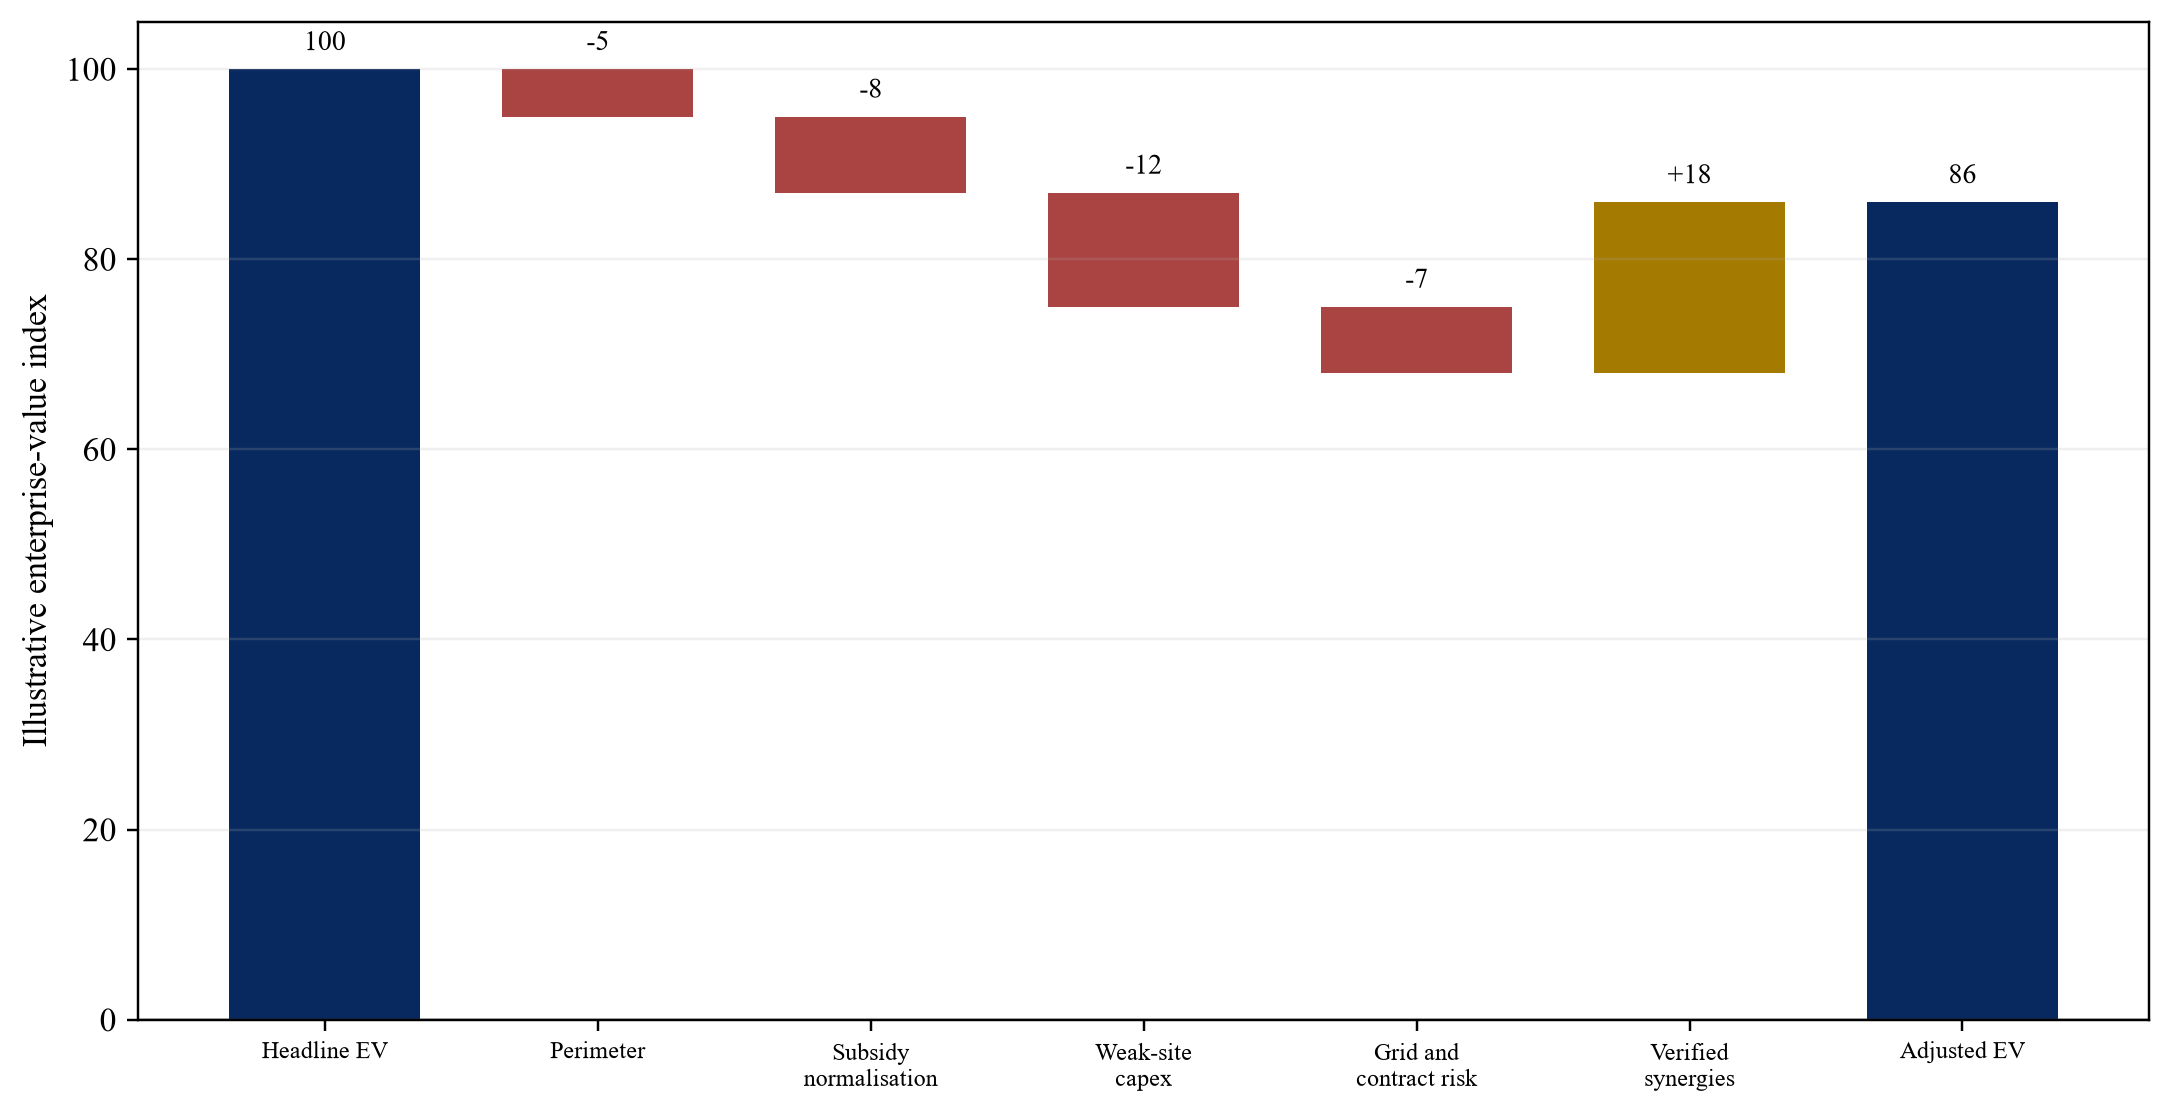
Illustrative index only; adjustments do not represent any identified company or transaction.
33. Value synergies rigorously
Potential synergies include energy procurement, software consolidation, roaming fees, maintenance, call centre, payment, equipment purchasing, host expansion, customer cross-sell and central overhead. Model each with an owner, baseline, timing, implementation cost and dependency.
Revenue synergy requires capacity and customer behaviour. A larger map may improve the proposition, while overlapping sites can cannibalise volume. Pricing power can be constrained by competition and regulation.
Apply probability and tax. Deduct stranded contracts, redundancy, migration, rebranding, equipment integration and disruption. Include only buyer-specific value that the transaction can capture.
34. Analyse dis-synergies
Consolidation can trigger host termination, grant consent, customer churn, roaming repricing, supplier claims and employee loss. A common platform migration can reduce reliability. Competition remedies can remove attractive sites.
Identify conflicts between acquired commitments. Different networks may promise exclusivity to manufacturers, fleets or hosts. Customer tariffs and service levels may not align.
Model dis-synergies before final bid. Put mitigation into closing conditions, retention plans and Day One operations.
35. Test acquisition financing
Debt capacity should follow recurring cash after energy, host payments, maintenance and lifecycle capital. Development pipeline and subsidy receivables require separate facilities or equity.
Use site diversification, contract tenure and grid rights in the credit analysis. Merchant charging revenue can grow and remains exposed to utilisation and price. Apply downside cases for slower vehicle adoption, lower margin and higher replacement.
Structure reserves and covenants around uptime, utilisation, liquidity and committed capital. Avoid using unverified synergies to meet initial debt service.
36. Choose share or asset acquisition
A share purchase preserves licences, employees and contracts within the entity, subject to change-of-control. It also transfers historical liabilities. An asset purchase can select stations or software and requires assignments, novation and employee analysis.
Charging portfolios may benefit from a hybrid carve-out. High-quality sites can transfer while development liabilities remain, or a platform can transfer with a transitional service agreement.
The structure should reflect consent feasibility, tax, grants, regulatory approvals, security and operational continuity. Build the transfer schedule before signing.
37. Design purchase-price protections
Use closing accounts or locked-box mechanisms appropriate to the business. Define debt, leases, customer funds, grant liabilities, development commitments and working capital precisely.
Consider holdbacks or earn-outs tied to verified site transfer, grid energisation, contract renewal, subsidy clearance or utilisation. Metrics should be auditable and resistant to integration choices.
Specific indemnities can address known grant, tax, regulatory, cyber or title exposure. Escrow and guarantee value depend on counterparty credit and duration.
38. Plan Day One continuity
Customers must locate, activate, pay and receive support without interruption. Chargers should remain connected to a working backend. Energy, maintenance and emergency contacts must continue.
Identify every critical contract, credential, certificate, domain, API, bank account and employee. Test access and fallback. Freeze unnecessary software changes around closing.
Communicate only verified changes. Hosts, fleets, roaming partners and regulators may need notice. A stable Day One protects revenue and evidence for later integration.
39. Decide integration versus separation
Integrate where scale improves value and execution risk is manageable. Candidate areas include customer access, monitoring, payment, maintenance procurement, energy and central functions. Preserve separate systems where regulation, host terms, hardware compatibility or customer proposition require it.
Set a target architecture and interim operating model. A forced platform migration can reduce uptime. Parallel operation costs money and can protect service while interfaces are proven.
Use explicit migration gates: data reconciliation, charger lab test, pilot site, failure recovery, payment settlement, roaming, regulatory reporting and customer support. Expand only after evidence.
40. Build the integration or separation roadmap
During the first ninety days, stabilise service, secure contracts and data, validate assets and establish synergy owners. Avoid broad hardware or backend migration before the baseline is known.
During months four to nine, integrate low-risk procurement, reporting and support. Pilot customer and software migration on representative sites. Begin weak-site remediation and overlapping-site decisions.
During months ten to twenty-four, complete proven migrations, renew strategic sites, expand high-value locations and separate or exit non-core assets. Rebase financing and valuation on verified operating performance.
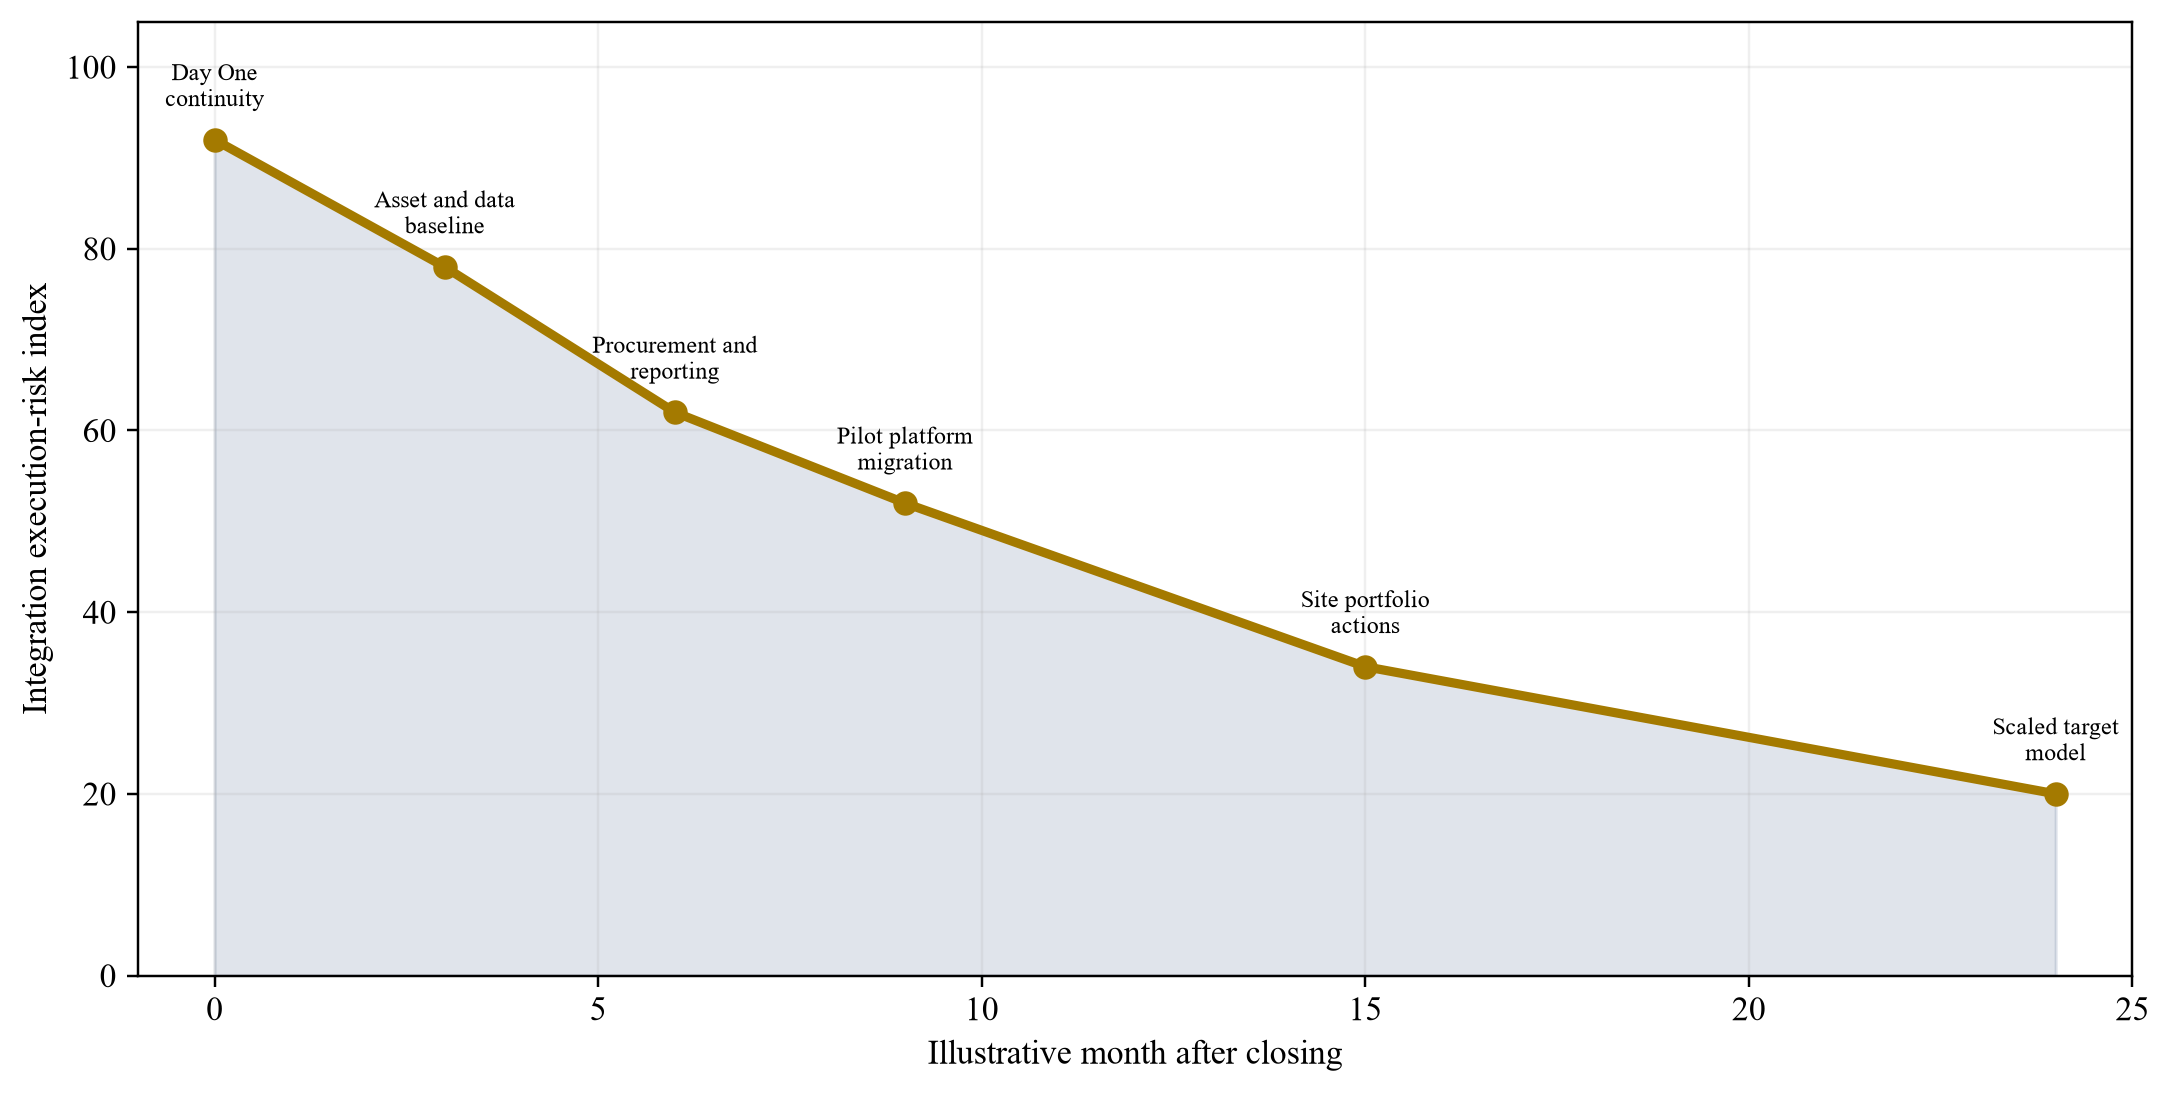
Illustrative sequencing; actual timing depends on consents, systems, sites, regulation and customer risk.
41. Triage the site portfolio
Classify sites as expand, improve, hold, relocate or exit. Use utilisation, margin, site right, grid value, reliability, competition and strategic coverage. Apply a consistent framework and preserve local judgement.
An underused site with long tenure and secured high-power connection can retain option value. A busy site with expiring rights can have fragile value. The action should follow future cash and strategic contribution.
Set milestones and capital caps. Relocation and closure require host, customer, grant and decommissioning analysis. Record recovered equipment and environmental obligations.
42. Protect customer experience
Consolidation can alter apps, tariffs, subscriptions, roaming and branding. Map every customer journey and failure point. Preserve ad hoc payment and support.
Test communications, account migration, stored payment, receipts, refunds and privacy. Avoid forcing account migration before chargers and backend are stable.
Track complaints, failed sessions, payment errors, uptime, queue and churn. Customer deterioration should trigger migration pause and root-cause review.
43. Establish post-close covenants
Track active chargers, availability, sessions, kWh, revenue per kWh, energy margin, maintenance, payment success, customer retention, site renewals, grid milestones, subsidy compliance and sustaining capital.
Report by site cohort and business model. Aggregate metrics can conceal weak migrations or stranded assets. Preserve seller-era baseline definitions for comparison.
Set thresholds for remediation, capital pause, impairment and exit. Lenders and boards should receive deviations and corrective actions.
44. Build the risk-allocation matrix
Allocate each material risk to a party with control and credit. Sellers can support historical title, compliance and reporting. Buyers control integration and future operation. Utilities and hosts retain external rights.
Conditions precedent should address approvals, consents and critical evidence. Warranties address unknown historical facts. Indemnities address identified exposure. Earn-outs can bridge value uncertainty when metrics are objective.
Retained risk belongs in price and financing. A contractual claim does not create cash when the counterparty lacks capacity.
Table 2. Charging-network transaction risk allocation
| Risk | Primary evidence | Contract response | Buyer operating control | Value treatment |
|---|---|---|---|---|
| Site and asset title | leases, invoices and registers | warranty, consent and condition precedent | transfer register and audit | exclude unsupported assets |
| Grid capacity | utility agreements and bills | specific warranty and milestone | demand management and upgrade | probability-weight pipeline |
| Subsidy clawback | grant files and correspondence | indemnity and escrow | future reporting | deduct unresolved exposure |
| Reliability | charger logs and reports | service warranties and holdback | maintenance and platform plan | lifecycle capex adjustment |
| Customer and roaming | contracts and settlement | assignment and retention condition | pricing, service and migration | cohort cash-flow valuation |
| Cyber and data | assessments and incidents | warranty, indemnity and remediation | controls and response | cost and contingent reserve |
| Competition clearance | market shares and local maps | approval condition and cooperation | remedy execution | probability and remedy cost |
| Integration | architecture and plan | transitional services where needed | phased migration and stop rules | synergy haircut and cost |
Proposed allocation principles; actual protection depends on law, contracts, credit and negotiated terms.
45. Apply the investment-committee test
The committee should receive the perimeter schedule, site data room, grid and host rights, utilisation cohorts, reliability, customer and roaming economics, subsidy register, lifecycle capital, competition assessment, valuation bridge and integration plan.
Approval should answer six questions. Which assets and rights transfer? Which sites produce durable cash? Which obligations survive support? What capital restores or expands the network? Which synergies are executable? Can the buyer preserve service through integration?
Conditions should follow gaps. The committee can authorise exclusivity, confirmatory diligence, signing and closing separately. Price should remain linked to verified evidence.
46. Illustrative transaction scorecard
The table below provides a structured decision view. It uses qualitative ratings and requires transaction evidence. A buyer can weight categories according to its thesis.
Table 3. Illustrative charging-network acquisition scorecard
| Category | Core question | Evidence threshold | Downside response |
|---|---|---|---|
| Strategic fit | Does the target add scarce sites, customers or capability? | identified overlap and owner for value | exclude broad sector-growth premium |
| Commercial quality | Are utilisation and margin durable by cohort? | interval data reconciled to cash | lower forecast and site-specific impairment |
| Asset quality | Are chargers supported and sites secured? | inspection, title and lifecycle plan | replacement reserve or carve-out |
| Grid quality | Is capacity energised, transferable and expandable? | executed utility documents | condition precedent and delayed value |
| Regulatory quality | Are grants and operating rules satisfied? | complete compliance record | indemnity, escrow and remediation |
| Integration feasibility | Can service continue through migration? | target architecture and tested gates | parallel operation and synergy haircut |
| Financing capacity | Does downside cash support obligations? | stress-tested cash after capex | lower leverage and liquidity reserve |
Proposed decision framework; ratings require verified transaction evidence.
47. Limitations
This framework is general and does not replace legal, tax, accounting, competition, technical, grid, cyber, environmental, regulatory or valuation advice. Charging regulation, subsidy programmes, technology, energy prices and vehicle adoption can change.
Company disclosures describe reported performance under company definitions. They do not establish comparable valuation or transferable economics. Transaction diligence should verify every material asset, contract and cash flow.
All numerical exhibits are hypothetical. They describe no identified operator, subsidy, site, valuation, synergy or transaction. They should not be used as forecasts or investment advice without verified deal evidence.
48. Conclusion
Charging-network consolidation can create value through scarce locations, grid capacity, customer access, procurement, software and operating scale. Value resides in verified rights and cash flows at site and contract level.
Subsidy history matters because it shaped deployment, obligations and competitive supply. A buyer should separate public support from recurring economics, classify development options by evidence and deduct lifecycle and integration capital.
The strongest transaction process begins with a precise perimeter, verifies site cohorts, builds a disciplined valuation bridge and stages integration. Charger count becomes useful after ownership, availability, utilisation, margin and capital are understood. This approach allows consolidation to strengthen network performance while protecting customers, competition and investment returns.
Appendix A Investment-committee questions
1. What is the precise legal, asset and contract perimeter?
2. How many chargers are owned, managed, roaming-accessible, inactive or planned?
3. Which site rights transfer, and how long do they last?
4. Which grid connections are energised, contracted or applications?
5. Which subsidies funded each site, and what obligations or clawbacks survive?
6. What are sessions, energy, revenue and margin by site and month?
7. How is utilisation defined, and is unavailable time shown separately?
8. Which sites produce most portfolio contribution?
9. What hardware is unsupported or requires replacement?
10. Which software, licences, certificates and data rights transfer?
11. What customer and roaming channels create revenue and margin?
12. Which fleet or manufacturer volumes are contracted or sponsored?
13. What reliability and regulatory evidence supports compliance?
14. How concentrated are sites, hosts, utilities and suppliers?
15. Which development obligations and equipment commitments remain?
16. Which local markets present competition concerns?
17. What maintenance and lifecycle capital is required?
18. Which synergies have owners, cost, timing and evidence?
19. Which systems integrate, remain separate or exit?
20. Does downside cash support the proposed purchase price and financing?
References
- International Energy Agency, Electric vehicle charging, Global EV Outlook 2026, 20 May 2026. https://www.iea.org/reports/global-ev-outlook-2026/electric-vehicle-charging-chap-6-and-10
- UK Department for Transport, Public electric vehicle charging infrastructure statistics: 1 July 2026, 27 August 2026. https://www.gov.uk/government/statistics/electric-vehicle-charging-infrastructure-statistics-1-july-2026/public-electric-vehicle-charging-infrastructure-statistics-1-july-2026
- Fastned B.V., Annual Report 2025, 19 March 2026. https://www.fastnedcharging.com/media/myzn5jx0/2025-annual-report-final.pdf
- EVgo Inc., Record Fourth Quarter and Full Year 2025 Results, 3 March 2026. https://investors.evgo.com/news-releases/news-release-details/evgo-inc-reports-record-fourth-quarter-and-full-year-2025
- UK Office for Zero Emission Vehicles and Department for Transport, Public Charge Point Regulations 2023 guidance, updated 21 October 2024. https://www.gov.uk/government/publications/the-public-charge-point-regulations-2023-guidance/public-charge-point-regulations-2023-guidance
- European Parliament and Council, Regulation (EU) 2023/1804 on the deployment of alternative fuels infrastructure, consolidated text 8 January 2026. https://eur-lex.europa.eu/legal-content/EN/TXT/PDF/?uri=CELEX%3A02023R1804-20260108
- UK Competition and Markets Authority, Electric vehicle charging market study: final report, 23 July 2021. https://www.gov.uk/government/publications/electric-vehicle-charging-market-study-final-report/final-report
- UK Competition and Markets Authority, Investigation into the supply of electric vehicle chargepoints on or near motorways, decision 8 March 2022. https://www.gov.uk/cma-cases/investigation-into-the-supply-of-electric-vehicle-chargepoints-on-or-near-motorways
- US Department of Transportation, Revised National Electric Vehicle Infrastructure Formula Program Guidance, 11 August 2025. https://www.transportation.gov/briefing-room/president-trumps-transportation-secretary-sean-p-duffy-unveils-revised-nevi-guidance
- EVgo Inc., Form 10-K for year ended 31 December 2025, filed 2026. https://www.sec.gov/Archives/edgar/data/1821159/000110465926024827/evgo-20251231x10k.htm
- ChargePoint Holdings, Inc., Fourth Quarter and Full Fiscal Year 2026 Financial Results, 2026. https://investors.chargepoint.com/news/news-details/2026/ChargePoint-Reports-Fourth-Quarter-and-Full-Fiscal-Year-2026-Financial-Results/default.aspx
- Allego N.V. and Meridiam, Expiration and Final Results of Tender Offer, 1 August 2024. https://ir.allego.eu/financial-center/sec-filings/content/0001193125-24-190766/d880659dex99a5f.htm
- International Energy Agency, Electric vehicle charging, Global EV Outlook 2025, 14 May 2025. https://www.iea.org/reports/global-ev-outlook-2025/electric-vehicle-charging
- The Public Charge Point Regulations 2023, UK Statutory Instrument 2023 No. 1168. https://www.legislation.gov.uk/uksi/2023/1168/contents/made
About the Author
Authored by Chennakeshav Adya Independent Researcher
Chennakeshav (CK) is a corporate finance and investment banking executive with 25+ years of global experience in deal origination, structuring and execution across M&A, growth capital and corporate strategy. He has led value-creation mandates for founders, corporates and funds — bridging the boardroom view to hands-on execution and close.
His career spans Morgan Stanley, HSBC, Lloyds Banking Group, EWEC, ADQ portfolio companies and Emirates Growth Fund, across TMT, real estate, fintech, deeptech, cleantech, infrastructure and energy. He has partnered with C-suite leaders, private equity and venture funds, sovereign wealth funds and family offices to finance complex fund raises and scale-up ventures, and has led M&A due diligence, post-merger integration and business-transformation initiatives to create value.
At Matchpoint Partners he is Managing Partner, leading the firm's corporate finance, M&A and capital-raising practice. He holds an MBA from London Business School, an engineering degree from VTU and a Master of Laws (LLM, in progress) from UCL London.
An active start-up mentor, CK mentors at Techstars, DIFC FinTech Hive, Startup Grind, Founder Institute and IN5, serves as Entrepreneur Mentor in Residence (EMiR) at London Business School, and judges the Entrepreneurship World Cup.
Matchpoint profile: https://www.matchpoint-partners.com/team/ck-adya.html LinkedIn: https://www.linkedin.com/in/ckadya/
