

1. Define the acquisition decision
The commercial question is whether the target owns a durable and transferable stream of profitable customer consumption. That question has four parts: customers must continue using the product; usage must convert into enforceable and collectible revenue; incremental consumption must produce acceptable contribution; and the relationship must survive ownership, product, pricing and infrastructure changes after completion.
Usage-based revenue is not one commercial model. Some customers sign capacity commitments and consume against prepaid balances. Others pay monthly in arrears. Hybrid arrangements combine a fixed platform fee, included units, metered overages and professional services. Minimum commitments may expire, roll over, convert into credits or trigger make-whole payments. The diligence team should classify each contract before aggregating performance.
The board should state the decision in measurable terms. It is considering a defined transaction value and financing structure for a business whose value depends on a specified customer perimeter, billable events, consumption growth, renewal behaviour, unit cost and post-close operating plan. The approval should identify the downside conditions that reduce value, alter consideration or stop the transaction.
Public filings illustrate the distinction. Snowflake states that it recognises product revenue as customers consume compute, storage and data-transfer resources, including under capacity and on-demand arrangements. It also states that consumption timing is inherently variable at customers' discretion. [1] Fastly states that substantially all of its revenue is usage-based and describes contracts that bill committed or actual use. [2] These disclosures are company-specific. They demonstrate why diligence must follow the contract and event data rather than impose a subscription template.
Commercial diligence should end with a decision bridge. It begins with reported performance, replaces unsupported measures with reconstructed evidence, applies customer and cost downside, identifies value protections and records the remaining uncertainty. The bridge should be reproducible by the buyer's finance and operating teams.
2. Map the revenue architecture
The first work product is a revenue-architecture map. It connects the legal customer, contract, product, workspace or account, workload, meter, price book, invoice, accounting entry and cash receipt. Each object needs a stable identifier. Acquisitions, resellers, parent-child accounts and customer reorganisations require explicit mapping so that one economic relationship is neither split into false churn nor combined into false retention.
The billable event should be defined for every product. It may be a compute credit, API call, token, gigabyte transferred, active device, transaction, message, seat-day or successful outcome. The definition should identify rounding, aggregation, free tiers, failed events, retries, cached activity, duplicate events, internal use and test environments. A metric extracted from product telemetry must reconcile to the billing engine.
The contract table should record start and end dates, committed amount, unit price, price tiers, minimums, overages, rollover, expiry, cancellation, renewal, service credits, most-favoured terms, currency, tax, reseller economics and change-of-control provisions. Side letters, sales orders and amendments should be linked to the operative agreement. The diligence team should identify terms implemented in billing logic but absent from signed documents, and signed terms that the billing system does not implement.
IFRS 15 requires an entity to identify the contract and performance obligations, determine the transaction price, allocate it and recognise revenue when or as obligations are satisfied. Variable consideration and constraints may affect the accounting result. [3] The commercial model should reconcile to the accounting policy while preserving a separate operational view of consumption and customer value.
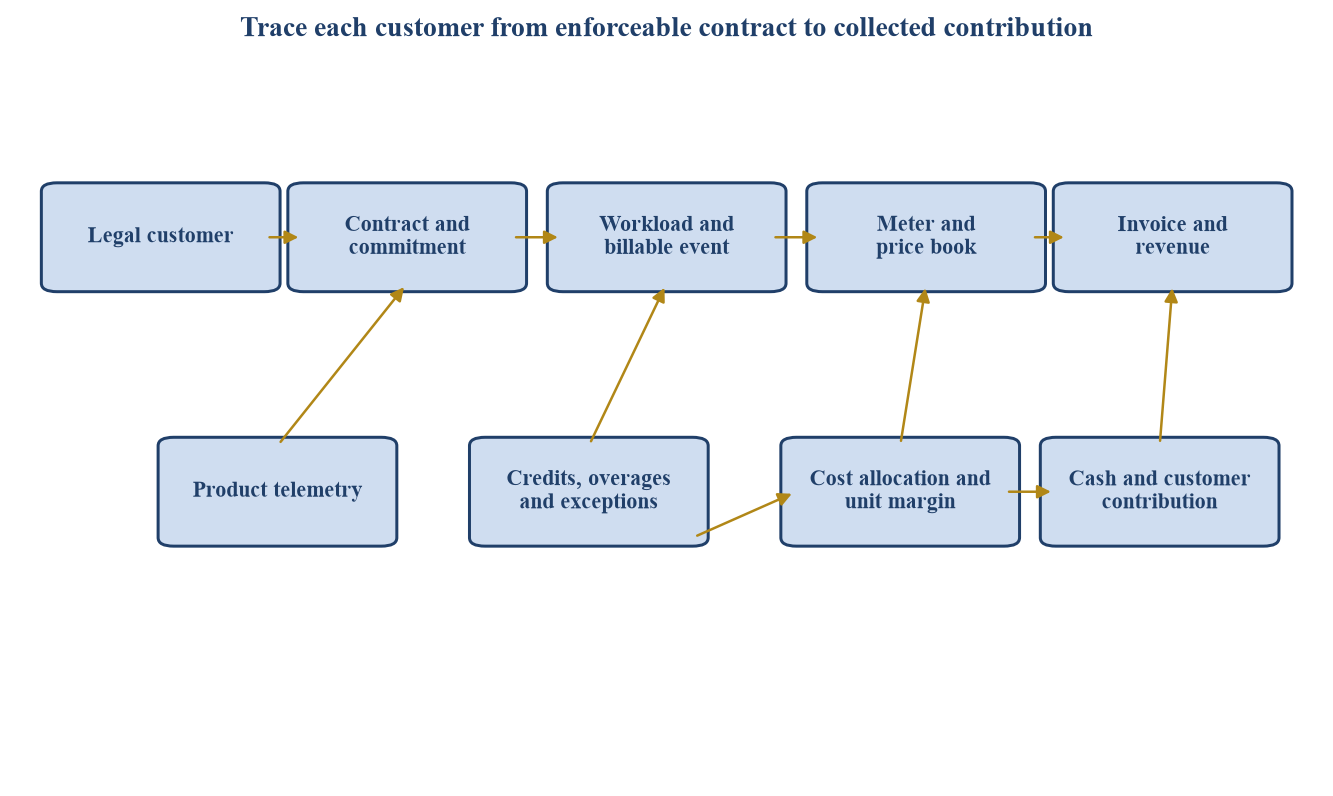
Original framework. Systems, controls and legal relationships require transaction-specific verification.
| Object | Required evidence | Principal test | Typical exception |
|---|---|---|---|
| Customer | Legal entity, account hierarchy, reseller record | One economic customer across systems | Duplicate or fragmented account |
| Contract | Executed agreement, order and amendments | Terms agree to billing configuration | Informal concession or missing amendment |
| Consumption | Immutable event record and meter logic | Events reconcile to rated usage | Retries, tests or failed events billed |
| Price | Approved price book and customer schedule | Rate agrees to contract tier | Manual override or expired discount |
| Revenue | Invoice, subledger, general ledger and policy | Usage and commitment treatment reconciles | Unused credit or variable consideration error |
| Cash | Receipt and ageing record | Invoices convert into cash | Dispute, credit note or extended collection |
| Cost | Provider bill, allocation rule and workload tags | Unit cost follows served usage | Shared or support cost omitted |
Original framework. Evidence requirements should be adapted to the product and transaction.
3. Reconstruct the contract population
A reliable analysis begins with completeness. The target should provide a contract universe from legal records and a revenue universe from the general ledger. The team should reconcile both to customer master data, invoices and product accounts. Contracts with no current revenue may represent dormant capacity, delayed deployment or an implementation problem. Revenue with no located contract is a legal and control exception.
The population should be stratified by economic structure. Separate fixed subscriptions, prepaid capacity, minimum commits with true-up, pay-as-you-go, overage, outcome-linked fees, support, implementation and reseller arrangements. Each category has different revenue visibility and risk. A prepaid invoice can improve cash while leaving consumption and renewal uncertain. A pay-as-you-go customer can show weak contractual backlog but strong habitual use.
Commitment quality depends on enforceability and practical collection. A contract may include a nominal minimum while allowing termination, service credits, rollover or renegotiation. The diligence team should inspect actual treatment when customers underconsume. It should compare contracted remedies with credits issued, renewals amended and disputes settled. Commercial practice can be economically more important than the printed clause.
Remaining performance obligations can support a view of contracted demand, but recognition timing may still depend on future consumption. Snowflake reported USD 9.77 billion of remaining performance obligations at 31 January 2026 and explained that revenue timing depends on consumption. [1] A buyer should therefore build a contract-by-contract run-off rather than treat the total as an equivalent to revenue backlog.
Contract sampling should combine value, risk and randomness. Review the largest relationships, the fastest-growing and contracting cohorts, recent renewals, heavy credit users, reseller contracts, negative-margin workloads and a random sample of the remainder. The sample results should be projected only where the population and error pattern support that treatment.
4. Separate logos, accounts, workloads and revenue
Logo retention answers whether an economic customer remains. Account retention may measure workspaces, subsidiaries or billing entities. Workload retention asks whether the customer continues running the use case that creates consumption. Revenue retention measures price and volume after contract and credit effects. These measures should be shown together.
A retained logo can conceal workload loss. A customer may keep a small account while moving its principal workload to another provider. Conversely, a customer may consolidate many accounts into one and appear to churn at the account level despite stable economic use. The diligence data model should identify the unit of decision for the customer and the unit of billing for the target.
Gross revenue retention should measure the opening cohort after churn and contraction, before expansion. Net revenue retention then includes expansion within the same cohort. New-customer revenue is excluded. The calculation should state the currency treatment, acquisition adjustments, account hierarchy, period, product perimeter and treatment of credits. Fastly and Snowflake caution that similarly titled metrics may be calculated differently. [1][2]
Consumption depth provides a separate view. For each retained customer, measure active workloads, frequency, volume per workload, products used, regions, integrations, users and share of relevant activity. Expansion driven by a second mission-critical workload may be more durable than a short-lived spike in the original workload. Product telemetry and customer interviews should test the commercial interpretation.
A cohort matrix should show opening customers by start date or maturity, then follow their consumption and gross profit through time. Early cohorts may expand as implementation completes. Mature cohorts may optimise usage. Customers acquired through a promotion may display a different curve. Aggregate growth can conceal weakening recent cohorts while older enterprise customers carry performance.
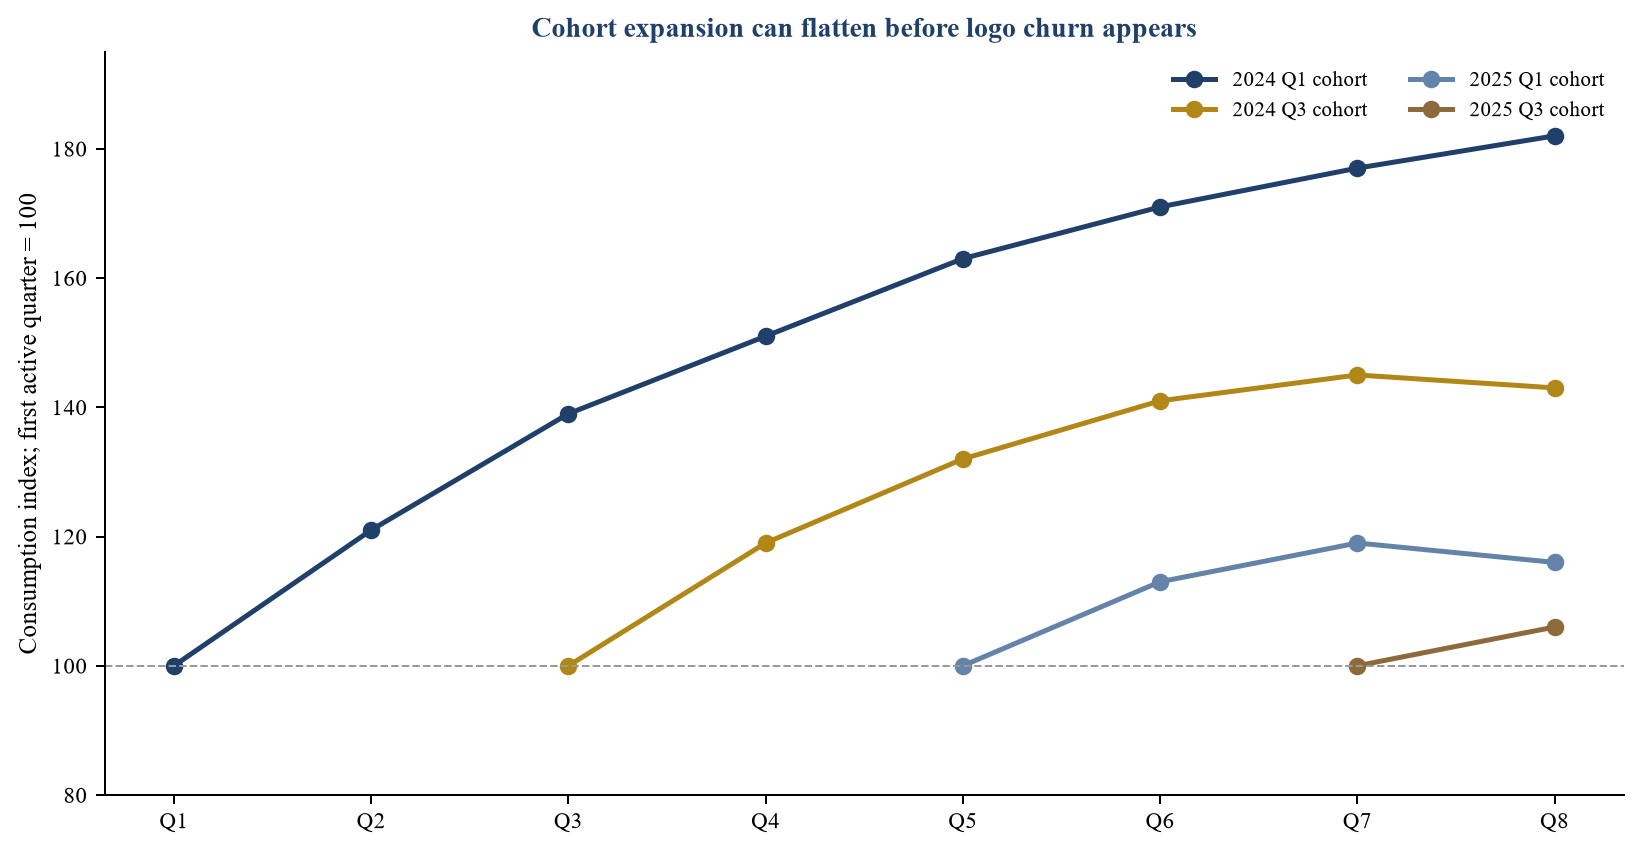
Original illustrative model. Indexed consumption is wholly hypothetical and describes no organisation.
5. Build the retention ledger
The retention ledger should start with the opening annualised revenue or trailing consumption of each customer. It then records logo churn, product churn, workload loss, unit-volume contraction, price change, tier movement, credits, expansion, new workload and acquisition effects. Each movement should have a reason code supported by evidence.
Annualised revenue for a usage business requires judgment. A recent month multiplied by twelve can overstate seasonal peaks and understate ramping customers. A committed amount can overstate actual demand when unused capacity rolls over. Trailing twelve-month revenue can lag current contraction. The team should therefore show multiple views and state which one informs valuation.
Retention should also be calculated on gross profit. Revenue expansion can reduce value when it occurs in compute-intensive products, discounted tiers or costly regions. Gross-profit retention measures the opening cohort's contribution after directly attributable delivery cost. An adjusted contribution-retention measure can include support, third-party licences and customer-specific infrastructure where these costs are economically variable.
The ledger should reconcile to reported revenue by period. Unexplained residuals indicate account mapping, foreign exchange, billing, timing or classification differences. A retained-revenue metric used in the investment case should be reproducible from source data and tied to the financial statements.
Management explanations should be tested against customer and telemetry evidence. A decline described as optimisation may reflect technical efficiency, budget pressure, competitive migration or dissatisfaction. Those causes have different implications. Efficiency that reduces billed units can still strengthen customer value and long-term retention, but it may lower near-term revenue unless new workloads offset it.
6. Analyse commitments, utilisation and expiry
Committed capacity creates contractual coverage, cash-flow timing and expiry risk. For every commitment, calculate purchased units, consumed units, remaining balance, expiry date, rollover right, renewal date and historical burn rate. The forecast should show whether the customer is likely to exhaust, renew, roll over or forfeit capacity.
High utilisation is not automatically favourable. A customer nearing exhaustion may expand, negotiate a lower unit rate, optimise its architecture or move workloads. Low utilisation may create near-term revenue protection under an enforceable minimum, but it can weaken renewal and customer sentiment. The diligence conclusion should combine coverage and customer value.
Breakage and expiry need separate treatment. Unused committed capacity can create accounting revenue or cash without a continuing workload. The team should identify how much historical performance arose from expiry, minimum true-ups and unused balances. It should test whether sales compensation rewards commitment value without regard to consumption quality.
Rollover clauses can defer the problem. A customer may renew by buying additional capacity to preserve unused balances, producing apparent bookings growth while extending the delivery obligation. The contract model should identify stacked balances and the period required to consume them under current workloads.
The renewal forecast should use customer-specific evidence: remaining balance, workload roadmap, product adoption, service incidents, competitive alternatives, procurement timetable and executive sponsorship. A blanket renewal rate applied to nominal contract value can materially overstate visibility.
7. Reconcile bookings, RPO, annualised measures, revenue and cash
Each commercial metric answers a different question. Bookings measure signed commercial activity under the target's definition. Remaining performance obligations measure unsatisfied or partly unsatisfied obligations within the applicable accounting framework. Annualised recurring or consumption measures extrapolate a selected run rate. Revenue follows accounting recognition. Billings reflect invoices. Cash reflects collection.
The diligence team should create a monthly bridge among these measures for at least twenty-four months. Contract additions and renewals should flow into commitments. Consumption should reduce capacity and create revenue according to the policy. Invoices should create receivables or reduce deferred balances. Receipts should settle receivables. Credits, refunds, concessions and foreign exchange should be visible.
Metric definitions can differ across companies. Bentley describes annualised value for recurring consumption subscriptions using recent revenue. [4] Snowflake presents net revenue retention, remaining performance obligations and customers above defined trailing-revenue thresholds, with calculation explanations. [1] The buyer should retain each target definition for historical comparability and construct a transaction definition for the investment case.
The transaction definition should avoid false precision. It can present a range based on trailing, committed and current consumption. The range should be reconciled to contract data and subjected to renewal and unit-cost downside. Any adjusted metric used in price negotiations should have a schedule that the purchase agreement can reference.
Cash conversion deserves particular attention. Prepayment can make a consumption business appear highly cash generative during growth, while renewal slowdown reverses the working-capital benefit. The model should separate operating contribution from changes in deferred revenue, receivables and committed balances.
8. Test price realisation and discount leakage
Usage revenue equals billable units multiplied by realised unit price, adjusted for minimums, credits and other terms. The team should decompose growth into unit volume, list-price change, tier mix, negotiated discount, currency and credit. A higher number of units can coincide with lower revenue when customers enter volume tiers or receive optimisation credits.
Price-book diligence should compare current and historical versions, approval controls and customer exceptions. It should identify free units, implementation credits, migration incentives, outage credits, committed-spend discounts, reseller margins and manual invoice adjustments. The realised price should be calculated for each product, customer and period.
Elasticity can be observed around price changes and contract renewals. Customers may reduce workloads, change architecture or select substitutes after a price increase. The analysis should avoid treating all decline as churn. It should measure workload continuity, units, revenue and contribution before and after the commercial event.
Discount quality depends on incremental economics. A lower unit price may be rational when it secures a larger, predictable workload with lower support cost. It may destroy value when it merely transfers existing consumption into a cheaper tier. The approval record should state the expected volume, duration and contribution required to earn the discount.
Post-close pricing synergies should be supported by customer and competitive evidence. A model that applies a uniform uplift can overstate value when contracts cap increases, customers have alternatives or unit efficiency is improving. Price actions should be tested by segment and workload criticality.
9. Reconstruct cost to serve
Reported cost of revenue may not include every cost that varies with consumption. The diligence team should map cloud provider charges, data transfer, storage, model inference, third-party software, payments, support, reliability engineering, customer-specific infrastructure, fraud, refunds and service credits. It should distinguish direct, shared, committed and avoidable cost.
FinOps Foundation guidance describes unit economics as connecting technology cost to business value, using resource and business unit metrics such as cost per token, transaction, tenant or customer. It also emphasises allocation rules, cost structures and data quality. [5] This supports a transaction model that traces cost to product, workload and customer rather than relying only on consolidated gross margin.
Cloud commitments require normalisation. A target may receive discounts for reserved capacity while carrying underutilisation risk. Current cost can be temporarily low because of credits. Future cost can change when credits expire, commitments reset, architecture migrates or data-transfer patterns change. The model should show cash provider cost and economically allocated cost.
Shared cost allocation should use a driver connected to resource use. Compute time, storage, tokens, bandwidth, requests or workload reservations may be suitable. Revenue-based allocation can mask uneconomic customers because high-priced accounts absorb more cost regardless of actual resource use. Unallocated spend should remain visible until a supported rule is approved.
Customer contribution should include costs that scale with complexity as well as units. A large customer may require dedicated support, security reviews, custom features and regional infrastructure. A small self-service customer may have high payment and support friction. Contribution by customer can therefore differ materially from product gross margin.
10. Build the unit gross-margin curve
The gross-margin curve plots realised unit revenue and allocated unit cost across consumption levels. It should show price tiers, provider discounts, fixed platform cost, support and overage. The curve can identify the volume at which a customer becomes attractive, where discounts outrun cost economies and where infrastructure constraints increase marginal cost.
Economies of scale should be demonstrated. Provider rates may fall at commitment thresholds, but architecture, data locality, reliability and support can offset the saving. AI workloads may have volatile inference intensity. Data products may incur growing storage and transfer cost. The diligence team should compare historical unit cost with engineering forecasts and provider contracts.
Technical efficiency creates a commercial interaction. Snowflake identifies processor, compression and compute optimisation as factors that can allow customers to accomplish workloads with fewer resources. [1] If billing follows consumed resources, efficiency can lower revenue. It can also improve customer economics and support new workloads. The investment case should model both effects.
The margin curve should be calculated by product and customer segment. An aggregate curve may blend high-margin mature services with low-margin growth products. Product roadmap and sales mix can therefore change consolidated margin even when each curve remains stable.
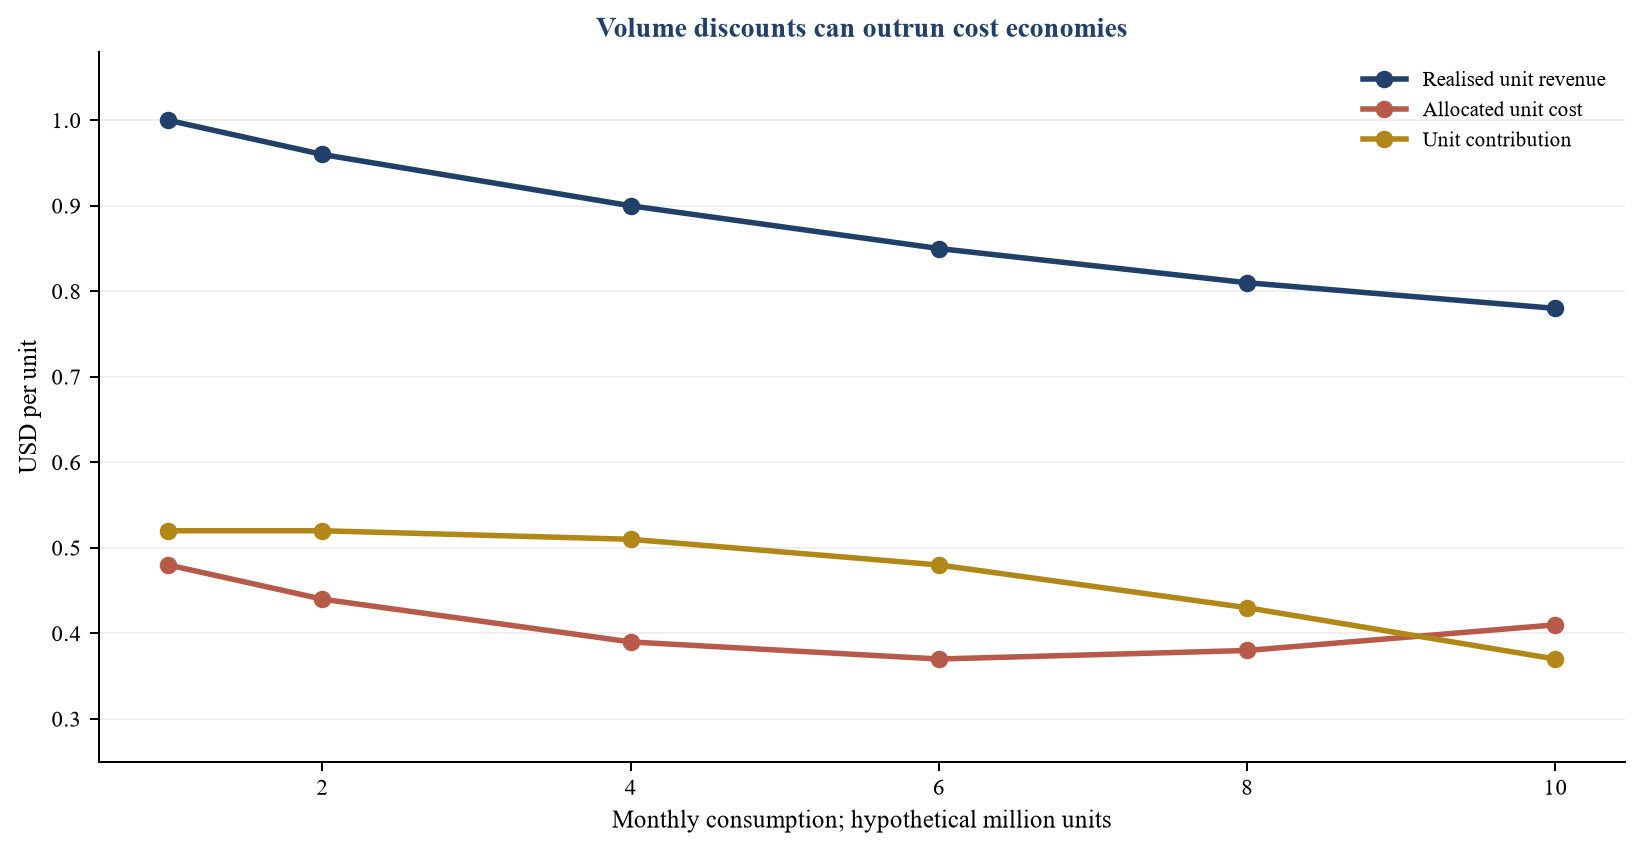
Original illustrative model. Values are wholly hypothetical and unsuitable as benchmarks.
11. Test revenue quality through customer evidence
Data establishes behaviour; customer research explains it. Interviews should cover workload importance, realised value, alternatives, implementation effort, product gaps, pricing, service, security, procurement, optimisation plans and renewal intent. The sample should include advocates, neutral customers, declining customers, recent wins, losses and former customers.
Questions should refer to actual decisions. Ask which workloads run today, what would be required to move them, which alternatives were evaluated, what budget controls apply and what event could reduce consumption. Stated satisfaction alone is a weak predictor. Evidence from deployment, integration and decision rights provides a stronger view of switching friction.
Commercial concentration should be measured by revenue, gross profit, commitment, workload and decision maker. Fastly reported that its ten largest customers represented 32 per cent of 2025 revenue. [2] A target with similar revenue concentration may carry greater or lower risk depending on contract terms, customer contribution, workload criticality and alternatives.
Reference calls arranged by management can be supplemented with independent recruitment where lawful and appropriate. The buyer should protect confidentiality and avoid inducing breach of contract or misuse of information. Findings should be documented as customer evidence with date, role and limitations rather than converted into unsupported market statistics.
The diligence conclusion should distinguish observable facts, customer statements and analyst judgment. Conflicting evidence is valuable. Strong product telemetry with weak executive sponsorship may indicate a useful workload exposed to procurement change. Strong commitment with low usage may indicate contractual coverage and renewal risk.
12. Examine product and workload durability
Usage quality depends on what the customer is doing. Mission-critical production workloads generally differ from experiments, migrations, backups, promotional activity and one-off events. The telemetry model should classify workload purpose, environment, maturity, frequency, latency requirement, data gravity, integration and operational owner.
The team should measure the path from first use to scaled production. Time to first billable event, time to second workload and time to stable consumption can explain cohort performance. Long implementation periods may delay revenue despite strong contracted demand. Rapid initial consumption may be temporary when it reflects migration or testing.
Product substitution risk includes competitors, internal build, open-source software, customer optimisation and adjacent platforms. Switching costs should be examined rather than assumed. The US antitrust agencies' merger guidelines discuss switching costs and network effects as market characteristics relevant to competition analysis. [6] Transaction counsel should determine the legal analysis for the specific market and deal.
Roadmap diligence should connect proposed features to customer evidence and cost. A new feature can increase usage, cannibalise a paid event, shift consumption to a cheaper architecture or require substantial support. The investment case should avoid assigning revenue to roadmap items without adoption and unit-economics evidence.
Security, reliability, privacy and compliance can be commercial determinants. A usage business can lose multiple workloads after a material incident before contracts formally churn. Diligence should review incident history, service credits, post-incident consumption and customer remediation alongside technical findings.
13. Detect optimisation, pull-forward and artificial consumption
Usage can be moved across periods. Customers may accelerate consumption before credits expire, during migrations or after promotional grants. Sales teams may encourage workload pull-forward around reporting dates. Billing errors and repeated events can create apparent volume. The team should test daily and weekly patterns around quarter-end, contract expiry and price changes.
Optimisation should be separated into efficiency and disengagement. Efficiency reduces units required for the same customer outcome. Disengagement reduces the outcome or moves it elsewhere. Telemetry can compare workload outputs, users, data processed and service value. Customer evidence can explain the decision.
Credits should be linked to reason and authority. Promotional credits may support acquisition. Service credits compensate failure. Manual credits can conceal pricing concessions or billing disputes. The analysis should show gross usage, credited usage, billed usage, recognised revenue and collected cash.
Fraud and abuse can inflate events while raising cost. The target should show controls for bots, duplicate requests, unauthorised keys, resellers and internal testing. Events excluded from customer billing can still consume infrastructure. Unit economics should include that resource use.
PCAOB guidance on audit evidence and analytical procedures emphasises the reliability and relevance of evidence and the investigation of significant unexpected differences. [7][8] Transaction diligence is not a financial-statement audit, but these principles support disaggregated testing and follow-up when product, billing and accounting data diverge.
14. Construct the hypothetical revenue-quality bridge
The illustration begins with USD 48.0 million of annualised revenue from the opening customer cohort. Logo churn removes USD 3.8 million. Contraction within retained logos removes USD 2.4 million. Loss of specific workloads removes USD 1.5 million. The retained opening cohort therefore contributes USD 40.3 million before expansion.
Price and tier movement adds USD 1.4 million. Deeper use of existing workloads adds USD 5.2 million. New workloads at existing customers add USD 5.0 million. The opening cohort closes at USD 51.9 million, producing hypothetical net revenue retention of 108.1 per cent. New customers add USD 6.7 million, taking total closing annualised revenue to USD 58.6 million.
The bridge exposes the source of growth. Existing workload depth and new workloads contribute USD 10.2 million. Price contributes USD 1.4 million. New customers contribute USD 6.7 million. Churn, contraction and workload loss remove USD 7.7 million. A buyer can now test each component with different persistence and margin assumptions.
The hypothetical business reports cost of revenue of USD 19.9 million, equal to 34.0 per cent of closing annualised revenue and a 66.0 per cent reported gross margin. Additional customer-variable support, unallocated infrastructure and recurring service credits of USD 6.2 million produce adjusted contribution of USD 32.5 million and adjusted contribution margin of 55.5 per cent. The classification is illustrative and does not prescribe accounting presentation.
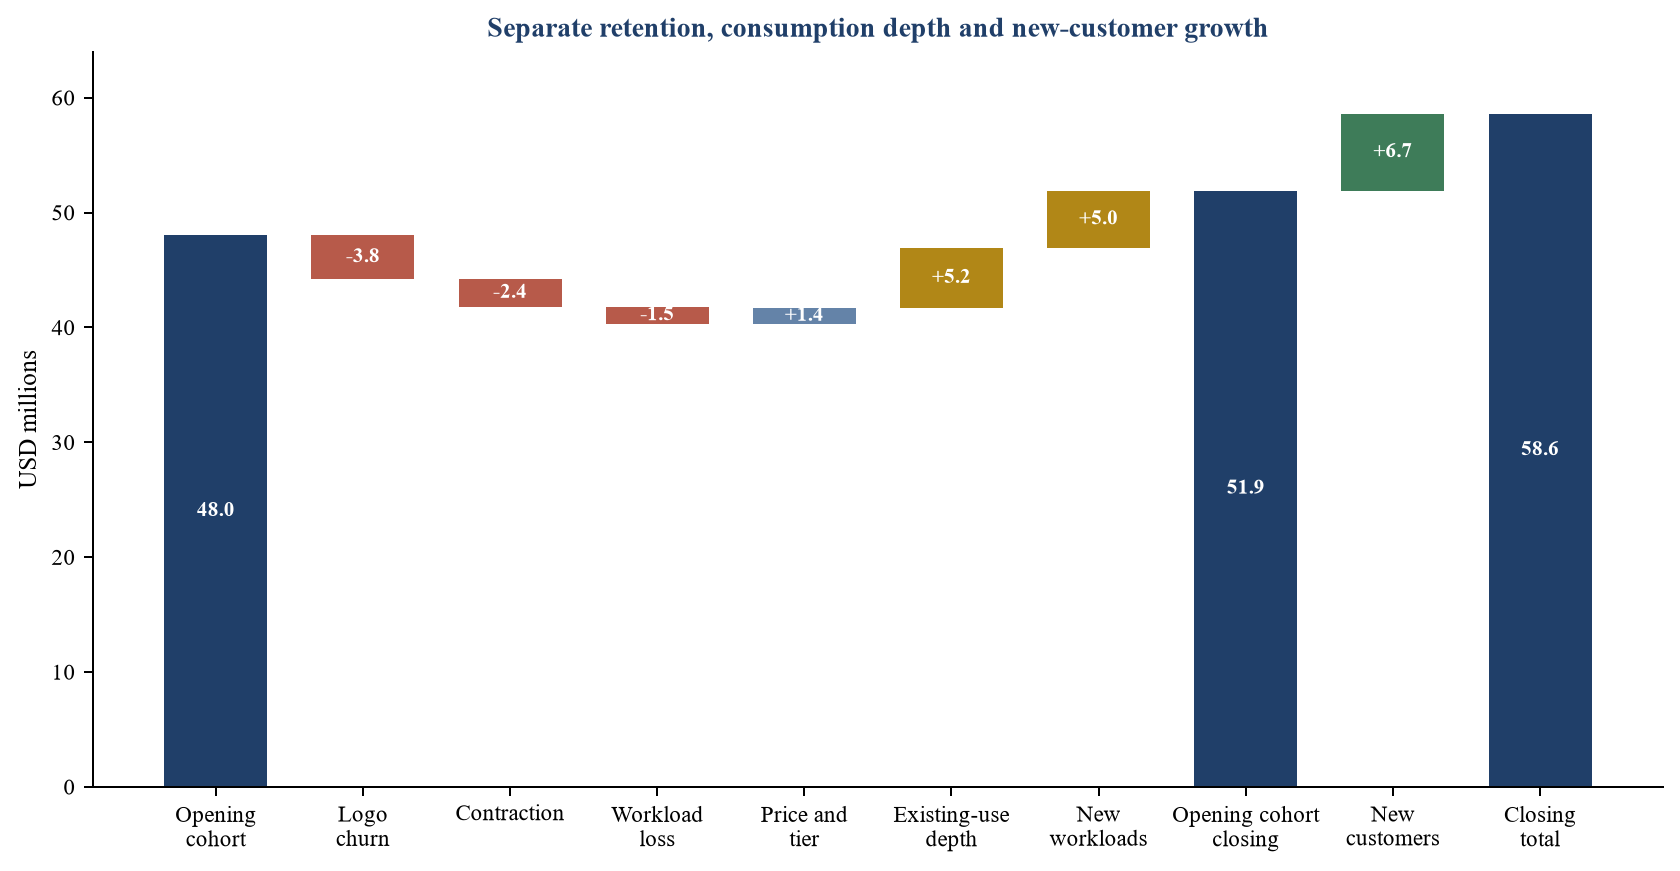
Original illustrative model. All amounts are USD millions and describe no organisation.
| Measure | USD million | Analytical treatment |
|---|---|---|
| Opening annualised customer revenue | 48.0 | Opening cohort before churn and expansion |
| Closing opening-cohort revenue | 51.9 | After churn, contraction, price and usage movements |
| New-customer revenue | 6.7 | Excluded from net revenue retention |
| Closing annualised revenue | 58.6 | Opening cohort plus new customers |
| Reported cost of revenue | 19.9 | Illustrative accounting presentation |
| Reported gross profit | 38.7 | Closing revenue less reported cost of revenue |
| Additional variable operating cost | 6.2 | Support, unallocated infrastructure and service credits |
| Adjusted customer contribution | 32.5 | Transaction view before fixed operating expenses |
Original illustrative model. Amounts and classifications are wholly hypothetical.
15. Calculate retention and margin quality
Hypothetical logo retention is 90.0 per cent. Gross revenue retention is 84.0 per cent after logo churn, contraction and workload loss. Net revenue retention is 108.1 per cent after price, deeper consumption and new workloads within the opening cohort. These percentages should be interpreted together.
A business can have net revenue retention above 100 per cent while losing a material number of customers. Expansion concentrated in a few large accounts can offset broad churn. The team should show the distribution of customer movements, not only the weighted average. Median retention, customer-count buckets and concentration of expansion provide additional evidence.
Reported gross margin of 66.0 per cent differs from adjusted contribution margin of 55.5 per cent in the illustration. The 10.5 percentage-point difference represents costs that vary economically with customer consumption but sit outside the illustrative reported cost of revenue. A buyer should determine the appropriate accounting and transaction classifications using verified records.
Gross-profit net retention can be calculated by applying customer-level allocated cost to the opening cohort. If high-growth customers use lower-priced, compute-intensive products, gross-profit retention may trail revenue retention. Conversely, technical efficiency and provider discounts may allow contribution to expand faster than revenue.
The investment case should use contribution after foreseeable post-close changes. New owner infrastructure contracts, security requirements, support standards and product investments can alter cost. Any synergy should identify the action, timing, cost and accountable owner.
16. Apply downside cases and break points
The downside model should vary consumption volume, renewal conversion, realised price, unit cost and credit rate. These drivers interact. A volume decline can reduce provider discounts and raise unit cost. A price increase can accelerate optimisation or churn. A weak renewal can reverse prepaid cash benefits.
The hypothetical central case uses closing annualised revenue of USD 58.6 million and adjusted contribution margin of 55.5 per cent. A moderate downside assumes 8 per cent lower consumption revenue, 2 per cent lower realised price and 7 per cent higher allocated unit cost, producing a hypothetical adjusted contribution margin of approximately 47.8 per cent. A severe case assumes 18 per cent lower consumption revenue, 5 per cent lower realised price and 15 per cent higher allocated unit cost, producing approximately 36.3 per cent.
These outcomes are calculation examples. A live model should use customer-level renewal dates, capacity balances and cost contracts. It should also consider management actions, including repricing, workload migration, provider renegotiation and support redesign, with implementation cost and customer impact.
Break-point analysis should identify the consumption level at which contribution no longer covers customer-variable cost, the renewal level required to service acquisition debt and the cost inflation that removes the valuation case. These thresholds can become closing conditions, earn-out metrics or post-close operating triggers.
| Driver | Central | Moderate downside | Severe downside |
|---|---|---|---|
| Consumption revenue change | 0.0% | -8.0% | -18.0% |
| Realised price change | 0.0% | -2.0% | -5.0% |
| Allocated unit-cost change | 0.0% | +7.0% | +15.0% |
| Illustrative adjusted contribution margin | 55.5% | 47.8% | 36.3% |
| Principal interpretation | Current economics | Value case requires mitigation | Structure and price require revision |
Original illustrative calculations. Percentages describe no organisation and are unsuitable as forecasts.
17. Translate findings into valuation and deal structure
The transaction model should begin with reconstructed customer contribution rather than a reported annualised metric alone. It should forecast customer cohorts, workload additions, price, capacity expiry, credits and unit cost. Fixed product and operating investment should then be added to reach cash flow.
Valuation scenarios should reflect evidence quality. Contracted minimums with high utilisation, strong workload value and attractive unit contribution may support greater confidence. Unused commitments, concentrated expansion, weak telemetry lineage or rising cost justify a wider range and stronger downside weighting.
Deal structure can allocate identified uncertainty. Deferred consideration can depend on collected revenue or gross profit from a defined customer cohort. An earn-out can use reconstructed metrics, but it needs stable definitions, operating covenants, data access and dispute provisions. A holdback can address billing or credit exposure. Working-capital and debt-like-item definitions should address prepaid balances, provider commitments and customer credits.
Revenue-based earn-outs can reward uneconomic usage. Gross-profit or contribution measures may align better with value, though allocation judgments can create disputes. A balanced design can combine customer retention, collected revenue, unit contribution and guardrails. Qualified legal, accounting and tax advisers should draft and review the mechanism.
Price adjustments should avoid double counting. A lower forecast, higher discount rate and earn-out may all respond to the same risk. The decision bridge should show which uncertainty is reflected in each element and why.
18. Connect commercial, financial and technical diligence
Commercial diligence defines customer demand, competitive position and behaviour. Financial diligence reconciles revenue recognition, billing, cash, credits and cost presentation. Technical diligence validates meter logic, telemetry completeness, architecture, capacity, security and unit-cost drivers. The three workstreams should use one customer and workload data model.
Differences among systems should become a controlled exception register. A contract may show one customer entity, telemetry another account hierarchy and the ledger a reseller. Resolution should record the selected economic relationship and evidence. The final model should retain an audit trail to source records.
Data testing should include completeness, accuracy, cut-off, duplication, access, change history and lineage. Samples should extend from contract to event and from event back to contract. Reperformance should calculate invoices and retention measures independently. The team should identify manual steps and privileged overrides.
Technical findings should be translated into economics. A required re-architecture can change provider cost and product availability. Metering weakness can undermine revenue and earn-out definitions. Security debt can require investment and affect customer retention. A single integrated issue register makes these connections visible to the investment committee.
The team should maintain professional boundaries. Commercial analysis does not replace an audit, legal opinion, penetration test, competition assessment, tax advice or accounting conclusion. Each specialist should state scope, evidence, limitations and reliance.
19. Design the post-close value plan
The first post-close objective is measurement continuity. Customer, contract, meter, billing and cost identifiers should remain stable through integration. Changes to pricing, packaging, infrastructure or account hierarchy should be versioned so that performance can be compared.
The first thirty days should confirm major renewals, capacity balances, customer incidents, provider commitments, product telemetry and billing controls. Management should appoint owners for revenue architecture, retention, pricing and unit cost. High-risk exceptions should have dated remediation.
By day ninety, the business should operate a monthly customer-contribution ledger. It should show opening revenue, retention movements, new workload, realised price, credits, allocated cost, cash and forward commitment. Product and finance teams should reconcile the ledger. Sales compensation should reflect collected contribution and durable workload adoption.
By day 180, management should have tested pricing and cost actions with customer safeguards. It should have renewed major provider commitments based on supported demand, repaired meter or billing controls, addressed negative-contribution workloads and established cohort targets. The board should compare realised performance with the acquisition case.
Integration should preserve customer trust. Abrupt contract or pricing changes can damage the very retention on which the thesis depends. Customer communication, service reliability, data rights and product continuity should be included in the value plan and budget.
20. Establish continuing governance
A monthly revenue-quality committee should include finance, product, engineering, sales, customer success and risk. It should approve metric definitions, review cohort and unit-cost movements, resolve data exceptions and authorise material commercial changes. The committee should distinguish verified actuals from forecasts and management estimates.
The board dashboard should contain a limited set of reconciled measures: logo retention, gross and net revenue retention, workload retention, commitment utilisation, realised unit price, gross-profit retention, adjusted customer contribution, cash conversion and concentration. Every measure should link to a definition and owner.
Metric changes should be governed. A revised account hierarchy, annualisation method or cost allocation can create apparent improvement. Historical periods should be restated where feasible, and the effect of the change should be disclosed internally. Measures used in external reporting must follow applicable standards and controls.
The SEC's Regulation S-K guidance states that non-GAAP measures can require prescribed disclosure and reconciliation in applicable public-company contexts. [9] Transaction metrics may remain internal, but boards should still demand a clear relationship between adjusted measures and financial records.
The governance process should investigate adverse signals early: falling consumption among recent cohorts, growing rollover balances, concentration of expansion, lower realised price, rising unallocated cost, repeated credits and delayed cash. Each signal should produce an owner, evidence request, action and review date.
21. Use a transaction-ready evidence room
The evidence room should be structured around the decision model. A contract register links to executed documents and amendments. A customer bridge links opening and closing populations. A consumption folder holds immutable extracts, meter logic and reconciliation. A pricing folder holds price books, approvals and credits. A cost folder contains provider invoices, allocation rules and unit economics. A financial folder reconciles revenue, billing and cash.
Files should have defined periods, owners and extraction dates. Data dictionaries should accompany raw and transformed data. Transformation scripts should be version controlled. Manual adjustments should be listed separately with evidence and approval. Access to personal, confidential and security-sensitive information should be restricted.
The buyer should request a refresh mechanism for the signing-to-close period. Usage businesses can move quickly. Major consumption changes, renewals, incidents, price concessions and provider commitments should be reported under agreed thresholds. The acquisition model should be updated before final approval.
The final diligence report should answer five questions. How much customer value is retained? What portion of growth comes from durable consumption? What is the contribution from incremental usage? What can change after completion? Which transaction terms and operating actions address the uncertainty?
This evidence architecture supports a disciplined acquisition decision. It cannot create certainty where customers retain discretion and technology changes rapidly. It can make the uncertainty measurable, traceable and actionable, allowing the board to connect commercial quality with price, structure and post-close execution.
| Gate | Required output | Decision |
|---|---|---|
| Day 30 | Verified customer map, renewals, capacity balances, telemetry and provider exposure | Stabilise measurement and urgent accounts |
| Day 90 | Monthly contribution ledger, reconciled retention, unit-cost allocation and exception owners | Approve pricing, cost and control actions |
| Day 180 | Cohort targets, provider plan, repaired controls and tested customer actions | Confirm, revise or stop value initiatives |
| Continuing | Board dashboard, metric governance and signing-to-close refresh | Allocate capital using verified revenue quality |
Original framework. Timing and responsibility require adaptation to the transaction.
Sources
- Snowflake Inc. Annual Report on Form 10-K for the fiscal year ended 31 January 2026. Filed 20 March 2026. Accessed 14 September 2026. Read the primary source
- Fastly, Inc. Annual Report on Form 10-K for the year ended 31 December 2025. Filed 26 February 2026. Accessed 14 September 2026. Read the primary source
- IFRS Foundation. IFRS 15 Revenue from Contracts with Customers. Issued standards and supporting materials. Accessed 14 September 2026. Read the primary source
- Bentley Systems, Incorporated. Annual Report on Form 10-K for the year ended 31 December 2025. Filed 24 February 2026. Accessed 14 September 2026. Read the primary source
- FinOps Foundation. Unit Economics Capability. Accessed 14 September 2026. Read the primary source
- US Department of Justice and Federal Trade Commission. Merger Guidelines. 18 December 2023. Accessed 14 September 2026. Read the primary source
- Public Company Accounting Oversight Board. AS 1105: Audit Evidence. Accessed 14 September 2026. Read the primary source
- Public Company Accounting Oversight Board. AU Section 329: Substantive Analytical Procedures. Accessed 14 September 2026. Read the primary source
- US Securities and Exchange Commission. Regulation S-K Compliance and Disclosure Interpretations. Accessed 14 September 2026. Read the primary source
- Cloudflare, Inc. Annual Report on Form 10-K for the year ended 31 December 2025. Filed 12 February 2026. Accessed 14 September 2026. Read the primary source
- Confluent, Inc. Annual Report on Form 10-K for the year ended 31 December 2024. Filed 21 February 2025. Accessed 14 September 2026. Read the primary source
- Financial Accounting Standards Board. Revenue Recognition Implementation Questions and Answers. January 2020. Accessed 14 September 2026. Read the primary source
