

1. Define culture in operating terms
The integration team should describe recurring behaviours and management conditions that affect strategy, execution, risk and stakeholders. The required output is an operating culture definition. Use current evidence and link each material conclusion to retained operating, workforce, risk, customer, governance and transaction sources [1][2].
Translate the conclusion into the combined operating model and board report. Identify the population, process, owner, source system, definition, frequency, baseline, threshold, privacy control, intervention, expected outcome and decision deadline. Reconcile leadership, operations, risk, human resources, finance, technology and customer teams.
The principal risk is that the programme can debate labels while performance deteriorates. Quantify decision latency, rework, exception frequency, capability loss, customer disruption, delivery variance and value at risk across baseline, integration, combined-control and intervention cases.
Retain the source, version, reviewer, limitations, contrary evidence, specialist advice and management response. Refresh the analysis after material organisation, system, incentive, customer or control changes; compare observed outcomes with the approved case; and assign each exception an accountable owner and deadline.
2. Set the board's value objective
The integration team should state which customer, risk, innovation, speed and capability outcomes the culture work must protect. The required output is a culture-value mandate. Use current evidence and link each material conclusion to retained operating, workforce, risk, customer, governance and transaction sources [2][3].
Translate the conclusion into the combined operating model and board report. Identify the population, process, owner, source system, definition, frequency, baseline, threshold, privacy control, intervention, expected outcome and decision deadline. Reconcile leadership, operations, risk, human resources, finance, technology and customer teams.
The principal risk is that culture activity can become detached from the acquisition thesis. Quantify decision latency, rework, exception frequency, capability loss, customer disruption, delivery variance and value at risk across baseline, integration, combined-control and intervention cases.
Retain the source, version, reviewer, limitations, contrary evidence, specialist advice and management response. Refresh the analysis after material organisation, system, incentive, customer or control changes; compare observed outcomes with the approved case; and assign each exception an accountable owner and deadline.
3. Establish the pre-close boundary
The integration team should separate lawful planning, clean-team analysis and post-close implementation with employment and privacy controls. The required output is a culture diligence protocol. Use current evidence and link each material conclusion to retained operating, workforce, risk, customer, governance and transaction sources [4][5].
Translate the conclusion into the combined operating model and board report. Identify the population, process, owner, source system, definition, frequency, baseline, threshold, privacy control, intervention, expected outcome and decision deadline. Reconcile leadership, operations, risk, human resources, finance, technology and customer teams.
The principal risk is that sensitive data or premature direction can create legal and trust failures. Quantify decision latency, rework, exception frequency, capability loss, customer disruption, delivery variance and value at risk across baseline, integration, combined-control and intervention cases.
Retain the source, version, reviewer, limitations, contrary evidence, specialist advice and management response. Refresh the analysis after material organisation, system, incentive, customer or control changes; compare observed outcomes with the approved case; and assign each exception an accountable owner and deadline.
4. Map the combined operating model
The integration team should identify decision forums, accountabilities, workflows, controls, customer journeys and critical interfaces. The required output is an operating-model dependency map. Use current evidence and link each material conclusion to retained operating, workforce, risk, customer, governance and transaction sources [2][6].
Translate the conclusion into the combined operating model and board report. Identify the population, process, owner, source system, definition, frequency, baseline, threshold, privacy control, intervention, expected outcome and decision deadline. Reconcile leadership, operations, risk, human resources, finance, technology and customer teams.
The principal risk is that culture can be treated as a people issue when structure drives behaviour. Quantify decision latency, rework, exception frequency, capability loss, customer disruption, delivery variance and value at risk across baseline, integration, combined-control and intervention cases.
Retain the source, version, reviewer, limitations, contrary evidence, specialist advice and management response. Refresh the analysis after material organisation, system, incentive, customer or control changes; compare observed outcomes with the approved case; and assign each exception an accountable owner and deadline.
5. Build the culture-to-value chain
The integration team should connect drivers, observed behaviour, operating output, stakeholder outcome and transaction value. The required output is a testable culture-value logic. Use current evidence and link each material conclusion to retained operating, workforce, risk, customer, governance and transaction sources [1][7].
Translate the conclusion into the combined operating model and board report. Identify the population, process, owner, source system, definition, frequency, baseline, threshold, privacy control, intervention, expected outcome and decision deadline. Reconcile leadership, operations, risk, human resources, finance, technology and customer teams.
The principal risk is that survey movement can be mistaken for realised value. Quantify decision latency, rework, exception frequency, capability loss, customer disruption, delivery variance and value at risk across baseline, integration, combined-control and intervention cases.
Retain the source, version, reviewer, limitations, contrary evidence, specialist advice and management response. Refresh the analysis after material organisation, system, incentive, customer or control changes; compare observed outcomes with the approved case; and assign each exception an accountable owner and deadline.
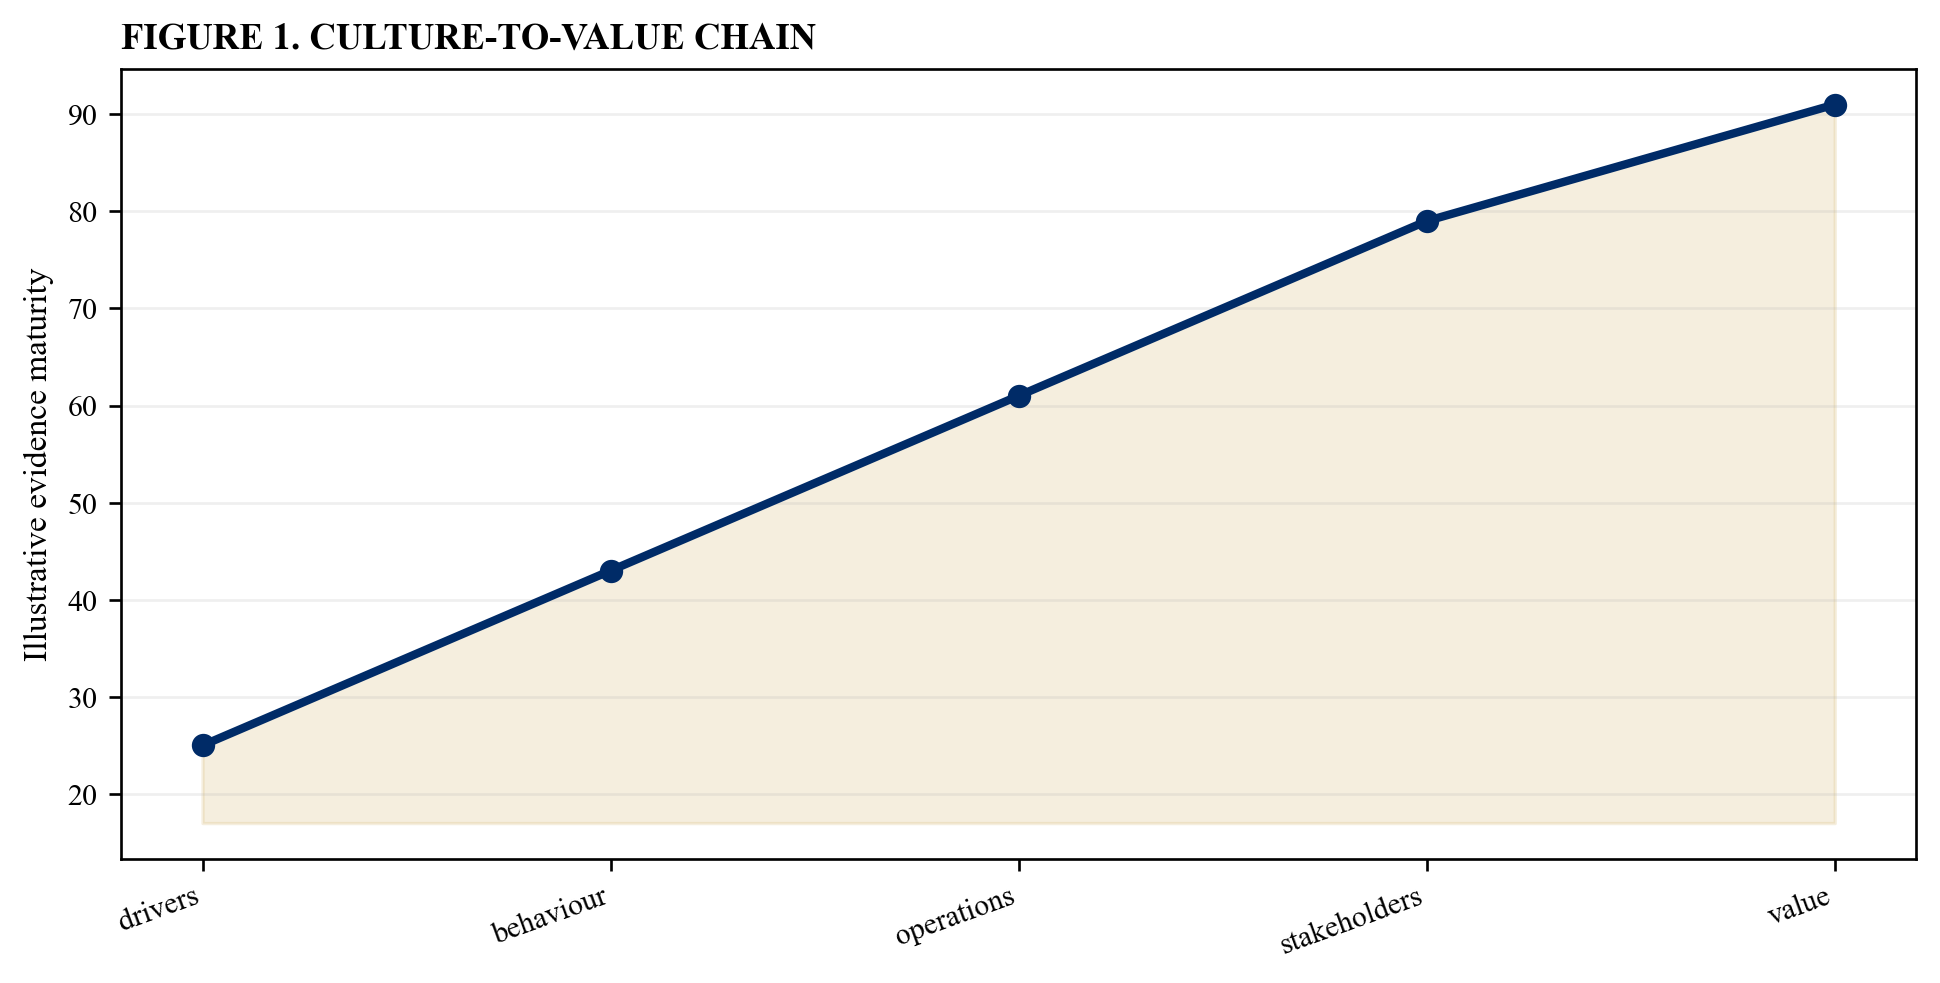
Illustrative analytical scenario; verified workforce, operating, risk and customer evidence should replace index values.
6. Define the baseline period
The integration team should select comparable pre-announcement, signing, close and integration windows with seasonality and disruption controls. The required output is a measurement calendar. Use current evidence and link each material conclusion to retained operating, workforce, risk, customer, governance and transaction sources [8][9].
Translate the conclusion into the combined operating model and board report. Identify the population, process, owner, source system, definition, frequency, baseline, threshold, privacy control, intervention, expected outcome and decision deadline. Reconcile leadership, operations, risk, human resources, finance, technology and customer teams.
The principal risk is that an unstable reference period can manufacture improvement or decline. Quantify decision latency, rework, exception frequency, capability loss, customer disruption, delivery variance and value at risk across baseline, integration, combined-control and intervention cases.
Retain the source, version, reviewer, limitations, contrary evidence, specialist advice and management response. Refresh the analysis after material organisation, system, incentive, customer or control changes; compare observed outcomes with the approved case; and assign each exception an accountable owner and deadline.
7. Segment subcultures
The integration team should analyse function, geography, customer segment, hierarchy, tenure and legacy company without exposing individuals. The required output is a subculture map. Use current evidence and link each material conclusion to retained operating, workforce, risk, customer, governance and transaction sources [1][10].
Translate the conclusion into the combined operating model and board report. Identify the population, process, owner, source system, definition, frequency, baseline, threshold, privacy control, intervention, expected outcome and decision deadline. Reconcile leadership, operations, risk, human resources, finance, technology and customer teams.
The principal risk is that enterprise averages can conceal concentrated risk or valuable practices. Quantify decision latency, rework, exception frequency, capability loss, customer disruption, delivery variance and value at risk across baseline, integration, combined-control and intervention cases.
Retain the source, version, reviewer, limitations, contrary evidence, specialist advice and management response. Refresh the analysis after material organisation, system, incentive, customer or control changes; compare observed outcomes with the approved case; and assign each exception an accountable owner and deadline.
8. Measure decision latency
The integration team should timestamp issue identification, escalation, forum entry, decision, communication and implementation. The required output is a decision-speed baseline. Use current evidence and link each material conclusion to retained operating, workforce, risk, customer, governance and transaction sources [2][11].
Translate the conclusion into the combined operating model and board report. Identify the population, process, owner, source system, definition, frequency, baseline, threshold, privacy control, intervention, expected outcome and decision deadline. Reconcile leadership, operations, risk, human resources, finance, technology and customer teams.
The principal risk is that delay can accumulate invisibly across handoffs and approvals. Quantify decision latency, rework, exception frequency, capability loss, customer disruption, delivery variance and value at risk across baseline, integration, combined-control and intervention cases.
Retain the source, version, reviewer, limitations, contrary evidence, specialist advice and management response. Refresh the analysis after material organisation, system, incentive, customer or control changes; compare observed outcomes with the approved case; and assign each exception an accountable owner and deadline.
Table 1. Decision-flow baseline
| Stage | Metric | Control |
|---|---|---|
| identify | issue age | common threshold |
| escalate | time to forum | named route |
| decide | decision latency | authority clear |
| execute | rework rate | owner accepted |
Illustrative structure; verified company evidence and lawful measurement govern.
9. Measure decision quality
The integration team should track reversals, rework, exception rates, outcome variance and evidence completeness. The required output is a decision-quality scorecard. Use current evidence and link each material conclusion to retained operating, workforce, risk, customer, governance and transaction sources [3][11].
Translate the conclusion into the combined operating model and board report. Identify the population, process, owner, source system, definition, frequency, baseline, threshold, privacy control, intervention, expected outcome and decision deadline. Reconcile leadership, operations, risk, human resources, finance, technology and customer teams.
The principal risk is that faster decisions can simply move error and rework downstream. Quantify decision latency, rework, exception frequency, capability loss, customer disruption, delivery variance and value at risk across baseline, integration, combined-control and intervention cases.
Retain the source, version, reviewer, limitations, contrary evidence, specialist advice and management response. Refresh the analysis after material organisation, system, incentive, customer or control changes; compare observed outcomes with the approved case; and assign each exception an accountable owner and deadline.
10. Map decision rights
The integration team should reconcile reserved matters, delegations, committee mandates, role charters and informal vetoes. The required output is a decision-rights matrix. Use current evidence and link each material conclusion to retained operating, workforce, risk, customer, governance and transaction sources [2][12].
Translate the conclusion into the combined operating model and board report. Identify the population, process, owner, source system, definition, frequency, baseline, threshold, privacy control, intervention, expected outcome and decision deadline. Reconcile leadership, operations, risk, human resources, finance, technology and customer teams.
The principal risk is that formal authority can differ from the authority people actually use. Quantify decision latency, rework, exception frequency, capability loss, customer disruption, delivery variance and value at risk across baseline, integration, combined-control and intervention cases.
Retain the source, version, reviewer, limitations, contrary evidence, specialist advice and management response. Refresh the analysis after material organisation, system, incentive, customer or control changes; compare observed outcomes with the approved case; and assign each exception an accountable owner and deadline.
11. Measure escalation behaviour
The integration team should track threshold breaches, time to escalate, recipient level, closure quality and repeat issues. The required output is an escalation-effectiveness file. Use current evidence and link each material conclusion to retained operating, workforce, risk, customer, governance and transaction sources [3][13].
Translate the conclusion into the combined operating model and board report. Identify the population, process, owner, source system, definition, frequency, baseline, threshold, privacy control, intervention, expected outcome and decision deadline. Reconcile leadership, operations, risk, human resources, finance, technology and customer teams.
The principal risk is that bad news can travel slowly while reassuring summaries travel quickly. Quantify decision latency, rework, exception frequency, capability loss, customer disruption, delivery variance and value at risk across baseline, integration, combined-control and intervention cases.
Retain the source, version, reviewer, limitations, contrary evidence, specialist advice and management response. Refresh the analysis after material organisation, system, incentive, customer or control changes; compare observed outcomes with the approved case; and assign each exception an accountable owner and deadline.
12. Measure constructive challenge
The integration team should observe dissent, alternatives considered, evidence requests, override reasons and psychological safety. The required output is a challenge-quality assessment. Use current evidence and link each material conclusion to retained operating, workforce, risk, customer, governance and transaction sources [2][14].
Translate the conclusion into the combined operating model and board report. Identify the population, process, owner, source system, definition, frequency, baseline, threshold, privacy control, intervention, expected outcome and decision deadline. Reconcile leadership, operations, risk, human resources, finance, technology and customer teams.
The principal risk is that apparent consensus can reflect silence rather than alignment. Quantify decision latency, rework, exception frequency, capability loss, customer disruption, delivery variance and value at risk across baseline, integration, combined-control and intervention cases.
Retain the source, version, reviewer, limitations, contrary evidence, specialist advice and management response. Refresh the analysis after material organisation, system, incentive, customer or control changes; compare observed outcomes with the approved case; and assign each exception an accountable owner and deadline.
13. Measure information access
The integration team should test whether decision-makers receive complete, timely and comparable customer, risk and financial evidence. The required output is an information-flow map. Use current evidence and link each material conclusion to retained operating, workforce, risk, customer, governance and transaction sources [2][12].
Translate the conclusion into the combined operating model and board report. Identify the population, process, owner, source system, definition, frequency, baseline, threshold, privacy control, intervention, expected outcome and decision deadline. Reconcile leadership, operations, risk, human resources, finance, technology and customer teams.
The principal risk is that asymmetric access can create hidden power and slow execution. Quantify decision latency, rework, exception frequency, capability loss, customer disruption, delivery variance and value at risk across baseline, integration, combined-control and intervention cases.
Retain the source, version, reviewer, limitations, contrary evidence, specialist advice and management response. Refresh the analysis after material organisation, system, incentive, customer or control changes; compare observed outcomes with the approved case; and assign each exception an accountable owner and deadline.
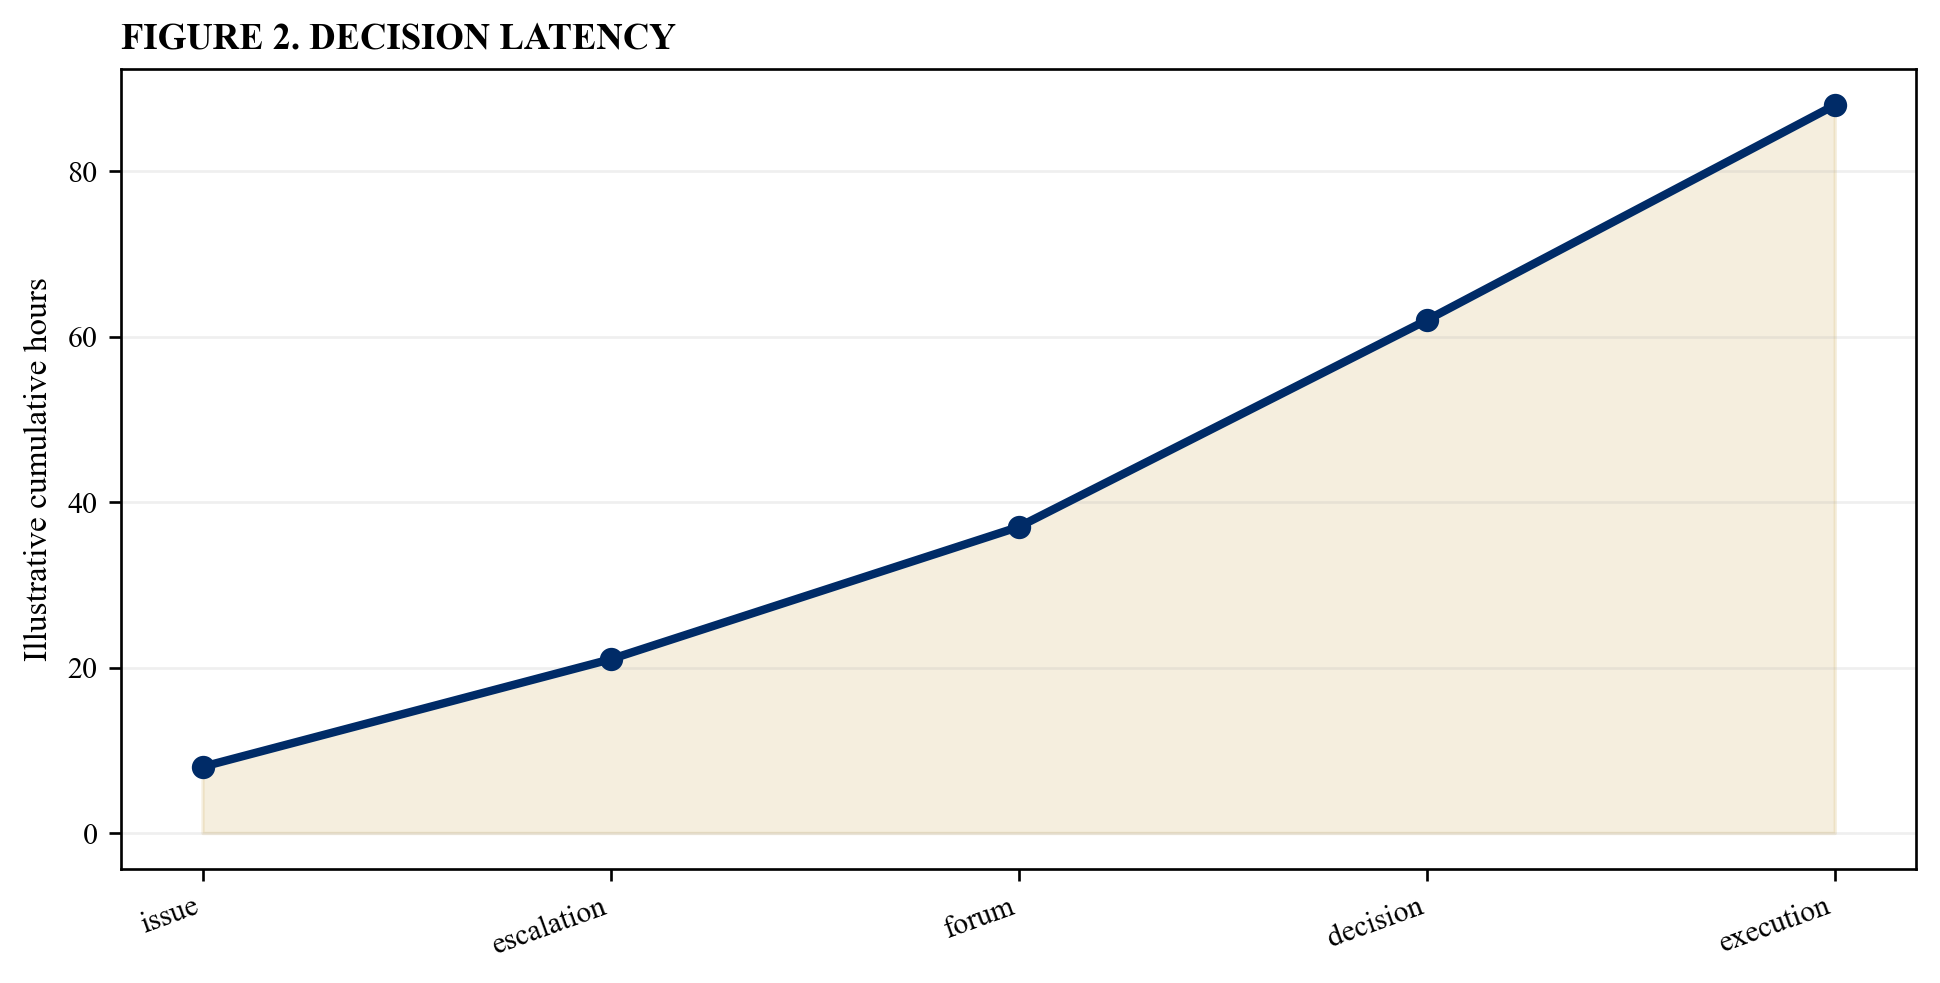
Illustrative analytical scenario; verified workforce, operating, risk and customer evidence should replace index values.
14. Analyse meeting architecture
The integration team should inventory forums, purpose, attendance, pre-reads, decisions, duplication and cancellation. The required output is a management-cadence redesign. Use current evidence and link each material conclusion to retained operating, workforce, risk, customer, governance and transaction sources [11][12].
Translate the conclusion into the combined operating model and board report. Identify the population, process, owner, source system, definition, frequency, baseline, threshold, privacy control, intervention, expected outcome and decision deadline. Reconcile leadership, operations, risk, human resources, finance, technology and customer teams.
The principal risk is that the merged company can add coordination load without increasing control. Quantify decision latency, rework, exception frequency, capability loss, customer disruption, delivery variance and value at risk across baseline, integration, combined-control and intervention cases.
Retain the source, version, reviewer, limitations, contrary evidence, specialist advice and management response. Refresh the analysis after material organisation, system, incentive, customer or control changes; compare observed outcomes with the approved case; and assign each exception an accountable owner and deadline.
15. Measure risk appetite in practice
The integration team should compare stated limits with approvals, overrides, losses, near misses and resource allocation. The required output is a risk-behaviour bridge. Use current evidence and link each material conclusion to retained operating, workforce, risk, customer, governance and transaction sources [3][15].
Translate the conclusion into the combined operating model and board report. Identify the population, process, owner, source system, definition, frequency, baseline, threshold, privacy control, intervention, expected outcome and decision deadline. Reconcile leadership, operations, risk, human resources, finance, technology and customer teams.
The principal risk is that declared appetite can diverge from rewarded behaviour. Quantify decision latency, rework, exception frequency, capability loss, customer disruption, delivery variance and value at risk across baseline, integration, combined-control and intervention cases.
Retain the source, version, reviewer, limitations, contrary evidence, specialist advice and management response. Refresh the analysis after material organisation, system, incentive, customer or control changes; compare observed outcomes with the approved case; and assign each exception an accountable owner and deadline.
16. Measure control exceptions
The integration team should track policy breaches, audit findings, overdue actions, repeat issues and management overrides. The required output is a control-culture dashboard. Use current evidence and link each material conclusion to retained operating, workforce, risk, customer, governance and transaction sources [3][13].
Translate the conclusion into the combined operating model and board report. Identify the population, process, owner, source system, definition, frequency, baseline, threshold, privacy control, intervention, expected outcome and decision deadline. Reconcile leadership, operations, risk, human resources, finance, technology and customer teams.
The principal risk is that exception volume can fall because reporting weakened. Quantify decision latency, rework, exception frequency, capability loss, customer disruption, delivery variance and value at risk across baseline, integration, combined-control and intervention cases.
Retain the source, version, reviewer, limitations, contrary evidence, specialist advice and management response. Refresh the analysis after material organisation, system, incentive, customer or control changes; compare observed outcomes with the approved case; and assign each exception an accountable owner and deadline.
Table 2. Risk-culture indicators
| Indicator | Signal | Interpretation control |
|---|---|---|
| exceptions | control pressure | reporting quality |
| overrides | risk trade-off | authority and reason |
| speak-up | issue visibility | channel and response |
| repeat findings | learning failure | root-cause closure |
Illustrative structure; verified company evidence and lawful measurement govern.
17. Measure speak-up and response
The integration team should combine reports, channels, substantiation, retaliation indicators, response time and remediation quality. The required output is a speak-up effectiveness file. Use current evidence and link each material conclusion to retained operating, workforce, risk, customer, governance and transaction sources [13][16].
Translate the conclusion into the combined operating model and board report. Identify the population, process, owner, source system, definition, frequency, baseline, threshold, privacy control, intervention, expected outcome and decision deadline. Reconcile leadership, operations, risk, human resources, finance, technology and customer teams.
The principal risk is that report counts alone can reward silence or overstate dysfunction. Quantify decision latency, rework, exception frequency, capability loss, customer disruption, delivery variance and value at risk across baseline, integration, combined-control and intervention cases.
Retain the source, version, reviewer, limitations, contrary evidence, specialist advice and management response. Refresh the analysis after material organisation, system, incentive, customer or control changes; compare observed outcomes with the approved case; and assign each exception an accountable owner and deadline.
18. Test incentive alignment
The integration team should map pay, targets, promotion, recognition and consequence management to desired decisions and customer outcomes. The required output is an incentives-behaviour matrix. Use current evidence and link each material conclusion to retained operating, workforce, risk, customer, governance and transaction sources [3][17].
Translate the conclusion into the combined operating model and board report. Identify the population, process, owner, source system, definition, frequency, baseline, threshold, privacy control, intervention, expected outcome and decision deadline. Reconcile leadership, operations, risk, human resources, finance, technology and customer teams.
The principal risk is that stated values can be defeated by the scorecard that controls careers. Quantify decision latency, rework, exception frequency, capability loss, customer disruption, delivery variance and value at risk across baseline, integration, combined-control and intervention cases.
Retain the source, version, reviewer, limitations, contrary evidence, specialist advice and management response. Refresh the analysis after material organisation, system, incentive, customer or control changes; compare observed outcomes with the approved case; and assign each exception an accountable owner and deadline.
19. Measure leadership consistency
The integration team should compare messages, resource choices, time allocation, exceptions and visible role modelling. The required output is a leadership-behaviour record. Use current evidence and link each material conclusion to retained operating, workforce, risk, customer, governance and transaction sources [1][2].
Translate the conclusion into the combined operating model and board report. Identify the population, process, owner, source system, definition, frequency, baseline, threshold, privacy control, intervention, expected outcome and decision deadline. Reconcile leadership, operations, risk, human resources, finance, technology and customer teams.
The principal risk is that employees can follow observed trade-offs rather than published principles. Quantify decision latency, rework, exception frequency, capability loss, customer disruption, delivery variance and value at risk across baseline, integration, combined-control and intervention cases.
Retain the source, version, reviewer, limitations, contrary evidence, specialist advice and management response. Refresh the analysis after material organisation, system, incentive, customer or control changes; compare observed outcomes with the approved case; and assign each exception an accountable owner and deadline.
20. Measure manager capability
The integration team should assess goal setting, feedback, workload, conflict resolution, change translation and local control ownership. The required output is a manager capability baseline. Use current evidence and link each material conclusion to retained operating, workforce, risk, customer, governance and transaction sources [10][18].
Translate the conclusion into the combined operating model and board report. Identify the population, process, owner, source system, definition, frequency, baseline, threshold, privacy control, intervention, expected outcome and decision deadline. Reconcile leadership, operations, risk, human resources, finance, technology and customer teams.
The principal risk is that enterprise design can fail through uneven frontline management. Quantify decision latency, rework, exception frequency, capability loss, customer disruption, delivery variance and value at risk across baseline, integration, combined-control and intervention cases.
Retain the source, version, reviewer, limitations, contrary evidence, specialist advice and management response. Refresh the analysis after material organisation, system, incentive, customer or control changes; compare observed outcomes with the approved case; and assign each exception an accountable owner and deadline.
21. Measure critical-talent movement
The integration team should track regretted attrition, internal mobility, absence, vacancy duration, succession coverage and role concentration. The required output is a capability continuity dashboard. Use current evidence and link each material conclusion to retained operating, workforce, risk, customer, governance and transaction sources [8][19].
Translate the conclusion into the combined operating model and board report. Identify the population, process, owner, source system, definition, frequency, baseline, threshold, privacy control, intervention, expected outcome and decision deadline. Reconcile leadership, operations, risk, human resources, finance, technology and customer teams.
The principal risk is that aggregate turnover can hide the loss of scarce people and relationships. Quantify decision latency, rework, exception frequency, capability loss, customer disruption, delivery variance and value at risk across baseline, integration, combined-control and intervention cases.
Retain the source, version, reviewer, limitations, contrary evidence, specialist advice and management response. Refresh the analysis after material organisation, system, incentive, customer or control changes; compare observed outcomes with the approved case; and assign each exception an accountable owner and deadline.
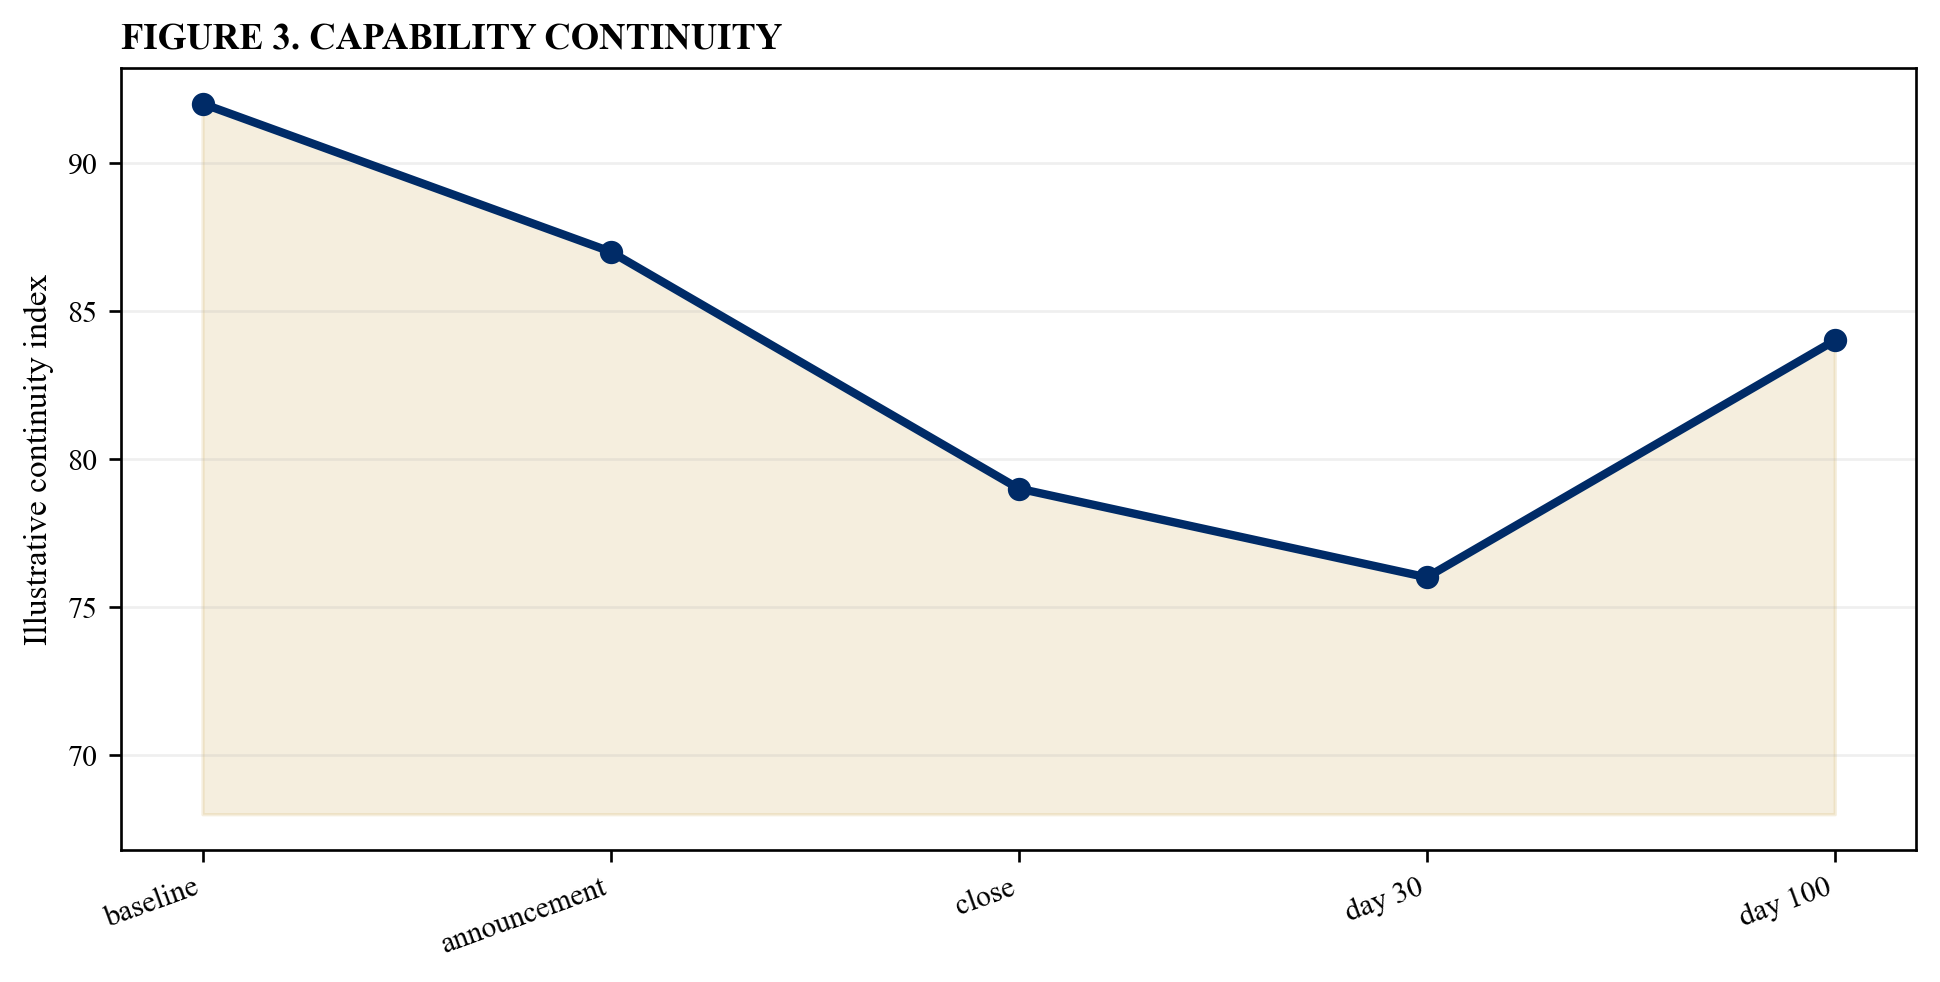
Illustrative analytical scenario; verified workforce, operating, risk and customer evidence should replace index values.
22. Measure workload and wellbeing
The integration team should analyse spans, overtime, absence, safety, burnout signals and change demand with lawful safeguards. The required output is a capacity and wellbeing view. Use current evidence and link each material conclusion to retained operating, workforce, risk, customer, governance and transaction sources [8][20].
Translate the conclusion into the combined operating model and board report. Identify the population, process, owner, source system, definition, frequency, baseline, threshold, privacy control, intervention, expected outcome and decision deadline. Reconcile leadership, operations, risk, human resources, finance, technology and customer teams.
The principal risk is that integration overload can appear as resistance after capacity has already failed. Quantify decision latency, rework, exception frequency, capability loss, customer disruption, delivery variance and value at risk across baseline, integration, combined-control and intervention cases.
Retain the source, version, reviewer, limitations, contrary evidence, specialist advice and management response. Refresh the analysis after material organisation, system, incentive, customer or control changes; compare observed outcomes with the approved case; and assign each exception an accountable owner and deadline.
23. Measure customer outcomes
The integration team should connect complaints, churn, service levels, rework, conduct events and satisfaction to integration changes. The required output is a customer-impact bridge. Use current evidence and link each material conclusion to retained operating, workforce, risk, customer, governance and transaction sources [5][21].
Translate the conclusion into the combined operating model and board report. Identify the population, process, owner, source system, definition, frequency, baseline, threshold, privacy control, intervention, expected outcome and decision deadline. Reconcile leadership, operations, risk, human resources, finance, technology and customer teams.
The principal risk is that internal integration milestones can look green while customers absorb the disruption. Quantify decision latency, rework, exception frequency, capability loss, customer disruption, delivery variance and value at risk across baseline, integration, combined-control and intervention cases.
Retain the source, version, reviewer, limitations, contrary evidence, specialist advice and management response. Refresh the analysis after material organisation, system, incentive, customer or control changes; compare observed outcomes with the approved case; and assign each exception an accountable owner and deadline.
24. Measure frontline discretion
The integration team should identify where policy, scripts, controls and local judgement shape customer outcomes. The required output is a discretion-control map. Use current evidence and link each material conclusion to retained operating, workforce, risk, customer, governance and transaction sources [5][21].
Translate the conclusion into the combined operating model and board report. Identify the population, process, owner, source system, definition, frequency, baseline, threshold, privacy control, intervention, expected outcome and decision deadline. Reconcile leadership, operations, risk, human resources, finance, technology and customer teams.
The principal risk is that standardisation can remove judgement that protects customers or quality. Quantify decision latency, rework, exception frequency, capability loss, customer disruption, delivery variance and value at risk across baseline, integration, combined-control and intervention cases.
Retain the source, version, reviewer, limitations, contrary evidence, specialist advice and management response. Refresh the analysis after material organisation, system, incentive, customer or control changes; compare observed outcomes with the approved case; and assign each exception an accountable owner and deadline.
Table 3. Customer-impact bridge
| Outcome | Operating driver | Evidence |
|---|---|---|
| complaints | process failure | case coding |
| churn | service disruption | cohort analysis |
| delay | handoff friction | journey timestamps |
| recovery | frontline discretion | resolution evidence |
Illustrative structure; verified company evidence and lawful measurement govern.
25. Measure delivery reliability
The integration team should track cycle time, backlog, defects, handoffs, on-time delivery and service recovery. The required output is an execution reliability baseline. Use current evidence and link each material conclusion to retained operating, workforce, risk, customer, governance and transaction sources [11][22].
Translate the conclusion into the combined operating model and board report. Identify the population, process, owner, source system, definition, frequency, baseline, threshold, privacy control, intervention, expected outcome and decision deadline. Reconcile leadership, operations, risk, human resources, finance, technology and customer teams.
The principal risk is that cultural friction can be recorded as generic operational variance. Quantify decision latency, rework, exception frequency, capability loss, customer disruption, delivery variance and value at risk across baseline, integration, combined-control and intervention cases.
Retain the source, version, reviewer, limitations, contrary evidence, specialist advice and management response. Refresh the analysis after material organisation, system, incentive, customer or control changes; compare observed outcomes with the approved case; and assign each exception an accountable owner and deadline.
26. Measure innovation behaviour
The integration team should track idea flow, experiment approval, learning cycles, failure treatment and scaling decisions. The required output is an innovation-throughput file. Use current evidence and link each material conclusion to retained operating, workforce, risk, customer, governance and transaction sources [2][23].
Translate the conclusion into the combined operating model and board report. Identify the population, process, owner, source system, definition, frequency, baseline, threshold, privacy control, intervention, expected outcome and decision deadline. Reconcile leadership, operations, risk, human resources, finance, technology and customer teams.
The principal risk is that integration can suppress challenge and experimentation while appearing orderly. Quantify decision latency, rework, exception frequency, capability loss, customer disruption, delivery variance and value at risk across baseline, integration, combined-control and intervention cases.
Retain the source, version, reviewer, limitations, contrary evidence, specialist advice and management response. Refresh the analysis after material organisation, system, incentive, customer or control changes; compare observed outcomes with the approved case; and assign each exception an accountable owner and deadline.
27. Distinguish leading and lagging indicators
The integration team should separate behavioural precursors, operating outputs and stakeholder outcomes with stated timing. The required output is an indicator hierarchy. Use current evidence and link each material conclusion to retained operating, workforce, risk, customer, governance and transaction sources [1][9].
Translate the conclusion into the combined operating model and board report. Identify the population, process, owner, source system, definition, frequency, baseline, threshold, privacy control, intervention, expected outcome and decision deadline. Reconcile leadership, operations, risk, human resources, finance, technology and customer teams.
The principal risk is that the board can intervene only after financial or customer damage appears. Quantify decision latency, rework, exception frequency, capability loss, customer disruption, delivery variance and value at risk across baseline, integration, combined-control and intervention cases.
Retain the source, version, reviewer, limitations, contrary evidence, specialist advice and management response. Refresh the analysis after material organisation, system, incentive, customer or control changes; compare observed outcomes with the approved case; and assign each exception an accountable owner and deadline.
28. Control metric definitions
The integration team should specify owner, population, numerator, denominator, source, frequency, exclusions and quality checks. The required output is a culture data dictionary. Use current evidence and link each material conclusion to retained operating, workforce, risk, customer, governance and transaction sources [8][24].
Translate the conclusion into the combined operating model and board report. Identify the population, process, owner, source system, definition, frequency, baseline, threshold, privacy control, intervention, expected outcome and decision deadline. Reconcile leadership, operations, risk, human resources, finance, technology and customer teams.
The principal risk is that inconsistent definitions can create false trends between legacy systems. Quantify decision latency, rework, exception frequency, capability loss, customer disruption, delivery variance and value at risk across baseline, integration, combined-control and intervention cases.
Retain the source, version, reviewer, limitations, contrary evidence, specialist advice and management response. Refresh the analysis after material organisation, system, incentive, customer or control changes; compare observed outcomes with the approved case; and assign each exception an accountable owner and deadline.
29. Protect privacy and fairness
The integration team should apply purpose limitation, minimisation, access control, aggregation, retention and bias review. The required output is a lawful measurement design. Use current evidence and link each material conclusion to retained operating, workforce, risk, customer, governance and transaction sources [4][25].
Translate the conclusion into the combined operating model and board report. Identify the population, process, owner, source system, definition, frequency, baseline, threshold, privacy control, intervention, expected outcome and decision deadline. Reconcile leadership, operations, risk, human resources, finance, technology and customer teams.
The principal risk is that culture analytics can damage trust or discriminate if surveillance expands. Quantify decision latency, rework, exception frequency, capability loss, customer disruption, delivery variance and value at risk across baseline, integration, combined-control and intervention cases.
Retain the source, version, reviewer, limitations, contrary evidence, specialist advice and management response. Refresh the analysis after material organisation, system, incentive, customer or control changes; compare observed outcomes with the approved case; and assign each exception an accountable owner and deadline.
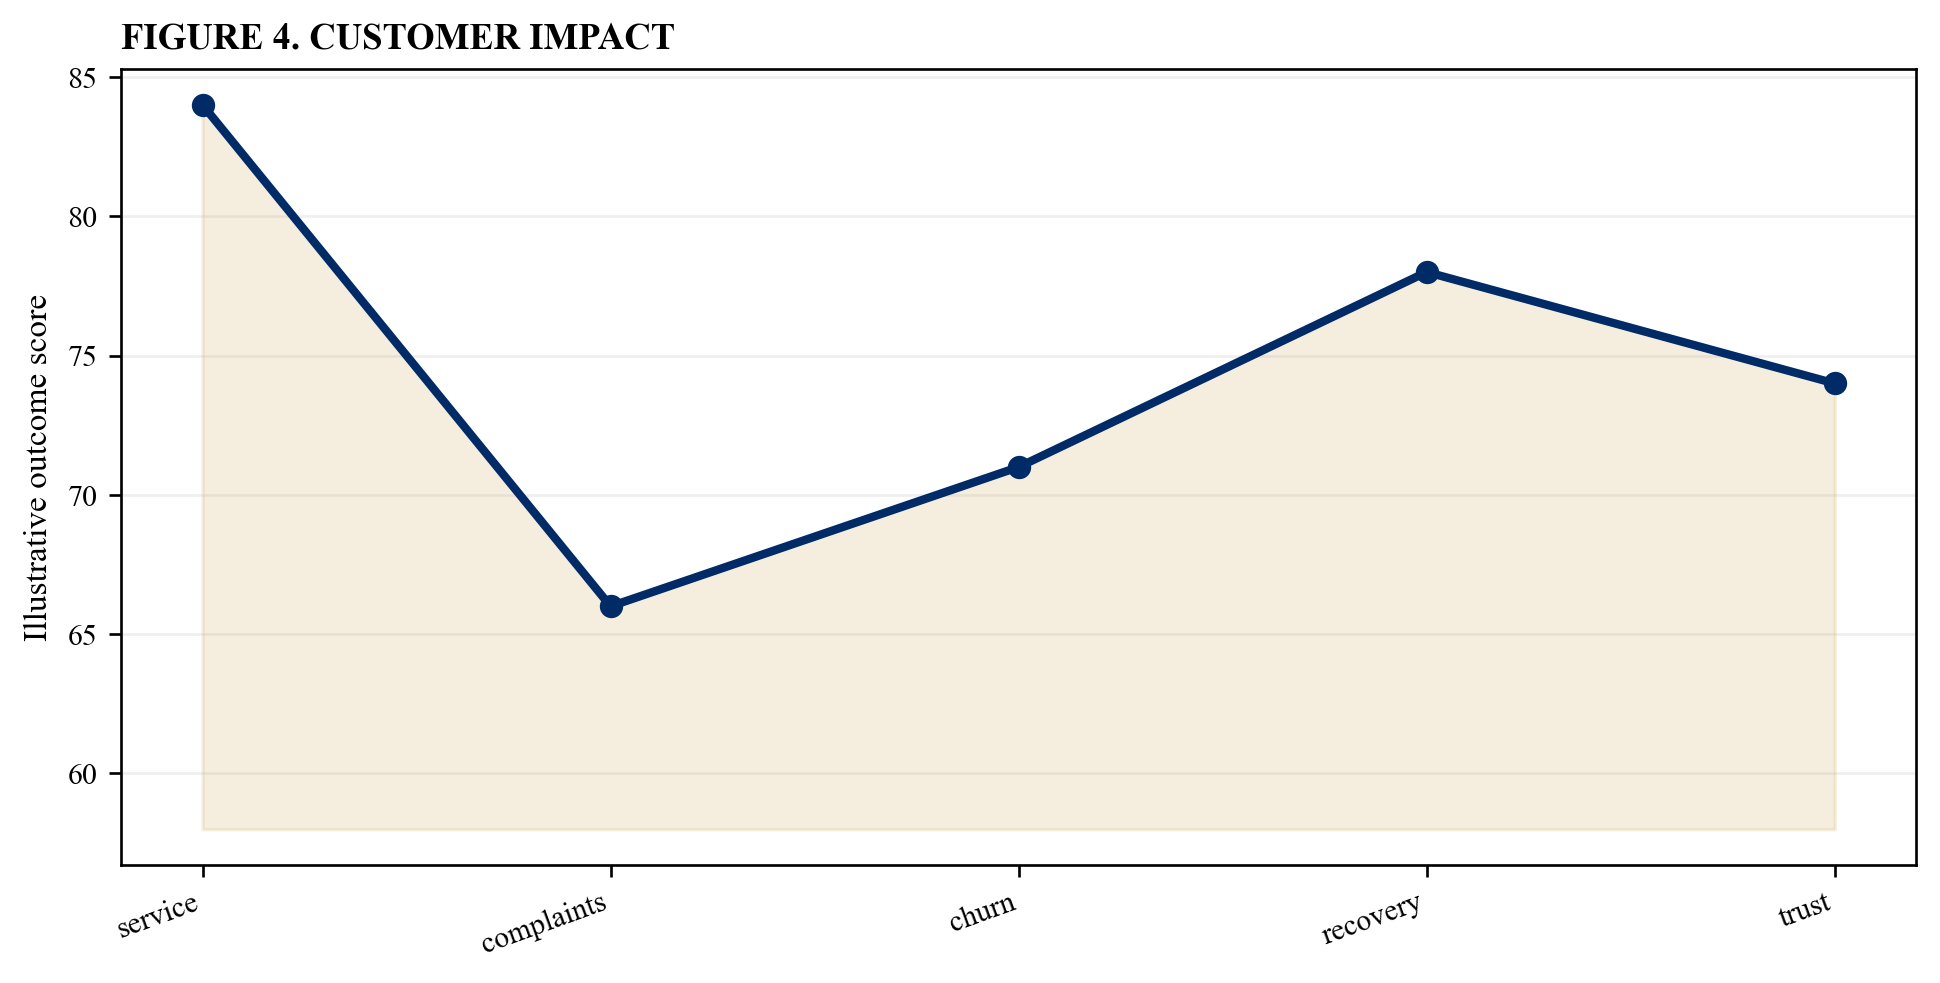
Illustrative analytical scenario; verified workforce, operating, risk and customer evidence should replace index values.
30. Triangulate quantitative and qualitative evidence
The integration team should combine system data, observation, interviews, customer evidence and controlled surveys. The required output is an evidence triangulation file. Use current evidence and link each material conclusion to retained operating, workforce, risk, customer, governance and transaction sources [1][2].
Translate the conclusion into the combined operating model and board report. Identify the population, process, owner, source system, definition, frequency, baseline, threshold, privacy control, intervention, expected outcome and decision deadline. Reconcile leadership, operations, risk, human resources, finance, technology and customer teams.
The principal risk is that one measurement method can create a confident but incomplete diagnosis. Quantify decision latency, rework, exception frequency, capability loss, customer disruption, delivery variance and value at risk across baseline, integration, combined-control and intervention cases.
Retain the source, version, reviewer, limitations, contrary evidence, specialist advice and management response. Refresh the analysis after material organisation, system, incentive, customer or control changes; compare observed outcomes with the approved case; and assign each exception an accountable owner and deadline.
31. Identify healthy differences
The integration team should test which local practices improve customers, safety, innovation, speed or market fit. The required output is a preserve-adapt-remove decision. Use current evidence and link each material conclusion to retained operating, workforce, risk, customer, governance and transaction sources [2][6].
Translate the conclusion into the combined operating model and board report. Identify the population, process, owner, source system, definition, frequency, baseline, threshold, privacy control, intervention, expected outcome and decision deadline. Reconcile leadership, operations, risk, human resources, finance, technology and customer teams.
The principal risk is that forced uniformity can destroy capabilities that created value. Quantify decision latency, rework, exception frequency, capability loss, customer disruption, delivery variance and value at risk across baseline, integration, combined-control and intervention cases.
Retain the source, version, reviewer, limitations, contrary evidence, specialist advice and management response. Refresh the analysis after material organisation, system, incentive, customer or control changes; compare observed outcomes with the approved case; and assign each exception an accountable owner and deadline.
32. Prioritise operating frictions
The integration team should rank issues by value at risk, customer harm, control exposure, frequency and feasibility. The required output is a culture intervention portfolio. Use current evidence and link each material conclusion to retained operating, workforce, risk, customer, governance and transaction sources [3][11].
Translate the conclusion into the combined operating model and board report. Identify the population, process, owner, source system, definition, frequency, baseline, threshold, privacy control, intervention, expected outcome and decision deadline. Reconcile leadership, operations, risk, human resources, finance, technology and customer teams.
The principal risk is that the programme can spread effort across visible but low-value symptoms. Quantify decision latency, rework, exception frequency, capability loss, customer disruption, delivery variance and value at risk across baseline, integration, combined-control and intervention cases.
Retain the source, version, reviewer, limitations, contrary evidence, specialist advice and management response. Refresh the analysis after material organisation, system, incentive, customer or control changes; compare observed outcomes with the approved case; and assign each exception an accountable owner and deadline.
Table 4. Intervention portfolio
| Intervention | Leading measure | Outcome measure |
|---|---|---|
| decision rights | forum latency | cycle time |
| incentives | scorecard adoption | customer and risk |
| manager routines | cadence quality | delivery reliability |
| speak-up | response time | repeat events |
Illustrative structure; verified company evidence and lawful measurement govern.
33. Redesign decision architecture
The integration team should simplify forums, clarify authority, set evidence standards and impose decision clocks. The required output is a decision-speed intervention. Use current evidence and link each material conclusion to retained operating, workforce, risk, customer, governance and transaction sources [2][12].
Translate the conclusion into the combined operating model and board report. Identify the population, process, owner, source system, definition, frequency, baseline, threshold, privacy control, intervention, expected outcome and decision deadline. Reconcile leadership, operations, risk, human resources, finance, technology and customer teams.
The principal risk is that removing approvals without redefining accountability can increase risk. Quantify decision latency, rework, exception frequency, capability loss, customer disruption, delivery variance and value at risk across baseline, integration, combined-control and intervention cases.
Retain the source, version, reviewer, limitations, contrary evidence, specialist advice and management response. Refresh the analysis after material organisation, system, incentive, customer or control changes; compare observed outcomes with the approved case; and assign each exception an accountable owner and deadline.
34. Redesign incentives and consequences
The integration team should align targets, rewards, promotion, recognition and discipline with the approved operating outcomes. The required output is an incentive transition plan. Use current evidence and link each material conclusion to retained operating, workforce, risk, customer, governance and transaction sources [3][17].
Translate the conclusion into the combined operating model and board report. Identify the population, process, owner, source system, definition, frequency, baseline, threshold, privacy control, intervention, expected outcome and decision deadline. Reconcile leadership, operations, risk, human resources, finance, technology and customer teams.
The principal risk is that legacy rewards can keep obsolete behaviours economically rational. Quantify decision latency, rework, exception frequency, capability loss, customer disruption, delivery variance and value at risk across baseline, integration, combined-control and intervention cases.
Retain the source, version, reviewer, limitations, contrary evidence, specialist advice and management response. Refresh the analysis after material organisation, system, incentive, customer or control changes; compare observed outcomes with the approved case; and assign each exception an accountable owner and deadline.
35. Build the customer-protection case
The integration team should stress service continuity, vulnerable customers, complaints, conduct and recovery during change. The required output is a customer downside scenario. Use current evidence and link each material conclusion to retained operating, workforce, risk, customer, governance and transaction sources [5][21].
Translate the conclusion into the combined operating model and board report. Identify the population, process, owner, source system, definition, frequency, baseline, threshold, privacy control, intervention, expected outcome and decision deadline. Reconcile leadership, operations, risk, human resources, finance, technology and customer teams.
The principal risk is that integration activity can transfer cost and risk to customers. Quantify decision latency, rework, exception frequency, capability loss, customer disruption, delivery variance and value at risk across baseline, integration, combined-control and intervention cases.
Retain the source, version, reviewer, limitations, contrary evidence, specialist advice and management response. Refresh the analysis after material organisation, system, incentive, customer or control changes; compare observed outcomes with the approved case; and assign each exception an accountable owner and deadline.
36. Build the risk-control case
The integration team should combine weak escalation, control overrides, capability loss, system change and management overload. The required output is a combined control scenario. Use current evidence and link each material conclusion to retained operating, workforce, risk, customer, governance and transaction sources [3][15].
Translate the conclusion into the combined operating model and board report. Identify the population, process, owner, source system, definition, frequency, baseline, threshold, privacy control, intervention, expected outcome and decision deadline. Reconcile leadership, operations, risk, human resources, finance, technology and customer teams.
The principal risk is that several moderate weaknesses can compound into a material event. Quantify decision latency, rework, exception frequency, capability loss, customer disruption, delivery variance and value at risk across baseline, integration, combined-control and intervention cases.
Retain the source, version, reviewer, limitations, contrary evidence, specialist advice and management response. Refresh the analysis after material organisation, system, incentive, customer or control changes; compare observed outcomes with the approved case; and assign each exception an accountable owner and deadline.
37. Build the decision-speed case
The integration team should model forum removal, delegation, information improvement and exception routing against quality safeguards. The required output is a speed-and-quality scenario. Use current evidence and link each material conclusion to retained operating, workforce, risk, customer, governance and transaction sources [11][12].
Translate the conclusion into the combined operating model and board report. Identify the population, process, owner, source system, definition, frequency, baseline, threshold, privacy control, intervention, expected outcome and decision deadline. Reconcile leadership, operations, risk, human resources, finance, technology and customer teams.
The principal risk is that headline acceleration can conceal more reversals and rework. Quantify decision latency, rework, exception frequency, capability loss, customer disruption, delivery variance and value at risk across baseline, integration, combined-control and intervention cases.
Retain the source, version, reviewer, limitations, contrary evidence, specialist advice and management response. Refresh the analysis after material organisation, system, incentive, customer or control changes; compare observed outcomes with the approved case; and assign each exception an accountable owner and deadline.
38. Set board escalation triggers
The integration team should define customer, risk, talent, decision and delivery thresholds with owners and response clocks. The required output is a culture escalation protocol. Use current evidence and link each material conclusion to retained operating, workforce, risk, customer, governance and transaction sources [2][3].
Translate the conclusion into the combined operating model and board report. Identify the population, process, owner, source system, definition, frequency, baseline, threshold, privacy control, intervention, expected outcome and decision deadline. Reconcile leadership, operations, risk, human resources, finance, technology and customer teams.
The principal risk is that the board can receive averaged information after harm becomes embedded. Quantify decision latency, rework, exception frequency, capability loss, customer disruption, delivery variance and value at risk across baseline, integration, combined-control and intervention cases.
Retain the source, version, reviewer, limitations, contrary evidence, specialist advice and management response. Refresh the analysis after material organisation, system, incentive, customer or control changes; compare observed outcomes with the approved case; and assign each exception an accountable owner and deadline.
39. Assure interpretation and causality
The integration team should record alternative explanations, confounders, data limitations and intervention evidence. The required output is an interpretation-control file. Use current evidence and link each material conclusion to retained operating, workforce, risk, customer, governance and transaction sources [9][24].
Translate the conclusion into the combined operating model and board report. Identify the population, process, owner, source system, definition, frequency, baseline, threshold, privacy control, intervention, expected outcome and decision deadline. Reconcile leadership, operations, risk, human resources, finance, technology and customer teams.
The principal risk is that correlation can be presented as proof that a culture initiative created value. Quantify decision latency, rework, exception frequency, capability loss, customer disruption, delivery variance and value at risk across baseline, integration, combined-control and intervention cases.
Retain the source, version, reviewer, limitations, contrary evidence, specialist advice and management response. Refresh the analysis after material organisation, system, incentive, customer or control changes; compare observed outcomes with the approved case; and assign each exception an accountable owner and deadline.
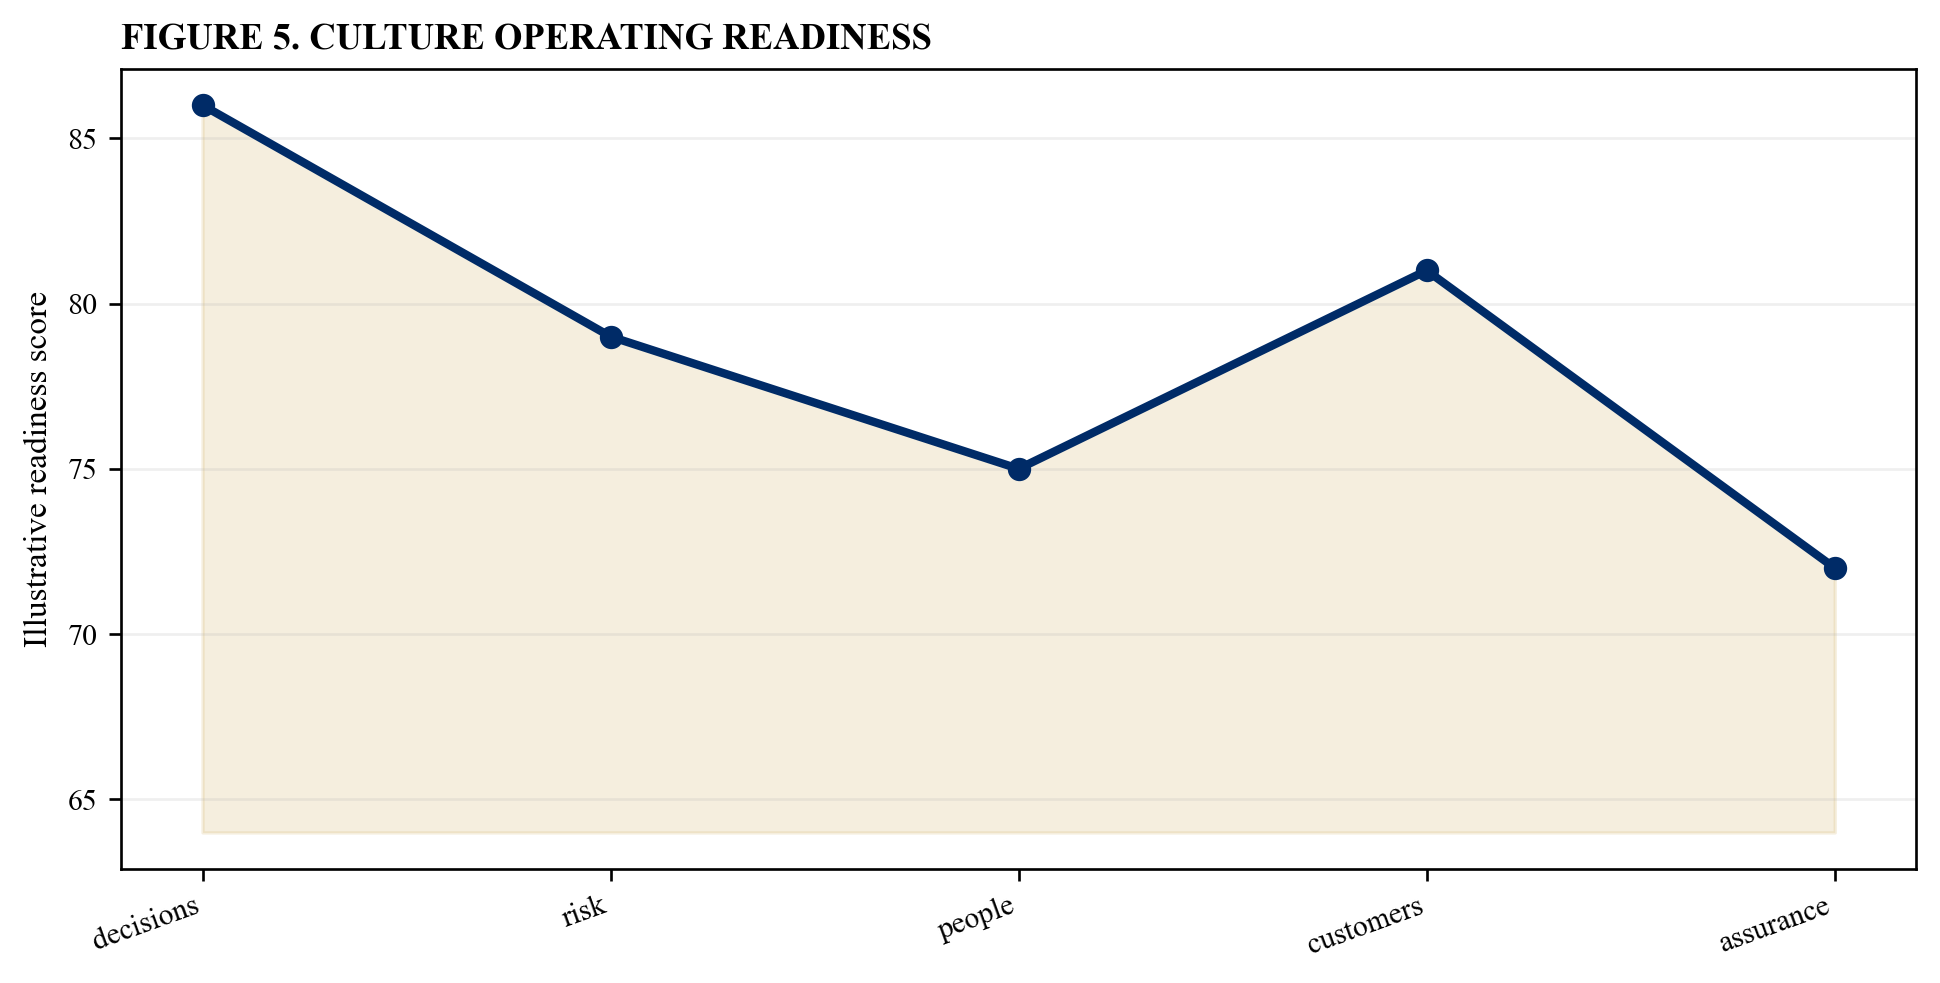
Illustrative analytical scenario; verified workforce, operating, risk and customer evidence should replace index values.
40. Issue the culture operating certificate
The integration team should approve the baseline, indicators, interventions, outcomes, limitations and accountable handover. The required output is a retained board and integration-ready culture operating certificate. Use current evidence and link each material conclusion to retained operating, workforce, risk, customer, governance and transaction sources [1][2].
Translate the conclusion into the combined operating model and board report. Identify the population, process, owner, source system, definition, frequency, baseline, threshold, privacy control, intervention, expected outcome and decision deadline. Reconcile leadership, operations, risk, human resources, finance, technology and customer teams.
The principal risk is that the integration can declare cultural alignment without evidence of operating improvement. Quantify decision latency, rework, exception frequency, capability loss, customer disruption, delivery variance and value at risk across baseline, integration, combined-control and intervention cases.
Retain the source, version, reviewer, limitations, contrary evidence, specialist advice and management response. Refresh the analysis after material organisation, system, incentive, customer or control changes; compare observed outcomes with the approved case; and assign each exception an accountable owner and deadline.
Table 5. Culture operating certificate
| Conclusion | Evidence | Approval test |
|---|---|---|
| baseline | segmented indicators | quality checked |
| behaviour | decision and risk data | triangulated |
| outcome | customer and delivery | trend supported |
| handover | owners and triggers | board accepted |
Illustrative structure; verified company evidence and lawful measurement govern.
References
- UK Financial Reporting Council, Corporate Governance Code Guidance, culture and decision-making, https://www.frc.org.uk/library/standards-codes-policy/corporate-governance/corporate-governance-code-guidance/
- UK Financial Reporting Council, UK Corporate Governance Code 2024, https://www.frc.org.uk/library/standards-codes-policy/corporate-governance/uk-corporate-governance-code/
- OECD, G20 OECD Principles of Corporate Governance 2023, board responsibilities, https://www.oecd.org/en/publications/g20-oecd-principles-of-corporate-governance-2023_ed750b30-en/full-report/component-8.html
- European Union, General Data Protection Regulation, https://eur-lex.europa.eu/eli/reg/2016/679/oj
- UK Financial Conduct Authority, Consumer Duty governance and culture, https://handbook.fca.org.uk/handbook/prin2a/prin2as8
- US Securities and Exchange Commission, acquisition integration risk disclosure example, https://www.sec.gov/Archives/edgar/data/1286139/000119312526170358/d72934dars.pdf
- IFRS Foundation, IFRS 3 Business Combinations, https://www.ifrs.org/issued-standards/list-of-standards/ifrs-3-business-combinations/
- International Organization for Standardization, ISO 30414:2025 human capital reporting and disclosure, https://www.iso.org/standard/30414.html
- UK Financial Reporting Council, Annual Review of Corporate Governance Reporting 2025, https://www.frc.org.uk/library/standards-codes-policy/corporate-governance/annual-review-of-corporate-governance-reporting/
- UK Financial Reporting Council, Corporate Culture and the Role of Boards, https://www.frc.org.uk/library/standards-codes-policy/corporate-governance/corporate-culture/
- International Organization for Standardization, ISO 9001 quality management systems, https://www.iso.org/standard/62085.html
- UK Financial Reporting Council, Corporate Governance Code Guidance, division of responsibilities, https://www.frc.org.uk/library/standards-codes-policy/corporate-governance/corporate-governance-code-guidance/
- US Department of Justice, Evaluation of Corporate Compliance Programs, https://www.justice.gov/criminal/criminal-fraud/page/file/937501/dl
- US Office of Personnel Management, Federal Employee Viewpoint Survey technical resources, https://www.opm.gov/fevs/
- Committee of Sponsoring Organizations of the Treadway Commission, Enterprise Risk Management, https://www.coso.org/enterprise-risk-management
- UK Financial Conduct Authority, culture and non-financial misconduct survey findings, https://www.fca.org.uk/data/culture-non-financial-misconduct-survey-findings
- US Department of Justice Antitrust Division, Evaluation of Corporate Compliance Programs, November 2024, https://www.justice.gov/d9/2024-11/DOJ%20Antitrust%20Division%20ECCP%20-%20November%202024%20Updates%20-%20FINAL.pdf
- International Organization for Standardization, ISO 30422 learning and development, https://www.iso.org/standard/68520.html
- US Securities and Exchange Commission, Regulation S-K Item 101 human capital disclosure, https://www.ecfr.gov/current/title-17/chapter-II/part-229/section-229.101
- International Labour Organization, Occupational Safety and Health Convention C155, https://normlex.ilo.org/dyn/nrmlx_en/f?p=NORMLEXPUB:12100:0::NO::P12100_ILO_CODE:C155
- UK Financial Conduct Authority, culture and governance, https://www.fca.org.uk/firms/culture-governance
- International Organization for Standardization, ISO 10004 customer satisfaction monitoring and measurement, https://www.iso.org/standard/71580.html
- OECD, Oslo Manual 2018 guidelines for collecting and interpreting innovation data, https://www.oecd.org/en/publications/oslo-manual-2018_9789264304604-en.html
- US Government Accountability Office, Assessing Data Reliability, https://www.gao.gov/products/gao-20-283g
- US Equal Employment Opportunity Commission, Artificial Intelligence and Algorithmic Fairness Initiative, https://www.eeoc.gov/ai
- US Securities and Exchange Commission, acquisition integration and customer-loss risk disclosure example, https://www.sec.gov/Archives/edgar/data/1570585/000119312525076843/d852452dars.pdf
