

1. Define the service and usage unit
The project team should specify the public service, user, unit of usage, charging point, service boundary and measurement interval. The required output is a service-and-usage definition. Record the relevant demand driver, responsible party, evidence, control right, cash-flow consequence, approval and review date [1][2].
Test the allocation against historical data, independent forecasts, observed user behaviour, service standards, tariff authority, network decisions, competing facilities, collection evidence, affordability, lender requirements and applicable law. Separate influence from mere exposure and preserve source dates and limitations.
The principal risk is that demand can be forecast for a metric that does not match the payment or public outcome. Quantify effects on usage, price, collections, revenue, operating cost, debt-service coverage, equity returns, contingent public liabilities and user affordability. Compare the proposed allocation with credible user-pay, availability and shared-risk alternatives.
Translate the conclusion into forecast assumptions, payment terms, performance standards, support instruments, financing terms, monitoring triggers, relief and termination provisions. Refresh it when economic conditions, policy, tariffs, networks, competing capacity, technology or user behaviour changes.
2. Separate demand from revenue risk
The project team should decompose volume, tariff, collection, deductions, subsidies and payment timing. The required output is a revenue-risk decomposition. Record the relevant demand driver, responsible party, evidence, control right, cash-flow consequence, approval and review date [3][4].
Test the allocation against historical data, independent forecasts, observed user behaviour, service standards, tariff authority, network decisions, competing facilities, collection evidence, affordability, lender requirements and applicable law. Separate influence from mere exposure and preserve source dates and limitations.
The principal risk is that a traffic or consumption forecast can conceal tariff and collection exposure. Quantify effects on usage, price, collections, revenue, operating cost, debt-service coverage, equity returns, contingent public liabilities and user affordability. Compare the proposed allocation with credible user-pay, availability and shared-risk alternatives.
Translate the conclusion into forecast assumptions, payment terms, performance standards, support instruments, financing terms, monitoring triggers, relief and termination provisions. Refresh it when economic conditions, policy, tariffs, networks, competing capacity, technology or user behaviour changes.
3. Map every demand driver
The project team should identify income, population, land use, alternatives, network effects, service quality, price, technology and policy. The required output is a demand-driver map. Record the relevant demand driver, responsible party, evidence, control right, cash-flow consequence, approval and review date [5][6].
Test the allocation against historical data, independent forecasts, observed user behaviour, service standards, tariff authority, network decisions, competing facilities, collection evidence, affordability, lender requirements and applicable law. Separate influence from mere exposure and preserve source dates and limitations.
The principal risk is that the contract can transfer outcomes driven chiefly by public or systemic decisions. Quantify effects on usage, price, collections, revenue, operating cost, debt-service coverage, equity returns, contingent public liabilities and user affordability. Compare the proposed allocation with credible user-pay, availability and shared-risk alternatives.
Translate the conclusion into forecast assumptions, payment terms, performance standards, support instruments, financing terms, monitoring triggers, relief and termination provisions. Refresh it when economic conditions, policy, tariffs, networks, competing capacity, technology or user behaviour changes.
4. Apply the control test
The project team should score each party on authority, information, operational influence, mitigation capacity and incentive. The required output is a demand-control matrix. Record the relevant demand driver, responsible party, evidence, control right, cash-flow consequence, approval and review date [1][7].
Test the allocation against historical data, independent forecasts, observed user behaviour, service standards, tariff authority, network decisions, competing facilities, collection evidence, affordability, lender requirements and applicable law. Separate influence from mere exposure and preserve source dates and limitations.
The principal risk is that nominal ownership of risk can exceed practical ability to manage it. Quantify effects on usage, price, collections, revenue, operating cost, debt-service coverage, equity returns, contingent public liabilities and user affordability. Compare the proposed allocation with credible user-pay, availability and shared-risk alternatives.
Translate the conclusion into forecast assumptions, payment terms, performance standards, support instruments, financing terms, monitoring triggers, relief and termination provisions. Refresh it when economic conditions, policy, tariffs, networks, competing capacity, technology or user behaviour changes.
5. Test ability to absorb downside
The project team should compare liquidity, capital, diversification, fiscal capacity, insurance and refinancing consequences. The required output is a downside-absorption assessment. Record the relevant demand driver, responsible party, evidence, control right, cash-flow consequence, approval and review date [8][9].
Test the allocation against historical data, independent forecasts, observed user behaviour, service standards, tariff authority, network decisions, competing facilities, collection evidence, affordability, lender requirements and applicable law. Separate influence from mere exposure and preserve source dates and limitations.
The principal risk is that risk can sit with a party that can influence it but cannot survive its volatility. Quantify effects on usage, price, collections, revenue, operating cost, debt-service coverage, equity returns, contingent public liabilities and user affordability. Compare the proposed allocation with credible user-pay, availability and shared-risk alternatives.
Translate the conclusion into forecast assumptions, payment terms, performance standards, support instruments, financing terms, monitoring triggers, relief and termination provisions. Refresh it when economic conditions, policy, tariffs, networks, competing capacity, technology or user behaviour changes.
6. Build an independent demand baseline
The project team should reconcile historical usage, demographic evidence, economic activity, network data and observed behaviour. The required output is an evidence-dated baseline. Record the relevant demand driver, responsible party, evidence, control right, cash-flow consequence, approval and review date [10][11].
Test the allocation against historical data, independent forecasts, observed user behaviour, service standards, tariff authority, network decisions, competing facilities, collection evidence, affordability, lender requirements and applicable law. Separate influence from mere exposure and preserve source dates and limitations.
The principal risk is that sponsor and authority forecasts can share the same unsupported optimism. Quantify effects on usage, price, collections, revenue, operating cost, debt-service coverage, equity returns, contingent public liabilities and user affordability. Compare the proposed allocation with credible user-pay, availability and shared-risk alternatives.
Translate the conclusion into forecast assumptions, payment terms, performance standards, support instruments, financing terms, monitoring triggers, relief and termination provisions. Refresh it when economic conditions, policy, tariffs, networks, competing capacity, technology or user behaviour changes.
7. Audit forecast methodology
The project team should test model form, segmentation, elasticities, ramp-up, seasonality, calibration and out-of-sample performance. The required output is a forecast-validation report. Record the relevant demand driver, responsible party, evidence, control right, cash-flow consequence, approval and review date [12][13].
Test the allocation against historical data, independent forecasts, observed user behaviour, service standards, tariff authority, network decisions, competing facilities, collection evidence, affordability, lender requirements and applicable law. Separate influence from mere exposure and preserve source dates and limitations.
The principal risk is that precision can mask weak causal evidence and parameter instability. Quantify effects on usage, price, collections, revenue, operating cost, debt-service coverage, equity returns, contingent public liabilities and user affordability. Compare the proposed allocation with credible user-pay, availability and shared-risk alternatives.
Translate the conclusion into forecast assumptions, payment terms, performance standards, support instruments, financing terms, monitoring triggers, relief and termination provisions. Refresh it when economic conditions, policy, tariffs, networks, competing capacity, technology or user behaviour changes.
8. Model price elasticity explicitly
The project team should estimate response to tolls, fares, tariffs, congestion pricing, subsidies and cross-price alternatives. The required output is an elasticity schedule. Record the relevant demand driver, responsible party, evidence, control right, cash-flow consequence, approval and review date [14][15].
Test the allocation against historical data, independent forecasts, observed user behaviour, service standards, tariff authority, network decisions, competing facilities, collection evidence, affordability, lender requirements and applicable law. Separate influence from mere exposure and preserve source dates and limitations.
The principal risk is that price changes can produce demand effects omitted from the financing case. Quantify effects on usage, price, collections, revenue, operating cost, debt-service coverage, equity returns, contingent public liabilities and user affordability. Compare the proposed allocation with credible user-pay, availability and shared-risk alternatives.
Translate the conclusion into forecast assumptions, payment terms, performance standards, support instruments, financing terms, monitoring triggers, relief and termination provisions. Refresh it when economic conditions, policy, tariffs, networks, competing capacity, technology or user behaviour changes.
Table 1. Demand-driver control map
| Driver | Primary influence | Contract response |
|---|---|---|
| service quality | operator | performance regime |
| tariff | authority or regulator | formula and relief |
| competition | authority and market | protection or sharing |
| economy | neither party | bands or resilience |
Illustrative analytical structure; verified project and jurisdiction evidence governs.
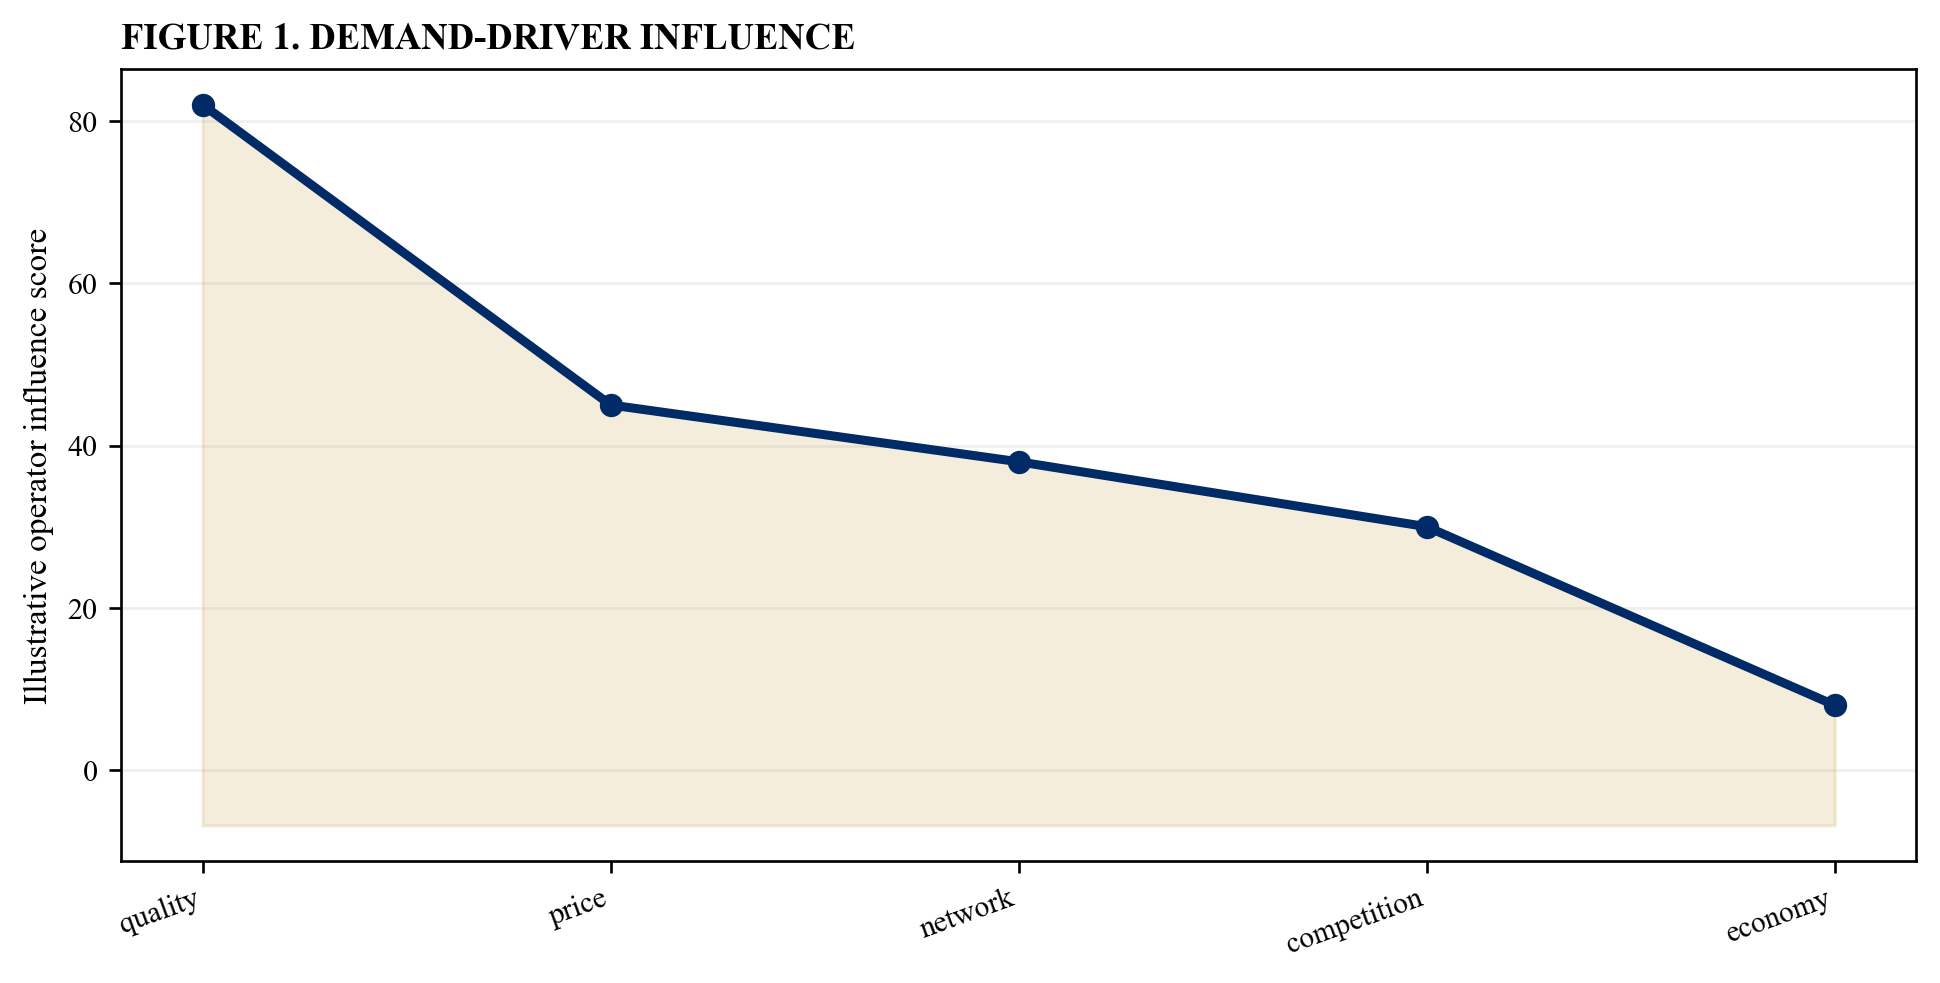
Illustrative analytical scenario; verified project evidence should replace values.
9. Test competing-facility risk
The project team should map existing, announced and discretionary roads, transit, generation, water sources and bypass capacity. The required output is a competing-facilities protocol. Record the relevant demand driver, responsible party, evidence, control right, cash-flow consequence, approval and review date [5][16].
Test the allocation against historical data, independent forecasts, observed user behaviour, service standards, tariff authority, network decisions, competing facilities, collection evidence, affordability, lender requirements and applicable law. Separate influence from mere exposure and preserve source dates and limitations.
The principal risk is that publicly sponsored alternatives can divert usage after financial close. Quantify effects on usage, price, collections, revenue, operating cost, debt-service coverage, equity returns, contingent public liabilities and user affordability. Compare the proposed allocation with credible user-pay, availability and shared-risk alternatives.
Translate the conclusion into forecast assumptions, payment terms, performance standards, support instruments, financing terms, monitoring triggers, relief and termination provisions. Refresh it when economic conditions, policy, tariffs, networks, competing capacity, technology or user behaviour changes.
10. Allocate network-policy risk
The project team should identify control of routes, timetables, connections, dispatch, access, zoning and system expansion. The required output is a network-policy allocation. Record the relevant demand driver, responsible party, evidence, control right, cash-flow consequence, approval and review date [17][18].
Test the allocation against historical data, independent forecasts, observed user behaviour, service standards, tariff authority, network decisions, competing facilities, collection evidence, affordability, lender requirements and applicable law. Separate influence from mere exposure and preserve source dates and limitations.
The principal risk is that operator revenue can depend on decisions made elsewhere in the public network. Quantify effects on usage, price, collections, revenue, operating cost, debt-service coverage, equity returns, contingent public liabilities and user affordability. Compare the proposed allocation with credible user-pay, availability and shared-risk alternatives.
Translate the conclusion into forecast assumptions, payment terms, performance standards, support instruments, financing terms, monitoring triggers, relief and termination provisions. Refresh it when economic conditions, policy, tariffs, networks, competing capacity, technology or user behaviour changes.
11. Distinguish service quality from demand
The project team should separate availability, reliability, journey time, water pressure, power quality and customer service. The required output is a performance-and-usage bridge. Record the relevant demand driver, responsible party, evidence, control right, cash-flow consequence, approval and review date [19][20].
Test the allocation against historical data, independent forecasts, observed user behaviour, service standards, tariff authority, network decisions, competing facilities, collection evidence, affordability, lender requirements and applicable law. Separate influence from mere exposure and preserve source dates and limitations.
The principal risk is that poor performance can be misclassified as uncontrollable market demand. Quantify effects on usage, price, collections, revenue, operating cost, debt-service coverage, equity returns, contingent public liabilities and user affordability. Compare the proposed allocation with credible user-pay, availability and shared-risk alternatives.
Translate the conclusion into forecast assumptions, payment terms, performance standards, support instruments, financing terms, monitoring triggers, relief and termination provisions. Refresh it when economic conditions, policy, tariffs, networks, competing capacity, technology or user behaviour changes.
12. Allocate collection and leakage risk
The project team should assign metering, billing, enforcement, theft, non-revenue water, losses and bad debt. The required output is a collection-risk plan. Record the relevant demand driver, responsible party, evidence, control right, cash-flow consequence, approval and review date [21][22].
Test the allocation against historical data, independent forecasts, observed user behaviour, service standards, tariff authority, network decisions, competing facilities, collection evidence, affordability, lender requirements and applicable law. Separate influence from mere exposure and preserve source dates and limitations.
The principal risk is that revenue leakage can be mistaken for low underlying demand. Quantify effects on usage, price, collections, revenue, operating cost, debt-service coverage, equity returns, contingent public liabilities and user affordability. Compare the proposed allocation with credible user-pay, availability and shared-risk alternatives.
Translate the conclusion into forecast assumptions, payment terms, performance standards, support instruments, financing terms, monitoring triggers, relief and termination provisions. Refresh it when economic conditions, policy, tariffs, networks, competing capacity, technology or user behaviour changes.
13. Structure user-pay exposure
The project team should align rights over price, service, marketing, capacity and collection with user-charge revenue. The required output is a user-pay term sheet. Record the relevant demand driver, responsible party, evidence, control right, cash-flow consequence, approval and review date [3][23].
Test the allocation against historical data, independent forecasts, observed user behaviour, service standards, tariff authority, network decisions, competing facilities, collection evidence, affordability, lender requirements and applicable law. Separate influence from mere exposure and preserve source dates and limitations.
The principal risk is that full volume risk can be transferred without the commercial freedoms needed to manage it. Quantify effects on usage, price, collections, revenue, operating cost, debt-service coverage, equity returns, contingent public liabilities and user affordability. Compare the proposed allocation with credible user-pay, availability and shared-risk alternatives.
Translate the conclusion into forecast assumptions, payment terms, performance standards, support instruments, financing terms, monitoring triggers, relief and termination provisions. Refresh it when economic conditions, policy, tariffs, networks, competing capacity, technology or user behaviour changes.
14. Structure availability payments
The project team should link payment to accessible capacity and service quality independently of usage. The required output is an availability-payment schedule. Record the relevant demand driver, responsible party, evidence, control right, cash-flow consequence, approval and review date [4][24].
Test the allocation against historical data, independent forecasts, observed user behaviour, service standards, tariff authority, network decisions, competing facilities, collection evidence, affordability, lender requirements and applicable law. Separate influence from mere exposure and preserve source dates and limitations.
The principal risk is that government can retain demand risk without monitoring its fiscal and capacity consequences. Quantify effects on usage, price, collections, revenue, operating cost, debt-service coverage, equity returns, contingent public liabilities and user affordability. Compare the proposed allocation with credible user-pay, availability and shared-risk alternatives.
Translate the conclusion into forecast assumptions, payment terms, performance standards, support instruments, financing terms, monitoring triggers, relief and termination provisions. Refresh it when economic conditions, policy, tariffs, networks, competing capacity, technology or user behaviour changes.
15. Use usage-based public payments carefully
The project team should define shadow tolls, output subsidies, per-passenger or per-unit payments and caps. The required output is a usage-payment mechanism. Record the relevant demand driver, responsible party, evidence, control right, cash-flow consequence, approval and review date [4][25].
Test the allocation against historical data, independent forecasts, observed user behaviour, service standards, tariff authority, network decisions, competing facilities, collection evidence, affordability, lender requirements and applicable law. Separate influence from mere exposure and preserve source dates and limitations.
The principal risk is that volume-linked public payments can create uncapped fiscal exposure or weak service incentives. Quantify effects on usage, price, collections, revenue, operating cost, debt-service coverage, equity returns, contingent public liabilities and user affordability. Compare the proposed allocation with credible user-pay, availability and shared-risk alternatives.
Translate the conclusion into forecast assumptions, payment terms, performance standards, support instruments, financing terms, monitoring triggers, relief and termination provisions. Refresh it when economic conditions, policy, tariffs, networks, competing capacity, technology or user behaviour changes.
16. Design demand bands
The project team should allocate downside, base and upside volumes through thresholds, sharing percentages and resets. The required output is a banded-risk schedule. Record the relevant demand driver, responsible party, evidence, control right, cash-flow consequence, approval and review date [6][26].
Test the allocation against historical data, independent forecasts, observed user behaviour, service standards, tariff authority, network decisions, competing facilities, collection evidence, affordability, lender requirements and applicable law. Separate influence from mere exposure and preserve source dates and limitations.
The principal risk is that a single all-or-nothing allocation can be expensive and unstable. Quantify effects on usage, price, collections, revenue, operating cost, debt-service coverage, equity returns, contingent public liabilities and user affordability. Compare the proposed allocation with credible user-pay, availability and shared-risk alternatives.
Translate the conclusion into forecast assumptions, payment terms, performance standards, support instruments, financing terms, monitoring triggers, relief and termination provisions. Refresh it when economic conditions, policy, tariffs, networks, competing capacity, technology or user behaviour changes.
Table 2. Payment structures
| Structure | Demand bearer | Core control |
|---|---|---|
| user pay | private | pricing and service rights |
| availability | public | output and deductions |
| banded | shared | threshold waterfall |
| minimum revenue | public below floor | eligibility and cap |
Illustrative analytical structure; verified project and jurisdiction evidence governs.
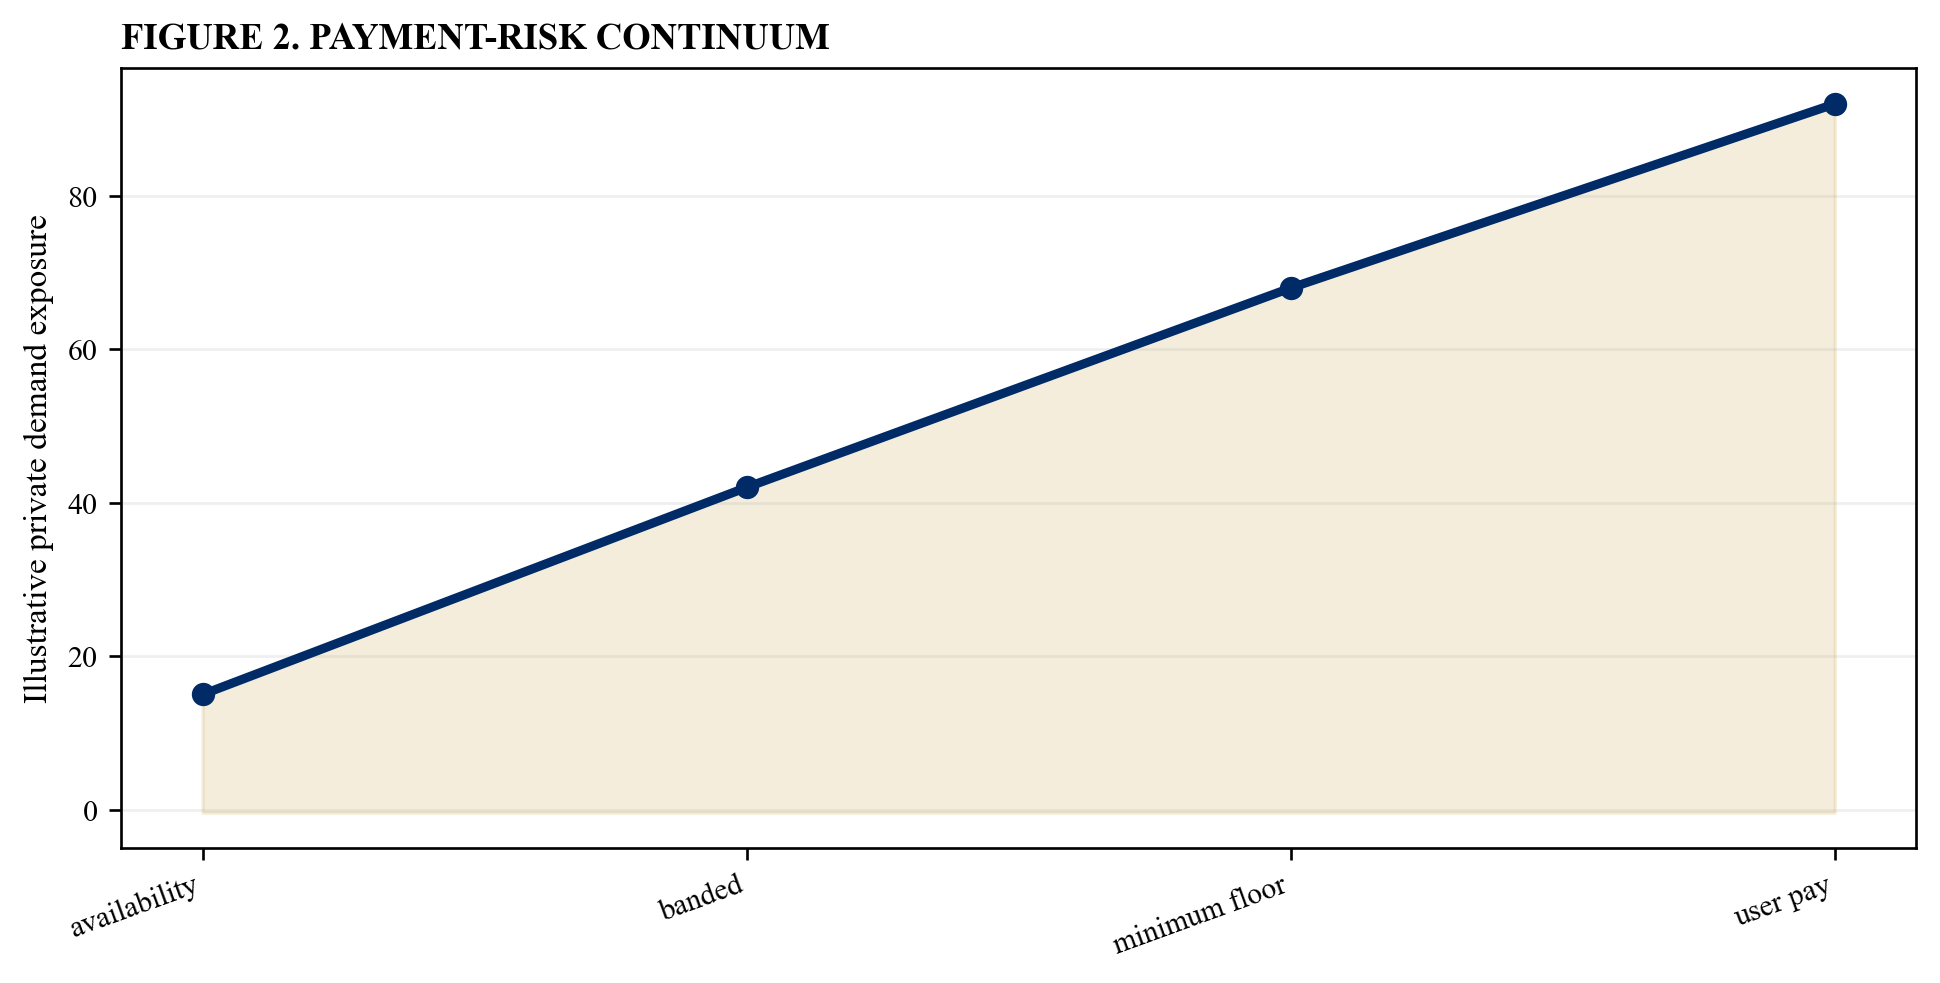
Illustrative analytical scenario; verified project evidence should replace values.
17. Calibrate minimum-revenue guarantees
The project team should define floor, deductible, duration, cap, eligibility, mitigation and clawback. The required output is a guarantee term sheet. Record the relevant demand driver, responsible party, evidence, control right, cash-flow consequence, approval and review date [8][27].
Test the allocation against historical data, independent forecasts, observed user behaviour, service standards, tariff authority, network decisions, competing facilities, collection evidence, affordability, lender requirements and applicable law. Separate influence from mere exposure and preserve source dates and limitations.
The principal risk is that a guarantee can socialise ordinary commercial downside and weaken operator effort. Quantify effects on usage, price, collections, revenue, operating cost, debt-service coverage, equity returns, contingent public liabilities and user affordability. Compare the proposed allocation with credible user-pay, availability and shared-risk alternatives.
Translate the conclusion into forecast assumptions, payment terms, performance standards, support instruments, financing terms, monitoring triggers, relief and termination provisions. Refresh it when economic conditions, policy, tariffs, networks, competing capacity, technology or user behaviour changes.
18. Consider flexible concession terms
The project team should link duration to cumulative revenue, usage or return within legal and service constraints. The required output is a variable-term mechanism. Record the relevant demand driver, responsible party, evidence, control right, cash-flow consequence, approval and review date [28][29].
Test the allocation against historical data, independent forecasts, observed user behaviour, service standards, tariff authority, network decisions, competing facilities, collection evidence, affordability, lender requirements and applicable law. Separate influence from mere exposure and preserve source dates and limitations.
The principal risk is that fixed tenure can overcompensate upside or fail to repair temporary demand shocks. Quantify effects on usage, price, collections, revenue, operating cost, debt-service coverage, equity returns, contingent public liabilities and user affordability. Compare the proposed allocation with credible user-pay, availability and shared-risk alternatives.
Translate the conclusion into forecast assumptions, payment terms, performance standards, support instruments, financing terms, monitoring triggers, relief and termination provisions. Refresh it when economic conditions, policy, tariffs, networks, competing capacity, technology or user behaviour changes.
19. Share upside symmetrically
The project team should set revenue sharing, tariff reductions, accelerated expiry or public participation above thresholds. The required output is an upside-sharing waterfall. Record the relevant demand driver, responsible party, evidence, control right, cash-flow consequence, approval and review date [6][27].
Test the allocation against historical data, independent forecasts, observed user behaviour, service standards, tariff authority, network decisions, competing facilities, collection evidence, affordability, lender requirements and applicable law. Separate influence from mere exposure and preserve source dates and limitations.
The principal risk is that public downside support can exist without a corresponding claim on excess returns. Quantify effects on usage, price, collections, revenue, operating cost, debt-service coverage, equity returns, contingent public liabilities and user affordability. Compare the proposed allocation with credible user-pay, availability and shared-risk alternatives.
Translate the conclusion into forecast assumptions, payment terms, performance standards, support instruments, financing terms, monitoring triggers, relief and termination provisions. Refresh it when economic conditions, policy, tariffs, networks, competing capacity, technology or user behaviour changes.
20. Protect affordability
The project team should test household, commuter, industrial and vulnerable-user burdens under tariff and inflation cases. The required output is an affordability assessment. Record the relevant demand driver, responsible party, evidence, control right, cash-flow consequence, approval and review date [30][31].
Test the allocation against historical data, independent forecasts, observed user behaviour, service standards, tariff authority, network decisions, competing facilities, collection evidence, affordability, lender requirements and applicable law. Separate influence from mere exposure and preserve source dates and limitations.
The principal risk is that bankability can be achieved through prices that undermine access or political durability. Quantify effects on usage, price, collections, revenue, operating cost, debt-service coverage, equity returns, contingent public liabilities and user affordability. Compare the proposed allocation with credible user-pay, availability and shared-risk alternatives.
Translate the conclusion into forecast assumptions, payment terms, performance standards, support instruments, financing terms, monitoring triggers, relief and termination provisions. Refresh it when economic conditions, policy, tariffs, networks, competing capacity, technology or user behaviour changes.
21. Allocate tariff-setting risk
The project team should define formula, regulator discretion, indexation, review timing, disallowance and compensation. The required output is a tariff-risk protocol. Record the relevant demand driver, responsible party, evidence, control right, cash-flow consequence, approval and review date [14][32].
Test the allocation against historical data, independent forecasts, observed user behaviour, service standards, tariff authority, network decisions, competing facilities, collection evidence, affordability, lender requirements and applicable law. Separate influence from mere exposure and preserve source dates and limitations.
The principal risk is that private demand exposure can be dominated by prices controlled by government. Quantify effects on usage, price, collections, revenue, operating cost, debt-service coverage, equity returns, contingent public liabilities and user affordability. Compare the proposed allocation with credible user-pay, availability and shared-risk alternatives.
Translate the conclusion into forecast assumptions, payment terms, performance standards, support instruments, financing terms, monitoring triggers, relief and termination provisions. Refresh it when economic conditions, policy, tariffs, networks, competing capacity, technology or user behaviour changes.
22. Control inflation and indexation
The project team should match relevant cost baskets, lag, caps, floors and efficiency factors. The required output is an indexation formula. Record the relevant demand driver, responsible party, evidence, control right, cash-flow consequence, approval and review date [32][33].
Test the allocation against historical data, independent forecasts, observed user behaviour, service standards, tariff authority, network decisions, competing facilities, collection evidence, affordability, lender requirements and applicable law. Separate influence from mere exposure and preserve source dates and limitations.
The principal risk is that nominal revenue can lag unavoidable costs and distort apparent demand performance. Quantify effects on usage, price, collections, revenue, operating cost, debt-service coverage, equity returns, contingent public liabilities and user affordability. Compare the proposed allocation with credible user-pay, availability and shared-risk alternatives.
Translate the conclusion into forecast assumptions, payment terms, performance standards, support instruments, financing terms, monitoring triggers, relief and termination provisions. Refresh it when economic conditions, policy, tariffs, networks, competing capacity, technology or user behaviour changes.
23. Address macroeconomic demand shocks
The project team should stress GDP, employment, trade, tourism, industrial output, interest rates and exchange rates. The required output is a macro-demand scenario set. Record the relevant demand driver, responsible party, evidence, control right, cash-flow consequence, approval and review date [9][34].
Test the allocation against historical data, independent forecasts, observed user behaviour, service standards, tariff authority, network decisions, competing facilities, collection evidence, affordability, lender requirements and applicable law. Separate influence from mere exposure and preserve source dates and limitations.
The principal risk is that highly correlated systemic shocks can overwhelm project-level mitigation. Quantify effects on usage, price, collections, revenue, operating cost, debt-service coverage, equity returns, contingent public liabilities and user affordability. Compare the proposed allocation with credible user-pay, availability and shared-risk alternatives.
Translate the conclusion into forecast assumptions, payment terms, performance standards, support instruments, financing terms, monitoring triggers, relief and termination provisions. Refresh it when economic conditions, policy, tariffs, networks, competing capacity, technology or user behaviour changes.
24. Address technology substitution
The project team should monitor remote work, electric mobility, distributed generation, storage, recycling and efficiency. The required output is a substitution-risk register. Record the relevant demand driver, responsible party, evidence, control right, cash-flow consequence, approval and review date [35][36].
Test the allocation against historical data, independent forecasts, observed user behaviour, service standards, tariff authority, network decisions, competing facilities, collection evidence, affordability, lender requirements and applicable law. Separate influence from mere exposure and preserve source dates and limitations.
The principal risk is that long-lived infrastructure can lose usage to technologies absent from the original model. Quantify effects on usage, price, collections, revenue, operating cost, debt-service coverage, equity returns, contingent public liabilities and user affordability. Compare the proposed allocation with credible user-pay, availability and shared-risk alternatives.
Translate the conclusion into forecast assumptions, payment terms, performance standards, support instruments, financing terms, monitoring triggers, relief and termination provisions. Refresh it when economic conditions, policy, tariffs, networks, competing capacity, technology or user behaviour changes.
25. Allocate public-policy transition risk
The project team should define treatment of decarbonisation, conservation, congestion, modal shift and efficiency policies. The required output is a policy-transition regime. Record the relevant demand driver, responsible party, evidence, control right, cash-flow consequence, approval and review date [35][37].
Test the allocation against historical data, independent forecasts, observed user behaviour, service standards, tariff authority, network decisions, competing facilities, collection evidence, affordability, lender requirements and applicable law. Separate influence from mere exposure and preserve source dates and limitations.
The principal risk is that government can intentionally reduce demand for reasons that advance public value. Quantify effects on usage, price, collections, revenue, operating cost, debt-service coverage, equity returns, contingent public liabilities and user affordability. Compare the proposed allocation with credible user-pay, availability and shared-risk alternatives.
Translate the conclusion into forecast assumptions, payment terms, performance standards, support instruments, financing terms, monitoring triggers, relief and termination provisions. Refresh it when economic conditions, policy, tariffs, networks, competing capacity, technology or user behaviour changes.
26. Design transport demand risk
The project team should separate road traffic, public-transport ridership, port throughput, airport movements and ancillary revenue. The required output is a transport demand allocation. Record the relevant demand driver, responsible party, evidence, control right, cash-flow consequence, approval and review date [5][38].
Test the allocation against historical data, independent forecasts, observed user behaviour, service standards, tariff authority, network decisions, competing facilities, collection evidence, affordability, lender requirements and applicable law. Separate influence from mere exposure and preserve source dates and limitations.
The principal risk is that transport modes have materially different network, pricing and behavioural controls. Quantify effects on usage, price, collections, revenue, operating cost, debt-service coverage, equity returns, contingent public liabilities and user affordability. Compare the proposed allocation with credible user-pay, availability and shared-risk alternatives.
Translate the conclusion into forecast assumptions, payment terms, performance standards, support instruments, financing terms, monitoring triggers, relief and termination provisions. Refresh it when economic conditions, policy, tariffs, networks, competing capacity, technology or user behaviour changes.
27. Design water demand risk
The project team should separate bulk offtake, distribution consumption, connections, leakage, collection and tariff affordability. The required output is a water demand allocation. Record the relevant demand driver, responsible party, evidence, control right, cash-flow consequence, approval and review date [21][39].
Test the allocation against historical data, independent forecasts, observed user behaviour, service standards, tariff authority, network decisions, competing facilities, collection evidence, affordability, lender requirements and applicable law. Separate influence from mere exposure and preserve source dates and limitations.
The principal risk is that operators can control losses and collection while consumption and tariff policy remain partly external. Quantify effects on usage, price, collections, revenue, operating cost, debt-service coverage, equity returns, contingent public liabilities and user affordability. Compare the proposed allocation with credible user-pay, availability and shared-risk alternatives.
Translate the conclusion into forecast assumptions, payment terms, performance standards, support instruments, financing terms, monitoring triggers, relief and termination provisions. Refresh it when economic conditions, policy, tariffs, networks, competing capacity, technology or user behaviour changes.
28. Design electricity demand risk
The project team should separate capacity availability, dispatch, energy output, network curtailment, losses and offtaker payment. The required output is a power demand allocation. Record the relevant demand driver, responsible party, evidence, control right, cash-flow consequence, approval and review date [18][40].
Test the allocation against historical data, independent forecasts, observed user behaviour, service standards, tariff authority, network decisions, competing facilities, collection evidence, affordability, lender requirements and applicable law. Separate influence from mere exposure and preserve source dates and limitations.
The principal risk is that a generator can be financeable only when debt service rests on variables it can control. Quantify effects on usage, price, collections, revenue, operating cost, debt-service coverage, equity returns, contingent public liabilities and user affordability. Compare the proposed allocation with credible user-pay, availability and shared-risk alternatives.
Translate the conclusion into forecast assumptions, payment terms, performance standards, support instruments, financing terms, monitoring triggers, relief and termination provisions. Refresh it when economic conditions, policy, tariffs, networks, competing capacity, technology or user behaviour changes.
Table 3. Sector control matrix
| Sector | Operator controls | Public controls |
|---|---|---|
| roads | service and collection | network and toll policy |
| public transport | operations | routes and integration |
| water | losses and billing | tariff and connections |
| power | availability and efficiency | dispatch and system demand |
Illustrative analytical structure; verified project and jurisdiction evidence governs.
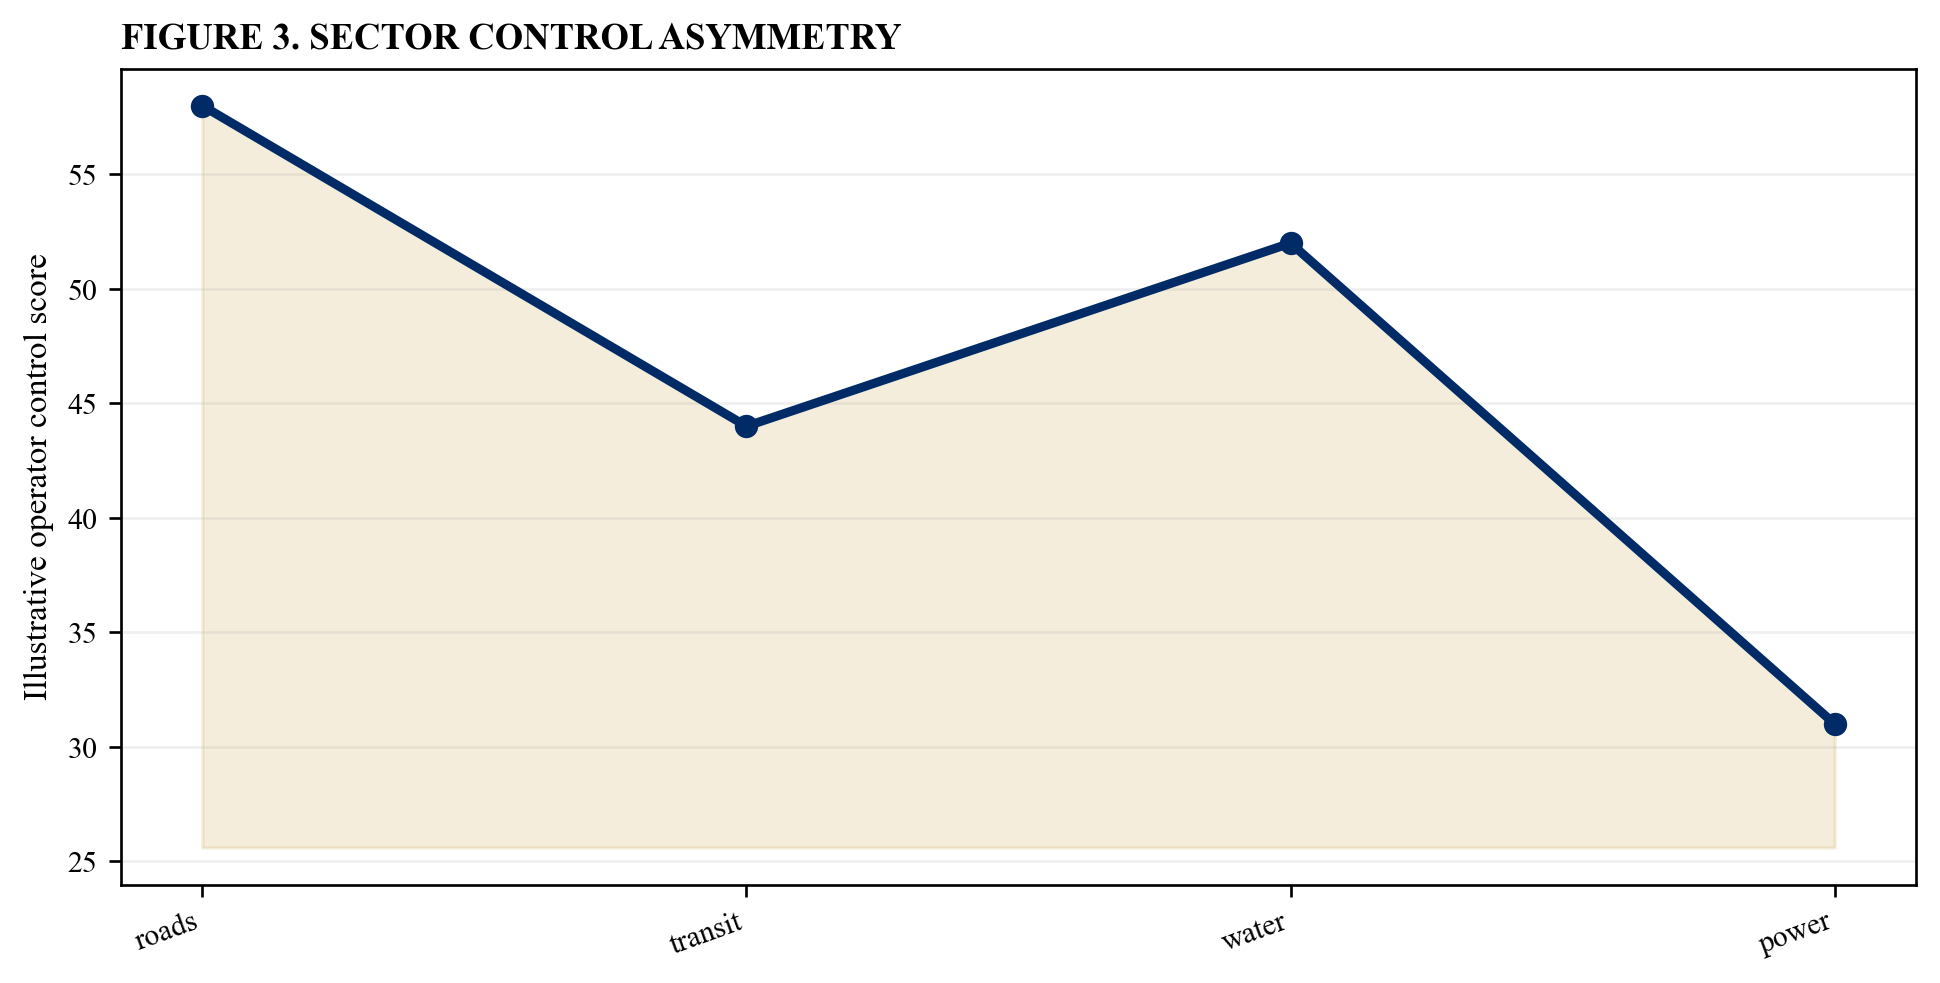
Illustrative analytical scenario; verified project evidence should replace values.
29. Build the integrated revenue model
The project team should connect demand drivers, tariffs, collection, availability, deductions, support and payment timing. The required output is a lender-grade revenue model. Record the relevant demand driver, responsible party, evidence, control right, cash-flow consequence, approval and review date [9][12].
Test the allocation against historical data, independent forecasts, observed user behaviour, service standards, tariff authority, network decisions, competing facilities, collection evidence, affordability, lender requirements and applicable law. Separate influence from mere exposure and preserve source dates and limitations.
The principal risk is that separate demand and financing models can produce inconsistent cash flow. Quantify effects on usage, price, collections, revenue, operating cost, debt-service coverage, equity returns, contingent public liabilities and user affordability. Compare the proposed allocation with credible user-pay, availability and shared-risk alternatives.
Translate the conclusion into forecast assumptions, payment terms, performance standards, support instruments, financing terms, monitoring triggers, relief and termination provisions. Refresh it when economic conditions, policy, tariffs, networks, competing capacity, technology or user behaviour changes.
30. Stress correlated downside
The project team should combine ramp-up delay, tariff restraint, weak economy, competition, collection losses and higher costs. The required output is a correlated stress matrix. Record the relevant demand driver, responsible party, evidence, control right, cash-flow consequence, approval and review date [9][34].
Test the allocation against historical data, independent forecasts, observed user behaviour, service standards, tariff authority, network decisions, competing facilities, collection evidence, affordability, lender requirements and applicable law. Separate influence from mere exposure and preserve source dates and limitations.
The principal risk is that single-variable sensitivities can understate plausible cash-flow compression. Quantify effects on usage, price, collections, revenue, operating cost, debt-service coverage, equity returns, contingent public liabilities and user affordability. Compare the proposed allocation with credible user-pay, availability and shared-risk alternatives.
Translate the conclusion into forecast assumptions, payment terms, performance standards, support instruments, financing terms, monitoring triggers, relief and termination provisions. Refresh it when economic conditions, policy, tariffs, networks, competing capacity, technology or user behaviour changes.
31. Size debt to controllable cash flow
The project team should distinguish contracted base, volatile upside, guarantee coverage and residual demand exposure. The required output is a debt-capacity bridge. Record the relevant demand driver, responsible party, evidence, control right, cash-flow consequence, approval and review date [8][24].
Test the allocation against historical data, independent forecasts, observed user behaviour, service standards, tariff authority, network decisions, competing facilities, collection evidence, affordability, lender requirements and applicable law. Separate influence from mere exposure and preserve source dates and limitations.
The principal risk is that leverage can be sized to revenue that disappears before operating costs adjust. Quantify effects on usage, price, collections, revenue, operating cost, debt-service coverage, equity returns, contingent public liabilities and user affordability. Compare the proposed allocation with credible user-pay, availability and shared-risk alternatives.
Translate the conclusion into forecast assumptions, payment terms, performance standards, support instruments, financing terms, monitoring triggers, relief and termination provisions. Refresh it when economic conditions, policy, tariffs, networks, competing capacity, technology or user behaviour changes.
Table 4. Illustrative downside bridge
| Item | Base index | Downside index |
|---|---|---|
| usage | 100 | 78 |
| tariff and collection | 100 | 92 |
| net revenue | 100 | 72 |
| cash for debt service | 100 | 63 |
Illustrative analytical structure; verified project and jurisdiction evidence governs.
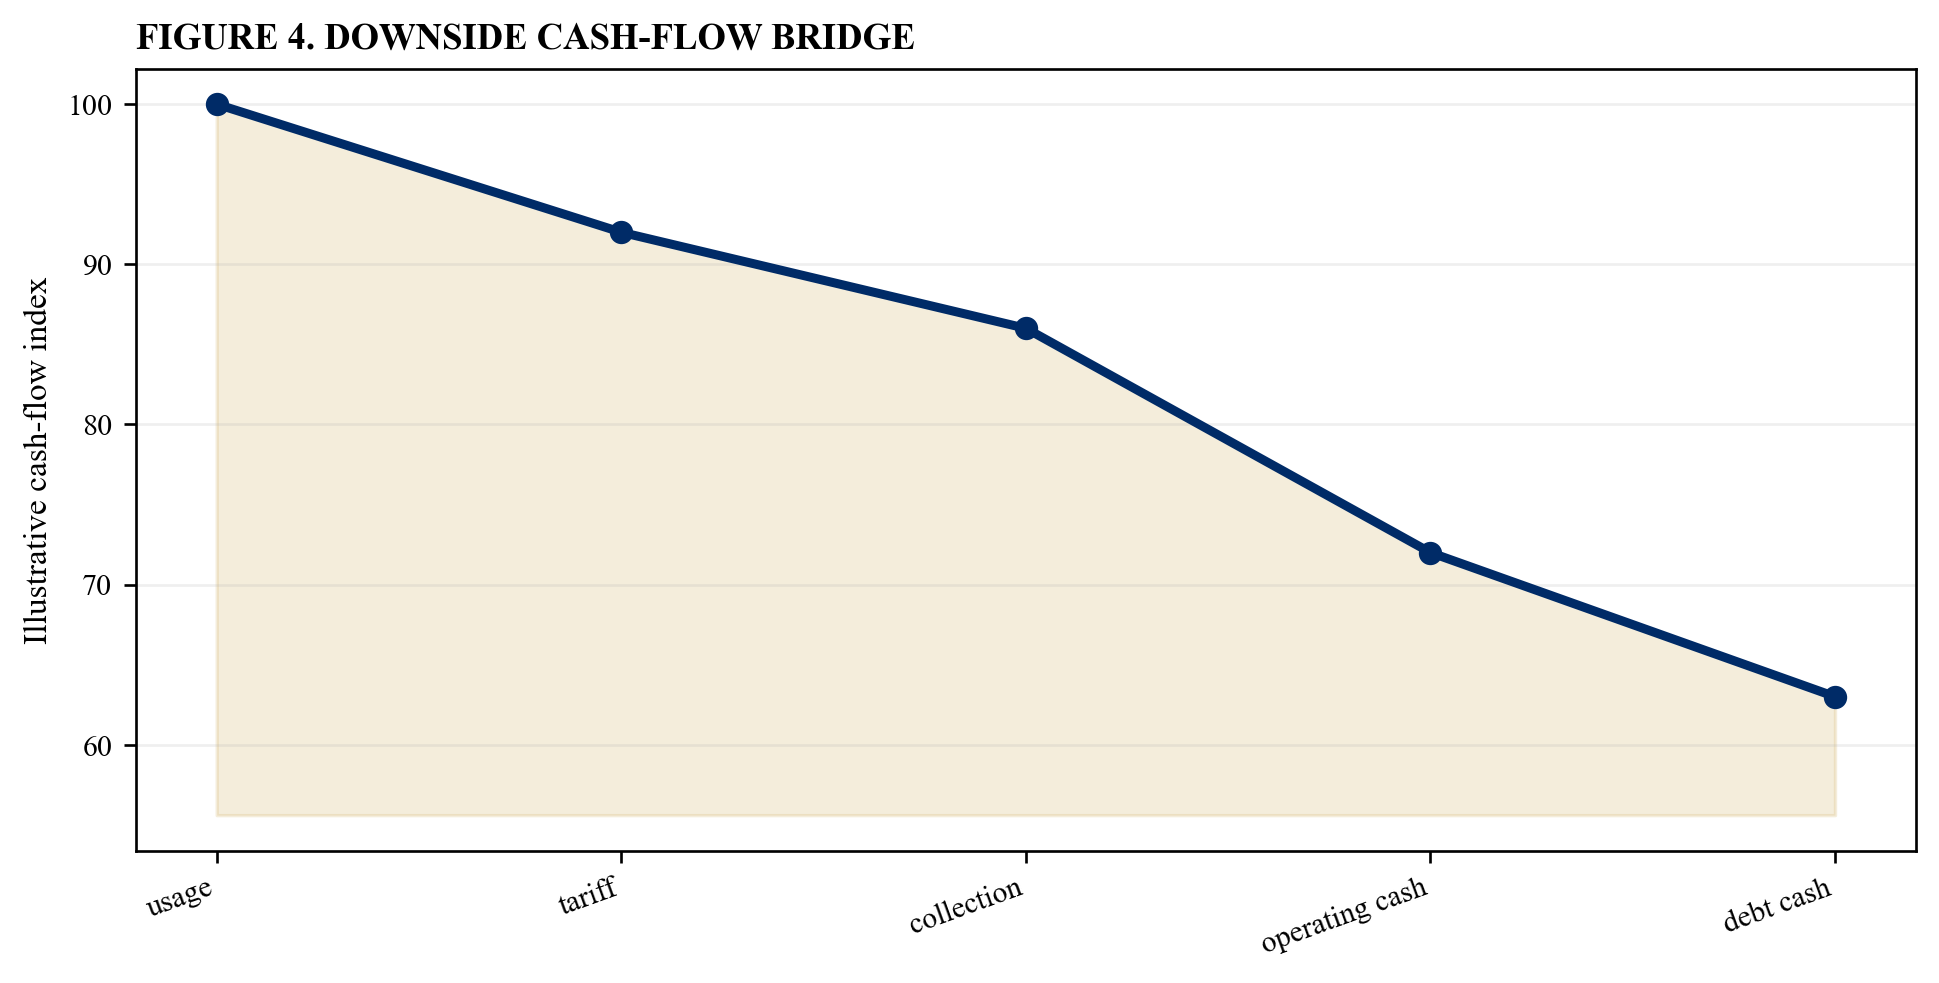
Illustrative analytical scenario; verified project evidence should replace values.
32. Price retained and transferred risk
The project team should compare risk premium, contingent support, reserve, insurance, liquidity and public borrowing effects. The required output is a whole-life risk-price comparison. Record the relevant demand driver, responsible party, evidence, control right, cash-flow consequence, approval and review date [1][8].
Test the allocation against historical data, independent forecasts, observed user behaviour, service standards, tariff authority, network decisions, competing facilities, collection evidence, affordability, lender requirements and applicable law. Separate influence from mere exposure and preserve source dates and limitations.
The principal risk is that headline risk transfer can cost more than the risk retained by government. Quantify effects on usage, price, collections, revenue, operating cost, debt-service coverage, equity returns, contingent public liabilities and user affordability. Compare the proposed allocation with credible user-pay, availability and shared-risk alternatives.
Translate the conclusion into forecast assumptions, payment terms, performance standards, support instruments, financing terms, monitoring triggers, relief and termination provisions. Refresh it when economic conditions, policy, tariffs, networks, competing capacity, technology or user behaviour changes.
33. Record fiscal commitments
The project team should measure availability payments, guarantees, subsidies, termination exposure and downside calls. The required output is a fiscal-risk statement. Record the relevant demand driver, responsible party, evidence, control right, cash-flow consequence, approval and review date [27][31].
Test the allocation against historical data, independent forecasts, observed user behaviour, service standards, tariff authority, network decisions, competing facilities, collection evidence, affordability, lender requirements and applicable law. Separate influence from mere exposure and preserve source dates and limitations.
The principal risk is that support can remain invisible until a demand shock triggers payment. Quantify effects on usage, price, collections, revenue, operating cost, debt-service coverage, equity returns, contingent public liabilities and user affordability. Compare the proposed allocation with credible user-pay, availability and shared-risk alternatives.
Translate the conclusion into forecast assumptions, payment terms, performance standards, support instruments, financing terms, monitoring triggers, relief and termination provisions. Refresh it when economic conditions, policy, tariffs, networks, competing capacity, technology or user behaviour changes.
34. Set rebasing and review rules
The project team should define data windows, objective triggers, independent review, parameter changes and prospective application. The required output is a demand-rebasing protocol. Record the relevant demand driver, responsible party, evidence, control right, cash-flow consequence, approval and review date [2][29].
Test the allocation against historical data, independent forecasts, observed user behaviour, service standards, tariff authority, network decisions, competing facilities, collection evidence, affordability, lender requirements and applicable law. Separate influence from mere exposure and preserve source dates and limitations.
The principal risk is that unstructured renegotiation can reward forecast error and erode procurement integrity. Quantify effects on usage, price, collections, revenue, operating cost, debt-service coverage, equity returns, contingent public liabilities and user affordability. Compare the proposed allocation with credible user-pay, availability and shared-risk alternatives.
Translate the conclusion into forecast assumptions, payment terms, performance standards, support instruments, financing terms, monitoring triggers, relief and termination provisions. Refresh it when economic conditions, policy, tariffs, networks, competing capacity, technology or user behaviour changes.
35. Protect against strategic behaviour
The project team should test demand suppression, deferred maintenance, tariff gaming, reclassification and support maximisation. The required output is an anti-gaming control set. Record the relevant demand driver, responsible party, evidence, control right, cash-flow consequence, approval and review date [19][25].
Test the allocation against historical data, independent forecasts, observed user behaviour, service standards, tariff authority, network decisions, competing facilities, collection evidence, affordability, lender requirements and applicable law. Separate influence from mere exposure and preserve source dates and limitations.
The principal risk is that payment structures can create incentives to influence measurement rather than service. Quantify effects on usage, price, collections, revenue, operating cost, debt-service coverage, equity returns, contingent public liabilities and user affordability. Compare the proposed allocation with credible user-pay, availability and shared-risk alternatives.
Translate the conclusion into forecast assumptions, payment terms, performance standards, support instruments, financing terms, monitoring triggers, relief and termination provisions. Refresh it when economic conditions, policy, tariffs, networks, competing capacity, technology or user behaviour changes.
36. Build transparent monitoring data
The project team should assign meters, counters, audits, data access, reconciliation, privacy and reporting. The required output is a demand-data architecture. Record the relevant demand driver, responsible party, evidence, control right, cash-flow consequence, approval and review date [20][22].
Test the allocation against historical data, independent forecasts, observed user behaviour, service standards, tariff authority, network decisions, competing facilities, collection evidence, affordability, lender requirements and applicable law. Separate influence from mere exposure and preserve source dates and limitations.
The principal risk is that risk allocation becomes unenforceable when parties cannot verify usage and its drivers. Quantify effects on usage, price, collections, revenue, operating cost, debt-service coverage, equity returns, contingent public liabilities and user affordability. Compare the proposed allocation with credible user-pay, availability and shared-risk alternatives.
Translate the conclusion into forecast assumptions, payment terms, performance standards, support instruments, financing terms, monitoring triggers, relief and termination provisions. Refresh it when economic conditions, policy, tariffs, networks, competing capacity, technology or user behaviour changes.
37. Define early-warning triggers
The project team should monitor forecast error, elasticity drift, competition, affordability, collections and covenant headroom. The required output is an early-warning dashboard. Record the relevant demand driver, responsible party, evidence, control right, cash-flow consequence, approval and review date [12][33].
Test the allocation against historical data, independent forecasts, observed user behaviour, service standards, tariff authority, network decisions, competing facilities, collection evidence, affordability, lender requirements and applicable law. Separate influence from mere exposure and preserve source dates and limitations.
The principal risk is that intervention can arrive after liquidity and lender confidence have already failed. Quantify effects on usage, price, collections, revenue, operating cost, debt-service coverage, equity returns, contingent public liabilities and user affordability. Compare the proposed allocation with credible user-pay, availability and shared-risk alternatives.
Translate the conclusion into forecast assumptions, payment terms, performance standards, support instruments, financing terms, monitoring triggers, relief and termination provisions. Refresh it when economic conditions, policy, tariffs, networks, competing capacity, technology or user behaviour changes.
38. Align relief and termination
The project team should connect extraordinary demand events to temporary relief, support, restructuring and termination formulae. The required output is a demand-relief ladder. Record the relevant demand driver, responsible party, evidence, control right, cash-flow consequence, approval and review date [7][23].
Test the allocation against historical data, independent forecasts, observed user behaviour, service standards, tariff authority, network decisions, competing facilities, collection evidence, affordability, lender requirements and applicable law. Separate influence from mere exposure and preserve source dates and limitations.
The principal risk is that every downturn can become an improvised renegotiation or default dispute. Quantify effects on usage, price, collections, revenue, operating cost, debt-service coverage, equity returns, contingent public liabilities and user affordability. Compare the proposed allocation with credible user-pay, availability and shared-risk alternatives.
Translate the conclusion into forecast assumptions, payment terms, performance standards, support instruments, financing terms, monitoring triggers, relief and termination provisions. Refresh it when economic conditions, policy, tariffs, networks, competing capacity, technology or user behaviour changes.
39. Test procurement comparability
The project team should standardise forecast data, bidder assumptions, risk bands, support and evaluation metrics. The required output is a bid-comparison protocol. Record the relevant demand driver, responsible party, evidence, control right, cash-flow consequence, approval and review date [2][10].
Test the allocation against historical data, independent forecasts, observed user behaviour, service standards, tariff authority, network decisions, competing facilities, collection evidence, affordability, lender requirements and applicable law. Separate influence from mere exposure and preserve source dates and limitations.
The principal risk is that bids can appear cheap because they rely on incompatible demand assumptions. Quantify effects on usage, price, collections, revenue, operating cost, debt-service coverage, equity returns, contingent public liabilities and user affordability. Compare the proposed allocation with credible user-pay, availability and shared-risk alternatives.
Translate the conclusion into forecast assumptions, payment terms, performance standards, support instruments, financing terms, monitoring triggers, relief and termination provisions. Refresh it when economic conditions, policy, tariffs, networks, competing capacity, technology or user behaviour changes.
40. Issue the demand-risk certificate
The project team should reconcile evidence, controls, payment model, affordability, financing, fiscal exposure and monitoring. The required output is an auditable demand-risk certificate. Record the relevant demand driver, responsible party, evidence, control right, cash-flow consequence, approval and review date [1][4].
Test the allocation against historical data, independent forecasts, observed user behaviour, service standards, tariff authority, network decisions, competing facilities, collection evidence, affordability, lender requirements and applicable law. Separate influence from mere exposure and preserve source dates and limitations.
The principal risk is that approval can rely on a risk label without proving who controls each demand driver. Quantify effects on usage, price, collections, revenue, operating cost, debt-service coverage, equity returns, contingent public liabilities and user affordability. Compare the proposed allocation with credible user-pay, availability and shared-risk alternatives.
Translate the conclusion into forecast assumptions, payment terms, performance standards, support instruments, financing terms, monitoring triggers, relief and termination provisions. Refresh it when economic conditions, policy, tariffs, networks, competing capacity, technology or user behaviour changes.
Table 5. Demand-risk certificate
| Decision | Evidence | Owner |
|---|---|---|
| forecast | validated baseline | commercial |
| control | driver matrix | authority and operator |
| payment | risk-aligned structure | legal and finance |
| resilience | stress and monitoring | lenders and government |
Illustrative analytical structure; verified project and jurisdiction evidence governs.
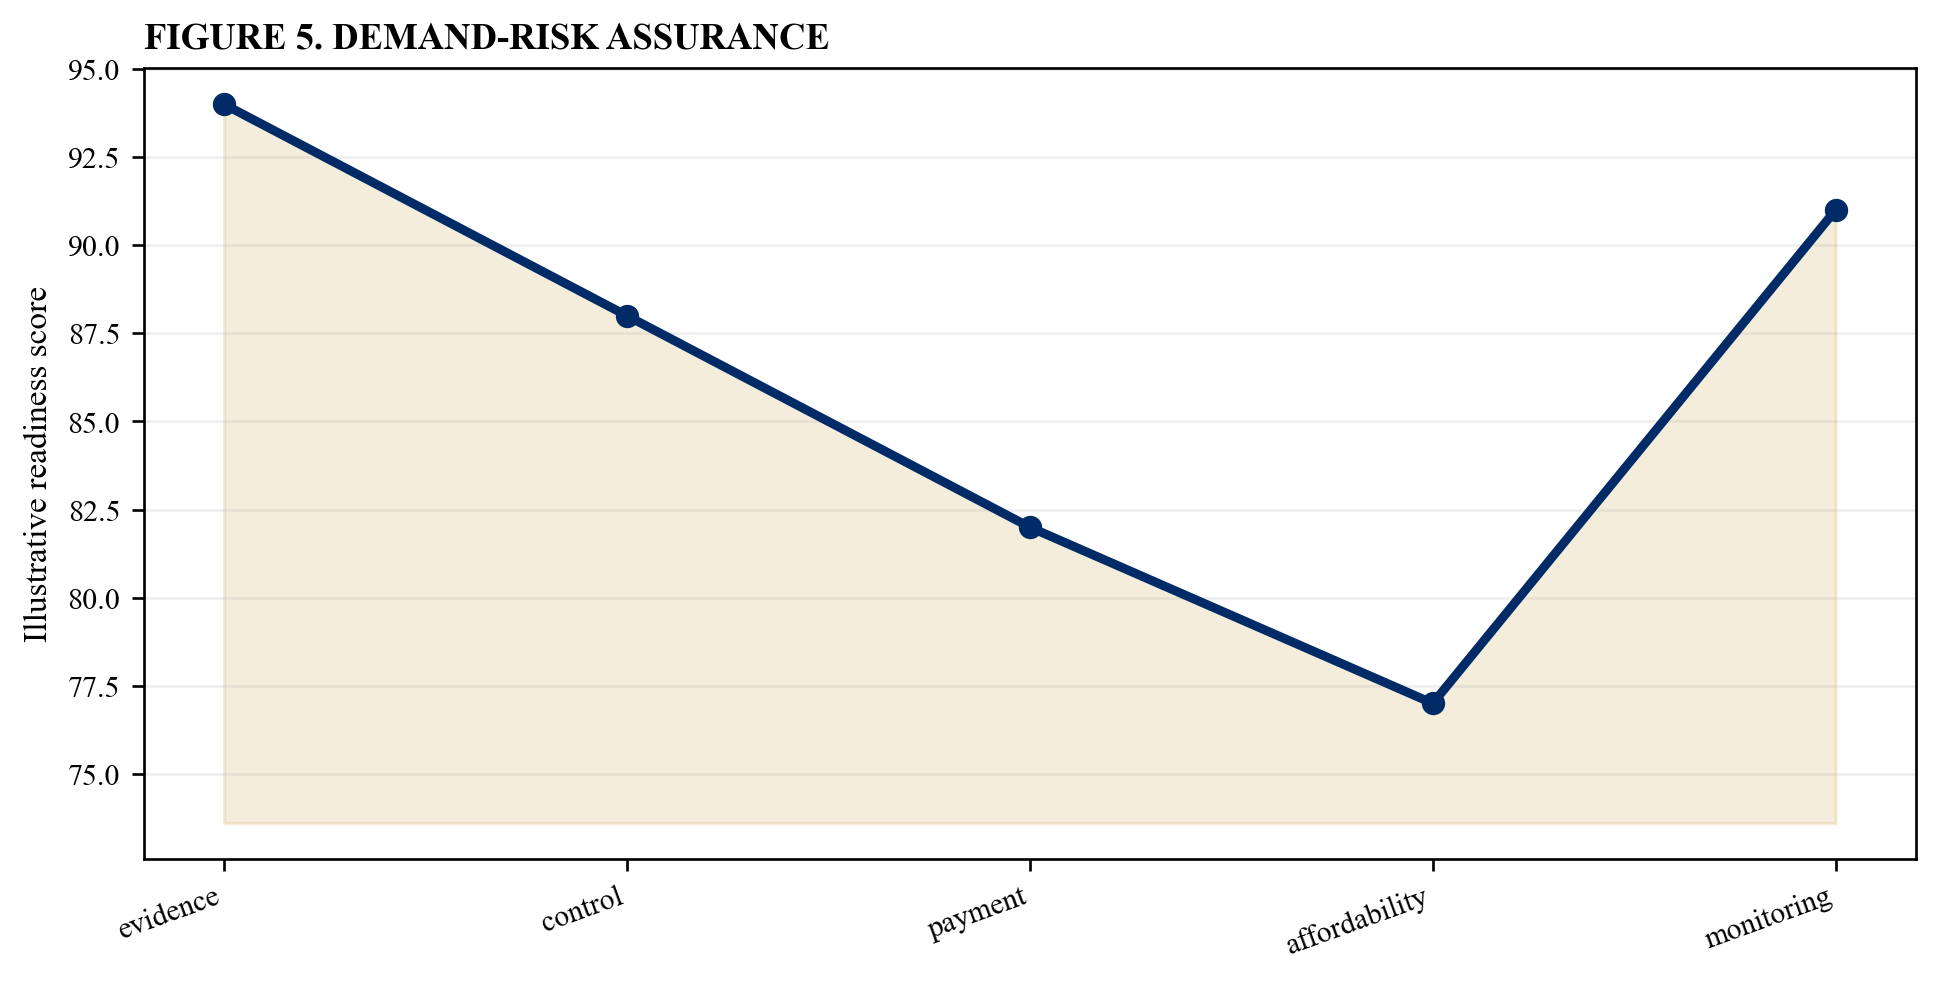
Illustrative analytical scenario; verified project evidence should replace values.
References
- World Bank Group, PPP Reference Guide Version 3, https://ppp.worldbank.org/sites/default/files/2024-08/PPP%20Reference%20Guide%20Version%203.pdf
- World Bank PPP Resource Center, PPP Process, https://ppp.worldbank.org/ppp-process
- World Bank PPP Resource Center, Structuring the PPP Contract, https://ppp.worldbank.org/structuring-ppp-contract
- World Bank PPP Resource Center, Payment Mechanism, https://ppp.worldbank.org/payment-mechanism
- World Bank PPP Resource Center, Roads, Tolls and Bridges, https://ppp.worldbank.org/public-private-partnership/sector/transportation/roads-tolls-bridges
- ADB, EBRD, IDB, IsDB and World Bank Group, PPP Certification Guide, https://ppp-certification.com/ppp-certification-guide/about-ppp-guide
- World Bank PPP Resource Center, Risk Allocation, https://ppp.worldbank.org/risk-allocation
- World Bank PPP Resource Center, Government Support, https://ppp.worldbank.org/government-support
- International Monetary Fund, P-FRAM, https://www.imf.org/external/np/fad/publicinvestment/
- World Bank Group, Guidance on PPP Contractual Provisions, https://ppp.worldbank.org/sites/default/files/2024-07/Guidance_%20PPP_Contractual_Provisions_EN_2017.pdf
- OECD, Principles for Public Governance of Public-Private Partnerships, https://www.oecd.org/gov/budgeting/oecd-principles-for-public-governance-of-public-private-partnerships.htm
- European Investment Bank, EPEC Guide to Guidance, https://www.eib.org/epec/g2g/index.htm
- UK Department for Transport, Transport Analysis Guidance, https://www.gov.uk/guidance/transport-analysis-guidance-tag
- World Bank PPP Resource Center, Tariff Setting and Indexation, https://ppp.worldbank.org/payment-mechanism
- UK Competition and Markets Authority, Market Studies and Investigations, https://www.gov.uk/government/collections/markets-work
- World Bank PPP Resource Center, Identifying Risks, https://ppp.worldbank.org/identifying-risks
- World Bank PPP Resource Center, Railways, https://ppp.worldbank.org/sector/transportation/railways
- World Bank PPP Resource Center, Power Purchase Agreements, https://ppp.worldbank.org/sector/energy/energy-power-agreements/power-purchase-agreements
- World Bank PPP Resource Center, Performance Requirements, https://ppp.worldbank.org/designing-ppp-contracts
- International Organization for Standardization, ISO 55001 Asset Management, https://www.iso.org/standard/83054.html
- World Bank PPP Resource Center, Water and Sanitation, https://ppp.worldbank.org/sector/water-sanitation
- International Benchmarking Network for Water and Sanitation Utilities, https://www.ib-net.org/
- World Bank PPP Resource Center, PPP Contract Types and Terminology, https://ppp.worldbank.org/ppp-contract-types-and-terminology
- World Bank PPP Resource Center, Availability Payments, https://ppp.worldbank.org/payment-mechanism
- Global Partnership for Results-Based Approaches, https://www.gprba.org/
- World Bank PPP Resource Center, Translating Risk Allocation into Contract Structure, https://ppp.worldbank.org/translating-risk-allocation-contract-structure
- World Bank, PPP Fiscal Risk Assessment Model, https://www.worldbank.org/en/topic/publicprivatepartnerships
- World Bank PPP Resource Center, Toll Road Concessions, https://ppp.worldbank.org/public-private-partnership/sector/transportation/roads-tolls-bridges
- International Transport Forum, Infrastructure Investment and PPPs, https://www.itf-oecd.org/
- World Bank, Affordability and Sustainable Infrastructure, https://www.worldbank.org/en/topic/infrastructure
- IMF, Fiscal Transparency Code, https://www.imf.org/external/np/fad/trans/
- World Bank PPP Resource Center, Water Tariffs and Indexation, https://ppp.worldbank.org/sector/water-sanitation
- International Energy Agency, Electricity Market Report, https://www.iea.org/reports/electricity-market-report-2025
- International Monetary Fund, World Economic Outlook, https://www.imf.org/en/Publications/WEO
- OECD, Infrastructure and Technological Change, https://www.oecd.org/en/topics/infrastructure.html
- International Energy Agency, World Energy Outlook, https://www.iea.org/reports/world-energy-outlook-2024
- International Energy Agency, Net Zero Roadmap, https://www.iea.org/reports/net-zero-roadmap-a-global-pathway-to-keep-the-15-0c-goal-in-reach
- World Bank PPP Resource Center, Transport, https://ppp.worldbank.org/sector/transportation
- World Bank PPP Risk Allocation Tool: Water and Waste, https://ppp.worldbank.org/library/ppp-risk-allocation-tool-2019-edition-water-and-waste
- World Bank PPP Resource Center, Risk Matrix for Power Generation, https://ppp.worldbank.org/energy-and-power/risk-matrix-power-generation
