

1. Make the equity-value question operational
An exit plan becomes useful when management can explain how this week's operating decisions affect the cash flows, risks and evidence that a future buyer may evaluate. A board cannot manage an exit multiple directly. It can manage customer outcomes, pricing, delivery, productivity, working capital, capital intensity, control quality, resilience and the credibility of its forecasts. The exit value bridge connects those controllable drivers to the valuation case without pretending that market pricing is controllable.
The bridge begins with the operating baseline. It identifies a limited number of economic mechanisms: acquiring profitable demand, retaining customers, improving price realisation, increasing throughput, reducing failure cost, releasing cash, allocating capital and protecting critical services. Each mechanism has an operational signal, a financial consequence, a risk adjustment and an evidence requirement.
The bridge then reconciles enterprise value to equity value. Enterprise value may reflect maintainable cash flow, growth, risk and market evidence. Equity value also depends on net debt, debt-like items, cash-like items, working-capital adjustments, transaction costs, dilution and other deal-specific terms. A higher operating result can therefore coexist with lower equity proceeds when cash conversion weakens, debt rises or exit adjustments expand.
The board should use the bridge as a decision system. Every weekly metric needs a definition, source, owner, control, financial linkage and action threshold. Every valuation assumption needs an operating explanation, sensitivity and evidence status. The result is a chain from event to decision, rather than a dashboard of loosely related indicators.
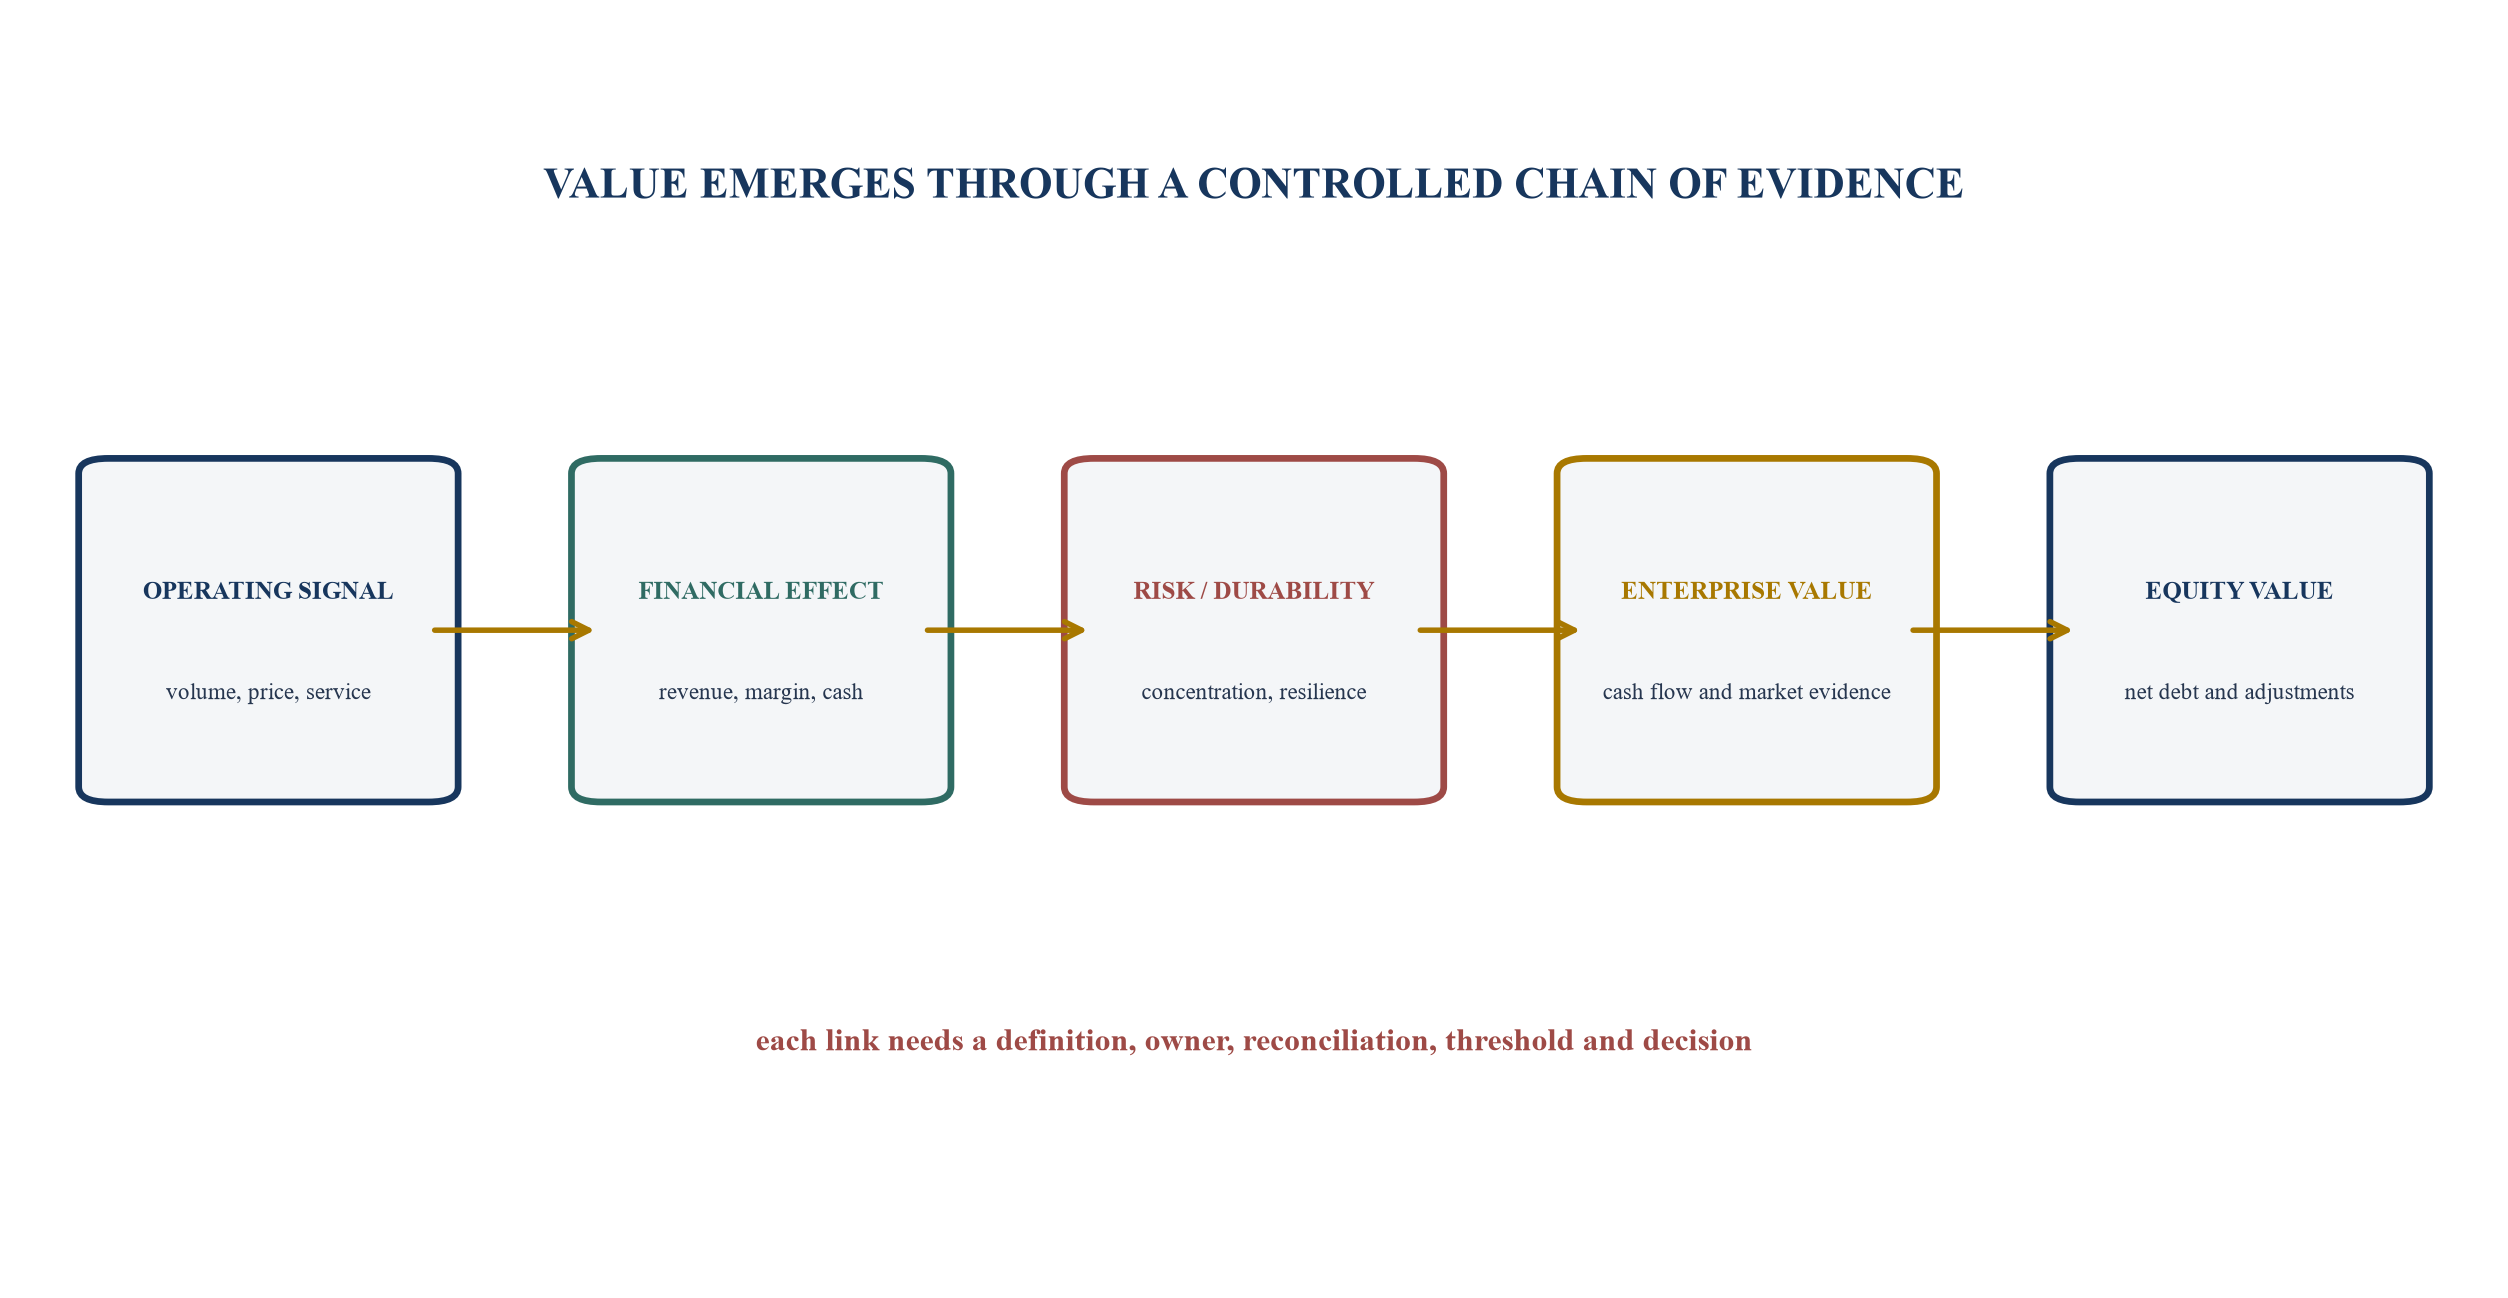
Operating signals affect value through financial outcomes, risk, evidence and transaction adjustments.
2. Separate enterprise value from equity value
Enterprise value and equity value answer different questions. Enterprise value commonly represents the value of the operating business available to providers of capital. Equity value represents the residual attributable to shareholders after the transaction-specific treatment of debt, cash and other adjustments. The bridge should show both views and the reconciliation between them.
A market approach may apply a multiple to a maintainable performance measure. An income approach may convert expected cash flows into a present value. International Valuation Standards organise valuation work around the basis of value, data and inputs, approaches, models, documentation and reporting. IFRS 13 describes fair value as an exit price based on assumptions that market participants would use under current market conditions. These frameworks require judgement; neither supports a weekly mark-to-model based on a single operational result.
The enterprise-value case should identify the measure being capitalised, the period, the accounting or management basis, the normalisations, the growth and risk assumptions, and the evidence supporting any multiple or discount rate. If management uses adjusted EBITDA, annual recurring revenue, contracted backlog or another measure, the bridge should define it and reconcile it to the accounting records.
The equity-value reconciliation should then identify drawn debt, accrued interest, leases where relevant to the chosen convention, factoring or receivables financing, shareholder instruments, restricted cash, excess cash, unpaid transaction bonuses, tax exposures, provisions, deferred consideration and working-capital mechanics. The treatment is transaction-specific. Labelling an item as debt-like or cash-like requires facts, negotiated terms and qualified advice.
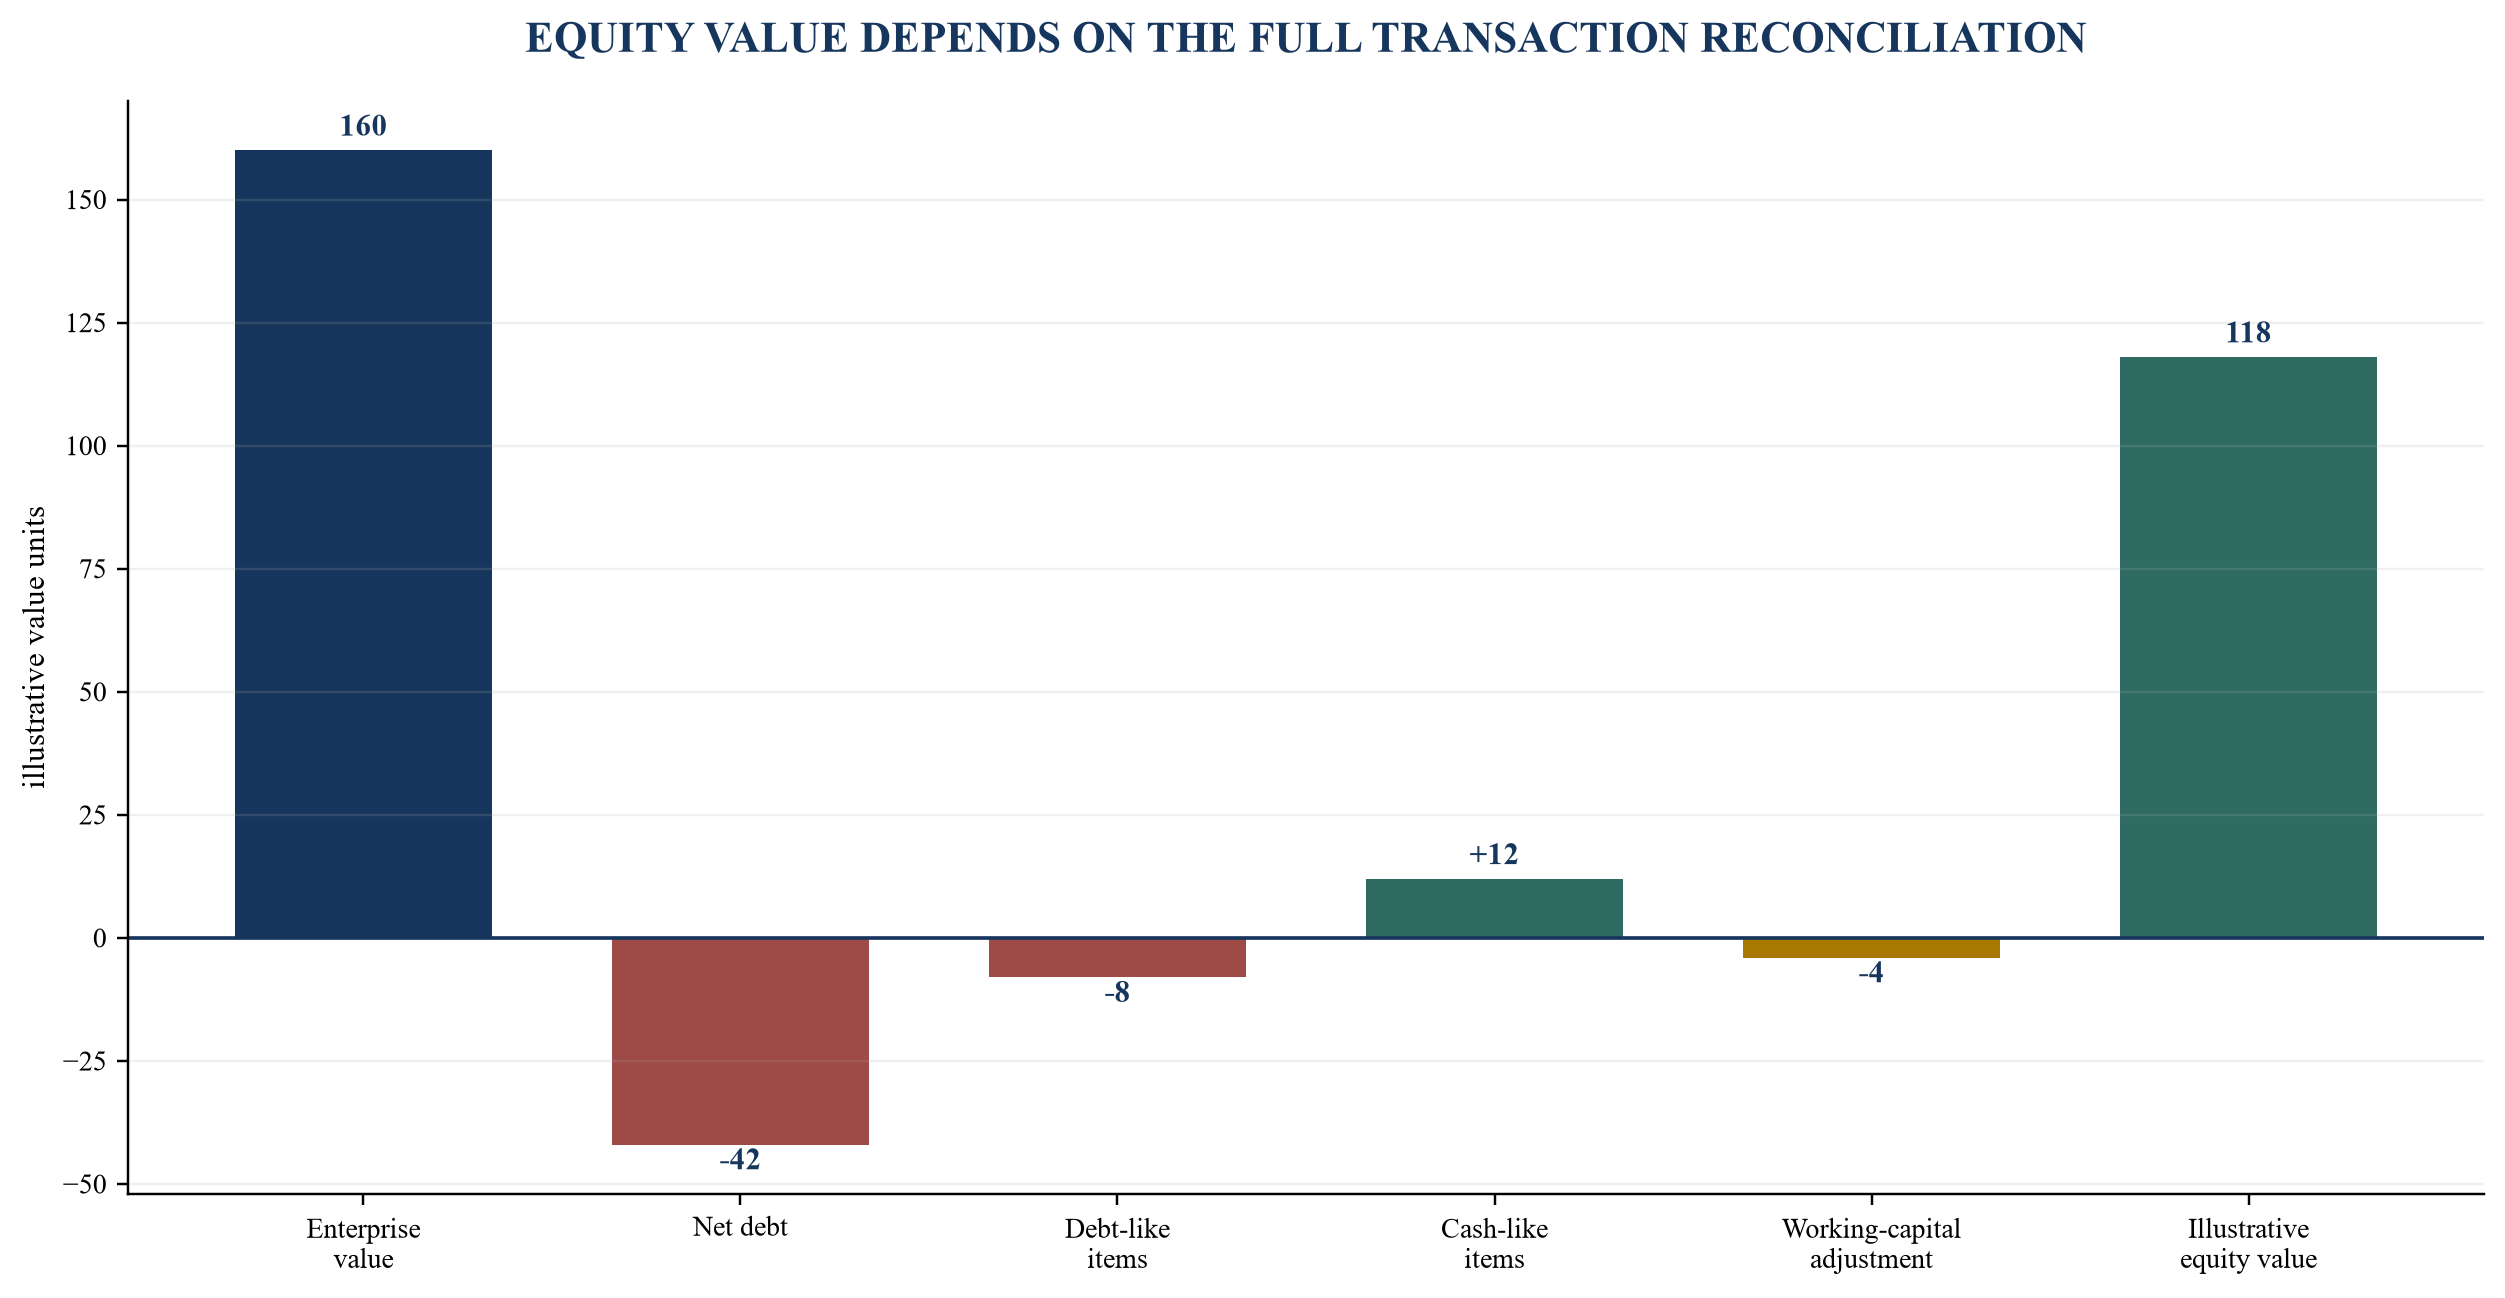
Values are hypothetical management assumptions and do not represent a valuation or transaction outcome.
3. Treat weekly metrics as signals, not valuations
Weekly information has value because it shortens the interval between an operating event and a management response. It can reveal conversion decline, churn risk, production loss, delayed billing, supplier failure or cash leakage before those effects appear in monthly financial statements. Its speed also creates hazards: incomplete cut-offs, seasonality, cohort noise, manual adjustments and unstable definitions.
A weekly metric should therefore be classified as an observation, estimate or controlled financial measure. An observation records an event such as orders received, units shipped or incidents opened. An estimate applies judgement, for example expected completion or customer lifetime value. A controlled financial measure reconciles to the ledger or another governed source under a defined process. The board should understand the status before relying on the number.
The SEC's guidance on key performance indicators asks issuers to consider definitions, calculation methods, reasons the metric is useful, how management uses it and estimates or assumptions underlying it. ESMA's alternative-performance-measure guidance emphasises labels, definitions, reconciliation, explanation and consistency. ASIC similarly addresses clear disclosure of non-IFRS information. These are public-market disclosure frameworks, yet their control logic is useful inside a private-company value bridge.
Frequency should follow decision velocity. Sales pipeline may require daily or weekly review. Customer retention may be more meaningful by cohort or renewal cycle. Working capital can use weekly ageing and cash forecasts. Valuation assumptions may require monthly or quarterly review and an independent governance process. Faster reporting should improve action while preserving a stable basis for comparison.
Metric governance should also address changes in perimeter. Acquisitions, disposals, new sites, discontinued products, foreign-exchange translation and changes in customer or product classification can make current and comparative periods inconsistent. The metric charter should state whether historical periods are restated, shown on a reported basis, or supplemented with a like-for-like view. The board should see the reconciliation between them.
Incentives create another control requirement. A measure used for bonus, covenant, valuation or transaction purposes carries a higher risk of bias than a diagnostic measure used to locate a process problem. Finance and the relevant control functions should determine the review, approval and retention standard according to that risk. Manual overrides should remain visible, attributable and time-stamped.
The bridge should also preserve negative evidence. Lost orders, failed pilots, customer concessions, forecast misses and control exceptions can improve future decisions when they remain in the record. Removing them from the dataset can make conversion, retention or productivity appear stronger while reducing the reliability of the valuation case.
Table 1. Metric charter for the exit value bridge
| field | board question | minimum evidence | common failure | accountable owner |
|---|---|---|---|---|
| purpose | which decision does this metric support? | named decision and threshold | reporting activity without action | operating executive |
| definition | what is included, excluded and timed? | written formula, population and cut-off | definition drift | finance and data owner |
| source | where does the observation originate? | system, field, lineage and access control | spreadsheet substitution | process owner |
| quality | how complete, accurate and timely is it? | reconciliation, exception rate and review | false precision | controller |
| value link | how can the signal affect cash flow or risk? | causal hypothesis and financial bridge | correlation presented as causation | value owner |
| action | what happens when the threshold is crossed? | owner, response, due date and escalation | persistent red status without decision | executive sponsor |
Every metric requires a controlled definition before it enters board or buyer materials.
4. Build one driver tree from demand to cash
The operating model should contain one reconciled driver tree rather than separate finance, sales and operations narratives. Revenue can be decomposed into addressable demand, opportunities, conversion, volume, price, product mix, fulfilment and returns. Gross profit adds input cost, yield, labour efficiency, logistics and service failure. Cash conversion adds billing, collections, inventory, supplier terms, tax and capital expenditure.
Each branch should identify leading and lagging measures. Qualified pipeline can lead bookings. Bookings can lead revenue subject to cancellation, delivery and recognition. Delivery reliability can lead retention. Retention can lead recurring revenue and cash. The lag between stages matters; a strong order week may consume working capital before it generates cash.
The driver tree should also separate stock and flow. Backlog is a stock at a point in time. Orders, revenue and collections are flows during a period. Mixing the two can double-count economic activity. A backlog increase caused by delivery failure has a different implication from an increase caused by new demand.
Management should test whether the tree reconciles to the statutory and management accounts. IFRS 15 governs revenue recognition through enforceable rights and performance obligations rather than sales enthusiasm. IAS 7 classifies operating, investing and financing cash flows. The bridge should preserve those accounting boundaries while offering additional operating detail.
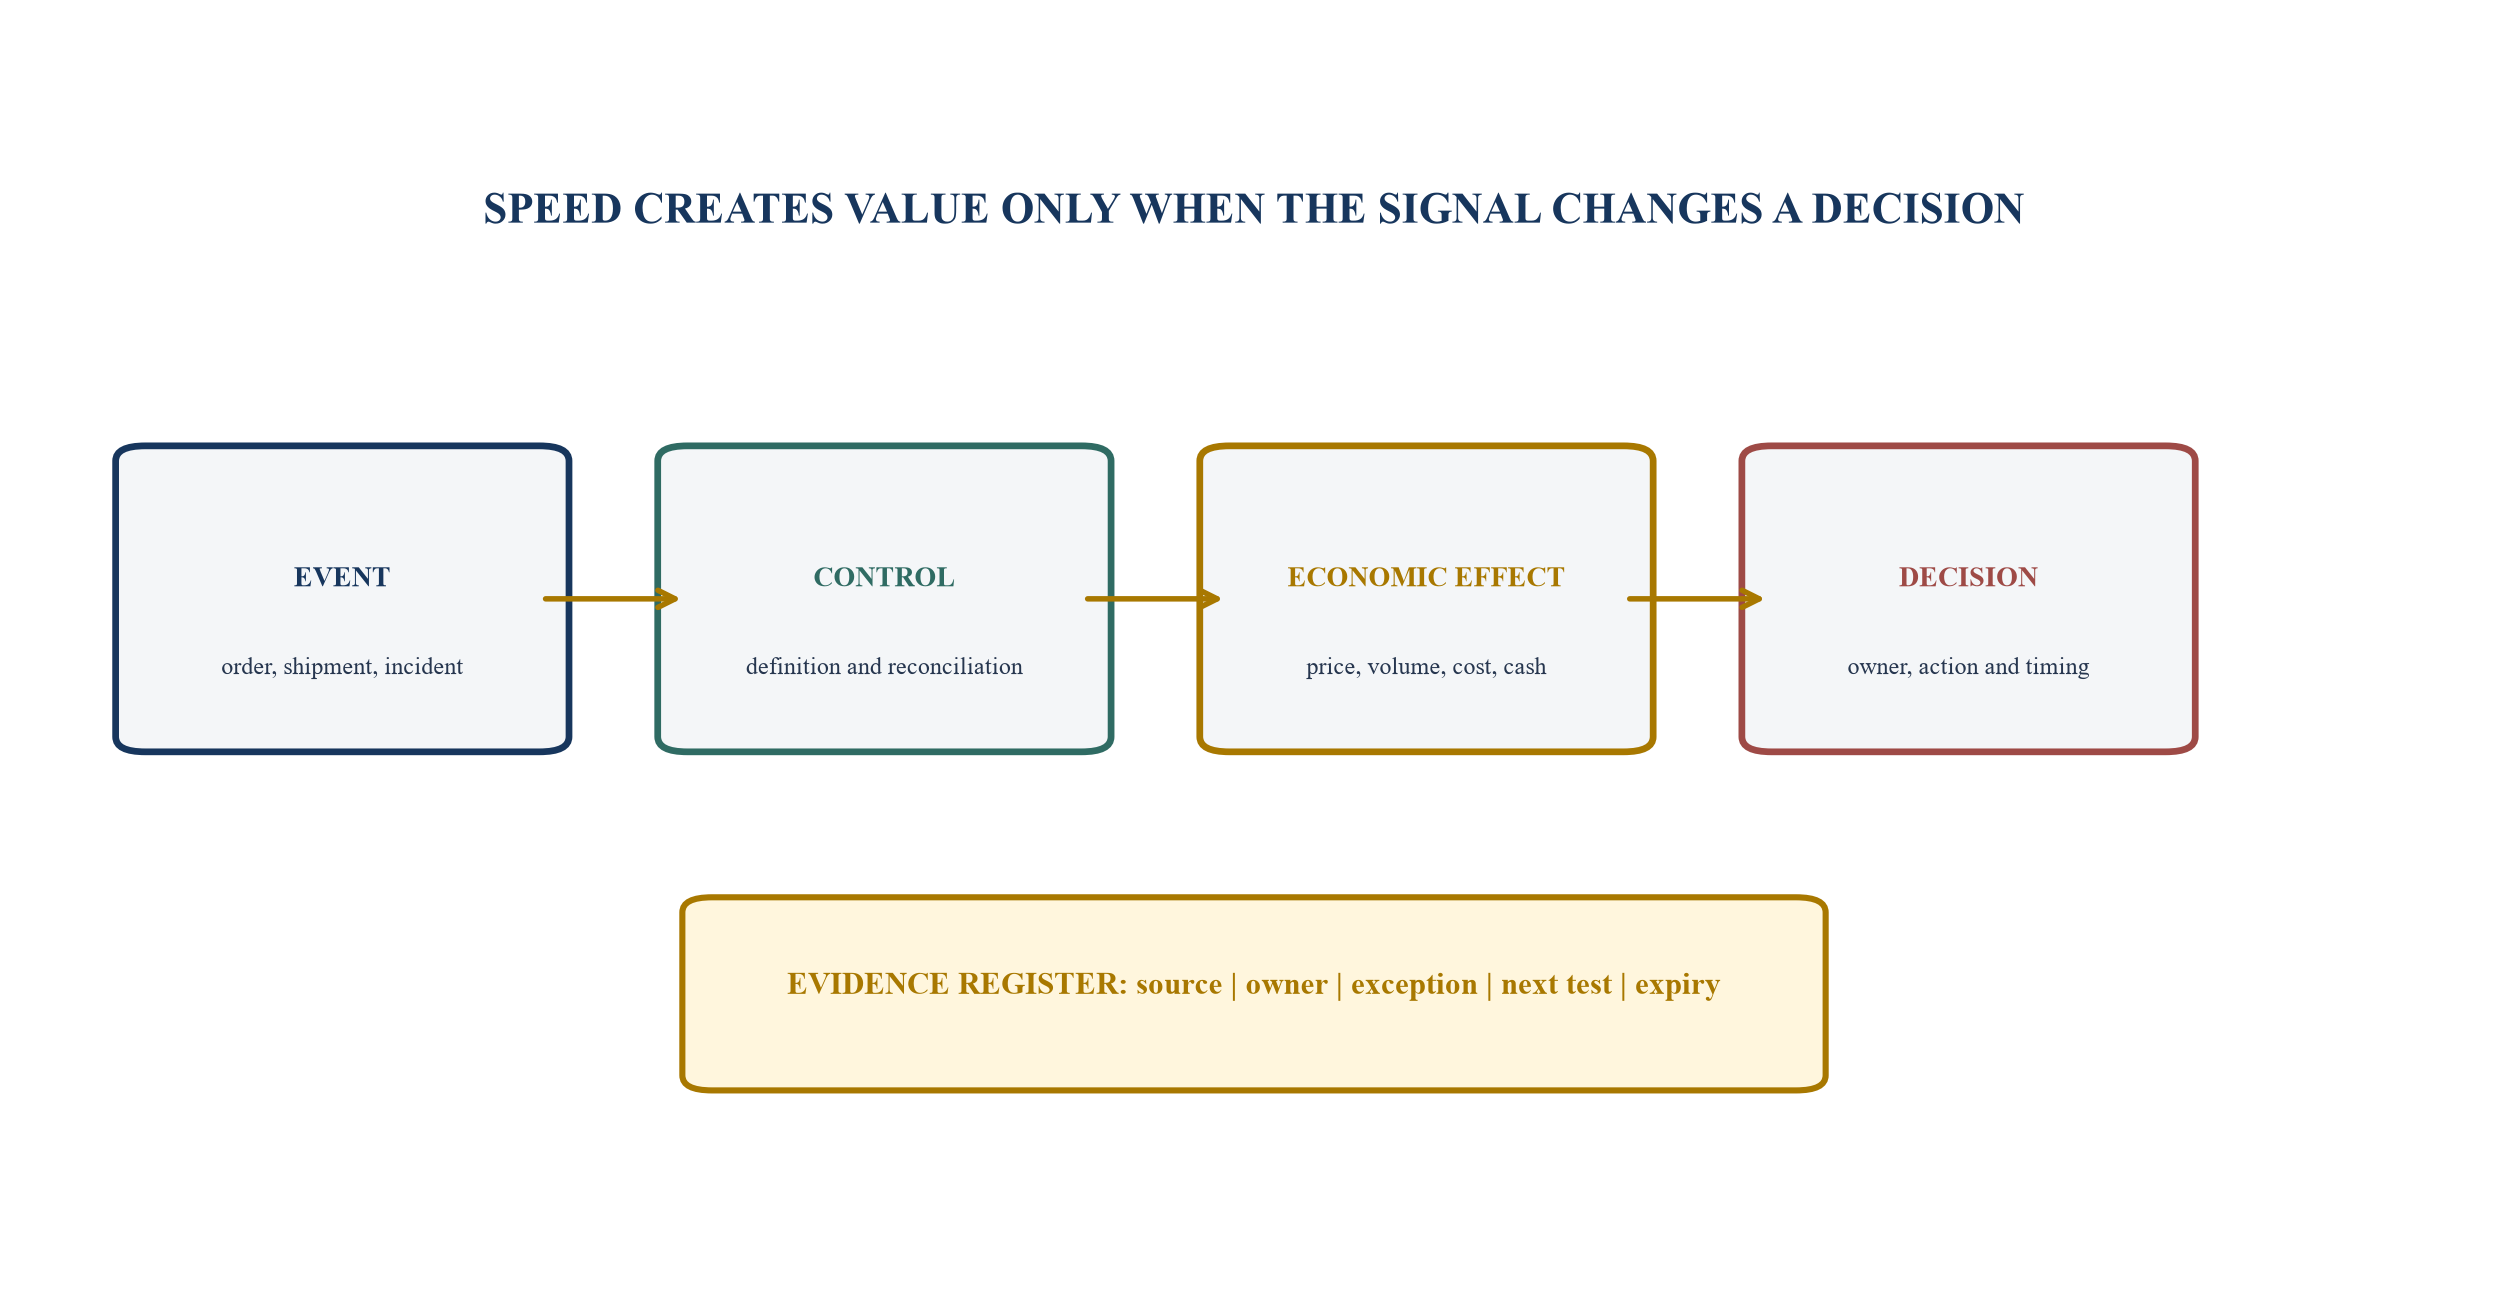
A weekly event becomes decision-grade only after definition, reconciliation and economic interpretation.
5. Measure revenue quality before revenue growth
Revenue growth can increase or reduce exit value depending on its quality. A buyer may test recurrence, retention, concentration, contractual protection, pricing power, gross margin, implementation burden, collection history and the investment required to sustain growth. The bridge should show these attributes beside the headline growth rate.
Recurring revenue requires a precise definition. Contracted recurring revenue differs from auto-renewing arrangements, repeat purchasing behaviour, consumption revenue and management estimates of annualised run rate. The bridge should show contract term, termination rights, minimum commitment, renewal date, usage risk and the reconciliation from contract population to recognised revenue.
Customer retention should be analysed through cohorts. Logo retention shows customer count. Gross revenue retention excludes expansion. Net revenue retention includes expansion and contraction. Each measure needs consistent currency, perimeter, acquisitions, disposals and cohort dates. Concentrated customers should be reviewed individually because one renewal can dominate the aggregate.
Growth should also be decomposed into price, volume, mix, new customers, expansion, churn and foreign exchange. A price increase that raises revenue while increasing churn or service obligations may have a different value consequence from an increase supported by product differentiation. Weekly signals should therefore connect to cohort economics and contribution margin.
Table 2. Revenue-quality bridge
| dimension | weekly signal | financial consequence | buyer evidence | warning condition |
|---|---|---|---|---|
| retention | cancellations, service risk, renewal contacts | recurring revenue and acquisition cost | cohort schedule and contract support | churn hidden by new sales |
| price | discount, renewal uplift, exception approvals | revenue, margin and elasticity | price waterfall and approval log | list-price growth without realisation |
| concentration | exposure and customer events | volatility and negotiating power | customer profitability and renewal map | one account drives plan delivery |
| backlog | additions, fulfilment and cancellation | future revenue and working capital | contract, order and delivery reconciliation | backlog rises through delivery failure |
| pipeline | stage movement and conversion | future volume and sales cost | definitions, ageing and historical conversion | coverage grows while conversion falls |
| collections | invoice, dispute and payment behaviour | cash, bad debt and financing need | ageing, dispute log and bank receipts | revenue growth consumes liquidity |
The diagnostic combines commercial evidence with accounting and cash outcomes.
6. Translate operations into maintainable margin
Exit analysis should distinguish reported margin, current run-rate margin and maintainable margin. Reported margin follows the accounting period. Run-rate margin annualises a recent operating state. Maintainable margin reflects the level that management expects the business can sustain after considering normal costs, required investment and risk. Each view needs a reconciliation.
The operating bridge should decompose gross margin into price, volume, mix, input cost, yield, labour, logistics, warranty, returns and service failure. It should decompose operating expenses into recurring capacity, variable growth investment, temporary projects, owner-specific costs, public-company readiness, systems and compliance. Cost reductions should remain separate from cost deferrals.
Weekly operational measures are particularly useful for loss and failure cost. Scrap, rework, downtime, missed delivery, support escalation, expedited freight and billing errors can reveal margin leakage before it is visible in the general ledger. Management should map each failure measure to the accounts where its cost ultimately appears.
Normalisation requires discipline. A cost is not exceptional merely because management wants to exclude it. The board should document why the item is non-recurring, outside normal operations or expected to change under a credible plan. It should also identify investments that a buyer may expect to add, including finance, systems, controls, cyber, data, leadership or regulatory capability.
7. Convert accounting profit into cash
Cash conversion is the first test of whether operating improvement reaches equity value. IAS 7 distinguishes operating, investing and financing cash flows and reconciles cash to the statement of financial position. The internal bridge should go further by showing how earnings, working capital, tax, interest, capital expenditure and exceptional cash items shape liquidity and net debt.
Working capital should be decomposed into operational populations. Receivables depend on billing accuracy, dispute, credit terms, collection behaviour and revenue mix. Inventory depends on demand, safety stock, yield, lead time, obsolescence and supplier reliability. Payables depend on purchasing discipline, acceptance, invoice matching, terms and supply continuity. Aggregate days measures can conceal offsetting deterioration.
The bridge should distinguish sustainable cash release from timing. Delaying essential suppliers, selling receivables, reducing safety stock below resilience needs or deferring maintenance can improve period-end cash while weakening the operating model. A buyer may reverse those effects through working-capital targets, debt-like adjustments or lower confidence in the plan.
Cash forecasting should use scenarios. A base case can show expected collections, payments and funding headroom. A downside case can reflect customer delay, demand loss, input-cost pressure or operational disruption. A severe but plausible case should identify the actions and authorities required to protect liquidity without damaging critical value drivers.
Table 3. Cash-conversion control room
| cash driver | operational population | leading measure | control | value interpretation |
|---|---|---|---|---|
| receivables | invoices by customer and dispute | unbilled work, first-pass accuracy, promise-to-pay | ledger-to-bank reconciliation | durable reduction requires process evidence |
| inventory | item, site, age and demand class | forecast error, yield, lead time, excess stock | count, reserve and obsolescence review | release is valuable if service remains protected |
| payables | supplier, category and criticality | unmatched invoices, term adherence, supply risk | approval and supplier continuity review | extension can create debt-like or supply exposure |
| tax | jurisdiction, type and due date | accrual variance and filing status | return-to-ledger reconciliation | arrears can reduce proceeds and credibility |
| capital expenditure | project, asset and commitment | milestone, spend-to-complete, benefit evidence | approval, invoice and commissioning control | deferred essential spend lowers maintainable cash |
| liquidity | cash, facilities and restrictions | forecast variance and covenant headroom | bank, facility and forecast reconciliation | resilient liquidity protects execution optionality |
The measures connect operating actions to cash without treating timing measures as permanent value.
8. Show capital intensity and reinvestment honestly
EBITDA does not capture the capital required to sustain or grow the business. The exit bridge should therefore separate maintenance, compliance, resilience, replacement, growth and transformation expenditure. It should include committed spend, capitalised development, leases, major repairs and the working capital required by growth.
Maintenance capital expenditure is not simply the historical average. It depends on asset age, utilisation, failure history, maintenance backlog, regulation, technology obsolescence and expected service level. A period of underinvestment can increase EBITDA and cash temporarily while creating a future requirement that a buyer prices.
Growth capital should connect to specific capacity or capability. Management should state the demand evidence, bottleneck, timing, cost to complete, ramp profile and expected unit economics. It should distinguish spend needed to deliver the base plan from optional expansion. Projects without clear commissioning and benefit evidence should not be presented as completed value creation.
Digital and product investment creates additional measurement questions. Capitalised software or development cost can increase accounting EBITDA while consuming cash. The bridge should show total spend, accounting treatment, operating benefit, technical debt and ongoing support burden. A buyer may focus on cash economics and capability durability rather than the current classification.
Capital allocation should include a post-investment review. For each material project, the board should compare the approved business case with actual spend, commissioning, capacity, customer adoption, cost and cash. Variance should be traced to changed demand, execution, timing, pricing or an incorrect original assumption. This evidence improves the credibility of the next project and the wider forecast.
Management should distinguish sunk cost from remaining decision value. A project can have consumed significant capital and still require cancellation, redesign or a different sequence. The exit bridge should show spend to date, unavoidable commitments, cost to complete, expected benefits and the value of alternative uses of capital. It should avoid treating historical expenditure as proof that completion is economic.
The buyer may also examine asset condition and investment backlog across jurisdictions or operating sites. A common asset taxonomy, criticality assessment and maintenance record can make different operations comparable while preserving local regulatory and technical requirements. This helps separate normal reinvestment from remediation and growth.
9. Put leverage and covenant headroom inside the value bridge
Equity value is sensitive to net debt at exit and to the financing path required to reach exit. The board should monitor cash interest, amortisation, maturity, floating-rate exposure, hedging, liquidity, permitted distributions and covenant definitions. The management bridge should reconcile its performance measures to the definitions in executed financing documents.
Covenant EBITDA can differ from statutory and management EBITDA through permitted adjustments, synergies, acquisitions, disposals, exceptional items and pro forma effects. The bridge should maintain a definition ledger and show the expiry or cap of each adjustment. It should prevent the same benefit from appearing in operational improvement, covenant adjustments and exit normalisation without reconciliation.
Headroom should be forecast under base, downside and severe but plausible scenarios. The forecast needs debt balances, interest, cash taxes, working capital, capital expenditure and permitted cures. It should state the notice, information and approval steps required if a threshold is approached.
The European Banking Authority's loan-origination and monitoring guidance addresses governance and credit monitoring across the loan lifecycle, including covenant monitoring where relevant. Portfolio-company boards can use the same control logic: clear definitions, timely data, proportional monitoring, escalation and documented decisions.
10. Protect customer, supplier and people continuity
The value bridge should include the dependencies that allow financial performance to continue. Customer relationships, critical suppliers, key employees, licences, data, systems and sites can create downside that is not captured by a single forecast. Management should identify the few dependencies whose failure would materially change cash flow, execution time or buyer confidence.
Customer continuity should combine retention, service, quality, complaints, concentration and contract exposure. Supplier continuity should combine criticality, qualification, lead time, switching cost, financial health and geographic concentration. People continuity should focus on roles, knowledge, authorisations, customer relationships and succession rather than job title alone.
Weekly indicators should support intervention. A fall in on-time delivery can trigger capacity and supplier actions. Rising complaint severity can trigger customer contact and root-cause work. Overtime, vacancies or safety incidents can show fragility before output declines. These signals enter the value bridge through their expected effect on revenue, cost, cash, risk or timing.
The board should avoid monetising every risk as a precise valuation deduction. It can classify exposure, control strength, evidence, scenario effect and response cost. The valuation committee or transaction advisers can then assess how market participants may price the remaining uncertainty.
11. Treat resilience as an economic capability
Operational resilience affects value because disruption can change revenue, cost, cash, liability and strategic options. The UK Financial Conduct Authority defines operational resilience around the ability to prevent, adapt, respond, recover and learn, and it uses important business services, impact tolerances, mapping and testing. NIST Cybersecurity Framework 2.0 adds an explicit Govern function and connects cyber risk to enterprise governance.
A portfolio company can adapt this logic to its sector. It identifies critical customer or production services, sets management tolerances, maps the people, process, technology, facilities, data and suppliers required, and tests severe but plausible scenarios. The result is more decision-useful than a generic risk score.
The bridge should show disruption frequency, duration, affected volume, recovery cost, customer impact, control exceptions and remediation progress. It should connect material incidents to forecast and valuation assumptions. A resilient business may support more confidence in cash-flow durability; the effect still requires market evidence and valuation judgement.
Cybersecurity and technology risks require special attention because they can affect operations, data, customers, compliance and transaction execution at the same time. The evidence room should contain governance, architecture, incident, access, recovery, supplier and remediation records appropriate to the company and transaction.
Table 4. Resilience evidence and possible value channels
| exposure | operating evidence | financial channel | exit-readiness evidence | board response |
|---|---|---|---|---|
| critical-service outage | duration, volume, recovery and recurrence | lost revenue, remediation, credit and churn | service map, tolerance and tested recovery | fund priority remediation |
| cyber incident | scope, containment, data and control gap | interruption, response, liability and insurance | incident record, access model and recovery test | govern risk and verify closure |
| supplier failure | dependency, inventory, qualification and lead time | lost output, premium cost and working capital | supplier map, alternatives and contract rights | dual-source or hold informed buffer |
| site or asset failure | maintenance, utilisation and spare capacity | downtime, repair, capex and service loss | asset register, backlog and continuity plan | address critical backlog |
| key-person dependency | role, knowledge, authority and succession | delay, customer loss and replacement cost | role map, retention and transfer plan | reduce single points of failure |
| regulatory control gap | obligation, exception and remediation | restriction, cost, penalty and delay | compliance map and verified remediation | escalate and obtain qualified advice |
The table identifies channels for analysis; it does not prescribe valuation adjustments.
12. Make product and data evidence buyer-ready
For technology, services and innovation-led businesses, product and data quality can be central to value. The bridge should show product adoption, retention, gross margin, support burden, roadmap delivery, technical debt, security, data rights, model risk and the capital required to sustain the platform.
Product metrics should connect to cohorts and economics. Active users, utilisation or feature adoption may be leading indicators, yet their meaning depends on the product and contract. The board should identify whether adoption leads to renewal, expansion, price, lower service cost or defensibility. It should preserve failed experiments in the evidence record because selective reporting weakens credibility.
Data lineage matters across the bridge. The same customer, product, order and cash populations should reconcile across commercial, operational and financial systems. Changes to identifiers, systems, attribution or calculation should be logged. Historical restatement may be required when a definition changes materially.
Exit readiness also requires legal and technical evidence: ownership, licences, third-party components, data permissions, security testing, incident history, architecture, recovery, development process and critical suppliers. The board should assign owners and remediation dates before a buyer's diligence process compresses the timetable.
13. Control adjustments and quality of earnings
An exit bridge should provide a transparent path from statutory performance to management performance and any transaction normalisations. The path can include accounting classifications, discontinued activities, acquisitions, disposals, owner costs, exceptional items, synergies, cost savings and required stand-up costs. Each line needs evidence and a clear reason.
Alternative performance measures can improve understanding when they are defined, reconciled, explained and applied consistently. They become misleading when labels are unclear, favourable items are excluded asymmetrically, recurring costs are called exceptional or definitions change to protect a target. The SEC, ESMA and ASIC guidance all reinforce disciplined presentation of measures outside the accounting standards.
The adjustment register should record gross amount, accounting account, cash effect, period, recurrence assessment, evidence, owner and treatment across management, covenant and transaction views. It should also record costs that need to be added. A buyer may assess required finance, systems, cyber, compliance, leadership or public-company investment that is absent from the current cost base.
The bridge should show reported, adjusted and buyer-tested scenarios rather than one defended number. This prepares management for a quality-of-earnings process and helps the board understand which improvements are embedded in observed results and which remain dependent on future execution.
14. Connect weekly forecasting to the valuation model
The valuation model should consume controlled financial forecasts rather than raw operational metrics. Weekly signals update the assumptions that drive revenue, margin, working capital, capital expenditure and risk. Finance should maintain the translation rules and record why a signal changed or did not change the forecast.
Forecast revisions should distinguish timing, perimeter, price, volume, mix, cost, productivity and risk. A delayed shipment may shift revenue and cash without changing total demand. Customer loss changes volume and may change concentration. A supplier issue may change cost, working capital and resilience. The model should preserve these mechanisms rather than use a single top-line override.
The board should review forecast accuracy by driver. Persistent bias may indicate weak data, incentives, process or understanding of the business. The response is to improve the driver and decision process, not simply increase a general discount.
Valuation sensitivity should show the interaction of performance and market assumptions. Maintainable EBITDA, cash conversion, growth, risk and net debt can affect equity value alongside the selected multiple or discount rate. The model should prevent double-counting when a risk is reflected in cash flows, probability, discount rate and multiple at the same time.
Scenario governance should state which variables move together. A demand shock may reduce volume, increase discounting, slow collections and release some inventory while leaving fixed costs unchanged. A capacity constraint may support price while limiting growth and requiring capital. Treating each sensitivity independently can understate the combined downside or overstate the benefit.
Forecasts should also preserve the difference between management action and external assumption. Management can decide headcount, procurement, inventory policy or capital timing within its authority. It cannot decide market demand, customer payment, interest rates or exit multiples. The model should show the action, the assumed response and the residual uncertainty separately.
When a forecast change enters the valuation case, finance should record the source, date, owner, rationale and prior value. This creates an assumption history that can be reviewed against actual outcomes. It also helps management explain why the model changed without reconstructing the decision from email or presentation versions.
Table 5. Illustrative equity-value sensitivity
| maintainable EBITDA | 7.0x enterprise value | 8.0x enterprise value | 9.0x enterprise value | less illustrative net debt |
|---|---|---|---|---|
| 14 value units | 98 | 112 | 126 | 40 |
| 16 value units | 112 | 128 | 144 | 40 |
| 18 value units | 126 | 144 | 162 | 40 |
| 20 value units | 140 | 160 | 180 | 40 |
| 22 value units | 154 | 176 | 198 | 40 |
Values are hypothetical management assumptions; the table is not a valuation opinion.
15. Build the evidence room before the sale process
Exit readiness is an operating discipline. A well-ordered evidence room helps management demonstrate how the business works, how performance is measured and how risks are governed. It also reduces the burden of reconstructing history during a compressed process.
The evidence room should mirror the value bridge. Commercial folders support customer cohorts, contracts, pricing and pipeline. Operations folders support capacity, service, quality, suppliers and sites. Finance folders support accounts, reconciliations, cash, debt, tax and adjustments. Technology folders support architecture, data, cyber and product. People folders support roles, incentives, succession and compliance.
Every significant metric should have a definition, source extract, lineage, owner, reconciliation and change log. Every improvement claim should have a baseline, intervention, observed result and financial bridge. Every open risk should have an owner, response, decision date and evidence status.
The room should preserve version control and access governance. Sensitive customer, employee, pricing, security and personal information may require restricted access, redaction, clean-team arrangements or qualified advice. Preparing early allows the company to solve evidence and control gaps while normal operations continue.
Evidence should be organised around assertions a buyer is likely to test. A revenue assertion needs population completeness, contract support, recognition, cash collection and cohort history. A margin assertion needs cost allocation, volume, price, mix and normalisation. A cash assertion needs bank, ledger and operational reconciliation. A resilience assertion needs mapped services, incidents, testing and remediation. The assertion index helps the company respond coherently when requests arrive through different workstreams.
The board should track readiness by material gap rather than document count. A folder can contain many files and still fail to prove the claim. Each gap should state the assertion, missing evidence, commercial consequence, owner, remediation, review date and residual limitation. Closing a gap requires verification that the evidence now supports the assertion.
Cross-border businesses need a jurisdiction and entity map. Revenue, employees, assets, licences, debt, tax, data and contracts may sit in different legal entities. The bridge should reconcile group performance to those entities and preserve local obligations. This reduces the risk that a group-level narrative cannot be supported in legal, tax, regulatory or financing diligence.
16. Use governance that converts information into action
The board should define a cadence for the bridge. Weekly operating reviews focus on exceptions, root causes, actions and cash. Monthly reviews reconcile operating metrics to financial results and update the forecast. Quarterly reviews assess strategy, risk, capital allocation, valuation assumptions and exit readiness. A transaction-readiness forum can govern data-room evidence, adviser requests and remediation.
Decision rights should distinguish management action from board approval and independent valuation governance. Operations leaders own process outcomes. Finance owns reconciliations and forecast integrity. Risk, legal, tax, compliance, cyber and other control functions retain their mandates. The board approves strategy, risk appetite, material capital and exit decisions. An independent valuation committee or adviser may provide challenge where required.
The UK Corporate Governance Code 2024 and its guidance emphasise board monitoring and review of risk management and material controls. The G20/OECD Principles identify strategy, performance objectives, monitoring, risk and reporting integrity as core board functions. These principles support a bridge that is governed as an operating and control system, rather than a presentation prepared only for exit.
The meeting pack should state the decision requested, evidence, alternatives, financial effect, risk, authority, owner and deadline. A red metric without a decision should remain visible. A green metric should still be reconciled and challenged when its definition, source or incentive creates risk.
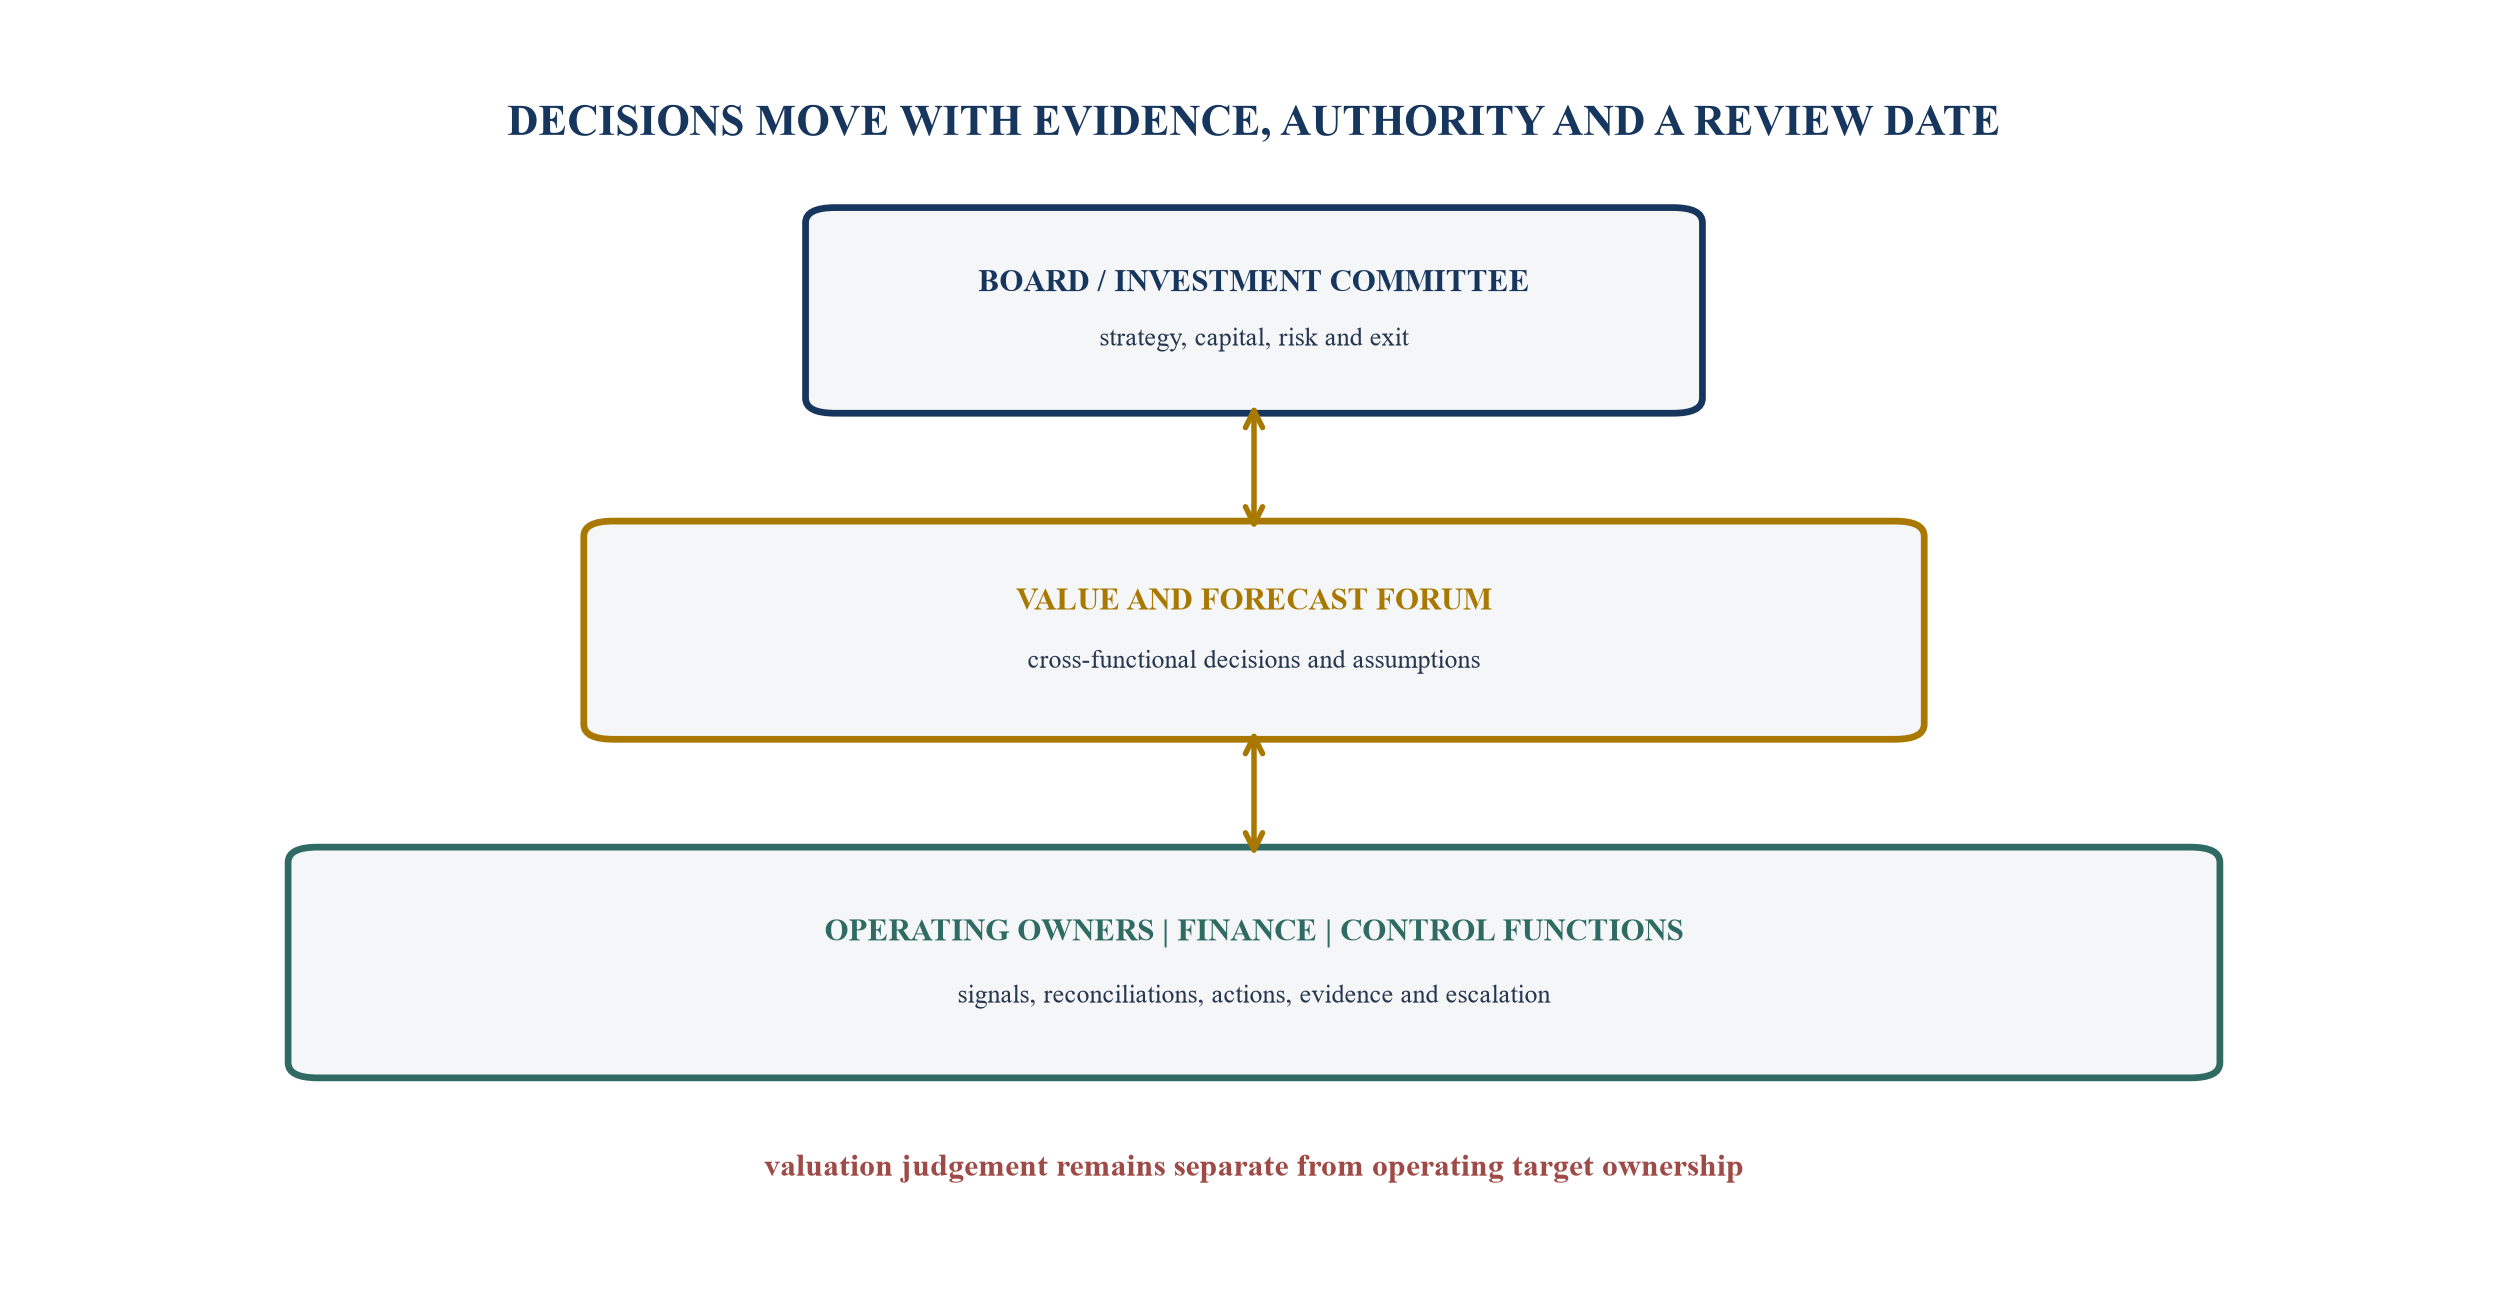
Operating ownership, finance control and board oversight remain distinct and connected.
17. Design incentives around durable value
Incentives can improve focus or corrupt the bridge. A target based only on EBITDA may encourage working-capital consumption, deferred maintenance or underinvestment. A revenue target may encourage discounting or low-quality contracts. A cash target may encourage supplier stretch or reduced safety stock. The scorecard should therefore combine performance, cash, durability and control.
Measures should be few enough to govern. Each should be within the role's influence, defined before the performance period, supported by a controlled source and resistant to simple gaming. Relative weights and gates should reflect the business model and plan. Material control failure, misconduct or customer harm may require an override under applicable agreements and law.
Long-term incentives should connect to realised equity outcomes while recognising the path used to achieve them. The board should document treatment of acquisitions, disposals, refinancing, changes in accounting policy, exceptional events and exit timing. The approach needs legal, tax and remuneration advice.
Management should review behavioural effects. If teams protect a metric at the expense of the underlying value driver, the measure or governance needs revision. The evidence register should record definition changes and prevent retrospective target design.
18. Apply the framework to a hypothetical portfolio company
Consider a hypothetical regional business-services company preparing for a possible exit in 18 months. Management reports 12 percent annual revenue growth and an improving adjusted EBITDA margin. The weekly bridge identifies three different mechanisms: new-logo sales, price increases and lower service rework.
The cohort analysis shows that new-logo growth is offsetting weaker retention in one customer segment. The price waterfall shows that list-price increases are partly returned through implementation credits. The service analysis shows lower rework but rising unresolved tickets. Reported growth remains real, yet its durability requires management action.
The cash bridge shows receivables increasing faster than revenue because billing errors and customer disputes delay collection. The business has also deferred a platform upgrade that supports service capacity. Net debt is therefore higher than the original plan even though adjusted EBITDA is ahead.
Management responds through a controlled programme. The commercial team assigns owners to priority renewals and changes qualification criteria. Operations addresses the ticket backlog and root causes. Finance creates an invoice-quality control and dispute forum. The board approves the platform investment after reviewing spend-to-complete, migration and resilience evidence.
For illustration, the valuation model tests maintainable EBITDA under base and downside customer scenarios, includes the required platform cost and forecasts net debt under different collection outcomes. The board does not assume a higher multiple because the dashboard improved. It strengthens the evidence for revenue durability, cash conversion and execution, while market pricing remains an external judgement.
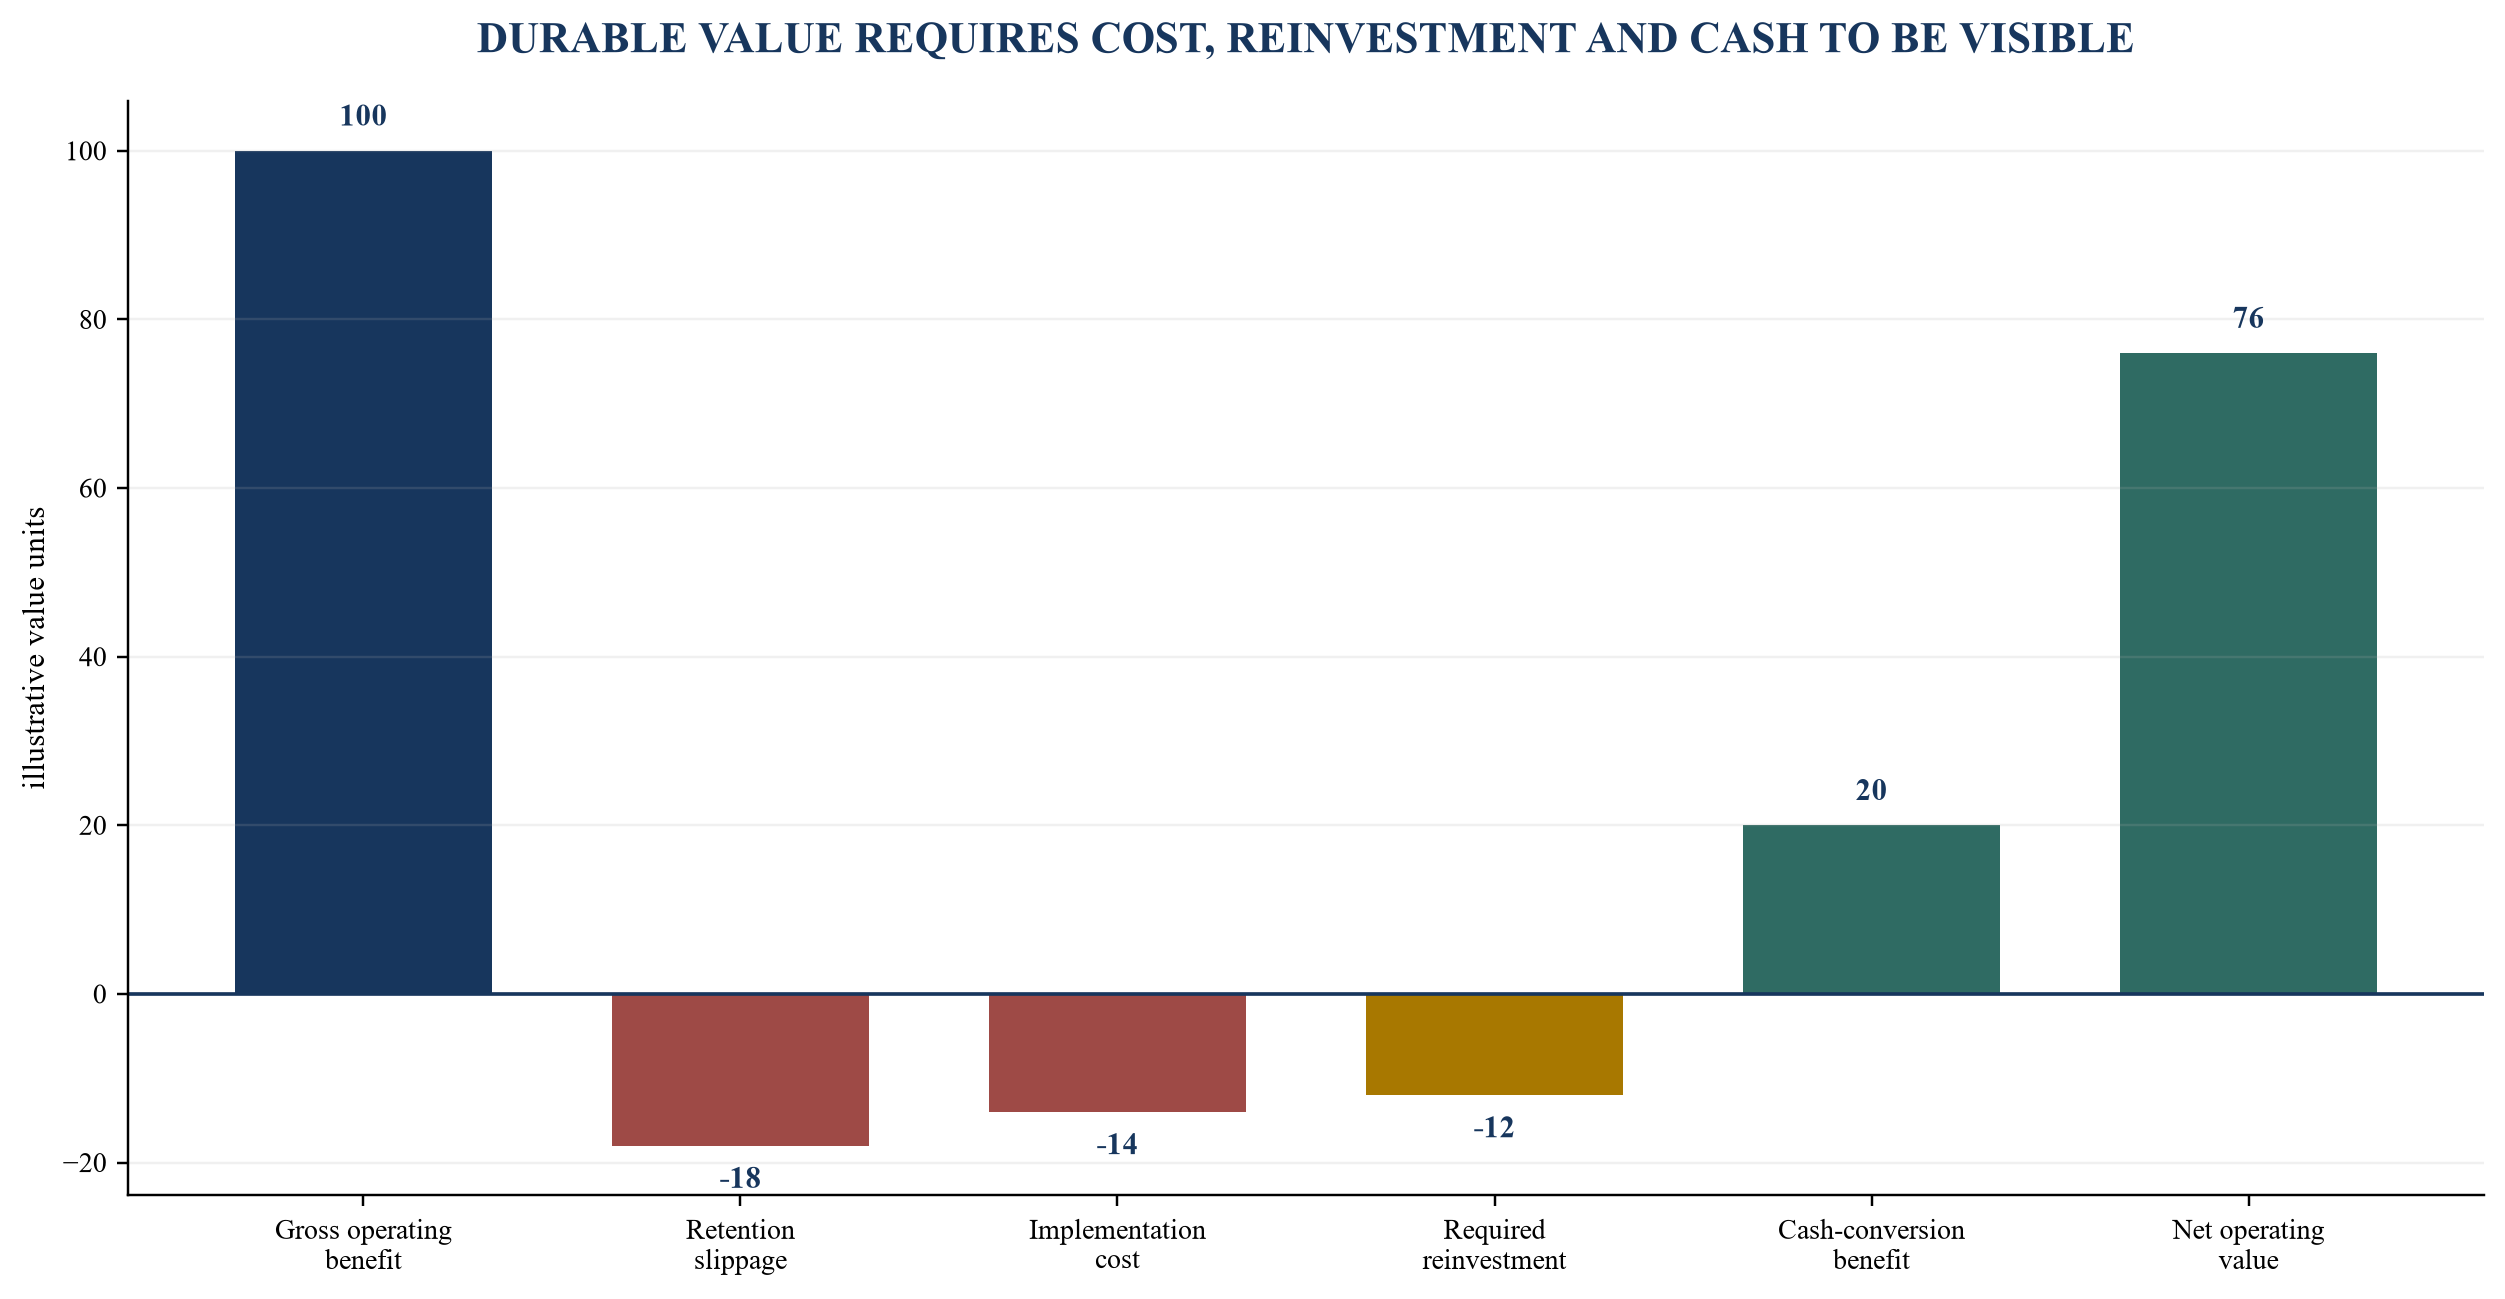
Values are hypothetical management assumptions and exclude market multiple changes.
19. Use a board scorecard that preserves the chain
The board scorecard should show the chain from operating driver to equity-value implication. It should avoid an unsupported precision in which a one-point change in a weekly metric is assigned an automatic multiple effect. Instead, it shows the current signal, financial linkage, evidence quality, action and valuation assumption affected.
The scorecard can use four evidence states: observed, reconciled, tested and independently challenged. Observed means the event exists in a defined source. Reconciled means it agrees to the relevant operational or financial population. Tested means management has evaluated the intervention and result. Independently challenged means a qualified function, committee or adviser has reviewed the method and evidence.
An evidence state should never become a decorative rating. The pack should link directly to the underlying record, identify open exceptions and show when the evidence was last refreshed. Stale evidence should return to review before it supports a material capital or transaction decision.
The board should review leading indicators beside financial outcomes. Pipeline, service, retention, working capital, capacity and resilience provide earlier warning. Revenue, margin, cash, net debt and forecast accuracy show realised consequence. Exit-readiness measures show whether the evidence can withstand buyer, lender, auditor and adviser scrutiny.
Table 6. Board scorecard for the exit value bridge
| value driver | leading signal | realised outcome | evidence state | board decision |
|---|---|---|---|---|
| revenue durability | renewal risk, service and cohort movement | retention, recurring revenue and cash | contract and cohort reconciled | fund customer intervention |
| price quality | discount and exception movement | realised price and contribution margin | waterfall reconciled | adjust authority or proposition |
| productivity | throughput, failure and utilisation | gross margin and operating cash | operational-to-ledger tested | remove bottleneck or invest |
| cash conversion | billing, ageing, inventory and supplier signals | operating cash and net debt | bank and ledger reconciled | approve corrective actions |
| resilience | tolerance breaches and remediation | disruption cost and continuity | scenario tested | prioritise critical remediation |
| exit readiness | open evidence and control gaps | buyer confidence and process timing | independently challenged where required | approve remediation and launch gate |
Thresholds and targets are company-specific management decisions.
20. Implement the bridge in ninety days
The first thirty days establish definitions and ownership. Management identifies the limited set of value drivers, maps current metrics, writes charters, records sources and reconciliations, and separates observations from estimates and controlled financial measures. Finance builds the enterprise-to-equity reconciliation and adjustment register.
Days 31 to 60 connect the bridge to decisions. Workstreams map price, volume, mix, cost, working capital, capital expenditure, leverage and resilience. They define thresholds, responses and escalation. The valuation model receives controlled forecast inputs and sensitivities. The evidence room adopts the same structure.
Days 61 to 90 test the system. Management runs weekly and monthly cadences, investigates definition and reconciliation failures, tests a downside scenario, reviews covenant and liquidity headroom, and presents the board with decisions rather than status alone. The board agrees the recurring cadence and independent challenge requirements.
The sequence should remain proportionate. A smaller business may use fewer metrics and simpler systems. A regulated, multi-jurisdictional or technology-dependent business may require deeper control, data and assurance. The objective is a reliable decision chain, not reporting volume.
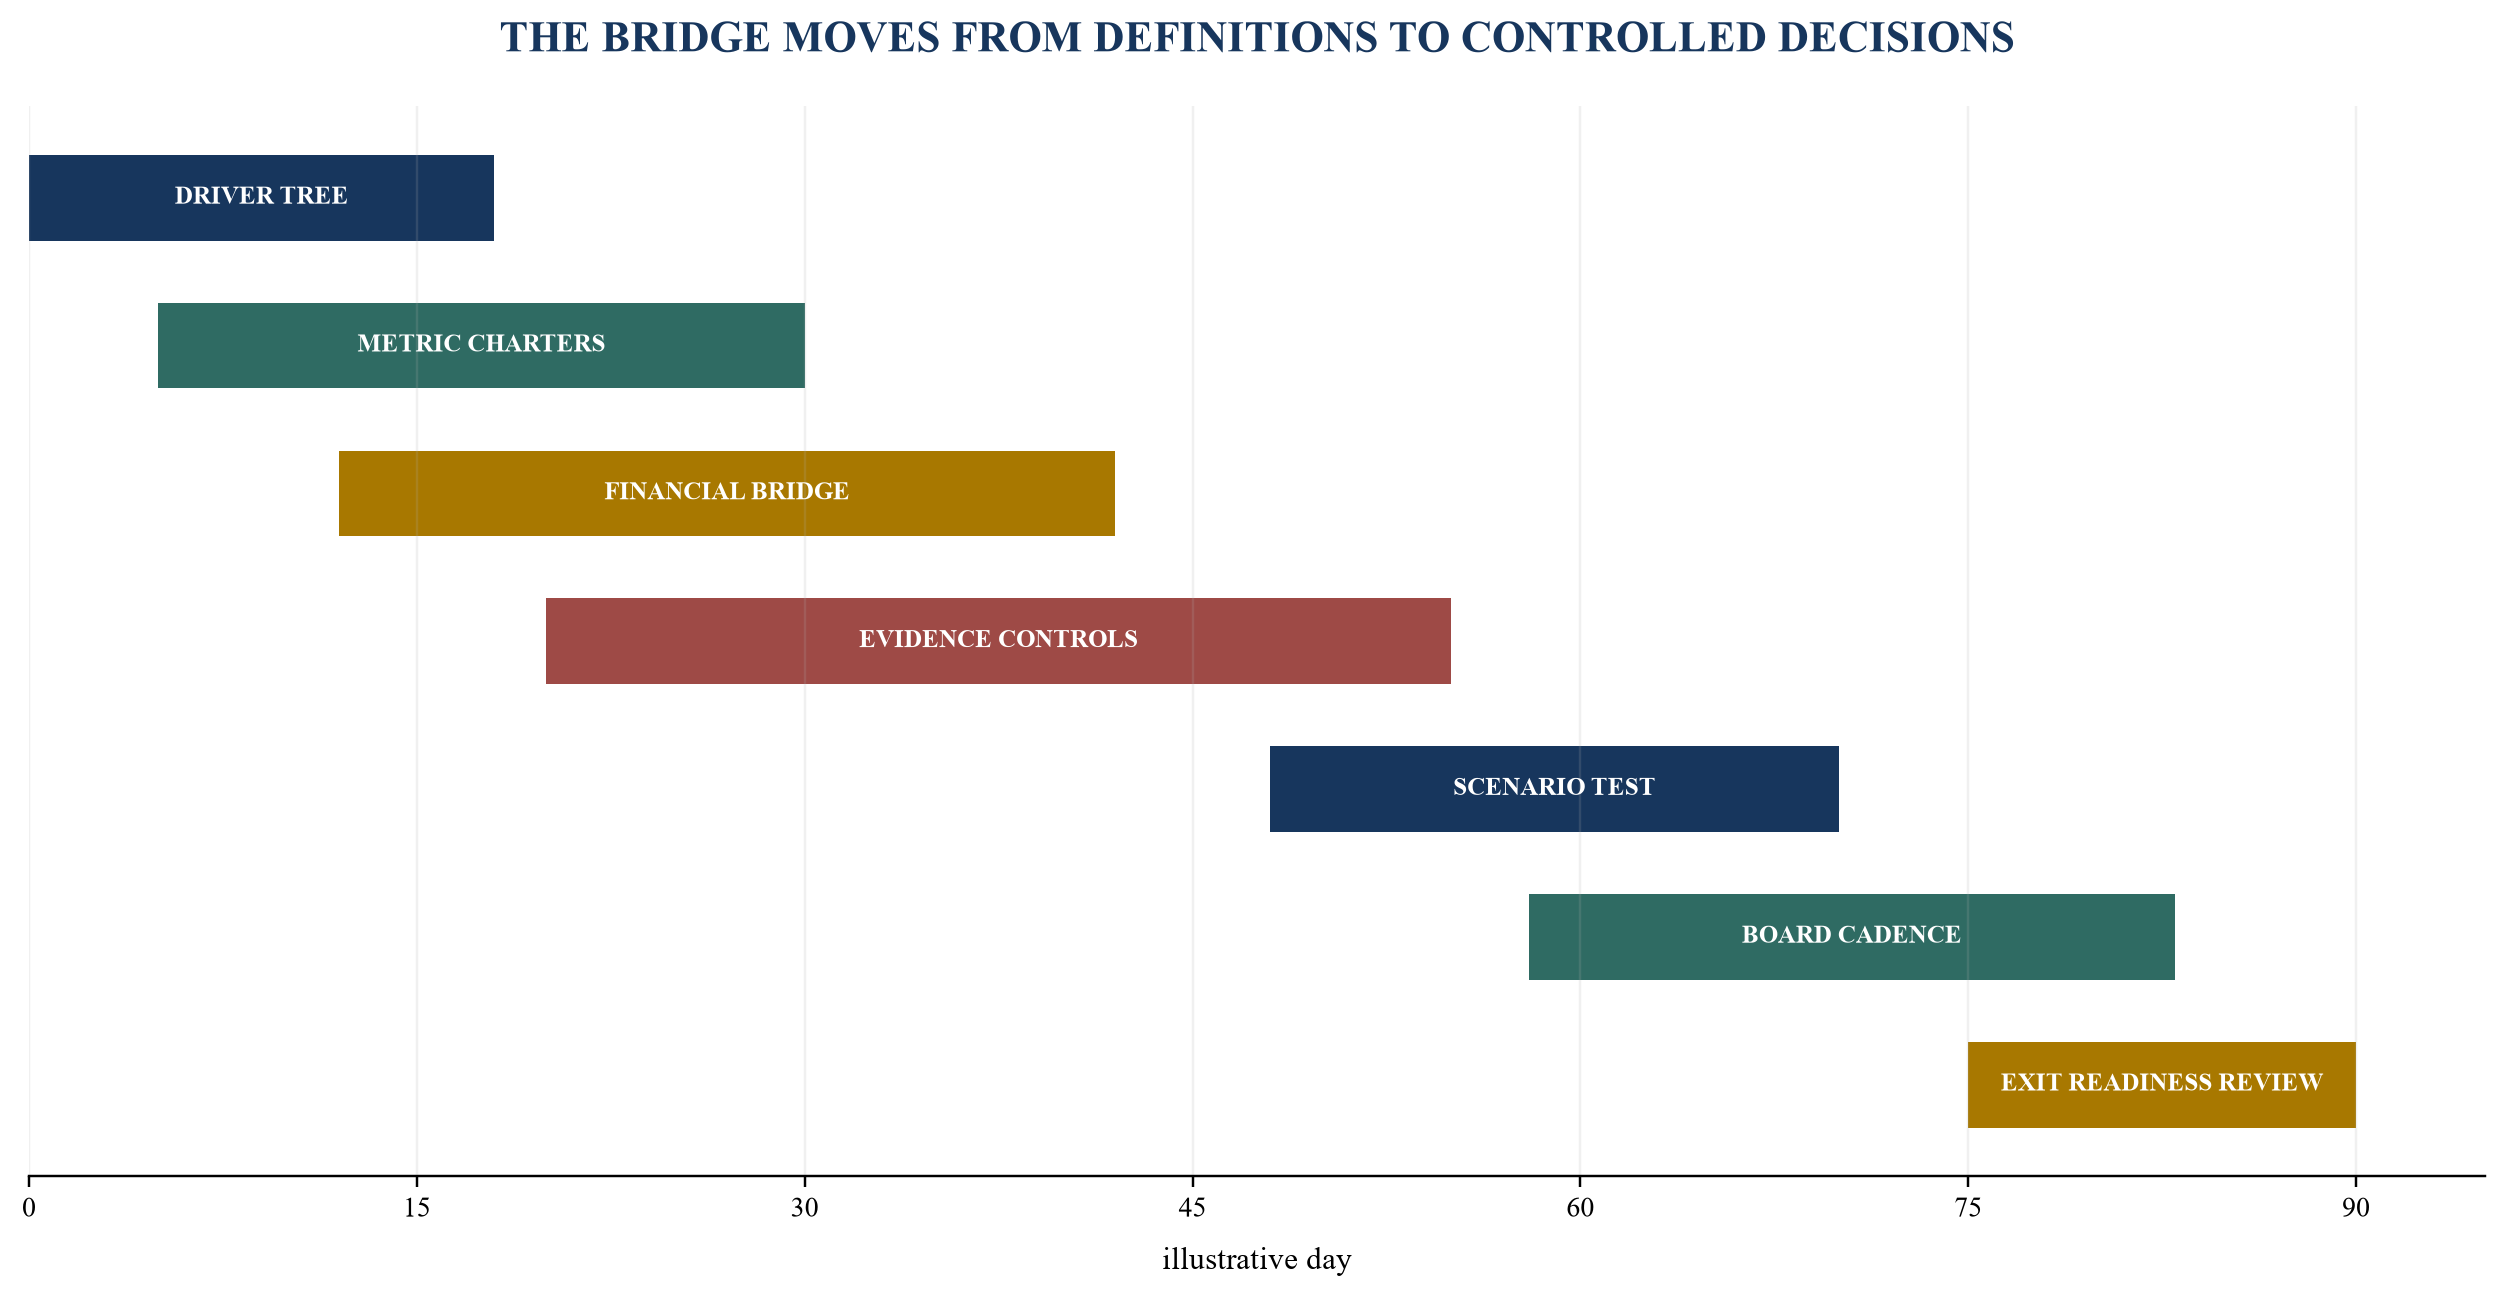
The sequence is illustrative and should be adapted to company facts, systems and governance.
21. Recognise the limits of the framework
The exit value bridge is a management and governance framework. It does not determine fair value, market value, transaction price or realised proceeds. Valuation depends on the relevant basis of value, available market evidence, forecasts, risk, capital structure, buyer circumstances, transaction terms and professional judgement.
Operating metrics can support causal analysis without proving causation. External demand, competition, regulation, financing conditions, foreign exchange, commodity prices and buyer strategy can change outcomes. Weekly data can be incomplete or volatile. Management should preserve uncertainty and avoid converting model sensitivity into certainty.
The bridge also does not replace accounting records, audited financial statements, independent valuation, quality-of-earnings work, legal diligence, tax analysis, debt review, cyber assessment or regulatory advice. It improves the organisation of evidence and decisions that support those processes.
Market conditions can dominate a well-executed operating plan. Interest rates, public-market comparables, buyer financing, sector appetite, competition and transaction supply can change valuation and timing. The board should therefore maintain strategic options: continue compounding, refinance, sell a division, pursue a bilateral transaction, prepare a broader process or defer exit. The bridge informs those choices by making current cash flow, risk and readiness visible.
The bridge can also create false confidence if management confuses measurement with control. A detailed dashboard cannot compensate for weak customer propositions, inadequate leadership, unresolved compliance issues or scarce liquidity. The governance cadence must retain the authority to change strategy, stop a project, allocate capital or seek external support.
Its value lies in discipline. The board can see how operating choices affect cash, risk and readiness; management can act before month-end; finance can reconcile the narrative; and a future buyer can test a coherent chain from source data to equity-value assumptions.
22. Conclusion
Equity value is realised through the quality and durability of operations, cash flow, risk management and evidence. The board cannot control the market multiple. It can build a business whose performance, forecasts, controls and strategic options are understandable and testable.
The exit value bridge provides that operating system. It separates enterprise value from equity value, connects weekly signals to financial outcomes, exposes working capital and reinvestment, governs adjustments, protects resilience and assembles buyer-ready evidence. It turns the exit plan into a weekly discipline long before a sale process begins.
The practical standard is simple: every material value claim should connect to an observed operating population, a controlled financial consequence, a documented risk, an accountable decision and a review date. When that chain is complete, the board can allocate capital and intervene with greater clarity while valuation remains subject to evidence and judgement.
References
- IFRS Foundation, IFRS 13 Fair Value Measurement, https://www.ifrs.org/issued-standards/list-of-standards/ifrs-13-fair-value-measurement/
- IFRS Foundation, IFRS 18 Presentation and Disclosure in Financial Statements, https://www.ifrs.org/issued-standards/list-of-standards/ifrs-18-presentation-and-disclosure-in-financial-statements/
- IFRS Foundation, IAS 7 Statement of Cash Flows, https://www.ifrs.org/issued-standards/list-of-standards/ias-7-statement-of-cash-flows.html/
- IFRS Foundation, IFRS 15 Revenue from Contracts with Customers, https://www.ifrs.org/issued-standards/list-of-standards/ifrs-15-revenue-from-contracts-with-customers/
- IFRS Foundation, IAS 36 Impairment of Assets, https://www.ifrs.org/issued-standards/list-of-standards/ias-36-impairment-of-assets/
- IFRS Foundation, IFRS S1 General Requirements for Disclosure of Sustainability-related Financial Information, https://www.ifrs.org/issued-standards/ifrs-sustainability-standards-navigator/ifrs-s1-general-requirements/
- International Valuation Standards Council, International Valuation Standards, https://ivsc.org/standards/
- International Valuation Standards Council, New Edition of the International Valuation Standards, https://ivsc.org/new-edition-of-the-international-valuation-standards-ivs-published/
- International Private Equity and Venture Capital Valuation Board, IPEV Valuation Guidelines 2025, https://www.privateequityvaluation.com/Valuation-Guidelines
- United States Securities and Exchange Commission, Commission Guidance on Key Performance Indicators and Metrics in MD&A, https://www.sec.gov/rules-regulations/2020/01/commission-guidance-managements-discussion-analysis-financial-condition-results-operations
- United States Securities and Exchange Commission, Non-GAAP Financial Measures Compliance and Disclosure Interpretations, https://www.sec.gov/corpfin/non-gaap-financial-measures
- United States Securities and Exchange Commission, Management's Discussion and Analysis Guidance, https://www.sec.gov/rules-regulations/2003/12/commission-guidance-regarding-managements-discussion-analysis-financial-condition-results-operations
- Public Company Accounting Oversight Board, AS 2501 Auditing Accounting Estimates Including Fair Value Measurements, https://pcaobus.org/oversight/standards/auditing-standards/details/AS2501
- Financial Accounting Standards Board, Fair Value Measurement Topic 820, https://asc.fasb.org/topic&trid=2144427
- European Securities and Markets Authority, Guidelines on Alternative Performance Measures, https://www.esma.europa.eu/document/esma-guidelines-alternative-performance-measures
- European Securities and Markets Authority, Financial Reporting and Enforcement of Alternative Performance Measures, https://www.esma.europa.eu/issuer-disclosure/financial-reporting
- European Banking Authority, Guidelines on Loan Origination and Monitoring, https://www.eba.europa.eu/activities/single-rulebook/regulatory-activities/credit-risk/guidelines-loan-origination-and-monitoring
- European Commission, Digital Operational Resilience Regulation Implementing and Delegated Acts, https://finance.ec.europa.eu/regulation-and-supervision/financial-services-legislation/implementing-and-delegated-acts_en
- United Kingdom Financial Reporting Council, UK Corporate Governance Code 2024, https://www.frc.org.uk/library/standards-codes-policy/corporate-governance/uk-corporate-governance-code/
- United Kingdom Financial Reporting Council, Corporate Governance Code Guidance, https://www.frc.org.uk/library/standards-codes-policy/corporate-governance/corporate-governance-code-guidance/
- United Kingdom Financial Conduct Authority, Operational Resilience, https://www.fca.org.uk/firms/operational-resilience
- Organisation for Economic Co-operation and Development, G20/OECD Principles of Corporate Governance 2023, https://www.oecd.org/en/publications/2023/09/g20-oecd-principles-of-corporate-governance-2023_60836fcb.html
- National Institute of Standards and Technology, Cybersecurity Framework 2.0, https://www.nist.gov/publications/nist-cybersecurity-framework-csf-20
- Dubai Financial Services Authority, Collective Investment Funds, https://www.dfsa.ae/what-we-do/collective-investment-funds
- Securities and Exchange Board of India, Standardised Approach to Valuation of Investment Portfolios of Alternative Investment Funds, https://www.sebi.gov.in/legal/circulars/jun-2023/standardised-approach-to-valuation-of-investment-portfolio-of-alternative-investment-funds-aifs-_72924.html
- Securities and Exchange Board of India, Master Circular for Alternative Investment Funds, https://www.sebi.gov.in/legal/master-circulars/may-2024/master-circular-for-alternative-investment-funds-aifs-_83229.html
- Australian Securities and Investments Commission, Regulatory Guide 230 Disclosing Non-IFRS Financial Information, https://asic.gov.au/regulatory-resources/find-a-document/regulatory-guides/rg-230-disclosing-non-ifrs-financial-information/
- Australian Securities and Investments Commission, Regulatory Guide 247 Effective Disclosure in an Operating and Financial Review, https://asic.gov.au/regulatory-resources/find-a-document/regulatory-guides/rg-247-effective-disclosure-in-an-operating-and-financial-review/
- Committee of Sponsoring Organizations of the Treadway Commission, Internal Control Integrated Framework, https://www.coso.org/internal-control
- International Organization for Standardization, ISO 22301 Security and Resilience Business Continuity Management Systems, https://www.iso.org/standard/75106.html
Sources and further reading
- IFRS Foundation, IFRS 13 Fair Value Measurement, Official source
- IFRS Foundation, IFRS 18 Presentation and Disclosure in Financial Statements, Official source
- IFRS Foundation, IAS 7 Statement of Cash Flows, Official source
- IFRS Foundation, IFRS 15 Revenue from Contracts with Customers, Official source
- IFRS Foundation, IAS 36 Impairment of Assets, Official source
- IFRS Foundation, IFRS S1 General Requirements for Disclosure of Sustainability-related Financial Information, Official source
- International Valuation Standards Council, International Valuation Standards, Official source
- International Valuation Standards Council, New Edition of the International Valuation Standards, Official source
- International Private Equity and Venture Capital Valuation Board, IPEV Valuation Guidelines 2025, Official source
- United States Securities and Exchange Commission, Commission Guidance on Key Performance Indicators and Metrics in MD&A, Official source
- United States Securities and Exchange Commission, Non-GAAP Financial Measures Compliance and Disclosure Interpretations, Official source
- United States Securities and Exchange Commission, Management's Discussion and Analysis Guidance, Official source
- Public Company Accounting Oversight Board, AS 2501 Auditing Accounting Estimates Including Fair Value Measurements, Official source
- Financial Accounting Standards Board, Fair Value Measurement Topic 820, Official source
- European Securities and Markets Authority, Guidelines on Alternative Performance Measures, Official source
- European Securities and Markets Authority, Financial Reporting and Enforcement of Alternative Performance Measures, Official source
- European Banking Authority, Guidelines on Loan Origination and Monitoring, Official source
- European Commission, Digital Operational Resilience Regulation Implementing and Delegated Acts, Official source
- United Kingdom Financial Reporting Council, UK Corporate Governance Code 2024, Official source
- United Kingdom Financial Reporting Council, Corporate Governance Code Guidance, Official source
- United Kingdom Financial Conduct Authority, Operational Resilience, Official source
- Organisation for Economic Co-operation and Development, G20/OECD Principles of Corporate Governance 2023, Official source
- National Institute of Standards and Technology, Cybersecurity Framework 2.0, Official source
- Dubai Financial Services Authority, Collective Investment Funds, Official source
- Securities and Exchange Board of India, Standardised Approach to Valuation of Investment Portfolios of Alternative Investment Funds, Official source
- Securities and Exchange Board of India, Master Circular for Alternative Investment Funds, Official source
- Australian Securities and Investments Commission, Regulatory Guide 230 Disclosing Non-IFRS Financial Information, Official source
- Australian Securities and Investments Commission, Regulatory Guide 247 Effective Disclosure in an Operating and Financial Review, Official source
- Committee of Sponsoring Organizations of the Treadway Commission, Internal Control Integrated Framework, Official source
- International Organization for Standardization, ISO 22301 Security and Resilience Business Continuity Management Systems, Official source
