

1. Reconstruct the deal thesis
The value office should state the strategic problem, value sources, competitive logic, ownership advantage, risks and time horizon. The required output is a board-owned thesis statement. Record the thesis link, baseline, accountable owner, financial controller, causal mechanism, dependencies, timing, confidence, evidence and approval status [1][2].
Translate the driver into a controlled 100-day initiative. Define the operational action, stakeholder consequence, leading indicator, realised-value measure, cash requirement, release gate, fallback and stop condition. Connect customer, workforce, supplier, data, technology, control and regulatory effects.
The principal risk is that integration can pursue activity that was never part of the investment case. Quantify gross value, dis-synergies, one-time cost, working capital, tax, time to impact, probability, capacity demand and residual risk across base, delayed, disrupted and remediated scenarios.
Retain source data, calculations, approvals, decision records, test results, exceptions and forecast changes. Reconcile reported delivery to the transaction baseline and counterfactual. Refresh the portfolio when evidence, dependencies, capacity, market conditions or risk changes.
2. Decompose value into drivers
The value office should separate revenue, cost, cash, capability, resilience and strategic-option value. The required output is a value-driver tree. Record the thesis link, baseline, accountable owner, financial controller, causal mechanism, dependencies, timing, confidence, evidence and approval status [2][3].
Translate the driver into a controlled 100-day initiative. Define the operational action, stakeholder consequence, leading indicator, realised-value measure, cash requirement, release gate, fallback and stop condition. Connect customer, workforce, supplier, data, technology, control and regulatory effects.
The principal risk is that one synergy total can conceal incompatible mechanisms and timing. Quantify gross value, dis-synergies, one-time cost, working capital, tax, time to impact, probability, capacity demand and residual risk across base, delayed, disrupted and remediated scenarios.
Retain source data, calculations, approvals, decision records, test results, exceptions and forecast changes. Reconcile reported delivery to the transaction baseline and counterfactual. Refresh the portfolio when evidence, dependencies, capacity, market conditions or risk changes.
Table 1. Value-driver taxonomy
| Driver | Primary measure | Control |
|---|---|---|
| revenue | retained and incremental margin | customer evidence |
| cost | sustainable net run rate | baseline and owner |
| cash | durable liquidity release | operating impact |
| resilience | reduced expected loss | risk evidence |
Illustrative structure; verified transaction evidence and specialist review govern.
3. Verify the transaction baseline
The value office should reconcile historical, run-rate, stand-alone forecast, purchase-price and closing-date assumptions. The required output is a signed baseline ledger. Record the thesis link, baseline, accountable owner, financial controller, causal mechanism, dependencies, timing, confidence, evidence and approval status [4][5].
Translate the driver into a controlled 100-day initiative. Define the operational action, stakeholder consequence, leading indicator, realised-value measure, cash requirement, release gate, fallback and stop condition. Connect customer, workforce, supplier, data, technology, control and regulatory effects.
The principal risk is that benefits can be claimed against a moving or selectively chosen starting point. Quantify gross value, dis-synergies, one-time cost, working capital, tax, time to impact, probability, capacity demand and residual risk across base, delayed, disrupted and remediated scenarios.
Retain source data, calculations, approvals, decision records, test results, exceptions and forecast changes. Reconcile reported delivery to the transaction baseline and counterfactual. Refresh the portfolio when evidence, dependencies, capacity, market conditions or risk changes.
4. Define the counterfactual
The value office should model what each business would achieve without the transaction across the measurement period. The required output is a governed stand-alone case. Record the thesis link, baseline, accountable owner, financial controller, causal mechanism, dependencies, timing, confidence, evidence and approval status [4][6].
Translate the driver into a controlled 100-day initiative. Define the operational action, stakeholder consequence, leading indicator, realised-value measure, cash requirement, release gate, fallback and stop condition. Connect customer, workforce, supplier, data, technology, control and regulatory effects.
The principal risk is that normal market or management improvement can be mislabelled as deal value. Quantify gross value, dis-synergies, one-time cost, working capital, tax, time to impact, probability, capacity demand and residual risk across base, delayed, disrupted and remediated scenarios.
Retain source data, calculations, approvals, decision records, test results, exceptions and forecast changes. Reconcile reported delivery to the transaction baseline and counterfactual. Refresh the portfolio when evidence, dependencies, capacity, market conditions or risk changes.
5. Name value owners
The value office should assign one executive owner and one finance controller to every material driver. The required output is a value-accountability map. Record the thesis link, baseline, accountable owner, financial controller, causal mechanism, dependencies, timing, confidence, evidence and approval status [7][8].
Translate the driver into a controlled 100-day initiative. Define the operational action, stakeholder consequence, leading indicator, realised-value measure, cash requirement, release gate, fallback and stop condition. Connect customer, workforce, supplier, data, technology, control and regulatory effects.
The principal risk is that shared ownership can leave benefits without a decision maker. Quantify gross value, dis-synergies, one-time cost, working capital, tax, time to impact, probability, capacity demand and residual risk across base, delayed, disrupted and remediated scenarios.
Retain source data, calculations, approvals, decision records, test results, exceptions and forecast changes. Reconcile reported delivery to the transaction baseline and counterfactual. Refresh the portfolio when evidence, dependencies, capacity, market conditions or risk changes.
6. Map each causal mechanism
The value office should link action, operational change, behavioural response, financial line and evidence. The required output is a thesis-to-value chain. Record the thesis link, baseline, accountable owner, financial controller, causal mechanism, dependencies, timing, confidence, evidence and approval status [2][9].
Translate the driver into a controlled 100-day initiative. Define the operational action, stakeholder consequence, leading indicator, realised-value measure, cash requirement, release gate, fallback and stop condition. Connect customer, workforce, supplier, data, technology, control and regulatory effects.
The principal risk is that targets can remain aspirations without controllable operating mechanisms. Quantify gross value, dis-synergies, one-time cost, working capital, tax, time to impact, probability, capacity demand and residual risk across base, delayed, disrupted and remediated scenarios.
Retain source data, calculations, approvals, decision records, test results, exceptions and forecast changes. Reconcile reported delivery to the transaction baseline and counterfactual. Refresh the portfolio when evidence, dependencies, capacity, market conditions or risk changes.
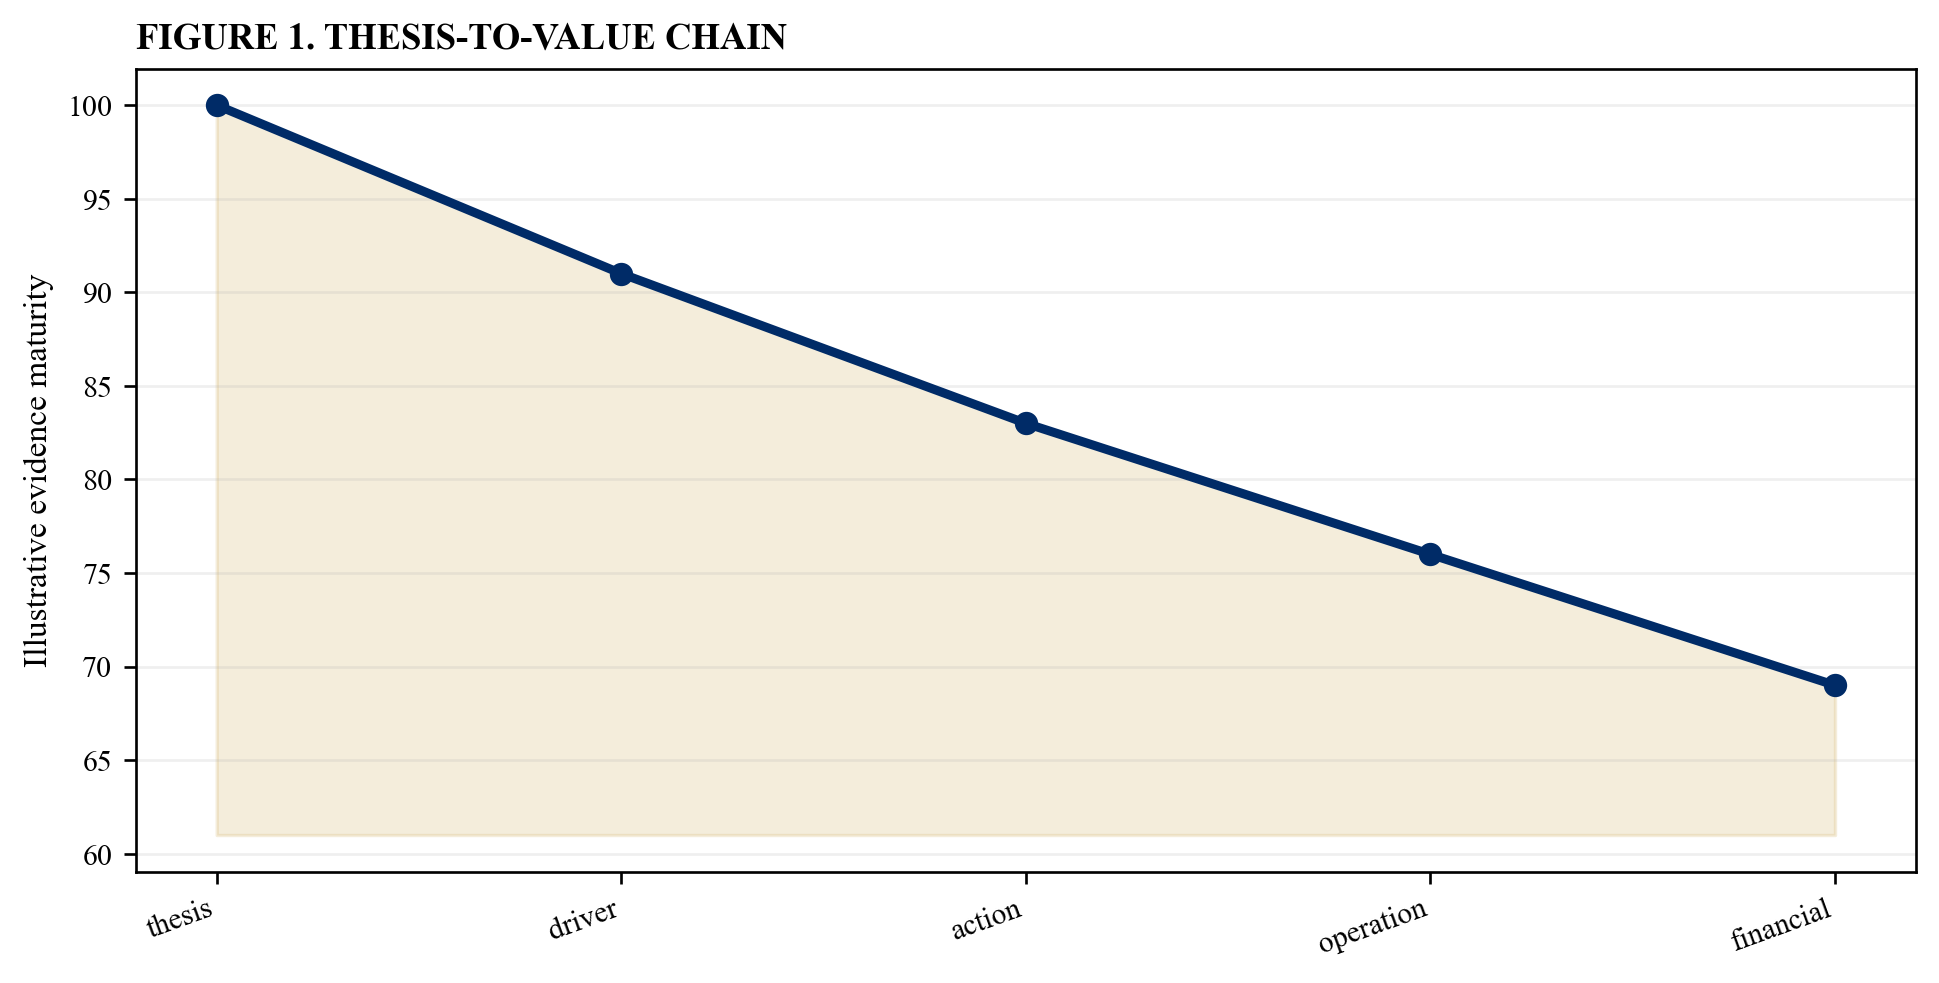
Illustrative analytical scenario; verified transaction evidence should replace index values.
7. Distinguish leading and lagging indicators
The value office should pair activity and operational signals with realised revenue, cost, cash and risk outcomes. The required output is a driver measurement dictionary. Record the thesis link, baseline, accountable owner, financial controller, causal mechanism, dependencies, timing, confidence, evidence and approval status [10][11].
Translate the driver into a controlled 100-day initiative. Define the operational action, stakeholder consequence, leading indicator, realised-value measure, cash requirement, release gate, fallback and stop condition. Connect customer, workforce, supplier, data, technology, control and regulatory effects.
The principal risk is that teams can celebrate completed actions before economics appear. Quantify gross value, dis-synergies, one-time cost, working capital, tax, time to impact, probability, capacity demand and residual risk across base, delayed, disrupted and remediated scenarios.
Retain source data, calculations, approvals, decision records, test results, exceptions and forecast changes. Reconcile reported delivery to the transaction baseline and counterfactual. Refresh the portfolio when evidence, dependencies, capacity, market conditions or risk changes.
8. Build the net-value bridge
The value office should deduct dis-synergies, one-time costs, tax, working capital, delay and risk from gross benefits. The required output is a net present value bridge. Record the thesis link, baseline, accountable owner, financial controller, causal mechanism, dependencies, timing, confidence, evidence and approval status [4][12].
Translate the driver into a controlled 100-day initiative. Define the operational action, stakeholder consequence, leading indicator, realised-value measure, cash requirement, release gate, fallback and stop condition. Connect customer, workforce, supplier, data, technology, control and regulatory effects.
The principal risk is that gross savings can exceed the value that shareholders can actually retain. Quantify gross value, dis-synergies, one-time cost, working capital, tax, time to impact, probability, capacity demand and residual risk across base, delayed, disrupted and remediated scenarios.
Retain source data, calculations, approvals, decision records, test results, exceptions and forecast changes. Reconcile reported delivery to the transaction baseline and counterfactual. Refresh the portfolio when evidence, dependencies, capacity, market conditions or risk changes.
Table 2. Net-value bridge
| Component | Treatment | Evidence |
|---|---|---|
| gross benefit | mechanism based | owner forecast |
| dis-synergy | deduct | customer and operations |
| integration cost | deduct | approved cash plan |
| risk and delay | probability weight | scenario analysis |
Illustrative structure; verified transaction evidence and specialist review govern.
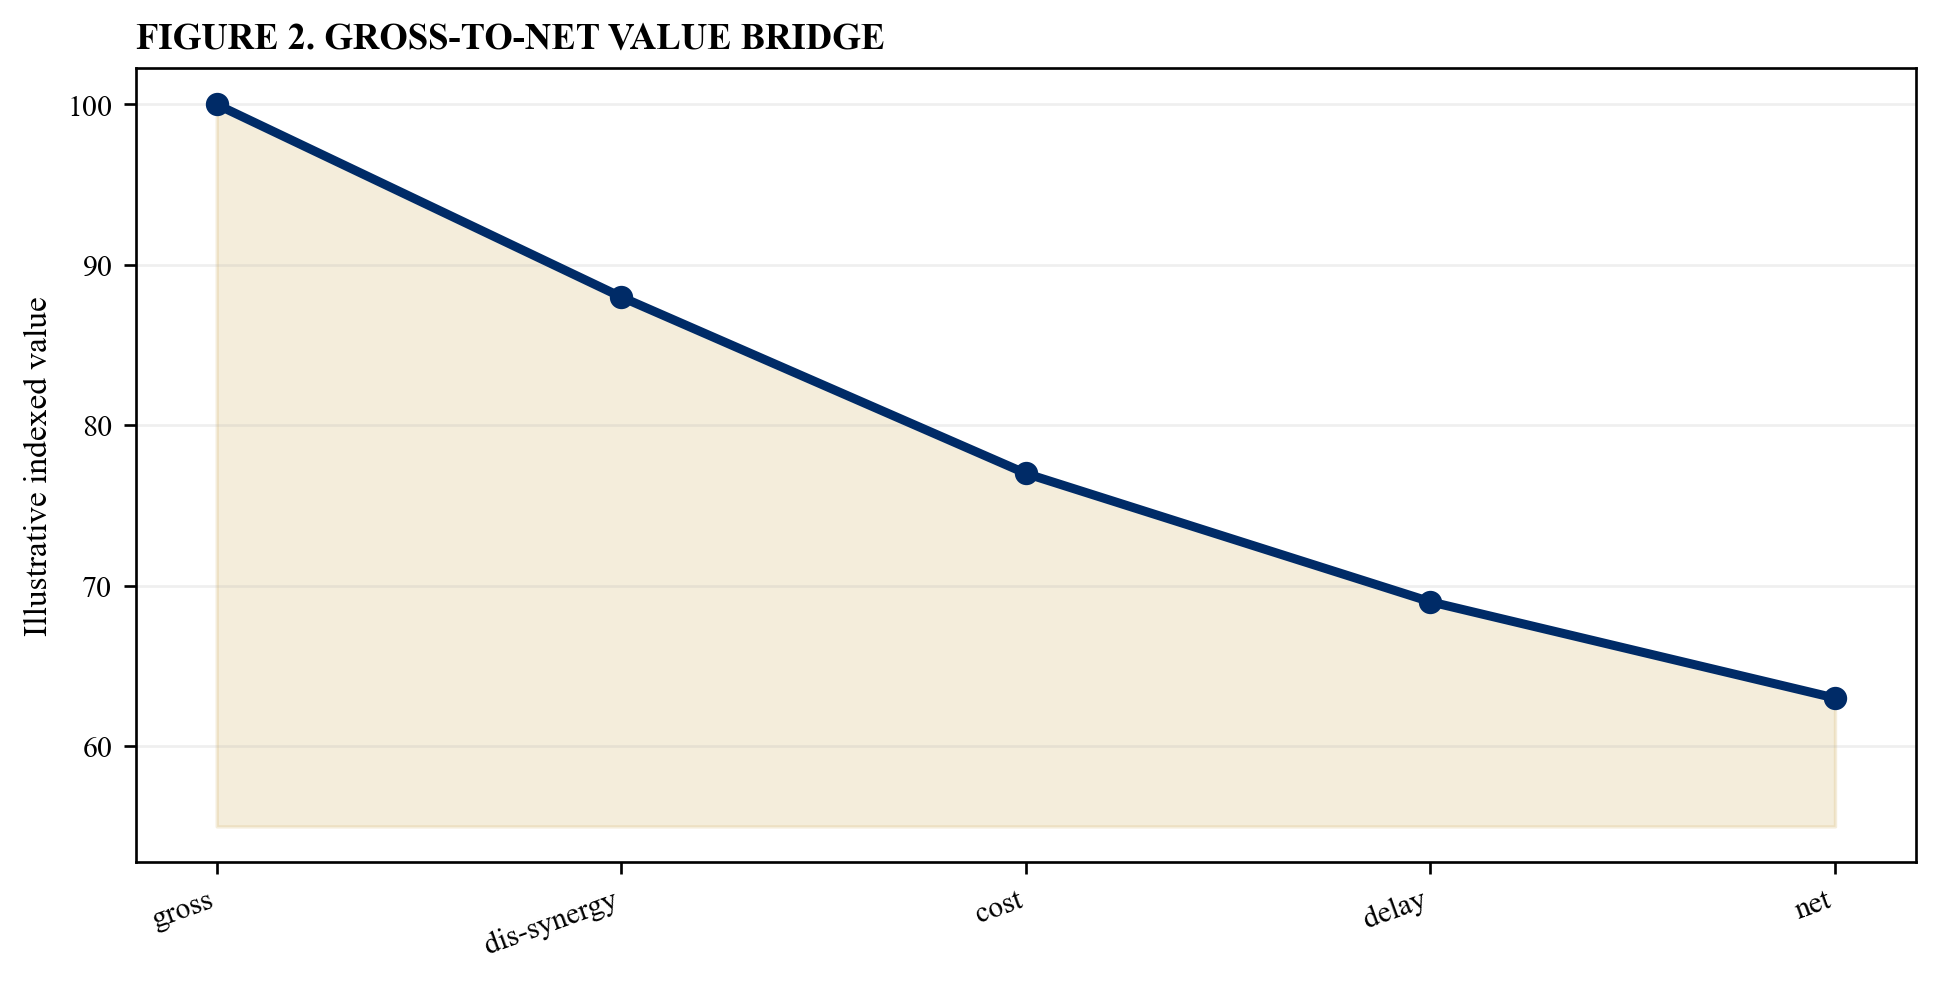
Illustrative analytical scenario; verified transaction evidence should replace index values.
9. Set evidence confidence
The value office should grade source quality, recurrence, controllability, attribution and measurement precision. The required output is a confidence-weighted value view. Record the thesis link, baseline, accountable owner, financial controller, causal mechanism, dependencies, timing, confidence, evidence and approval status [7][13].
Translate the driver into a controlled 100-day initiative. Define the operational action, stakeholder consequence, leading indicator, realised-value measure, cash requirement, release gate, fallback and stop condition. Connect customer, workforce, supplier, data, technology, control and regulatory effects.
The principal risk is that highly uncertain benefits can receive the same weight as contracted savings. Quantify gross value, dis-synergies, one-time cost, working capital, tax, time to impact, probability, capacity demand and residual risk across base, delayed, disrupted and remediated scenarios.
Retain source data, calculations, approvals, decision records, test results, exceptions and forecast changes. Reconcile reported delivery to the transaction baseline and counterfactual. Refresh the portfolio when evidence, dependencies, capacity, market conditions or risk changes.
10. Identify time-sensitive value
The value office should flag customer windows, retention dates, contract renewals, pricing cycles, tax periods and market moves. The required output is a value-decay schedule. Record the thesis link, baseline, accountable owner, financial controller, causal mechanism, dependencies, timing, confidence, evidence and approval status [14][15].
Translate the driver into a controlled 100-day initiative. Define the operational action, stakeholder consequence, leading indicator, realised-value measure, cash requirement, release gate, fallback and stop condition. Connect customer, workforce, supplier, data, technology, control and regulatory effects.
The principal risk is that delay can destroy options even when the initiative eventually completes. Quantify gross value, dis-synergies, one-time cost, working capital, tax, time to impact, probability, capacity demand and residual risk across base, delayed, disrupted and remediated scenarios.
Retain source data, calculations, approvals, decision records, test results, exceptions and forecast changes. Reconcile reported delivery to the transaction baseline and counterfactual. Refresh the portfolio when evidence, dependencies, capacity, market conditions or risk changes.
11. Map enterprise dependencies
The value office should connect legal, customer, workforce, supplier, process, data, technology, control and financing prerequisites. The required output is a dependency network. Record the thesis link, baseline, accountable owner, financial controller, causal mechanism, dependencies, timing, confidence, evidence and approval status [16][17].
Translate the driver into a controlled 100-day initiative. Define the operational action, stakeholder consequence, leading indicator, realised-value measure, cash requirement, release gate, fallback and stop condition. Connect customer, workforce, supplier, data, technology, control and regulatory effects.
The principal risk is that parallel workstreams can rely on the same unresolved prerequisite. Quantify gross value, dis-synergies, one-time cost, working capital, tax, time to impact, probability, capacity demand and residual risk across base, delayed, disrupted and remediated scenarios.
Retain source data, calculations, approvals, decision records, test results, exceptions and forecast changes. Reconcile reported delivery to the transaction baseline and counterfactual. Refresh the portfolio when evidence, dependencies, capacity, market conditions or risk changes.
12. Classify reversibility
The value office should distinguish reversible tests, staged commitments and difficult-to-unwind structural moves. The required output is a reversibility register. Record the thesis link, baseline, accountable owner, financial controller, causal mechanism, dependencies, timing, confidence, evidence and approval status [18][19].
Translate the driver into a controlled 100-day initiative. Define the operational action, stakeholder consequence, leading indicator, realised-value measure, cash requirement, release gate, fallback and stop condition. Connect customer, workforce, supplier, data, technology, control and regulatory effects.
The principal risk is that irreversible change can precede evidence and stakeholder readiness. Quantify gross value, dis-synergies, one-time cost, working capital, tax, time to impact, probability, capacity demand and residual risk across base, delayed, disrupted and remediated scenarios.
Retain source data, calculations, approvals, decision records, test results, exceptions and forecast changes. Reconcile reported delivery to the transaction baseline and counterfactual. Refresh the portfolio when evidence, dependencies, capacity, market conditions or risk changes.
13. Protect Day One stability
The value office should hold 100-day initiatives behind continuity, safety, cash, service, reporting and cyber gates. The required output is a stabilisation release rule. Record the thesis link, baseline, accountable owner, financial controller, causal mechanism, dependencies, timing, confidence, evidence and approval status [16][20].
Translate the driver into a controlled 100-day initiative. Define the operational action, stakeholder consequence, leading indicator, realised-value measure, cash requirement, release gate, fallback and stop condition. Connect customer, workforce, supplier, data, technology, control and regulatory effects.
The principal risk is that transformation can consume capacity required for reliable operation. Quantify gross value, dis-synergies, one-time cost, working capital, tax, time to impact, probability, capacity demand and residual risk across base, delayed, disrupted and remediated scenarios.
Retain source data, calculations, approvals, decision records, test results, exceptions and forecast changes. Reconcile reported delivery to the transaction baseline and counterfactual. Refresh the portfolio when evidence, dependencies, capacity, market conditions or risk changes.
14. Prioritise customer value
The value office should rank retention, service, cross-sell, pricing, channel and proposition initiatives by evidence and risk. The required output is a customer-value portfolio. Record the thesis link, baseline, accountable owner, financial controller, causal mechanism, dependencies, timing, confidence, evidence and approval status [14][21].
Translate the driver into a controlled 100-day initiative. Define the operational action, stakeholder consequence, leading indicator, realised-value measure, cash requirement, release gate, fallback and stop condition. Connect customer, workforce, supplier, data, technology, control and regulatory effects.
The principal risk is that revenue ambition can damage trust through premature migration or contact. Quantify gross value, dis-synergies, one-time cost, working capital, tax, time to impact, probability, capacity demand and residual risk across base, delayed, disrupted and remediated scenarios.
Retain source data, calculations, approvals, decision records, test results, exceptions and forecast changes. Reconcile reported delivery to the transaction baseline and counterfactual. Refresh the portfolio when evidence, dependencies, capacity, market conditions or risk changes.
15. Sequence revenue synergies
The value office should verify account overlap, permissions, product fit, sales capacity, incentives, pipeline and delivery. The required output is a gated revenue-synergy plan. Record the thesis link, baseline, accountable owner, financial controller, causal mechanism, dependencies, timing, confidence, evidence and approval status [3][22].
Translate the driver into a controlled 100-day initiative. Define the operational action, stakeholder consequence, leading indicator, realised-value measure, cash requirement, release gate, fallback and stop condition. Connect customer, workforce, supplier, data, technology, control and regulatory effects.
The principal risk is that double counting and capacity constraints can inflate the commercial case. Quantify gross value, dis-synergies, one-time cost, working capital, tax, time to impact, probability, capacity demand and residual risk across base, delayed, disrupted and remediated scenarios.
Retain source data, calculations, approvals, decision records, test results, exceptions and forecast changes. Reconcile reported delivery to the transaction baseline and counterfactual. Refresh the portfolio when evidence, dependencies, capacity, market conditions or risk changes.
16. Sequence procurement value
The value office should separate addressable spend, contractual timing, demand change, price, specification and supplier resilience. The required output is a procurement release roadmap. Record the thesis link, baseline, accountable owner, financial controller, causal mechanism, dependencies, timing, confidence, evidence and approval status [23][24].
Translate the driver into a controlled 100-day initiative. Define the operational action, stakeholder consequence, leading indicator, realised-value measure, cash requirement, release gate, fallback and stop condition. Connect customer, workforce, supplier, data, technology, control and regulatory effects.
The principal risk is that headline savings can create concentration, quality or continuity risk. Quantify gross value, dis-synergies, one-time cost, working capital, tax, time to impact, probability, capacity demand and residual risk across base, delayed, disrupted and remediated scenarios.
Retain source data, calculations, approvals, decision records, test results, exceptions and forecast changes. Reconcile reported delivery to the transaction baseline and counterfactual. Refresh the portfolio when evidence, dependencies, capacity, market conditions or risk changes.
17. Sequence workforce value
The value office should connect organisation layers, roles, consultation, selection, retention, productivity and capability. The required output is a lawful workforce transition plan. Record the thesis link, baseline, accountable owner, financial controller, causal mechanism, dependencies, timing, confidence, evidence and approval status [25][26].
Translate the driver into a controlled 100-day initiative. Define the operational action, stakeholder consequence, leading indicator, realised-value measure, cash requirement, release gate, fallback and stop condition. Connect customer, workforce, supplier, data, technology, control and regulatory effects.
The principal risk is that premature targets can prejudice process and remove scarce skills. Quantify gross value, dis-synergies, one-time cost, working capital, tax, time to impact, probability, capacity demand and residual risk across base, delayed, disrupted and remediated scenarios.
Retain source data, calculations, approvals, decision records, test results, exceptions and forecast changes. Reconcile reported delivery to the transaction baseline and counterfactual. Refresh the portfolio when evidence, dependencies, capacity, market conditions or risk changes.
18. Sequence footprint changes
The value office should map property rights, capacity, location needs, customer service, workforce mobility and exit cost. The required output is a facilities value plan. Record the thesis link, baseline, accountable owner, financial controller, causal mechanism, dependencies, timing, confidence, evidence and approval status [16][27].
Translate the driver into a controlled 100-day initiative. Define the operational action, stakeholder consequence, leading indicator, realised-value measure, cash requirement, release gate, fallback and stop condition. Connect customer, workforce, supplier, data, technology, control and regulatory effects.
The principal risk is that site consolidation can realise accounting savings while disrupting operations. Quantify gross value, dis-synergies, one-time cost, working capital, tax, time to impact, probability, capacity demand and residual risk across base, delayed, disrupted and remediated scenarios.
Retain source data, calculations, approvals, decision records, test results, exceptions and forecast changes. Reconcile reported delivery to the transaction baseline and counterfactual. Refresh the portfolio when evidence, dependencies, capacity, market conditions or risk changes.
19. Sequence technology value
The value office should rank interoperability, migration, retirement, automation and data initiatives by business dependency. The required output is a technology value portfolio. Record the thesis link, baseline, accountable owner, financial controller, causal mechanism, dependencies, timing, confidence, evidence and approval status [17][28].
Translate the driver into a controlled 100-day initiative. Define the operational action, stakeholder consequence, leading indicator, realised-value measure, cash requirement, release gate, fallback and stop condition. Connect customer, workforce, supplier, data, technology, control and regulatory effects.
The principal risk is that technology savings can arrive after expensive migration and control risk. Quantify gross value, dis-synergies, one-time cost, working capital, tax, time to impact, probability, capacity demand and residual risk across base, delayed, disrupted and remediated scenarios.
Retain source data, calculations, approvals, decision records, test results, exceptions and forecast changes. Reconcile reported delivery to the transaction baseline and counterfactual. Refresh the portfolio when evidence, dependencies, capacity, market conditions or risk changes.
20. Sequence data and AI value
The value office should define lawful data use, quality, model purpose, human oversight, evaluation and operating ownership. The required output is a governed data-and-AI release plan. Record the thesis link, baseline, accountable owner, financial controller, causal mechanism, dependencies, timing, confidence, evidence and approval status [29][30].
Translate the driver into a controlled 100-day initiative. Define the operational action, stakeholder consequence, leading indicator, realised-value measure, cash requirement, release gate, fallback and stop condition. Connect customer, workforce, supplier, data, technology, control and regulatory effects.
The principal risk is that rapid experimentation can create privacy, bias, security or decision risk. Quantify gross value, dis-synergies, one-time cost, working capital, tax, time to impact, probability, capacity demand and residual risk across base, delayed, disrupted and remediated scenarios.
Retain source data, calculations, approvals, decision records, test results, exceptions and forecast changes. Reconcile reported delivery to the transaction baseline and counterfactual. Refresh the portfolio when evidence, dependencies, capacity, market conditions or risk changes.
21. Release working-capital value
The value office should target receivables, inventory, payables, billing, disputes and terms without destabilising stakeholders. The required output is a cash-release control plan. Record the thesis link, baseline, accountable owner, financial controller, causal mechanism, dependencies, timing, confidence, evidence and approval status [31][32].
Translate the driver into a controlled 100-day initiative. Define the operational action, stakeholder consequence, leading indicator, realised-value measure, cash requirement, release gate, fallback and stop condition. Connect customer, workforce, supplier, data, technology, control and regulatory effects.
The principal risk is that one-time cash extraction can impair service or supplier viability. Quantify gross value, dis-synergies, one-time cost, working capital, tax, time to impact, probability, capacity demand and residual risk across base, delayed, disrupted and remediated scenarios.
Retain source data, calculations, approvals, decision records, test results, exceptions and forecast changes. Reconcile reported delivery to the transaction baseline and counterfactual. Refresh the portfolio when evidence, dependencies, capacity, market conditions or risk changes.
22. Protect financing headroom
The value office should connect initiative cash, covenant definitions, liquidity, hedging, guarantees and refinancing windows. The required output is a financed integration curve. Record the thesis link, baseline, accountable owner, financial controller, causal mechanism, dependencies, timing, confidence, evidence and approval status [33][34].
Translate the driver into a controlled 100-day initiative. Define the operational action, stakeholder consequence, leading indicator, realised-value measure, cash requirement, release gate, fallback and stop condition. Connect customer, workforce, supplier, data, technology, control and regulatory effects.
The principal risk is that economic value can be lost through avoidable liquidity or covenant pressure. Quantify gross value, dis-synergies, one-time cost, working capital, tax, time to impact, probability, capacity demand and residual risk across base, delayed, disrupted and remediated scenarios.
Retain source data, calculations, approvals, decision records, test results, exceptions and forecast changes. Reconcile reported delivery to the transaction baseline and counterfactual. Refresh the portfolio when evidence, dependencies, capacity, market conditions or risk changes.
23. Measure capability value
The value office should identify scarce talent, intellectual property, operating routines, partnerships and learning speed. The required output is a capability preservation scorecard. Record the thesis link, baseline, accountable owner, financial controller, causal mechanism, dependencies, timing, confidence, evidence and approval status [2][25].
Translate the driver into a controlled 100-day initiative. Define the operational action, stakeholder consequence, leading indicator, realised-value measure, cash requirement, release gate, fallback and stop condition. Connect customer, workforce, supplier, data, technology, control and regulatory effects.
The principal risk is that cost reduction can destroy the assets that justified the acquisition. Quantify gross value, dis-synergies, one-time cost, working capital, tax, time to impact, probability, capacity demand and residual risk across base, delayed, disrupted and remediated scenarios.
Retain source data, calculations, approvals, decision records, test results, exceptions and forecast changes. Reconcile reported delivery to the transaction baseline and counterfactual. Refresh the portfolio when evidence, dependencies, capacity, market conditions or risk changes.
24. Measure resilience value
The value office should quantify reduced outage exposure, supplier risk, cyber loss, recovery time and regulatory vulnerability. The required output is a resilience-value case. Record the thesis link, baseline, accountable owner, financial controller, causal mechanism, dependencies, timing, confidence, evidence and approval status [16][28].
Translate the driver into a controlled 100-day initiative. Define the operational action, stakeholder consequence, leading indicator, realised-value measure, cash requirement, release gate, fallback and stop condition. Connect customer, workforce, supplier, data, technology, control and regulatory effects.
The principal risk is that risk reduction can be omitted because it does not look like immediate EBITDA. Quantify gross value, dis-synergies, one-time cost, working capital, tax, time to impact, probability, capacity demand and residual risk across base, delayed, disrupted and remediated scenarios.
Retain source data, calculations, approvals, decision records, test results, exceptions and forecast changes. Reconcile reported delivery to the transaction baseline and counterfactual. Refresh the portfolio when evidence, dependencies, capacity, market conditions or risk changes.
25. Value strategic options
The value office should define follow-on products, markets, acquisitions, licences and platform moves with staged evidence. The required output is an option-value register. Record the thesis link, baseline, accountable owner, financial controller, causal mechanism, dependencies, timing, confidence, evidence and approval status [2][35].
Translate the driver into a controlled 100-day initiative. Define the operational action, stakeholder consequence, leading indicator, realised-value measure, cash requirement, release gate, fallback and stop condition. Connect customer, workforce, supplier, data, technology, control and regulatory effects.
The principal risk is that strategic claims can become unlimited narratives without exercise criteria. Quantify gross value, dis-synergies, one-time cost, working capital, tax, time to impact, probability, capacity demand and residual risk across base, delayed, disrupted and remediated scenarios.
Retain source data, calculations, approvals, decision records, test results, exceptions and forecast changes. Reconcile reported delivery to the transaction baseline and counterfactual. Refresh the portfolio when evidence, dependencies, capacity, market conditions or risk changes.
26. Set the initiative release gate
The value office should require owner, baseline, mechanism, dependency, funding, risk, evidence, capacity and decision. The required output is a standard initiative business case. Record the thesis link, baseline, accountable owner, financial controller, causal mechanism, dependencies, timing, confidence, evidence and approval status [7][8].
Translate the driver into a controlled 100-day initiative. Define the operational action, stakeholder consequence, leading indicator, realised-value measure, cash requirement, release gate, fallback and stop condition. Connect customer, workforce, supplier, data, technology, control and regulatory effects.
The principal risk is that weakly formed projects can enter execution through executive enthusiasm. Quantify gross value, dis-synergies, one-time cost, working capital, tax, time to impact, probability, capacity demand and residual risk across base, delayed, disrupted and remediated scenarios.
Retain source data, calculations, approvals, decision records, test results, exceptions and forecast changes. Reconcile reported delivery to the transaction baseline and counterfactual. Refresh the portfolio when evidence, dependencies, capacity, market conditions or risk changes.
27. Quantify management capacity
The value office should map executive hours, functional bottlenecks, specialist scarcity, decision load and change absorption. The required output is a management-capacity budget. Record the thesis link, baseline, accountable owner, financial controller, causal mechanism, dependencies, timing, confidence, evidence and approval status [7][36].
Translate the driver into a controlled 100-day initiative. Define the operational action, stakeholder consequence, leading indicator, realised-value measure, cash requirement, release gate, fallback and stop condition. Connect customer, workforce, supplier, data, technology, control and regulatory effects.
The principal risk is that the portfolio can demand more leadership attention than exists. Quantify gross value, dis-synergies, one-time cost, working capital, tax, time to impact, probability, capacity demand and residual risk across base, delayed, disrupted and remediated scenarios.
Retain source data, calculations, approvals, decision records, test results, exceptions and forecast changes. Reconcile reported delivery to the transaction baseline and counterfactual. Refresh the portfolio when evidence, dependencies, capacity, market conditions or risk changes.
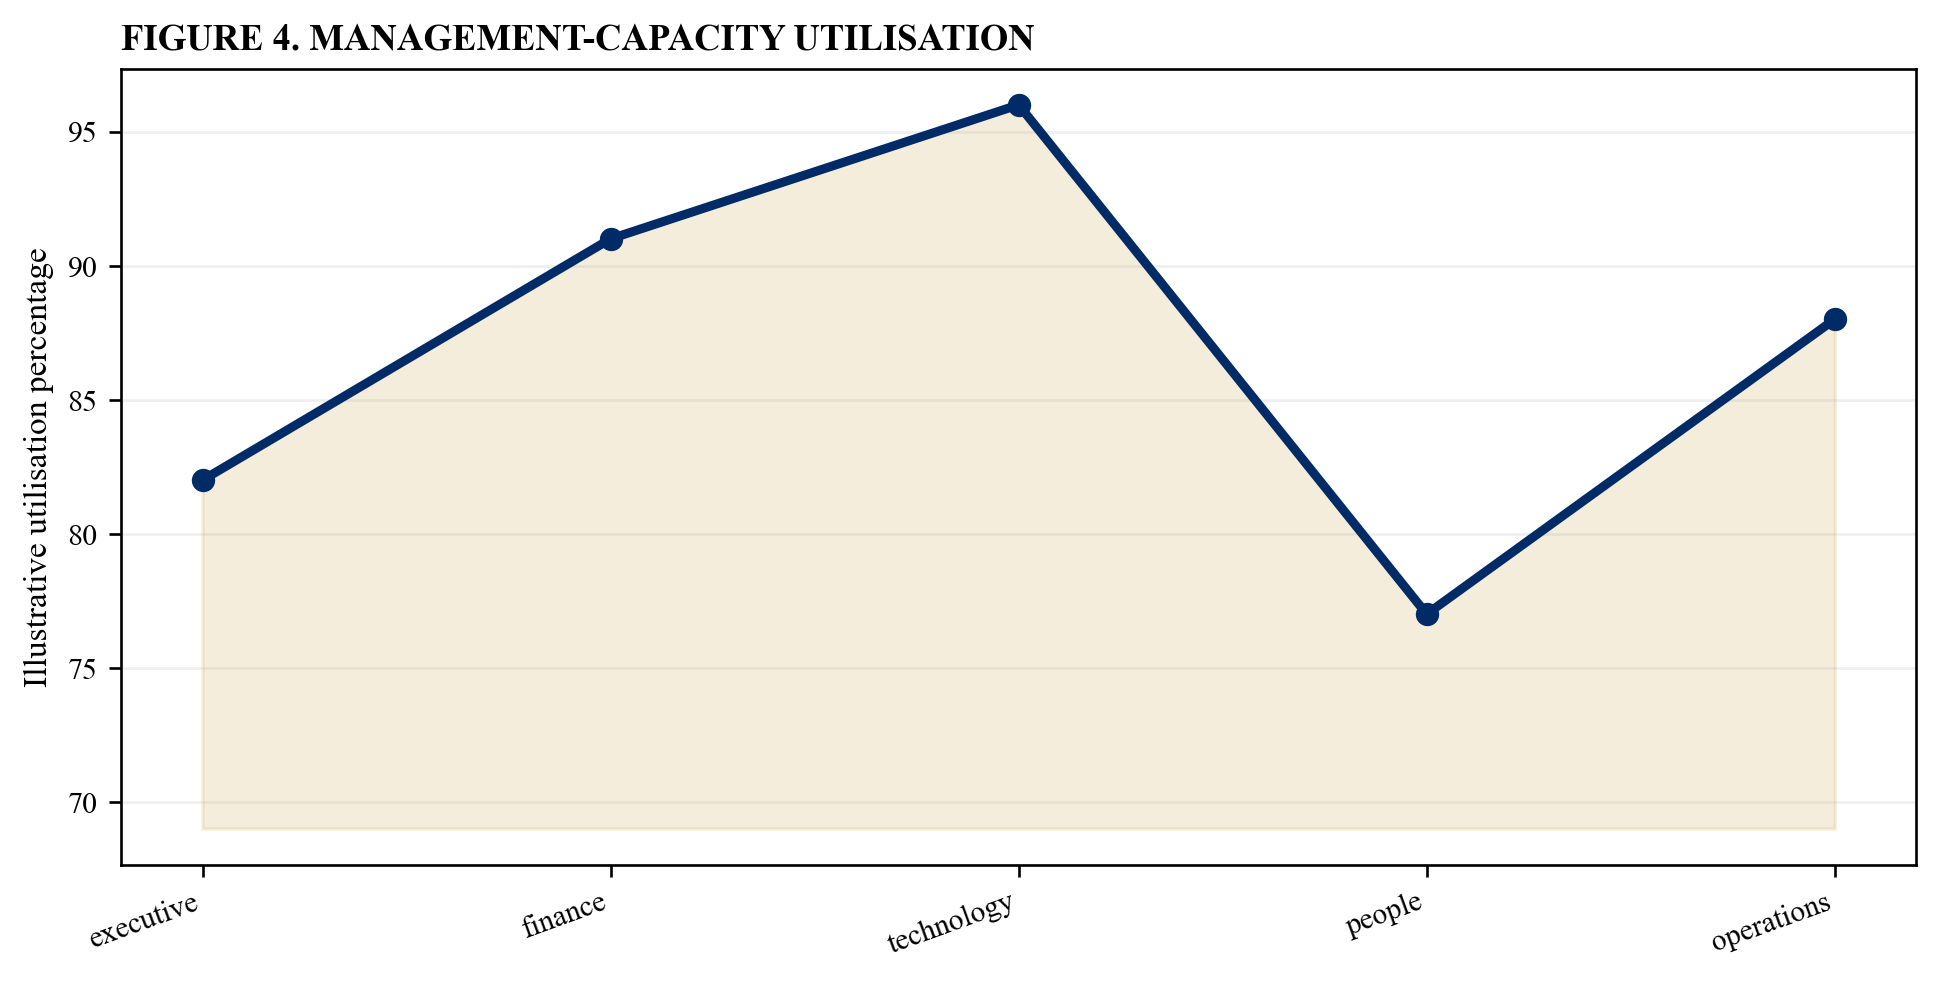
Illustrative analytical scenario; verified transaction evidence should replace index values.
28. Construct the integrated portfolio
The value office should optimise initiative mix across value, urgency, dependency, risk, capacity, cash and reversibility. The required output is a sequenced 100-day portfolio. Record the thesis link, baseline, accountable owner, financial controller, causal mechanism, dependencies, timing, confidence, evidence and approval status [8][36].
Translate the driver into a controlled 100-day initiative. Define the operational action, stakeholder consequence, leading indicator, realised-value measure, cash requirement, release gate, fallback and stop condition. Connect customer, workforce, supplier, data, technology, control and regulatory effects.
The principal risk is that local priorities can overwhelm enterprise value and critical paths. Quantify gross value, dis-synergies, one-time cost, working capital, tax, time to impact, probability, capacity demand and residual risk across base, delayed, disrupted and remediated scenarios.
Retain source data, calculations, approvals, decision records, test results, exceptions and forecast changes. Reconcile reported delivery to the transaction baseline and counterfactual. Refresh the portfolio when evidence, dependencies, capacity, market conditions or risk changes.
Table 3. Initiative priority matrix
| Dimension | High priority | Hold condition |
|---|---|---|
| value | material and evidenced | immaterial |
| urgency | value decays | window remains open |
| dependency | prerequisites ready | critical blocker |
| capacity | owner available | overloaded bottleneck |
Illustrative structure; verified transaction evidence and specialist review govern.
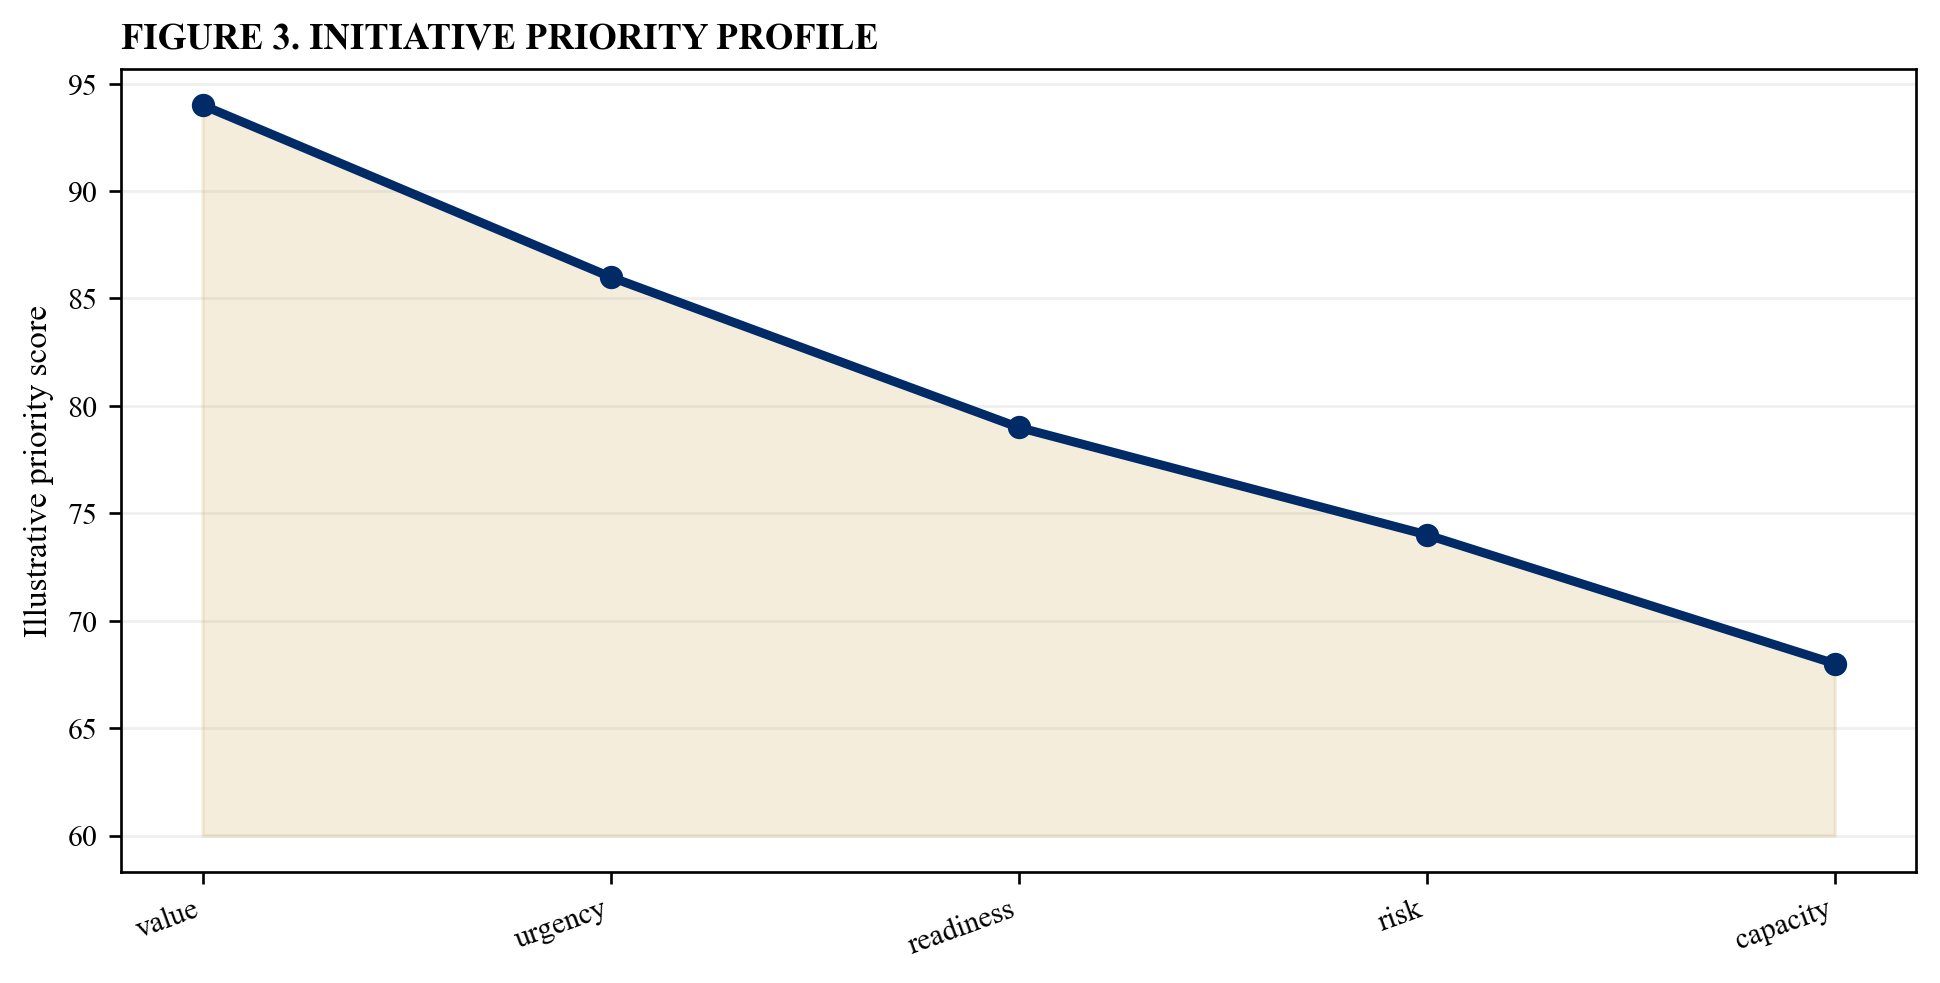
Illustrative analytical scenario; verified transaction evidence should replace index values.
29. Create decision waves
The value office should group initiatives into stabilise, prove, release, scale and institutionalise stages. The required output is a wave-based roadmap. Record the thesis link, baseline, accountable owner, financial controller, causal mechanism, dependencies, timing, confidence, evidence and approval status [16][18].
Translate the driver into a controlled 100-day initiative. Define the operational action, stakeholder consequence, leading indicator, realised-value measure, cash requirement, release gate, fallback and stop condition. Connect customer, workforce, supplier, data, technology, control and regulatory effects.
The principal risk is that calendar dates can force commitment before evidence is ready. Quantify gross value, dis-synergies, one-time cost, working capital, tax, time to impact, probability, capacity demand and residual risk across base, delayed, disrupted and remediated scenarios.
Retain source data, calculations, approvals, decision records, test results, exceptions and forecast changes. Reconcile reported delivery to the transaction baseline and counterfactual. Refresh the portfolio when evidence, dependencies, capacity, market conditions or risk changes.
30. Fund the value curve
The value office should phase one-time cost, capex, retention, working capital, advisers, contingency and benefit arrival. The required output is a cash-backed value curve. Record the thesis link, baseline, accountable owner, financial controller, causal mechanism, dependencies, timing, confidence, evidence and approval status [31][33].
Translate the driver into a controlled 100-day initiative. Define the operational action, stakeholder consequence, leading indicator, realised-value measure, cash requirement, release gate, fallback and stop condition. Connect customer, workforce, supplier, data, technology, control and regulatory effects.
The principal risk is that the programme can run out of funding before benefits mature. Quantify gross value, dis-synergies, one-time cost, working capital, tax, time to impact, probability, capacity demand and residual risk across base, delayed, disrupted and remediated scenarios.
Retain source data, calculations, approvals, decision records, test results, exceptions and forecast changes. Reconcile reported delivery to the transaction baseline and counterfactual. Refresh the portfolio when evidence, dependencies, capacity, market conditions or risk changes.
31. Align incentives to net value
The value office should connect executive and workstream measures to quality, cash, customer, control and sustained outcomes. The required output is an incentive alignment map. Record the thesis link, baseline, accountable owner, financial controller, causal mechanism, dependencies, timing, confidence, evidence and approval status [7][10].
Translate the driver into a controlled 100-day initiative. Define the operational action, stakeholder consequence, leading indicator, realised-value measure, cash requirement, release gate, fallback and stop condition. Connect customer, workforce, supplier, data, technology, control and regulatory effects.
The principal risk is that volume targets can reward gross savings or sales that erode durable value. Quantify gross value, dis-synergies, one-time cost, working capital, tax, time to impact, probability, capacity demand and residual risk across base, delayed, disrupted and remediated scenarios.
Retain source data, calculations, approvals, decision records, test results, exceptions and forecast changes. Reconcile reported delivery to the transaction baseline and counterfactual. Refresh the portfolio when evidence, dependencies, capacity, market conditions or risk changes.
32. Govern assumptions and changes
The value office should version baselines, market conditions, operating facts, scope, timing, confidence and approvals. The required output is a controlled assumption register. Record the thesis link, baseline, accountable owner, financial controller, causal mechanism, dependencies, timing, confidence, evidence and approval status [4][11].
Translate the driver into a controlled 100-day initiative. Define the operational action, stakeholder consequence, leading indicator, realised-value measure, cash requirement, release gate, fallback and stop condition. Connect customer, workforce, supplier, data, technology, control and regulatory effects.
The principal risk is that forecast changes can obscure underperformance or create silent value drift. Quantify gross value, dis-synergies, one-time cost, working capital, tax, time to impact, probability, capacity demand and residual risk across base, delayed, disrupted and remediated scenarios.
Retain source data, calculations, approvals, decision records, test results, exceptions and forecast changes. Reconcile reported delivery to the transaction baseline and counterfactual. Refresh the portfolio when evidence, dependencies, capacity, market conditions or risk changes.
33. Operate the value office
The value office should combine integration, strategy, finance, risk and operations into one decision and assurance rhythm. The required output is a value-office operating model. Record the thesis link, baseline, accountable owner, financial controller, causal mechanism, dependencies, timing, confidence, evidence and approval status [7][8].
Translate the driver into a controlled 100-day initiative. Define the operational action, stakeholder consequence, leading indicator, realised-value measure, cash requirement, release gate, fallback and stop condition. Connect customer, workforce, supplier, data, technology, control and regulatory effects.
The principal risk is that separate PMO and finance views can disagree on what has been delivered. Quantify gross value, dis-synergies, one-time cost, working capital, tax, time to impact, probability, capacity demand and residual risk across base, delayed, disrupted and remediated scenarios.
Retain source data, calculations, approvals, decision records, test results, exceptions and forecast changes. Reconcile reported delivery to the transaction baseline and counterfactual. Refresh the portfolio when evidence, dependencies, capacity, market conditions or risk changes.
Table 4. Management-capacity portfolio
| Resource | Demand signal | Portfolio response |
|---|---|---|
| executive | decision backlog | reduce concurrency |
| technology | critical-path queue | sequence interfaces |
| finance | baseline exceptions | pause claims |
| change | stakeholder saturation | stage releases |
Illustrative structure; verified transaction evidence and specialist review govern.
34. Escalate value leakage
The value office should define thresholds for customer loss, attrition, cost overrun, delay, control failure and forecast deterioration. The required output is a leakage escalation protocol. Record the thesis link, baseline, accountable owner, financial controller, causal mechanism, dependencies, timing, confidence, evidence and approval status [7][37].
Translate the driver into a controlled 100-day initiative. Define the operational action, stakeholder consequence, leading indicator, realised-value measure, cash requirement, release gate, fallback and stop condition. Connect customer, workforce, supplier, data, technology, control and regulatory effects.
The principal risk is that bad news can remain inside workstreams until recovery options narrow. Quantify gross value, dis-synergies, one-time cost, working capital, tax, time to impact, probability, capacity demand and residual risk across base, delayed, disrupted and remediated scenarios.
Retain source data, calculations, approvals, decision records, test results, exceptions and forecast changes. Reconcile reported delivery to the transaction baseline and counterfactual. Refresh the portfolio when evidence, dependencies, capacity, market conditions or risk changes.
35. Reforecast the thesis
The value office should update expected value and timing from verified operating evidence without rewriting history. The required output is a rolling thesis forecast. Record the thesis link, baseline, accountable owner, financial controller, causal mechanism, dependencies, timing, confidence, evidence and approval status [4][5].
Translate the driver into a controlled 100-day initiative. Define the operational action, stakeholder consequence, leading indicator, realised-value measure, cash requirement, release gate, fallback and stop condition. Connect customer, workforce, supplier, data, technology, control and regulatory effects.
The principal risk is that static board targets can become detached from current economics. Quantify gross value, dis-synergies, one-time cost, working capital, tax, time to impact, probability, capacity demand and residual risk across base, delayed, disrupted and remediated scenarios.
Retain source data, calculations, approvals, decision records, test results, exceptions and forecast changes. Reconcile reported delivery to the transaction baseline and counterfactual. Refresh the portfolio when evidence, dependencies, capacity, market conditions or risk changes.
36. Communicate performance responsibly
The value office should separate achieved, run-rate, forecast, avoided loss and option value with reconciliations. The required output is a decision-useful performance pack. Record the thesis link, baseline, accountable owner, financial controller, causal mechanism, dependencies, timing, confidence, evidence and approval status [5][10].
Translate the driver into a controlled 100-day initiative. Define the operational action, stakeholder consequence, leading indicator, realised-value measure, cash requirement, release gate, fallback and stop condition. Connect customer, workforce, supplier, data, technology, control and regulatory effects.
The principal risk is that ambiguous measures can mislead boards, lenders and investors. Quantify gross value, dis-synergies, one-time cost, working capital, tax, time to impact, probability, capacity demand and residual risk across base, delayed, disrupted and remediated scenarios.
Retain source data, calculations, approvals, decision records, test results, exceptions and forecast changes. Reconcile reported delivery to the transaction baseline and counterfactual. Refresh the portfolio when evidence, dependencies, capacity, market conditions or risk changes.
37. Prepare the Day 30 review
The value office should test stabilisation, baseline quality, owner readiness, capacity and early evidence. The required output is a Day 30 release decision. Record the thesis link, baseline, accountable owner, financial controller, causal mechanism, dependencies, timing, confidence, evidence and approval status [7][16].
Translate the driver into a controlled 100-day initiative. Define the operational action, stakeholder consequence, leading indicator, realised-value measure, cash requirement, release gate, fallback and stop condition. Connect customer, workforce, supplier, data, technology, control and regulatory effects.
The principal risk is that the programme can scale before its measurement and control system works. Quantify gross value, dis-synergies, one-time cost, working capital, tax, time to impact, probability, capacity demand and residual risk across base, delayed, disrupted and remediated scenarios.
Retain source data, calculations, approvals, decision records, test results, exceptions and forecast changes. Reconcile reported delivery to the transaction baseline and counterfactual. Refresh the portfolio when evidence, dependencies, capacity, market conditions or risk changes.
38. Prepare the Day 60 review
The value office should test delivery mechanisms, leading indicators, leakage, dependency movement and funding. The required output is a Day 60 portfolio rebalance. Record the thesis link, baseline, accountable owner, financial controller, causal mechanism, dependencies, timing, confidence, evidence and approval status [8][36].
Translate the driver into a controlled 100-day initiative. Define the operational action, stakeholder consequence, leading indicator, realised-value measure, cash requirement, release gate, fallback and stop condition. Connect customer, workforce, supplier, data, technology, control and regulatory effects.
The principal risk is that teams can continue low-value initiatives because stopping feels like failure. Quantify gross value, dis-synergies, one-time cost, working capital, tax, time to impact, probability, capacity demand and residual risk across base, delayed, disrupted and remediated scenarios.
Retain source data, calculations, approvals, decision records, test results, exceptions and forecast changes. Reconcile reported delivery to the transaction baseline and counterfactual. Refresh the portfolio when evidence, dependencies, capacity, market conditions or risk changes.
39. Prepare the Day 100 review
The value office should reconcile realised value, run rate, forecast, confidence, capability, risk and next-wave choices. The required output is a board value-realisation review. Record the thesis link, baseline, accountable owner, financial controller, causal mechanism, dependencies, timing, confidence, evidence and approval status [4][7].
Translate the driver into a controlled 100-day initiative. Define the operational action, stakeholder consequence, leading indicator, realised-value measure, cash requirement, release gate, fallback and stop condition. Connect customer, workforce, supplier, data, technology, control and regulatory effects.
The principal risk is that completion reporting can replace an honest economic assessment. Quantify gross value, dis-synergies, one-time cost, working capital, tax, time to impact, probability, capacity demand and residual risk across base, delayed, disrupted and remediated scenarios.
Retain source data, calculations, approvals, decision records, test results, exceptions and forecast changes. Reconcile reported delivery to the transaction baseline and counterfactual. Refresh the portfolio when evidence, dependencies, capacity, market conditions or risk changes.
40. Issue the 100-day value certificate
The value office should retain the thesis, baseline, initiatives, economics, evidence, changes, exceptions and residual risk. The required output is a closing value certificate. Record the thesis link, baseline, accountable owner, financial controller, causal mechanism, dependencies, timing, confidence, evidence and approval status [1][8].
Translate the driver into a controlled 100-day initiative. Define the operational action, stakeholder consequence, leading indicator, realised-value measure, cash requirement, release gate, fallback and stop condition. Connect customer, workforce, supplier, data, technology, control and regulatory effects.
The principal risk is that leaders can declare success without an auditable bridge to the deal case. Quantify gross value, dis-synergies, one-time cost, working capital, tax, time to impact, probability, capacity demand and residual risk across base, delayed, disrupted and remediated scenarios.
Retain source data, calculations, approvals, decision records, test results, exceptions and forecast changes. Reconcile reported delivery to the transaction baseline and counterfactual. Refresh the portfolio when evidence, dependencies, capacity, market conditions or risk changes.
Table 5. 100-day value certificate
| Conclusion | Retained evidence | Acceptance |
|---|---|---|
| thesis | driver chain | reconciled |
| economics | net-value bridge | controlled |
| delivery | initiative evidence | verified |
| outlook | forecast and risk | approved |
Illustrative structure; verified transaction evidence and specialist review govern.
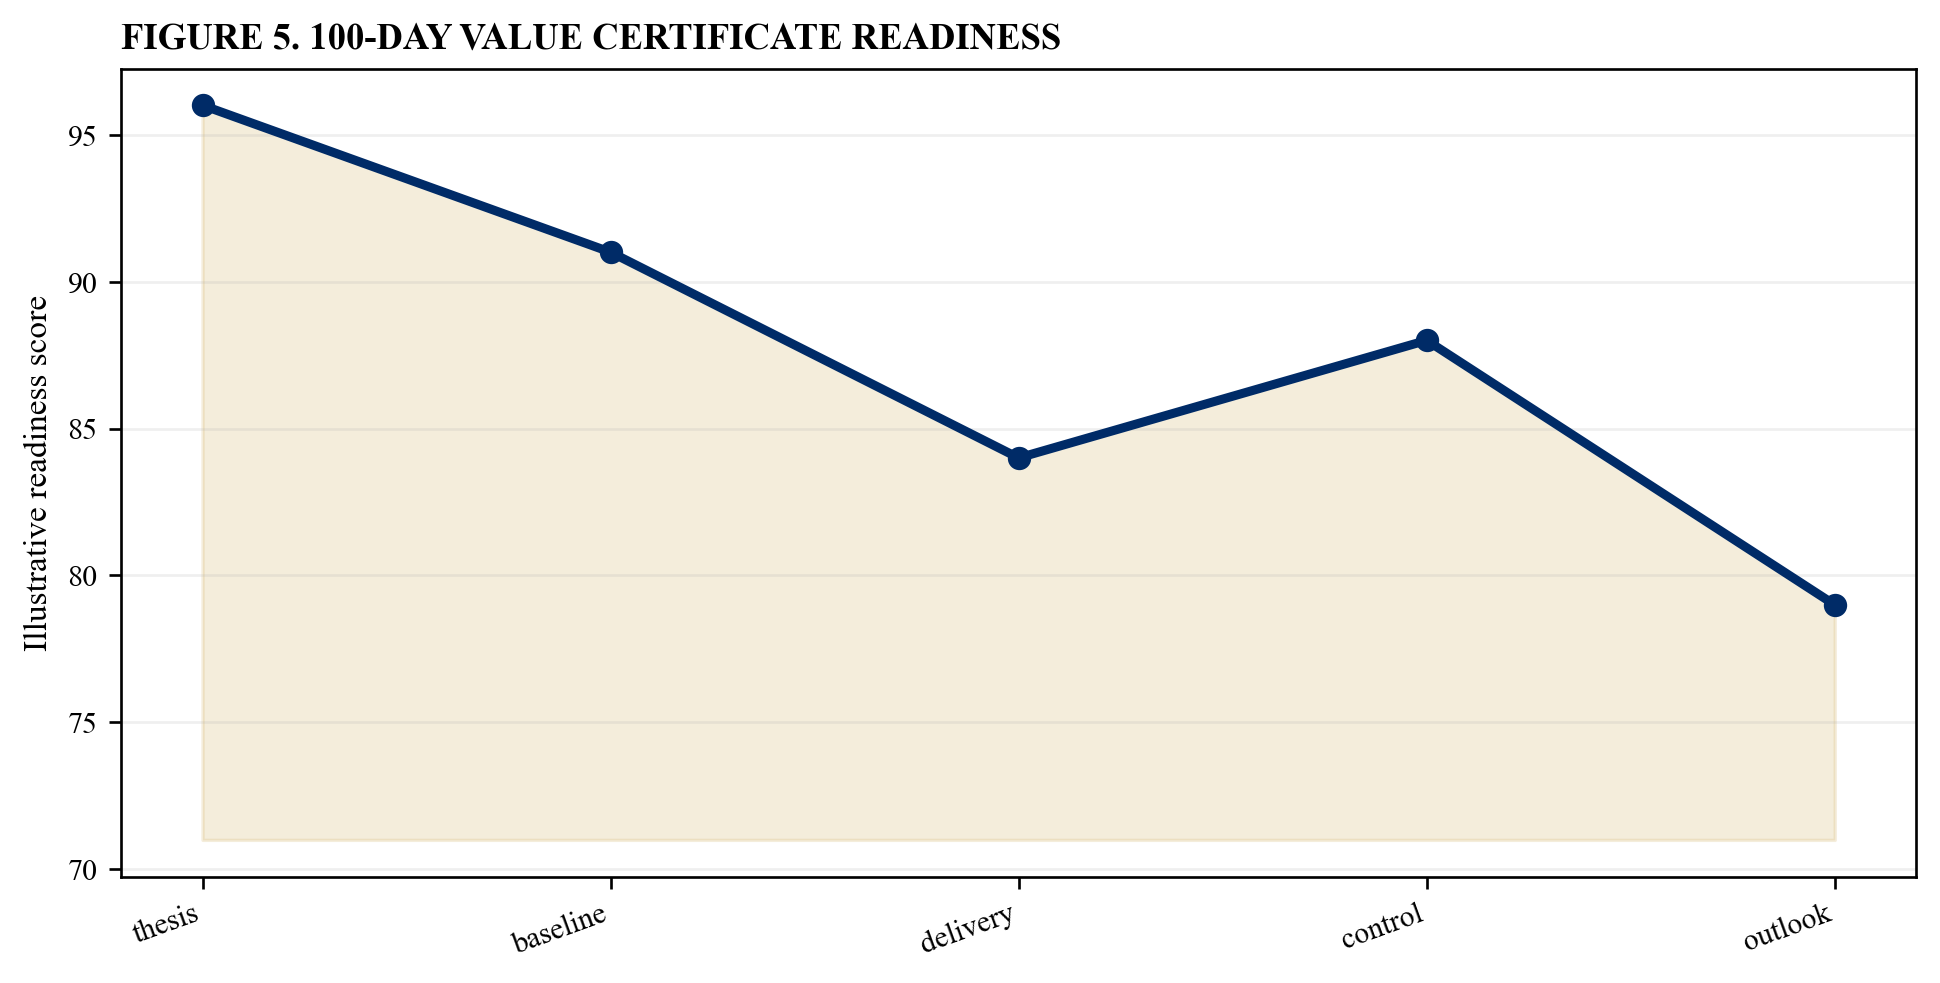
Illustrative analytical scenario; verified transaction evidence should replace index values.
References
- IFRS Foundation, IFRS 3 Business Combinations, https://www.ifrs.org/issued-standards/list-of-standards/ifrs-3-business-combinations/
- IFRS Foundation, Business Combinations Disclosures Goodwill and Impairment Project, https://www.ifrs.org/projects/work-plan/goodwill-and-impairment/
- IFRS Foundation, IFRS 15 Revenue from Contracts with Customers, https://www.ifrs.org/issued-standards/list-of-standards/ifrs-15-revenue-from-contracts-with-customers/
- IFRS Foundation, IAS 36 Impairment of Assets, https://www.ifrs.org/issued-standards/list-of-standards/ias-36-impairment-of-assets/
- US Securities and Exchange Commission, Management Discussion and Analysis Guidance, https://www.sec.gov/rules-regulations/2003/12/interpretation-commission-guidance-regarding-managements-discussion-analysis-financial-condition
- IFRS Foundation, IFRS Practice Statement 1 Management Commentary, https://www.ifrs.org/issued-standards/list-of-standards/management-commentary-practice-statement/
- UK Financial Reporting Council, UK Corporate Governance Code 2024, https://www.frc.org.uk/library/standards-codes-policy/corporate-governance/uk-corporate-governance-code/
- UK Financial Reporting Council, Corporate Governance Code Guidance, https://www.frc.org.uk/library/standards-codes-policy/corporate-governance/corporate-governance-code-guidance/
- US Government Accountability Office, Business Process Reengineering Assessment Guide, https://www.gao.gov/products/aimd-10.1.15
- IFRS Foundation, IFRS 18 Presentation and Disclosure in Financial Statements, https://www.ifrs.org/issued-standards/list-of-standards/ifrs-18-presentation-and-disclosure-in-financial-statements/
- Committee of Sponsoring Organizations of the Treadway Commission, Internal Control Integrated Framework, https://www.coso.org/internal-control
- IFRS Foundation, IAS 12 Income Taxes, https://www.ifrs.org/issued-standards/list-of-standards/ias-12-income-taxes/
- UK Government, The Green Book, https://www.gov.uk/government/publications/the-green-book-appraisal-and-evaluation-in-central-government
- UK Competition and Markets Authority, Consumer Protection from Unfair Trading Regulations Guidance, https://www.gov.uk/government/publications/consumer-protection-from-unfair-trading-regulations-traders
- IFRS Foundation, IFRS 8 Operating Segments, https://www.ifrs.org/issued-standards/list-of-standards/ifrs-8-operating-segments/
- UK Government, UK Government Resilience Framework, https://www.gov.uk/government/publications/the-uk-government-resilience-framework
- National Institute of Standards and Technology, SP 800-161 Rev. 1 Cybersecurity Supply Chain Risk Management, https://csrc.nist.gov/pubs/sp/800/161/r1/final
- International Organization for Standardization, ISO 22301 Business Continuity Management Systems, https://www.iso.org/standard/75106.html
- UK Competition and Markets Authority, Interim Measures in Merger Investigations, https://www.gov.uk/government/publications/interim-measures-and-derogations-guidance-and-templates
- UK Financial Conduct Authority, Operational Resilience, https://www.fca.org.uk/firms/operational-resilience
- UK Competition and Markets Authority, Green Claims Code, https://greenclaims.campaign.gov.uk/
- European Commission, EU Merger Control Procedures, https://competition-policy.ec.europa.eu/mergers/procedures_en
- UK Cabinet Office, Sourcing Playbook, https://www.gov.uk/government/publications/the-sourcing-playbook
- National Institute of Standards and Technology, SP 1326 Cybersecurity Supply Chain Due Diligence, https://csrc.nist.gov/pubs/sp/1326/final
- European Union, Directive 2002/14/EC on Informing and Consulting Employees, https://eur-lex.europa.eu/eli/dir/2002/14/oj
- UK Government, Business Transfers Takeovers and TUPE, https://www.gov.uk/transfers-takeovers
- IFRS Foundation, IFRS 16 Leases, https://www.ifrs.org/issued-standards/list-of-standards/ifrs-16-leases/
- National Institute of Standards and Technology, Cybersecurity Framework 2.0, https://www.nist.gov/cyberframework
- European Union, General Data Protection Regulation, https://eur-lex.europa.eu/eli/reg/2016/679/oj
- National Institute of Standards and Technology, AI Risk Management Framework, https://www.nist.gov/itl/ai-risk-management-framework
- IFRS Foundation, IAS 7 Statement of Cash Flows, https://www.ifrs.org/issued-standards/list-of-standards/ias-7-statement-of-cash-flows/
- IFRS Foundation, IFRS 9 Financial Instruments, https://www.ifrs.org/issued-standards/list-of-standards/ifrs-9-financial-instruments/
- UK Financial Conduct Authority, Financial Resilience, https://www.fca.org.uk/firms/financial-resilience
- Bank of England, Financial Policy Committee, https://www.bankofengland.co.uk/about/people/financial-policy-committee
- OECD, Guidelines for Multinational Enterprises on Responsible Business Conduct, https://mneguidelines.oecd.org/mneguidelines/
- US Government Accountability Office, Cost Estimating and Assessment Guide, https://www.gao.gov/products/gao-20-195g
- US Department of Justice, Evaluation of Corporate Compliance Programs, https://www.justice.gov/criminal/criminal-fraud/page/file/937501/dl
