

1. Define the board decision
The relevant decision is how to change a supply network while keeping customers supplied, cash controlled and regulatory obligations met. It is broader than finding an alternative vendor. Management must decide which dependencies require immediate protection, which routes can be changed, how much inventory to hold during transition, which customers need approval, and what evidence permits the company to retire an existing source. These decisions interact. A cheaper supplier can require a longer route, a larger order quantity, new tooling, more working capital and a customer requalification.
The control tower is a decision system. It gives the chief executive, chief financial officer, chief operating officer and business leaders one reconciled view of material products, suppliers, routes, customer commitments and cash. It should identify the decision authority and the evidence behind each recommendation. It should also preserve specialist conclusions. Customs classification, sanctions, tax, product certification, insurance and legal interpretation remain with suitably qualified and authorised advisers.
Recent public evidence supports a disciplined response. The OECD reports that broad relocalisation can impose material economic costs and does not consistently improve resilience. Its modelling indicates that full relocalisation scenarios could reduce global trade by more than 18 percent and global real GDP by more than 5 percent. The strategic implication is selective redesign based on actual dependencies, substitutability and consequences rather than a blanket domestic-sourcing rule. [1]
The board should therefore approve a risk appetite and a transition mandate. The mandate should define critical product families, minimum service levels, liquidity limits, jurisdictions, excluded counterparties, escalation thresholds and decision rights. It should also state whether the objective is continuity, compliance, margin protection, strategic autonomy, customer assurance or a combination. A clear objective prevents teams from using a geopolitical label to justify unrelated inventory growth or supplier changes.
2. Build a complete supply-chain population
A reliable control tower begins with population completeness. The company should reconcile procurement records, supplier contracts, bills of material, purchase orders, customs entries, freight records, warehouse balances, quality systems, production plans, customer orders, insurance schedules and treasury forecasts. Product families should connect to the components and services whose absence would stop delivery or create a legal, safety or quality failure.
Each material line needs a stable identifier, legal entity, product, component, supplier, production site, country of origin, route, port, carrier, Incoterm, tariff code, duty, insurance basis, lead time, order quantity, payment term, currency, quality approval, customer approval, inventory position, open orders and substitution status. The record should point to source evidence. A dashboard entry without traceable documents supplies visibility but cannot support a consequential decision.
Completeness includes indirect dependencies. A direct supplier in India can rely on a single sub-tier producer elsewhere for a specialised input. A UK distributor can hold inventory sourced from a concentrated overseas manufacturer. A GCC final-assembly site can depend on one software licence, inspection provider, packaging supplier or port service. The OECD review emphasises global value-chain interdependencies and import concentration. A first-tier supplier list alone can miss the actual point of failure. [1]
The population also needs commercial demand. Map each product to customer contracts, service-level commitments, backlog, forecast, contribution margin, penalties, renewal dates and strategic accounts. The same unavailable component can have a different consequence across customers. This connection allows management to prioritise continuity where the cash and relationship impact are greatest.
| Decision field | Minimum evidence | Decision use | Primary challenge |
|---|---|---|---|
| Product and dependency | Bill of material, specification, sub-tier map and approved alternatives | Identify the operational point of failure | Engineering, operations and quality |
| Supplier and origin | Contract, site, ownership, country of origin and capacity record | Test concentration, eligibility and substitutability | Procurement, legal and compliance |
| Route and border | Incoterm, carrier, ports, transit time, customs entry and insurance | Quantify route, custody and clearance exposure | Logistics, customs and insurance |
| Demand and customer | Order, forecast, backlog, margin, service level and approval requirement | Prioritise continuity and customer consent | Commercial and finance |
| Inventory and cash | On-hand, in-transit, safety stock, payment terms, borrowing base and liquidity | Fund the transition without obscuring cash | Finance, treasury and warehouse control |
| Decision authority | Risk appetite, approval limit, exception and evidence date | Route action to the authorised person | Company secretary, legal and executive sponsor |
Original framework. Fields should be adapted to the company's products, jurisdictions, systems and delegated authorities.
3. Distinguish disruption, concentration and compliance
Three exposures should be recorded separately. Disruption exposure concerns whether materials or services arrive in time. Concentration exposure concerns dependence on a supplier, site, country, port, corridor, carrier or technology. Compliance exposure concerns whether the transaction, product, counterparty, origin, documentation and payment remain permissible. A network can be operationally reliable and legally unusable. It can also be compliant while remaining exposed to a single port or sub-tier producer.
Concentration should be measured at several levels. Supplier spend concentration is useful but incomplete. Calculate the share of critical volume, unique tooling, approved capacity and customer-dependent revenue tied to each node. A low-spend component can stop a high-value system. A large supplier can operate several independent sites. The control tower should display the physical and commercial dependency rather than treating vendor name as the only unit.
Disruption should use event-specific pathways. Red Sea rerouting, port closure, export restriction, cyber incident, labour action, flood, power shortage and carrier withdrawal affect lead time and capacity differently. UN Trade and Development reports that rerouting extended voyages, increased operating costs and reduced effective shipping capacity. It also reported that ton-miles rose 5.9 percent in 2024 while maritime trade volume grew 2.2 percent, showing how route distance can move differently from cargo volume. [2]
Compliance needs a dated conclusion and an owner. Product classification, rules of origin, sanctions, export controls, anti-dumping measures, carbon reporting and import permits can change. The European Union's Carbon Border Adjustment Mechanism entered its definitive regime on 1 January 2026 for covered sectors. The control tower should therefore connect product and origin data to current regulatory review rather than storing a permanent green flag. [3]
The IMF's analysis of fragmenting trade patterns distinguishes genuine production reallocation from trade rerouting through connector countries. It finds that reported trade shifts can reflect domestic-market growth and supply-chain reconfiguration as well as transshipment. [9] Management should therefore verify origin, value added, capacity and physical flow before describing a new source as independent diversification.
4. Map the network as decisions and dependencies
A useful network map shows where management can act. Nodes should represent approved suppliers, production sites, consolidation points, ports, warehouses, service providers and customer destinations. Links should show material movement, information, payment and approval. Each node and link should carry capacity, lead time, variability, inventory, contractual control and an alternative path.
The map should identify single points of failure and correlated alternatives. Two suppliers in the same industrial zone can share power, water, port and sub-tier dependencies. Two shipping routes can converge at the same transshipment hub. Two components can use the same specialist testing laboratory. A resilience claim based on supplier count can overstate diversification when the underlying failure modes are shared.
The hypothetical case below has a GCC assembly and distribution hub, two Indian production clusters, one UK specialist-component supplier, regional ports and three customer markets. The baseline relies on a concentrated component family and a dominant maritime corridor. The proposed design qualifies a second Indian source, retains the UK source for high-specification products, and adds an alternative Gulf entry point. This is an analytical illustration and describes no actual company or route decision.
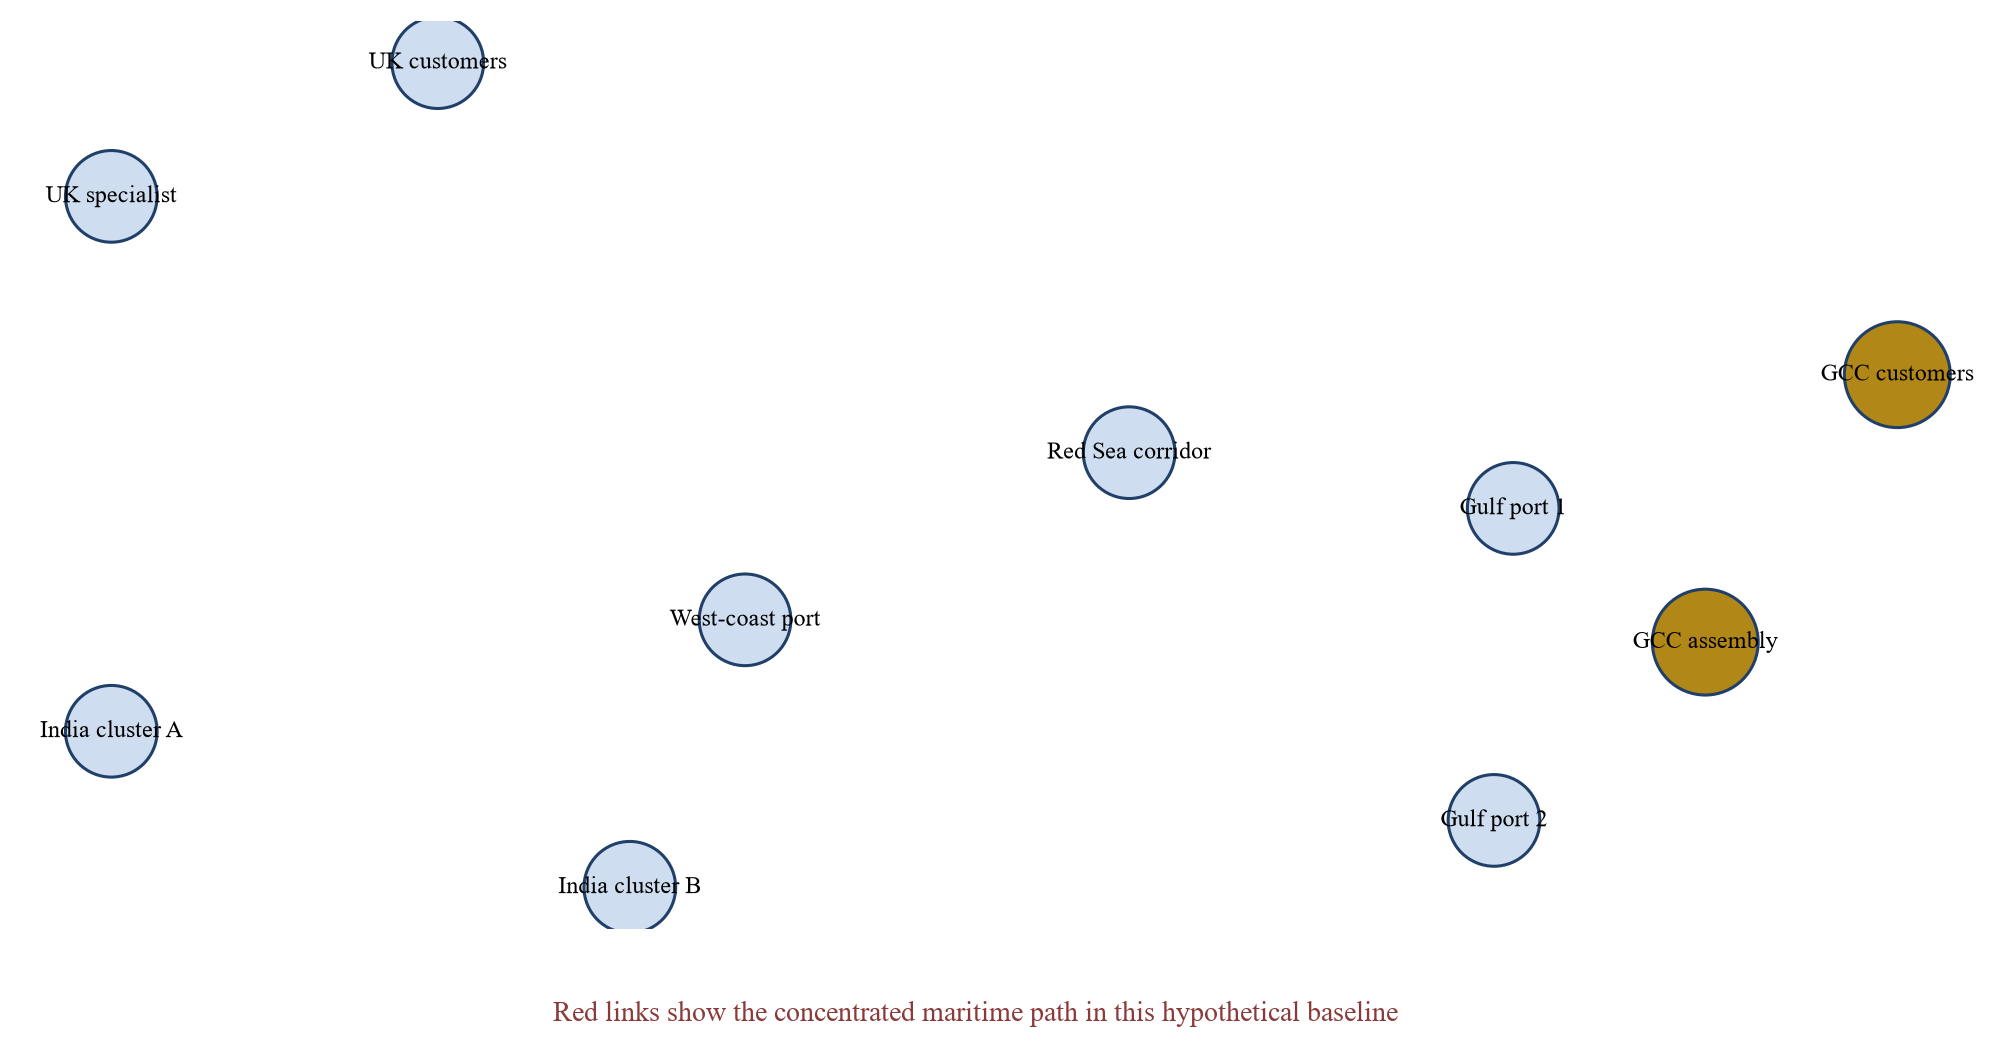
Original illustrative network. Node sizes represent annual component value and line width represents volume; all values and relationships are hypothetical.
5. Establish a product criticality hierarchy
The company needs a hierarchy that prevents every item from becoming critical. Tier one can include products whose absence stops a safety-critical service, breaches a material customer commitment, creates regulatory failure or interrupts a high-contribution cash stream. Tier two can include products with substitutes that require time, testing or customer approval. Tier three can include routinely substitutable items with a competitive market and manageable lead time.
Criticality should be evidenced. Use the process map, bill of material, inventory record, customer contract, quality requirement, revenue dependency and recovery plan. Assign an owner and review date. A classification should expire when the product, customer mix or network changes. Procurement preference and supplier familiarity are weak reasons for a tier-one designation.
The hierarchy should recognise time. A component can be non-critical when twelve weeks of stock exists and critical when only two weeks remain. A route can be acceptable during low season and insufficient before a customer shutdown window. The control tower should show time to impact, time to qualify an alternative and time to recover. This supports intervention before the inventory position becomes an emergency.
Customer approvals can define the true lead time. Automotive, aerospace, energy, healthcare and regulated infrastructure products can require qualification, traceability or consent. A technically compatible input may still be unavailable for contracted deliveries until approval is complete. The transition plan should place customer engagement and evidence alongside procurement and logistics actions.
6. Calculate landed cost by decision state
Purchase price is one component of landed cost. The decision file should include freight, fuel and security surcharges, duties, customs fees, insurance, financing, inspection, packaging, handling, demurrage, quality loss, obsolescence, minimum-order effects, foreign exchange and carbon-related obligations where applicable. Transition costs should remain separate from steady-state costs so management can see the funding peak.
Use product-level classifications and documented routes. Tariff and origin conclusions should be confirmed by qualified customs advisers. Preferential access under a trade agreement can depend on rules of origin and documentary evidence. The UAE describes Comprehensive Economic Partnership Agreements as a mechanism to deepen strategic trade relationships, and its first such agreement was signed with India in 2022. The existence of an agreement alone does not establish the duty for an individual product. [4]
The hypothetical bridge compares USD 28.00 million of baseline annual purchase value with a dual-source design. Purchase price rises by USD 0.90 million. Freight and insurance rise by USD 0.54 million because part of the volume uses a longer or more flexible route. Qualification, compliance and supplier-development cost add USD 0.42 million on an annualised basis. The steady-state cost premium is USD 1.86 million before any disruption benefit.
Expected disruption exposure is a planning measure, not an accounting provision or forecast. The model multiplies stated event costs by stated frequencies and adjusts for overlap. In the central case, the redesign reduces annual planning exposure by USD 3.24 million. Management should also inspect individual severe scenarios because an expected value can hide a low-frequency event that exceeds liquidity or customer tolerance.
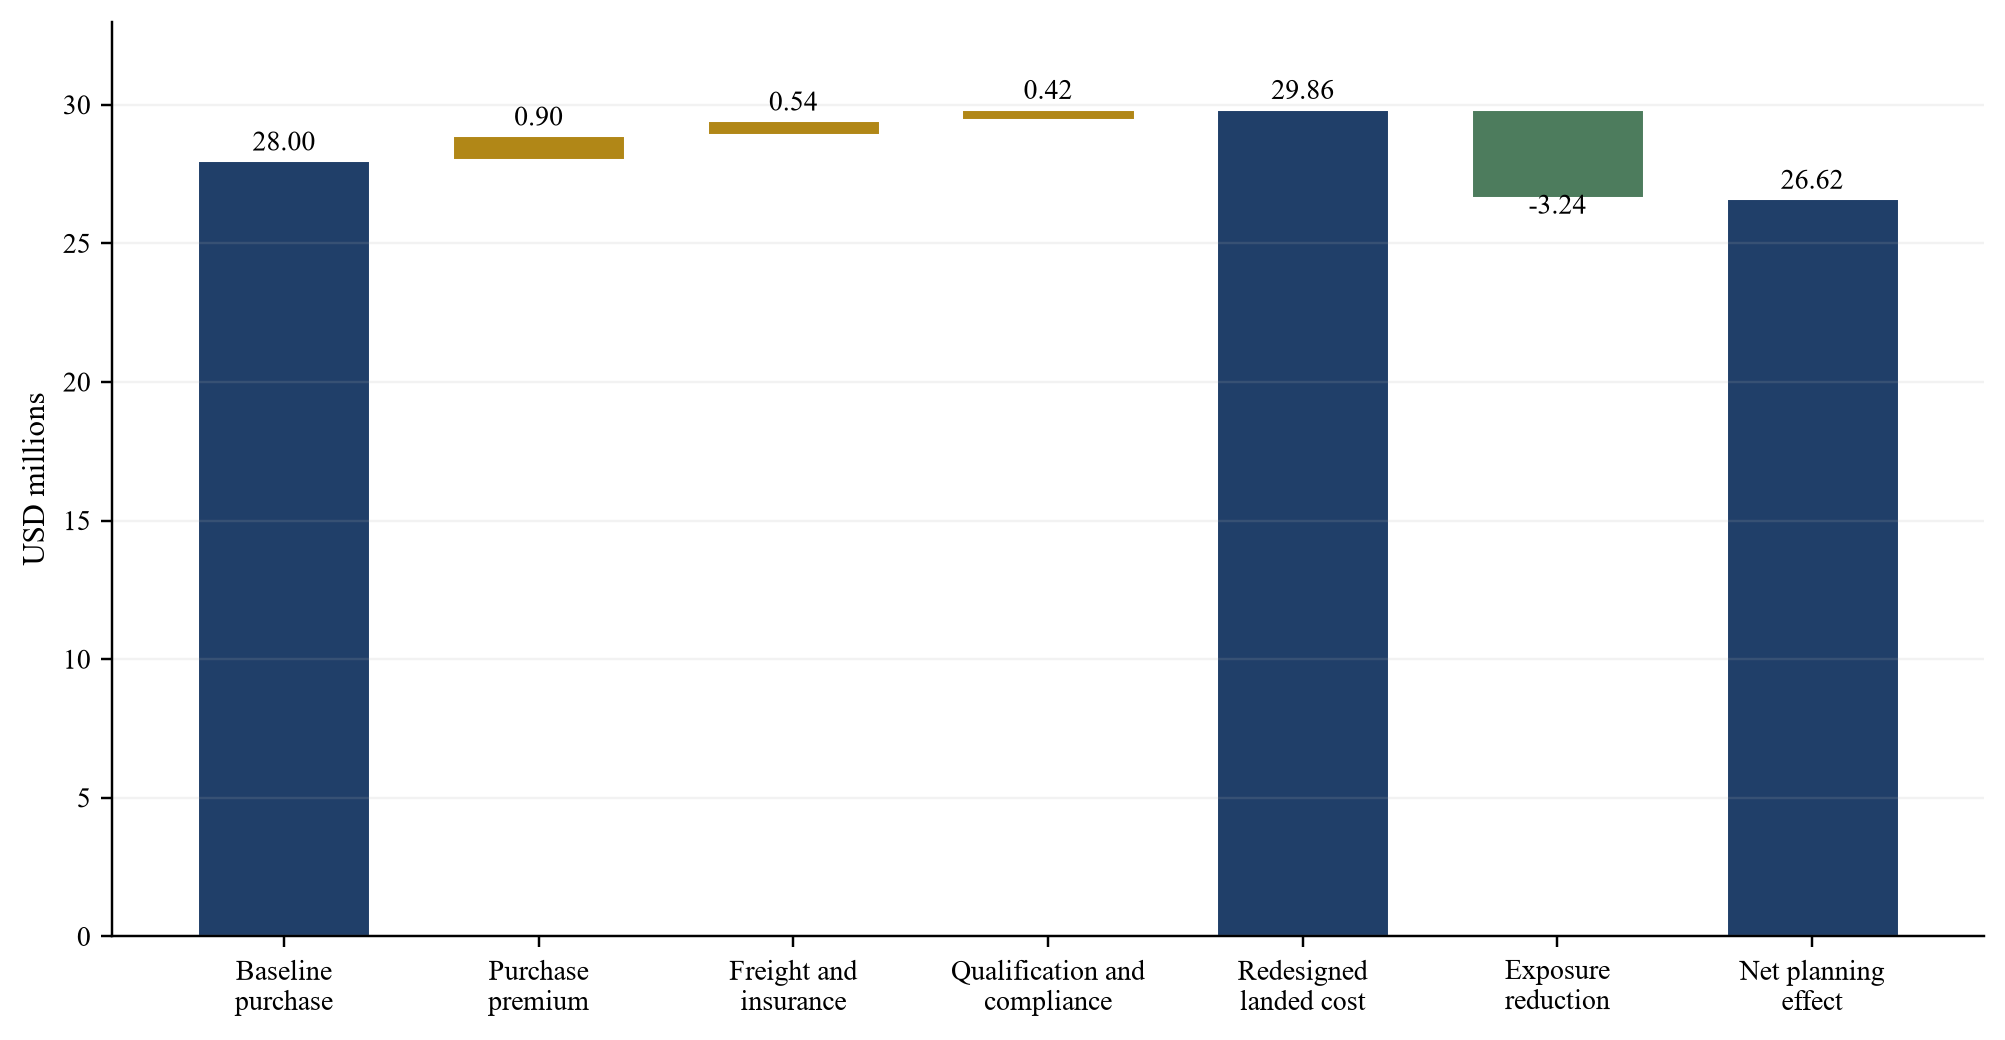
USD millions. Every input is hypothetical; expected exposure is a planning construct and not a forecast, provision or probability assessment for any company.
7. Model lead-time distributions and inventory stress
Average lead time is insufficient for a resilience decision. The company needs the distribution of supplier production, booking, port dwell, transit, customs, inland movement, inspection and receiving. It should record the evidence period and separate ordinary variation from disruption scenarios. A mean that combines normal and crisis periods can be difficult to interpret. Percentiles and stage-level observations give management a more useful view.
The World Bank's Logistics Performance Index assesses countries' ability to establish reliable supply-chain connections and highlights the importance of logistics quality, infrastructure and border controls. Its 2023 report covers 139 countries. The index is a country-level indicator and should not replace lane, carrier, port and product evidence. [5]
Inventory should be connected to time to impact and time to recover. For each product, calculate available usable stock, committed demand, quality holds, in-transit stock, supplier work in progress and approved substitution. The control tower should distinguish physical quantity from inventory available for a specific customer. A stock balance can overstate protection when products are allocated, expired, incompatible or awaiting inspection.
The hypothetical model uses baseline demand of 10,000 units per month, a 45-day ordinary replenishment lead time and a 15-day service buffer. A route shock adds 30, 60 or 90 days. A staged dual-source design ramps approved alternative volume from 20 percent to 60 percent over six months. Temporary inventory peaks at USD 2.70 million because old and new flows overlap during qualification. These inputs are deliberately simplified.
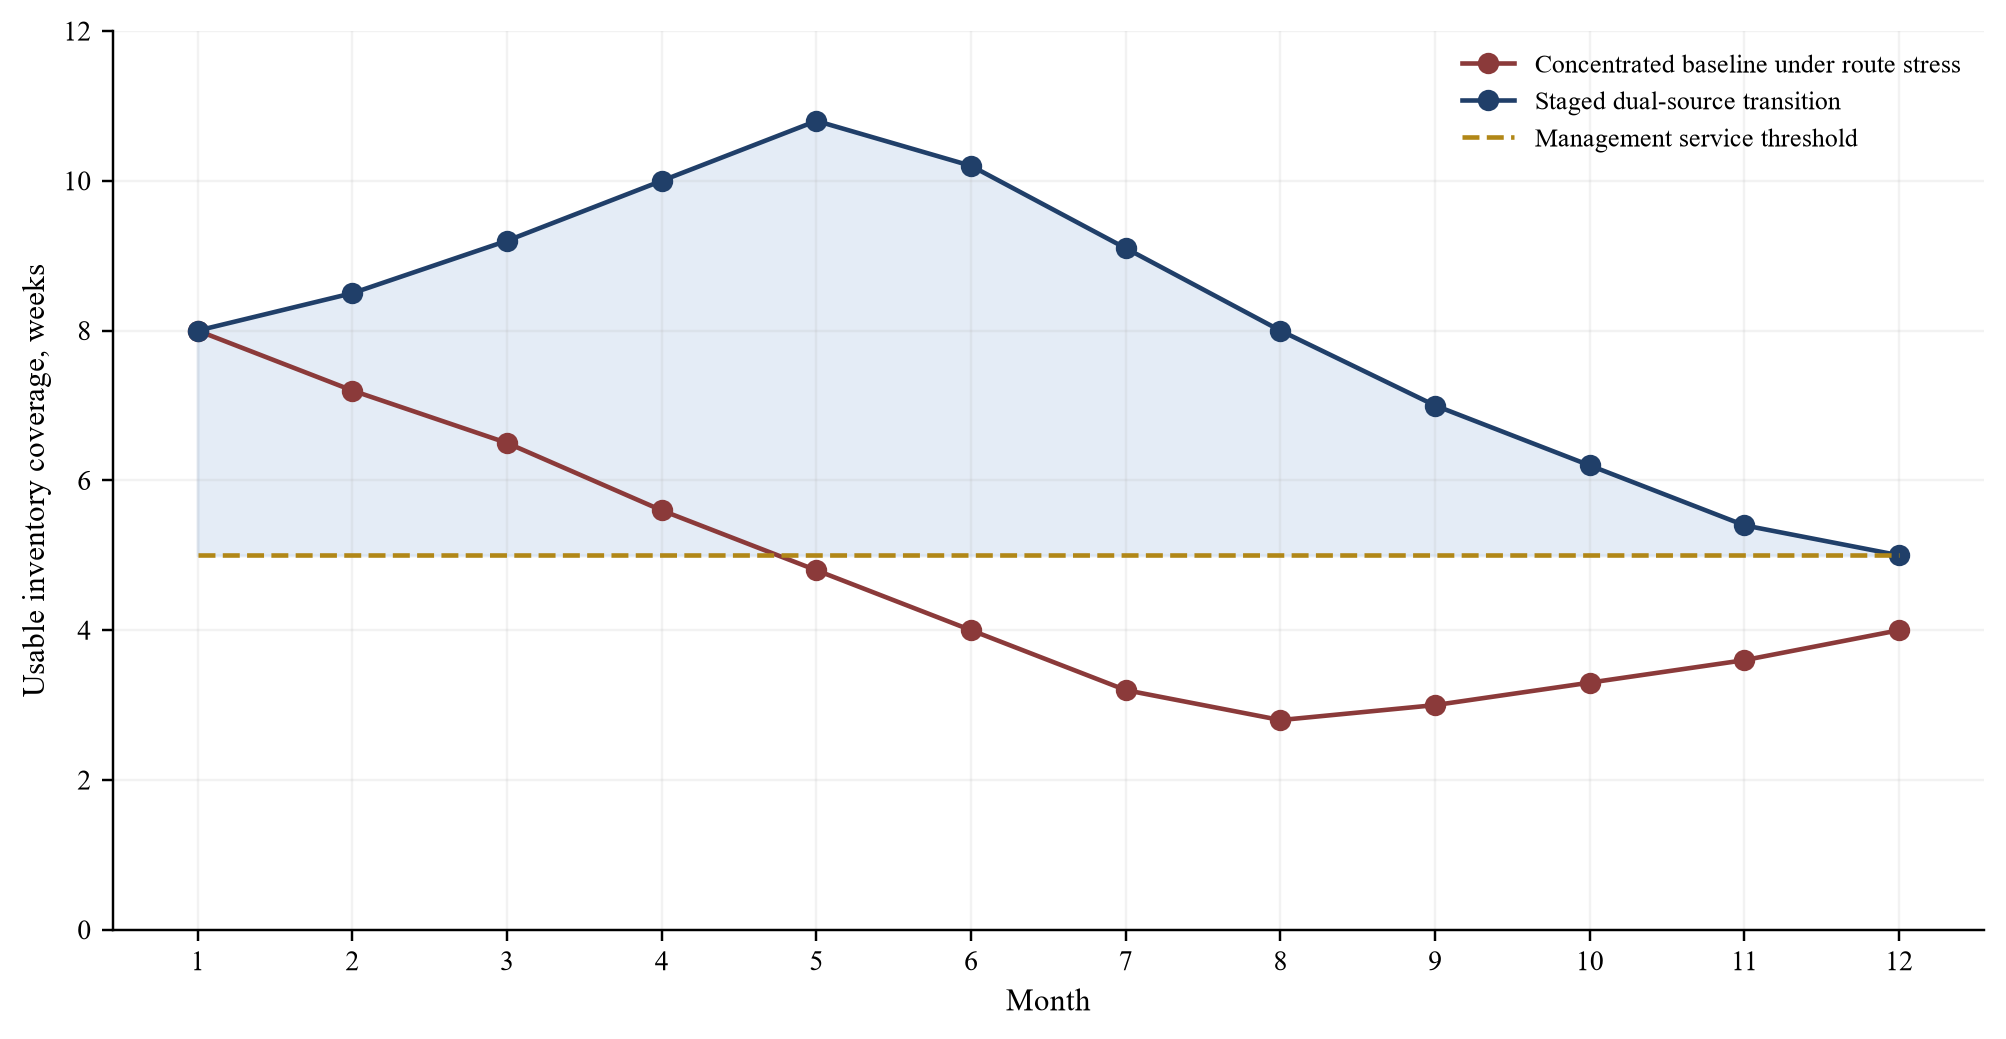
Weeks of demand and USD values are hypothetical. The chart shows gross usable coverage before product-specific allocation, quality and customer-approval constraints.
8. Protect working capital and liquidity
Network redesign often consumes cash before it releases risk. New suppliers may require deposits, shorter payment terms, tooling, first-article production and minimum orders. Existing suppliers may continue during qualification. Additional inventory can sit in production, transit, customs and inspection. The control tower should produce a weekly or monthly cash bridge that includes every transition obligation and the timing of customer collections.
Inventory value should follow the company's verified costing policy and financing terms. The funding analysis should distinguish cash paid, accounting inventory, eligible borrowing-base inventory and stock excluded by age, location, title, quality or customer concentration. A working-capital facility can support part of the transition only when the documented eligibility and advance conditions are met.
Foreign exchange matters when the new source changes currency or payment timing. A purchase-price advantage can disappear when the company finances a longer cycle or absorbs volatility. Treasury should identify contractual currency, hedge policy, settlement date and cash requirement. The supply-chain model should consume approved hedge assumptions rather than inventing a rate.
The hypothetical transition requires USD 2.70 million of peak additional inventory and qualification cash. It assumes no additional borrowing-base availability. If the company has only USD 1.50 million of liquidity headroom, the sequence must change, external funding must be approved, or the transition cannot proceed as modelled. The board should see this constraint before it approves supplier exit.
| Cash item | Month 1 to 3 | Month 4 to 6 | Month 7 to 12 | Total or peak |
|---|---|---|---|---|
| Supplier qualification and testing | 0.45 | 0.25 | 0.05 | 0.75 total |
| Tooling and first articles | 0.55 | 0.20 | 0.00 | 0.75 total |
| Temporary duplicate orders | 0.60 | 0.95 | 0.35 | 1.90 total |
| Additional inventory in transit | 1.10 | 1.70 | 0.80 | 1.70 peak |
| Released legacy commitments | 0.00 | -0.70 | -1.70 | -2.40 total |
| Net incremental cash requirement | 2.70 | 2.40 | -0.50 | 2.70 peak |
USD millions. All amounts and timing assumptions are hypothetical and exclude tax, foreign exchange and financing fees.
9. Design buffers by failure mode
A single safety-stock percentage is a weak response to several different risks. Buffer design should begin with the failure mode. Supplier buffers protect production variability or site interruption. Route buffers protect transit or port delay. Capacity reservations protect scarce production slots. Dual tooling protects equipment or site loss. Customer-allocation rules protect high-consequence commitments. Contractual options protect the ability to shift volume.
The buffer should have a release condition. Temporary inventory may be needed while the alternative source passes qualification and reaches stable output. After acceptance, the company should reduce duplicate stock to the approved steady-state level. Without an exit rule, emergency stock can become permanent working capital, obscure obsolescence and weaken accountability.
Segmentation matters. A high-margin, long-lead, low-obsolescence component can justify a different buffer from a short-life or rapidly changing item. Demand variability, substitution, minimum order, shelf life, storage, insurance and customer allocation should be explicit. The control tower should report usable coverage and cash by product family.
Scenario testing should include correlated delays. A route disruption can increase transit time while customers accelerate orders and suppliers ration capacity. A tariff announcement can pull demand forward and congest ports. The WTO's April 2025 outlook highlighted the effects of trade-policy uncertainty, while its later analysis identified inventory front-loading and strong trade in AI-related goods. These observations support testing demand and transit together. [6]
The World Bank's June 2026 global outlook identifies persistent trade-policy uncertainty and supply-chain adjustment among the forces shaping the economic environment. [12] The control tower should use current company demand and shipment data for decisions, with macroeconomic scenarios providing context for stress testing.
10. Qualify alternatives before reducing the incumbent
An alternative supplier is a capacity claim until evidence proves product, process, quality, delivery, cyber, compliance and commercial readiness. Qualification should cover specifications, samples, first articles, process capability, traceability, certifications, ownership, sub-tier dependencies, insurance, financial condition, information security, sanctions screening, contract terms and tested production volume.
The sequence should preserve service. Begin with low-risk volumes or products. Run old and new sources in parallel where customer and safety requirements demand it. Compare yield, defect, delivery and documentation. Increase volume through pre-agreed gates. Reduce the incumbent only after the replacement has met acceptance conditions over a defined period and the remaining network can absorb variance.
The contract should support the intended resilience. Volume flexibility, capacity reservation, tooling ownership, audit rights, change control, continuity support, data access, origin evidence, termination and transition assistance can be material. Legal counsel should confirm enforceability and local requirements. A low unit price without usable rights can leave management unable to respond during disruption.
Supplier development can be a rational investment. Engineering support, quality systems, digital integration and forecasting discipline can make an emerging supplier viable. The cost and management load should appear in the case. It should also be staged. If the supplier cannot meet an early control or capability gate, the company should limit further exposure and reassess the network.
11. Use route options with operational proof
Route diversification requires more than a second line on a map. The company should test carrier availability, sailing frequency, transshipment, port capacity, customs readiness, insurance, inland transport, security, documentation, temperature or handling requirements, and recovery after interruption. It should also identify where alternate routes share vessels, hubs, service providers or digital systems.
UN Trade and Development reports sustained stress around major maritime chokepoints and notes that Suez Canal tonnage remained substantially below its 2023 level in 2025. The report also describes elevated freight-rate volatility and longer voyages. These are global observations. A company must verify its own route, product and carrier conditions before changing inventory or customer commitments. [2]
Route trials should move commercial product through the full process. A desktop quote cannot establish actual transit, border release, damage, documentation or receiving performance. The control tower should record planned and actual timestamps from supplier release to usable warehouse stock. Exceptions should identify cause and owner.
Insurance terms should be reviewed with the route. Coverage, exclusions, war-risk premiums, notification, packaging, custody and claims evidence can change. The company should not assume that a new Incoterm or carrier preserves the prior risk allocation. Finance should connect potential deductibles and uninsured losses to the liquidity plan.
12. Govern tariffs, origin and carbon data
Tariff changes affect price, customer demand, route choice and inventory timing. The control tower should maintain product classification, origin, preferential eligibility, anti-dumping or countervailing measures, licences, customs valuation and evidence dates. Management should model the cash timing of duty as well as the expense because border payments can increase working-capital needs.
The WTO Trade Facilitation Agreement provides for publication of border requirements, advance rulings, release and clearance measures, authorised-operator arrangements and cooperation among border agencies. [10] These mechanisms can support planning, while their availability and implementation must be verified for each relevant country and product.
Rules of origin need supplier evidence and production facts. Moving final assembly does not automatically change origin. A claimed preference can fail when the product does not meet the applicable rule or documentation is incomplete. The company should obtain specialist advice and retain the evidence that supports each declaration.
CBAM adds an emissions-data and certificate dimension for covered imports into the European Union. The European Commission states that the definitive regime applies from 1 January 2026 and covers selected sectors including cement, iron and steel, aluminium, fertilisers, electricity and hydrogen. Importers above the applicable threshold must meet authorisation, declaration and certificate obligations. [3] A GCC, Indian or UK supplier serving an EU customer may therefore need product-level embedded-emissions data even when the company making the network decision is outside the EU.
The control tower should distinguish verified supplier data, default values and estimates. It should show the reporting owner, assurance status and commercial consequence. Carbon data can influence customer qualification, price and route choice. It should not be converted into a generic sustainability score that hides the underlying obligation.
13. Connect network decisions to customer commitments
The commercial team should identify which contracts require notice, consent, requalification, origin representation, delivery performance, business continuity, cybersecurity, audit or change control. A supply alternative that meets engineering requirements can still breach a customer term or weaken a strategic relationship if the change is introduced without the required process.
Prioritise customers by contractual consequence, contribution, strategic importance and substitution. Prepare a communication and approval plan. Some customers may support diversification and help accelerate qualification. Others may require extensive evidence or maintain approved-site lists. The control tower should track customer status alongside supplier readiness.
Revenue at risk should avoid double counting. If one disrupted component affects several products, do not add every gross invoice without considering inventory, substitution, recovery and contribution margin. Separate delayed revenue, lost contribution, contractual claims, expedited cost and relationship impact. Keep management estimates identified until supported by company data.
Customer allocation during shortage should follow approved legal, commercial and ethical rules. The company should document who can change priorities and how conflicts are handled. A control tower can provide facts and scenarios. It does not replace authorised judgment or applicable competition and contract law.
14. Evaluate the redesign under scenarios
The investment committee should compare the concentrated baseline, targeted buffers, dual sourcing, route diversification, local or regional capacity, and a staged combination. Each option should show steady-state cost, transition cash, service effect, compliance requirements, time to readiness and residual concentration. The comparison should retain qualitative risks that cannot be monetised credibly.
The hypothetical central case assumes a USD 1.86 million annual steady-state premium and a USD 3.24 million annual reduction in planning exposure. It also requires USD 2.70 million of temporary transition cash. Over two years, using a 10 percent discount rate and treating the transition cash as an initial outflow with recovery of USD 1.20 million at the end of year two, the net present value is USD 0.69 million. This is an illustrative calculation.
The downside assumes USD 2.30 million of annual premium, USD 2.10 million of annual exposure reduction, USD 3.20 million of transition cash and USD 0.80 million recovery. Its two-year net present value is negative USD 2.89 million. The upside assumes USD 1.55 million annual premium, USD 4.20 million annual exposure reduction, USD 2.40 million transition cash and USD 1.40 million recovery. Its net present value is USD 3.36 million.
No probability is assigned to a scenario. The committee should identify the evidence that determines which case is credible. Supplier qualification, route trials, customer approval, tariff classification, inventory records, contract flexibility and verified disruption consequences can narrow the range. If evidence remains weak, management can approve a smaller pilot and preserve the incumbent.
| Scenario | Annual steady-state premium | Annual planning exposure reduction | Initial transition cash | Recovery at end of year 2 | Two-year net present value |
|---|---|---|---|---|---|
| Downside | 2.30 | 2.10 | 3.20 | 0.80 | -2.89 |
| Central | 1.86 | 3.24 | 2.70 | 1.20 | 0.69 |
| Upside | 1.55 | 4.20 | 2.40 | 1.40 | 3.36 |
USD millions. Net present values use a hypothetical 10 percent discount rate; no probability is assigned and no company result is estimated.
15. Release decisions through evidence gates
A gated transition protects service and cash. Gate one approves the problem definition, product perimeter, baseline and decision authority. Gate two approves alternative suppliers and routes for testing. Gate three approves commercial qualification and limited volume. Gate four approves customer and regulatory readiness. Gate five approves scale. Gate six permits reduction or exit of the incumbent after stable performance and inventory acceptance.
Each gate should specify evidence, amount, owner, exception and expiry. A condition such as supplier ready is not testable. A condition such as three consecutive production lots within the approved defect threshold, delivered through the alternate route within the stated percentile and accepted by the named customer group gives management a clear test. The exact threshold remains company-specific.
Funding should follow the gates. Tooling and deposits can be split where commercially feasible. Inventory should rise only when the qualification and route evidence support the next stage. The committee should understand any non-cancellable commitment and the cost of flexibility.
The incumbent relationship also needs governance. Abruptly removing volume can impair cooperation, expose contractual liabilities or eliminate emergency capacity before the replacement is stable. Procurement and legal teams should plan notice, minimums, tooling, data, inventory, warranty and transition support. The control tower should show the earliest safe exit date rather than the desired accounting period.
| Gate | Minimum evidence | Permitted action | Stop or hold trigger |
|---|---|---|---|
| Baseline | Reconciled products, suppliers, routes, inventory, demand and cash | Approve diagnostic and option work | Population or ownership unresolved |
| Technical qualification | Samples, process, quality, capacity, sub-tier and cyber review | Fund bounded trials and tooling | Material specification or control failure |
| Commercial qualification | Contract, origin, tariff, insurance, payment and continuity terms | Place limited commercial orders | Unfunded cash, unusable rights or compliance issue |
| Route and customer acceptance | Physical route trial, border evidence, customer consent and service test | Increase staged volume | Failed release, approval or service threshold |
| Scale | Stable lots, delivery, quality, cash and customer performance | Increase allocation within approved limit | Trend outside approved tolerance |
| Incumbent reduction | Accepted alternative capacity, buffers, contingency and legal clearance | Reduce or exit legacy source | Residual single point or unresolved obligation |
Original framework. Actual gates, thresholds and authorities must be approved for the company and product.
16. Assign authority and operating cadence
The board sets risk appetite and approves material structural changes within its reserved matters. The chief executive owns the enterprise trade-off. The chief operating officer owns continuity and execution. The chief financial officer owns liquidity, financial evaluation and benefit challenge. Procurement owns supplier strategy and commercial evidence. Engineering and quality own technical acceptance. Logistics owns route performance. Commercial leaders own customer commitments. Legal, compliance, tax, customs, insurance, cyber and sanctions specialists provide conclusions within their authority.
The control-tower team reconciles data, produces scenarios, records assumptions, prepares recommendations and tracks conditions. It should have access to source systems and sufficient independence to challenge business and procurement owners. It should not approve its own exception. Decision minutes should show the evidence date, approved action, conditions, cash limit, accountable owner and next review.
Cadence should respond to risk. A daily operational cell may be appropriate during an active disruption. Weekly review can manage qualification, inventory and exceptions. Monthly executive review can decide volume changes and liquidity within delegated limits. Quarterly board or committee review can assess structural concentration, residual risk, realised costs and capital allocation.
Data quality requires ownership. The team should report missing or stale fields, reconcile totals and retain source links. A visually polished dashboard can create false confidence if supplier capacity, inventory or customs status is management-estimated. Each metric should show its source, date and status.
17. Use the control tower in transactions and financing
Supply-chain exposure can affect acquisition diligence, valuation, financing and post-merger integration. A buyer should identify critical products, supplier and route concentration, change-of-control terms, inventory quality, customer approvals and working-capital requirements. It should test whether the target's normalised margin depends on freight, duties or purchasing conditions that are unlikely to continue.
The transaction model should include transition cash and execution time. A planned sourcing synergy can require qualification, tooling, duplicate inventory and customer consent. Counting the steady-state purchase saving from completion while omitting the path to readiness can overstate value. The investment committee should see the cash bridge and the downside if the incumbent must continue longer.
Lenders may need visibility over inventory, receivables, insurance, concentration and disruption plans. The borrower should map network actions to covenant forecasts and borrowing-base rules. A diversification initiative that consumes cash can be strategically sensible and still create a short-term covenant or liquidity issue. Financing consent should be obtained where required.
Post-merger integration creates additional dependencies. Two companies can share a supplier without recognising combined concentration. Consolidating volumes can improve price while increasing exposure. Systems, product codes and inventory definitions can differ. The combined control tower should reconcile both populations before management approves sourcing synergies or warehouse reductions.
18. Apply the framework across GCC, India and UK operations
The three regions can play different network roles. GCC operations can provide customer proximity, distribution, assembly and access to expanding trade relationships. Indian operations can provide manufacturing depth, engineering and large supplier ecosystems. UK operations can provide specialist technology, advanced manufacturing, customer access and regulated-market capabilities. The actual role depends on product, company and contract evidence.
India's National Logistics Policy and PM GatiShakti initiatives focus on integrated infrastructure, logistics efficiency, process improvement and technology adoption. Official Indian reporting describes these as mechanisms to improve connectivity and resource use. [7] A company can use public infrastructure direction as context, but it should still test individual industrial clusters, power, transport, ports, customs and suppliers.
The UK's 2025 Trade Strategy established a Supply Chain Centre and describes data-driven, business-informed review of critical supply chains. It also highlights collaboration, mapping and early-warning capabilities. [8] These policy developments can affect information, support and trade tools available to firms. They do not establish the resilience of a specific UK supplier or route.
The UK's Critical Imports and Supply Chains Strategy sets out priorities covering analysis, import barriers, shock response, long-term adaptation and collaboration with business and academia. [11] A company can use these public resources as context for its own dependency review and should retain responsibility for product-level evidence and execution.
The UAE's trade-agreement programme positions the country as a trade and logistics gateway and identifies India as the first CEPA partner. [4] The commercial case should verify product eligibility, origin and documentation. Regional proximity can reduce some lead times while introducing different capacity, qualification or cost conditions. The control tower should compare the full decision state.
19. Monitor realised resilience and economic value
Performance should connect decisions to observed outcomes. Useful measures include critical lines with verified sub-tier maps, supplier and route concentration, alternate capacity qualified, lead-time percentile, usable inventory coverage, customer approvals, border-release time, defects, expedited freight, cash tied up, transition spend, lost contribution and service performance.
Avoid a single resilience score. A composite number can conceal an unacceptable safety, compliance or liquidity exposure. Present the underlying measures, thresholds, owner and trend. Where management uses an aggregate score, retain the formula and show the components that drive it.
Benefits should be reconciled. Compare baseline and actual purchase, freight, duty, insurance, inventory finance, quality, obsolescence, claims and customer performance. Separate avoided exposure from realised cash. A year without disruption does not prove that a buffer generated a cash benefit. It may still have provided approved protection. Report its cost and purpose accurately.
The control tower should learn from each event. Record the signal, decision, evidence, time to act, bottleneck, service effect, cash effect and recovery. Update supplier and route assumptions. Review whether inventory was usable and allocated correctly. This turns disruption experience into better thresholds and contracts.
20. Commission a bounded advisory mandate
A company, investor or lender can commission a bounded supply-chain control-tower mandate before a network redesign, acquisition, financing or major customer commitment. The first phase can reconcile the population, identify critical dependencies, map routes and contracts, and quantify immediate continuity and liquidity issues. It should state evidence gaps and decisions that cannot yet be reached.
A second phase can develop options and run supplier, route, inventory and cash scenarios. A third can support qualification gates, customer work, financing and implementation governance. Each phase should define entities, products, jurisdictions, materiality, access, deliverables, decision dates and excluded professional opinions.
Management remains responsible for information and decisions. Qualified advisers should confirm legal, sanctions, customs, tax, product, insurance, accounting and regulatory conclusions. The advisory team should distinguish company evidence from assumptions and public context. It should make no promise of savings, uninterrupted service or a completed transaction.
The engagement should protect confidential information and supplier relationships. Access should follow approved controls. Potential conflicts should be disclosed. Recommendations should receive factual review, with adverse evidence retained. The final decision belongs to the company's authorised body.
21. Research limits and conclusion
The public research reviewed for this paper was accessed on 12 September 2026. It supports specific propositions on supply-chain interdependence, trade fragmentation, maritime disruption, trade facilitation, logistics reliability, border policy, trade agreements and carbon-border obligations. It supplies no company-specific supplier contracts, shipment records, bills of material, customs classifications, customer approvals, inventory data or financing terms.
Several sources operate at national or global level. OECD, WTO, IMF, World Bank and UN Trade and Development evidence provides context and analytical methods. Government sources describe policy and regulatory frameworks. None establishes a particular company's probability of disruption, supplier capability, appropriate safety stock, landed cost or return from redesign.
The numerical illustration is intentionally limited. It uses five product families, seven suppliers, four corridors, fixed cost inputs, three scenarios and a two-year valuation horizon. It assigns hypothetical frequencies and costs to disruption exposure. It omits tax, detailed foreign exchange, financing fees, probability correlation, customer churn, terminal value and many product-specific constraints. The figures should not be used as a benchmark.
The practical sequence is to reconcile the network, identify the actual points of failure, connect them to customers and cash, compare realistic alternatives, fund temporary buffers, qualify suppliers and routes, obtain required approvals, and release change through evidence gates. The control tower keeps these decisions in one governed record.
Resilience has a cost. Concentration has a cost. A disciplined redesign makes both visible before management commits cash or withdraws capacity. The strongest decision is the one that protects service through the transition and leaves the company with traceable evidence, authorised choices and a network it can operate under changing conditions.
Appendix A. Minimum decision pack
| Decision area | Record to request | Question for the authorised committee |
|---|---|---|
| Product and customer | Bill of material, specification, demand, contract and approval | Which service or cash stream fails, and when |
| Supplier and route | Contract, capacity, site, sub-tier, route trial and insurance | Which failure modes remain shared or untested |
| Trade and compliance | Classification, origin, permit, sanctions, carbon and customs advice | Is the proposed flow permissible and evidenced |
| Inventory and liquidity | Usable stock, demand, orders, payment terms, facility and cash forecast | Can the transition be funded through peak cash use |
| Economics | Landed cost, transition cost, scenario and residual exposure | Which option has acceptable cost and downside |
| Governance | Authority, conditions, exception, owner and review date | Who can approve, pause, scale or exit |
Original checklist. It creates no finding about an unnamed company, supplier, route, jurisdiction or transaction.
Appendix B. Model definitions
Landed cost equals verified purchase price plus freight, insurance, duty, customs, handling, inspection, financing and other decision-relevant costs on a consistent basis. Transition cash equals incremental supplier, tooling, qualification, duplicate order, inventory, customer and system cash required before steady state, less evidenced releases.
Usable inventory coverage equals inventory available for the specified demand after quality, allocation, expiry, compatibility and approval constraints, divided by the applicable demand rate. Time to impact is the period before a disruption affects the defined customer or operation. Time to recover is the period required to restore accepted service.
Planning exposure in the illustration equals stated event cost multiplied by a stated frequency, adjusted for stated overlaps. It is neither a forecast nor an accounting provision. Net present value discounts stated incremental cash flows at the hypothetical 10 percent rate. No probability is assigned to the three scenarios.
Sources
- OECD. OECD Supply Chain Resilience Review: Navigating Risks. 2 June 2025. Accessed 12 September 2026. Read the primary source
- UN Trade and Development. Review of Maritime Transport 2025: Staying the course in turbulent waters. 24 September 2025. Accessed 12 September 2026. Read the primary source
- European Commission, Taxation and Customs Union. Carbon Border Adjustment Mechanism: definitive regime. Accessed 12 September 2026. Read the primary source
- United Arab Emirates Ministry of Economy and Tourism. Comprehensive Economic Partnership Agreements. Accessed 12 September 2026. Read the primary source
- World Bank. Connecting to Compete 2023: Trade Logistics in an Uncertain Global Economy. 2023. Accessed 12 September 2026. Read the primary source
- World Trade Organization. Global Trade Outlook and Statistics. April 2025. Accessed 12 September 2026. Read the primary source
- Government of India, Ministry of Commerce and Industry. Department of Commerce Annual Report 2023-24. Accessed 12 September 2026. Read the primary source
- United Kingdom Department for Business and Trade. The UK's Trade Strategy. Updated 25 July 2025. Accessed 12 September 2026. Read the primary source
- International Monetary Fund. Demystifying Trade Patterns in a Fragmenting World. Publication 2025/129. 27 June 2025. Accessed 12 September 2026. Read the primary source
- World Trade Organization. Agreement on Trade Facilitation. Accessed 12 September 2026. Read the primary source
- United Kingdom Department for Business and Trade. Critical Imports and Supply Chains Strategy. 17 January 2024. Accessed 12 September 2026. Read the primary source
- World Bank. Global Economic Prospects. June 2026. Accessed 12 September 2026. Read the primary source
