

Introduction
GPU-cloud platforms convert imported accelerators, data-centre capacity, power, networking and software into contracted or usage-based computing services. India's demand base includes public programmes, government bodies, research institutions, startups, regulated enterprises, global capability centres and large domestic businesses. These customers buy for different reasons, through different procurement routes and at different price points. A valuation should preserve those differences.
The capital cycle is equally distinctive. Accelerators and high-speed networking can be priced in foreign currency. Orders may require deposits before final delivery, integration and customer acceptance. Domestic revenues are usually collected later and can be affected by subsidy settlement, enterprise procurement and working-capital terms. Equipment finance, external commercial borrowing, leases, vendor credit, shareholder facilities and customer prepayments can fund the gap; each creates a different claim on assets and cash.
The framework begins with the decision and legal perimeter, then reconciles demand, pricing, currency, landed equipment cost, capacity, utilisation, margin and financing. It ends with valuation, a combined downside, transaction protections and a first-one-hundred-day control system. Public evidence supplies context. Platform-specific conclusions require executed contracts, IndiaAI allocation and settlement records, invoices, customs and tax documents, hedges, power and data-centre agreements, telemetry, bank receipts, title records and financing documents.
1. Define the investment and financing decision
State whether the decision concerns growth capital, acquisition, project finance, equipment debt, refinancing or a strategic partnership. Fix the valuation date, legal perimeter, currency, return threshold, minimum liquidity and downside tolerance. An Indian GPU-cloud group can place hardware, data-centre leases, software, customer contracts and borrowings in different entities. The committee should identify which entity owns accelerators, holds import documents, contracts for power, invoices customers and grants security.
Create a sources-and-uses schedule by legal entity. Distinguish paid equity, committed equity, debt, leases, vendor credit, subsidy receivables, customer prepayments and restricted cash. The enterprise-to-equity bridge should use the same perimeter. Public-policy benefits may improve delivery or demand; only evidence-supported cash effects enter value.
2. Map the operating and procurement perimeter
Map shareholders, promoters, affiliates, equipment vehicles, data-centre counterparties, cloud marketplaces and channel partners. Record whether demand comes through the IndiaAI portal, another public procurement route, direct enterprise sale, reseller or international marketplace. Each route affects customer ownership, pricing, settlement timing and renewal evidence.
For each material customer, identify the contracting entity, end user, budget source, procurement authority, subsidy, service provider and payment path. Public allocation, customer payment and government subsidy should remain separate ledger items. This prevents awarded compute hours from being treated as collected revenue and reveals the working capital between customer use and provider settlement.
3. Classify local demand by economic source
Use five demand groups: public-programme allocation, government and research, public-sector or regulated enterprise, unsubsidised domestic private customer, and international customer. Classification follows the economic payer and purchase decision. A startup receiving supported hours has different renewal evidence from an enterprise purchasing compute at a negotiated commercial rate.
Measure committed value, accepted usage, revenue, subsidy, receivables, contribution margin and renewal by group. Public support can widen access and seed workloads. Stand-alone value strengthens when customers continue paid use after an initial allocation, expand from their own budgets and generate positive contribution after support, power and service cost.
4. Separate commercial document states
A press release, memorandum of understanding, reservation, order form, master agreement and accepted service are different states. Create a document ladder: announced opportunity, non-binding memorandum, reserved capacity, executed minimum commitment, deployed service, accepted service, billed service, collected cash and renewed service. Each state has distinct conditions and cancellation risk.
Abstract legal customer, term, committed quantity, price, delivery condition, acceptance, service levels, credits, termination, change of control, renewal and payment. Reconcile contract values to the revenue ledger and bank. An executed order should enter the committed case according to its conditions. Optional consumption and unsigned expansion belong in separately labelled scenarios.
5. Reconcile public allocation and pipeline to revenue
Separate national programme capacity, provider empanelment, customer allocation, approved subsidy, executed customer order, accepted service, billed amount and collected cash. Provider announcements can describe committed capacity or addressable programme scale; neither automatically establishes a receivable. Rebuild management's stated book from customer-level records.
Produce a waterfall from stated value to enforceable minimum, accepted usage, billed revenue, subsidy receivable and collected cash. Remove duplicated programme, channel and direct opportunities. Capture expiration of allocations and required start dates. The hypothetical case reduces INR 14,400 crore of stated and expected value to an INR 9,850 crore risk-adjusted schedule after contract, delivery, utilisation, credit and collection adjustments.
6. Test IndiaAI and other supported demand
Review empanelment terms, rate cards, allocation records, user eligibility, subsidy percentage, provider invoices, service levels, settlement timing and audit rights. Government disclosures establish programme scale and policy; the operator's records establish utilisation, billing and collection. Model the portion paid by the user and the portion settled through the programme separately.
Test conversion after supported hours expire. Analyse whether the workload progresses to production, whether the customer retains the provider and which price applies. A subsidy can create valuable adoption and a lower market price reference at the same time. The commercial case should show both effects rather than counting programme volume at an unsupported long-term margin.
7. Test enterprise and regulated-sector demand
Banks, telecoms, manufacturers, healthcare companies, global capability centres and public-sector enterprises can provide longer-lived workloads. Assess procurement independence, data requirements, service acceptance, credit, price, minimums and migration alternatives. Aggregate customers with one parent or common programme.
Production inference, fine-tuning and enterprise analytics may scale differently from foundation-model training. Record workload duration, cluster size, latency, data location and support. Repeat use, timely payment and budgeted expansion provide stronger evidence than a one-time proof of concept.
8. Test unsubsidised private demand
Unsubsidised adoption demonstrates willingness to pay at the operator's commercial price. Segment startups, domestic enterprises, global capability centres, international customers, channel buyers and cloud-marketplace users. Track trial conversion, repeat purchase, expansion, contraction, churn, contribution margin and collection.
Keep customer credits, promotional hours and partner-funded workloads visible. A customer can be operationally active while generating little cash. Cohort analysis should begin at the first accepted billable month and distinguish paid minimums from optional usage. Renewal at a commercially sustainable price is the strongest evidence of repeatable demand.
9. Measure demand and subsidy concentration
Calculate top-customer, top-channel and top-programme shares for contract value, accepted usage, revenue, subsidy receivables, gross margin and capacity. Aggregate common ownership and budget. Measure expiry of allocations and customer renewals by quarter. A broad user count can coexist with concentration in one programme, one model developer or one reseller.
Model common events: subsidy reduction, delayed settlement, large-customer cancellation, price competition, accelerator shortage or a regional power constraint. Estimate replacement time, reconfiguration and idle cost. The valuation should distinguish diversification of logos from diversification of economic cash sources.
10. Build the contract-quality ladder
Score contracts on enforceable minimum, duration, credit, delivery conditions, acceptance, service remedies, price adjustment, termination, renewal and security. The output should remain a transparent evidence ladder rather than a single opaque score. Contract quality also changes over time as delivery, acceptance, billing and collection occur.
Create a monthly movement schedule between document states. A contract moves upward only when evidence is complete; disputes, credits or termination notices can move it downward. Debt sizing may use a narrower eligible-contract definition than equity valuation. The committee should approve both definitions and the haircuts between them.
11. Reconcile supported and commercial pricing
Compare portal, government, enterprise, startup, reserved and on-demand pricing by accelerator, configuration, term and service bundle. Separate compute from storage, networking, orchestration, support, power and taxes. Publicly disclosed low hourly rates can improve access and also influence customer expectations outside the programme.
Reconcile rate card, executed price, subsidy, invoice and collected price. Adjust for free periods, credits, reseller rebates, minimum-volume shortfalls and tax. Calculate the price required to recover landed equipment cost, power, facility, network, support, refresh and financing. The forecast should make any cross-subsidy explicit.
12. Reconcile usage, billing and collection
Telemetry, scheduler records, customer portals, invoices and bank receipts should tell one story. Define available, reserved, delivered, accepted, billable and paid GPU hours. Maintenance, failed jobs, internal use, free trials and service credits reduce conversion. Validate a sample from job record through meter and invoice to bank.
Analyse days to acceptance, invoice timing, disputes, days sales outstanding and cash application by cohort. A customer with high reservation and low paid use may generate minimum revenue today but face renewal risk. A customer with rising paid utilisation and timely cash provides stronger evidence of value.
13. Build the GPU cohort ledger
Record each material cohort's architecture, configuration, quantity, serial evidence, acquisition cost, delivery, commissioning, warranty, workload fit, financing, utilisation and refresh plan. Supporting networking, storage and cooling can constrain usable service before nominal GPU count does. Record failed, idle, reserved and billable units separately.
Link every cohort to sites and customers. Reconcile title and liens to invoices and security documents. Model maintenance, replacement and residual recovery by cohort. The commercial case should fund enough refresh capital to perform contracts through their terms; accounting carrying value and economic recoverability should remain separate schedules.
14. Map data-centre capacity, power and delivery states
Separate campus potential, permitted capacity, contracted power, energised power, commissioned IT load, customer-usable capacity and accepted billable capacity. Indian data-centre expansion announcements can describe multi-year campus scale. Current revenue depends on equipment, networking, cooling, power and customer acceptance working together.
Review connection agreements, open-access or renewable arrangements, backup generation, facility leases, cooling, network, construction milestones, deposits and curtailment. Link customer start dates and GPU orders to the same site schedule. The hypothetical 76 MW plan becomes 24 MW accepted and billable after these states are reconciled.
15. Build the imported-hardware and landed-cost ledger
Record supplier, equipment, configuration, purchase currency, order date, deposit, balance, delivery term, freight, insurance, customs classification, duties, taxes, integration, warranty and import documentation. Confirm recoverable tax separately from economic cost with qualified advisers. Link each commitment to a hedge, financing source and customer case.
Advanced accelerators can depend on supplier allocation and foreign export authorisation. Model delayed approval, partial delivery, configuration change and higher integration cost. A purchase announcement is not installed capacity. Replacement hardware requires evidence on performance, software compatibility, power density and customer acceptance.
16. Model utilisation by customer cohort
Build monthly cohorts using the first accepted billable month. Show reserved, minimum, variable and actual use. Separate training, inference, fine-tuning, research and internal workloads because cluster size, network intensity, duration and price can differ. Preserve operating headroom and redundancy.
The utilisation curve should show ramp, steady state, contraction, renewal and redeployment. Do not allow the same spare capacity to support multiple independent opportunities. Reconcile the weighted curve to physical capacity and billing. The hypothetical central case reaches 70 per cent billable utilisation; the downside reaches 50 per cent.
17. Calculate customer-level contribution margin
Revenue quality includes margin after the costs required to serve the customer. Allocate power, facility, network, orchestration, support, service credits, sales commissions and directly attributable maintenance. Show depreciation, leases, refresh capital and financing below the contribution measure so that users understand each layer.
Compare sponsor, state-linked and independent cohorts on consistent definitions. A high-volume anchor can have lower unit economics but support capacity delivery. A smaller international customer can provide price discovery and diversification. The portfolio decision should reflect both roles and the cash required to sustain them.
18. Build the contract-to-cash schedule
Forecast each executed tranche monthly from delivery and acceptance through billing and collection. Include minimums, variable use, escalation, credits, taxes, currency and payment lag. Unsigned expansion and renewal remain separate cases. Reconcile forecast opening balances to contract, receivable and deferred-revenue ledgers.
The cash schedule should identify the first month when liquidity, covenant or supplier payment becomes tight. Link delays to working capital rather than moving revenue alone. This schedule becomes the common operating case for valuation, debt sizing and transaction protections.
19. Build the capacity-to-cash schedule
Connect each customer tranche to site, power, GPU, network, commissioning and acceptance. Record remaining capital and supplier payments. A megawatt should not support cash until the relevant equipment and service have passed customer conditions. Apply delivery probability to pre-operational capacity.
The schedule should reveal circular dependencies: supplier deposits require financing, financing requires offtake, and offtake starts after delivery. Resolve the circle through committed equity, sponsor support, customer prepayment, milestone debt or staged procurement. Model refund and restriction terms for every prepayment.
20. Map rupee and foreign-currency financing
GPU platforms can use domestic term loans, equipment finance, external commercial borrowing, leases, vendor credit, shareholder facilities and customer prepayments. Capture currency, rate, hedge, borrower, security, amortisation, covenants, reserves, guarantees and change-of-control. RBI requirements and facility documents require current professional review. [16][17]
Compare debt tenor with contract term and GPU economic life. Foreign-currency equipment or debt funded by rupee revenue creates translation and cash-flow risk. Customer prepayments create delivery or refund claims. Model supplier deposits and subsidy receivables in working capital. The equity bridge should deduct each claim according to legal priority and economic substance.
21. Apply revenue and asset accounting evidence
IFRS 15 supports analysis of enforceable contracts, performance obligations, transaction price and revenue recognition. IAS 16, IAS 36 and IFRS 16 inform equipment, impairment and lease evidence. IFRS 13 informs fair-value methods. Accounting does not replace commercial diligence, but reconciliations can expose differences between stated backlog, recognised revenue and asset recoverability. [15][16][17][18][19]
Obtain policy papers, contract assessments, impairment models, lease schedules and audit differences. Reconcile management metrics to statutory accounts. Keep accounting remaining performance obligations distinct from wider sales backlog. Adjusted measures should have a bridge to reported figures and stable definitions.
22. Assess data sovereignty, cyber and operating control
Customers can require local data processing, access control, encryption, audit, incident response and personnel restrictions. Map each obligation to architecture, site and subcontractor. A sovereign platform can still depend on foreign software, hardware, support or control planes; identify these dependencies.
Use current national requirements, contracts and recognised cyber frameworks. Test identity, privileged access, logging, isolation, backup, recovery and incident evidence. Price required remediation and service interruption. Commercial quality includes the operator's ability to perform its promises securely and repeatedly.
23. Test marketplace, supplier and channel dependence
India's GPU-cloud providers can distribute through government portals, proprietary platforms, resellers, systems integrators and global marketplaces. Record who owns the customer relationship, controls price, bills, supports, receives usage data and manages renewal. Separate provider capacity from channel-controlled demand.
Supplier ecosystems can improve utilisation and software access while increasing dependence on one hardware architecture or marketplace. Measure gross-to-net revenue, receivable risk, customer visibility and churn by route. A diversified route-to-market supports value when it produces distinct paying customers and transferable commercial relationships.
24. Triangulate enterprise value in rupees
Use discounted cash flow, accepted-billable-capacity references and relevant market references on consistent definitions. The DCF should use rupee customer cash flows, landed equipment cost, hedging, power, tax, working capital, refresh and financing. Capacity references should value accepted service differently from planned megawatts or ordered GPUs.
Market references require adjustment for public support, customer quality, utilisation, accelerator age, power, site control, software, currency and claims. Reconcile methods rather than averaging them. Keep foreign-currency inputs and rupee valuation connected through stated exchange-rate assumptions and sensitivities.
25. Build the enterprise-to-equity bridge
Deduct domestic and foreign debt, leases, vendor obligations, customer refunds, restricted amounts, unpaid capex and other debt-like items; add only unrestricted available cash. Show hedge assets and liabilities consistently. Allocate claims by legal entity and security.
The hypothetical central case uses INR 8,600 crore of enterprise value and INR 3,750 crore of adjusted claims, producing INR 4,850 crore of equity. The combined downside uses INR 3,600 crore of enterprise value and INR 4,050 crore of claims, producing no equity recovery. These figures describe no identified company.
26. Run a combined currency, delivery and utilisation downside
Combine related risks. Rupee depreciation can increase equipment deposits, final payments, debt service and refresh before revenue reprices. Import or supplier delay can postpone commissioning, acceptance and billing while interest and lease costs continue. Lower programme allocation can reduce utilisation and weaken refinancing.
The hypothetical downside assumes 12 per cent rupee depreciation on unhedged commitments, a nine-month commissioning delay, lower public allocation, 50 per cent billable utilisation, weaker renewal price and higher financing cost. Calculate minimum liquidity, covenant headroom, required equity and claim recoveries. State the evidence and thresholds that would change the case.
27. Convert findings into funding and transaction protections
Translate evidence gaps into milestone equity, draw conditions, reserves, hedging requirements, customer consents, supplier protections, earn-outs, covenants and walk-away criteria. Each mechanism needs a measurable trigger, source, calculation agent, dispute process and long-stop date.
Possible protections include funding tied to equipment delivery and accepted billable capacity, a minimum hedge for committed foreign-currency payments, reserves for tax or refund exposure, sponsor equity for cost overruns, and an earn-out based on unsubsidised collected revenue. Counsel and tax advisers should align terms with the actual structure.
28. Establish the first-one-hundred-day valuation-control system
The operating dashboard should reconcile allocation, contract state, accepted capacity, paid utilisation, subsidy receivables, contribution margin, cash, power, imported-equipment commitments, currency cover and financing headroom. Name data owners and exception thresholds. Require evidence for every movement between states.
Priorities are to close contract-to-cash gaps, stabilise subsidy and customer billing, secure delivery and power milestones, manage currency exposure, build unsubsidised enterprise demand and govern refresh capital. The board should review public-supported and commercial cohorts separately and then reconcile them to one liquidity and valuation case.
Appendix A. Integrated revenue-quality model
The framework has three deliberate limitations. First, public announcements and company releases establish strategic context; they do not prove the terms, utilisation or collection performance of a specific platform. Second, customer independence is a commercial classification that requires transaction records and governance evidence; ownership alone does not determine contract quality. Third, accelerator markets, export rules, power arrangements and software economics can change rapidly. Valuation inputs therefore require a stated date, source and update trigger. Qualified legal, accounting, technical, cyber and tax advisers should review the matters within their disciplines.
The evidence hierarchy gives precedence to executed contracts, regulatory approvals, acceptance records, invoices, bank receipts, telemetry, title and financing documents. Audited financial statements and controlled management reports provide reconciliation. Public statements and third-party market information provide context. Where sources conflict, the model records the difference and avoids forcing an unsupported resolution. This hierarchy keeps strategic narrative connected to evidence that can support a financing or investment decision.
The model should run monthly and use stable identifiers for customer group, contract, order, site, GPU cohort, power allocation, invoice, receipt and financing claim. Each customer receives both a legal-entity identifier and an economic-independence classification. Each commercial document receives a state from announcement through renewal. Changes require an evidence link, owner and date. This design allows management, investors and lenders to reproduce the bridge from public or management statements to cash.
The contract schedule records minimum and optional volume separately. It captures delivery conditions, acceptance, service levels, credits, price, escalation, termination, renewal, invoice and collection. The capacity schedule records planned, power-contracted, energised, commissioned, usable and accepted megawatts. The equipment schedule records cohort configuration, commissioning, utilisation, title, security, maintenance, refresh and residual. Total customer allocation cannot exceed tested service capacity after redundancy and operating headroom.
The customer schedule calculates cohort conversion, paid utilisation, gross retention, net retention, contribution margin and cash collection. Sponsor, state-linked and independent cohorts remain visible. Channel customers are analysed using both intermediary and end-customer information where available. The financing schedule links every debt, lease, prepayment, reserve and guarantee to the relevant legal entity and operating cash flow.
The valuation uses the same schedules. Discounted cash flow follows contract and capacity delivery. Billable-capacity references apply only to comparable accepted capacity. Market references use consistent customer, power, equipment and claims definitions. The enterprise-to-equity bridge deducts claims by legal priority. The combined downside changes related assumptions together and identifies liquidity, covenant and equity requirements.
Appendix B. Minimum confirmatory evidence
The commercial room should include executed customer documents, procurement records, approvals, acceptance, service reports, invoices, credits, receivables and bank receipts. The operating room should include site agreements, power rights, construction milestones, capacity tests, GPU serials, telemetry, incidents, maintenance and refresh plans. The financing room should include facilities, leases, guarantees, reserves, security and prepayment terms. The regulatory room should include licences, authorisations, data-sovereignty controls, cybersecurity evidence and current counsel advice.
Sample tests should follow high-value customer periods from executed order to service allocation, telemetry, invoice and cash. Exceptions should state the financial effect, owner, remedy and deadline. Evidence is sufficient when value-moving differences are resolved, priced, protected or explicitly accepted by the decision-maker.
Appendix C. Hypothetical worked case
The case begins with INR 14,400 crore of stated committed and expected value. Public-programme and government-related customers represent INR 5,040 crore, public-sector and regulated enterprises INR 3,600 crore, and unsubsidised private or international customers INR 5,760 crore. Contract review removes INR 1,050 crore; delivery and import timing remove INR 1,400 crore; utilisation and acceptance remove INR 1,000 crore; credit and collection remove INR 650 crore; and optional or duplicated amounts remove INR 450 crore. The risk-adjusted schedule is INR 9,850 crore.
Capacity is reconciled independently. The plan describes 76 MW. Executed documents support 58 MW of power rights; 42 MW is energised; 34 MW is customer-usable after cooling, network, redundancy and commissioning; and 24 MW is accepted and billable. Planned capacity receives value after remaining capital, delivery time and probability are recognised.
The landed-cost ledger divides equipment into four cohorts. Purchase currency, deposits, final payments, freight, insurance, customs, recoverable tax, integration and financing are recorded separately. The central case hedges committed foreign-currency payments according to the hypothetical policy and funds refresh before contract performance declines. Unhedged residual exposure enters the currency sensitivity.
The central case reaches 70 per cent billable utilisation and a 29 per cent steady-state EBITDA margin. It incorporates supported and commercial prices, subsidy settlement timing, power, facility, network, support, maintenance, working capital and refresh. Discounted cash flow, accepted-billable-capacity and market references support INR 8,600 crore of enterprise value. Adjusted claims of INR 3,750 crore produce INR 4,850 crore of illustrative equity.
The combined downside applies 12 per cent rupee depreciation to unhedged equipment commitments, a nine-month commissioning delay, lower public allocation, 50 per cent billable utilisation, weaker renewal pricing and higher refinancing cost. Enterprise value falls to INR 3,600 crore. Adjusted claims rise to INR 4,050 crore because deposits, interest, leases and committed capex absorb cash. Illustrative equity recovery is nil.
The proposed response ties funding to equipment delivery and accepted capacity, requires a stated currency-risk policy for committed payments, reserves disputed tax or refund exposure, secures remaining sponsor equity and uses unsubsidised collected revenue for any commercial earn-out. The figures are assumptions and describe no identified company, security or transaction.
Appendix D. Board and lender diligence questions
Ownership and customer classification: Which entities provide capital, land, power, guarantees, procurement direction and customer budgets? Which customer decisions are made independently, and what records support that conclusion? Has the operator aggregated legal entities that share one parent, budget or national programme? Which revenues require related-party disclosure or a separate arm's-length test?
Contract evidence: What proportion of the stated book is supported by an executed minimum payment obligation? Which amounts remain memoranda, reservations, options or expected expansions? What delivery, acceptance, service and termination conditions can reduce value? Have change-of-control requirements and customer consents been identified? Can every material amount be traced to an order, invoice and collection record?
Commercial adoption: How many customers progressed from trial to paid service, and how many purchased again? What are gross retention, net retention and contribution margin by cohort? Which independent customers pay without sponsor credit, subsidy or mandatory allocation? How long does acquisition take, what does it cost, and how quickly can churned capacity be redeployed?
Capacity delivery: Which megawatts are power-contracted, energised, commissioned, customer-usable and accepted? What capital remains at every stage? Which milestones depend on a utility, landlord, supplier or regulatory authorisation? Does the customer delivery schedule use the same dates as the engineering and funding schedules? What penalties or refunds arise if those dates slip?
Equipment and software: Which GPU cohorts serve each customer and workload? Who holds title, and which lender or lessor has security? Are networking, storage, cooling or software constraints limiting service? What maintenance and refresh capital is required through the contract term? Have replacement hardware, integration, downtime and customer acceptance been modelled?
Pricing and margin: Are sponsor and independent customers charged on comparable terms after service differences? Which discounts, credits, free periods, rebates, taxes and pass-through items separate contracted price from cash? Does the operator earn positive customer-level contribution after power, facility, network, support and incidents? Which contracts become loss-making under the downside?
Cash and financing: Do billed amounts reconcile to receivables and bank statements? Which customer prepayments are refundable or restricted? When do equipment, lease and debt payments fall due relative to acceptance and collection? Where is cash trapped? Which covenants, guarantees or change-of-control clauses can accelerate claims?
Regulation and resilience: Which current licences and authorisations govern equipment, end use, data, cyber and operation? Which foreign dependencies remain inside the service architecture? Has counsel reviewed the specific transaction and customer perimeter? What incidents occurred, how were they resolved, and what service credits or customer rights resulted?
Valuation and decision: Does every method use the same accepted capacity, customer classification, utilisation, margin, refresh and claims assumptions? Which strategic benefits already appear in cash flow? What evidence would move a contract or capacity tranche upward in value? What evidence would trigger a reduction, reserve or exit? Who owns each update before signing and after closing?
Governance: Can management reproduce the board dashboard from controlled systems without manual narrative adjustments? Are metric definitions stable and documented? Does internal audit sample contract-to-cash and capacity-to-cash pathways? Are sponsor objectives and stand-alone commercial performance reviewed separately? These questions turn revenue quality into an operating discipline rather than a one-time transaction exercise.
Appendix E. Scenario governance and update protocol
The central case should represent the decision-maker's evidence-supported expectation at the valuation date. It should not contain unsigned customer expansion, unapproved capacity, uncommitted financing or unsupported operating improvement. Each material assumption needs a source, owner, review frequency and threshold for change. The model archive should preserve the input set used for every approval so later performance can be compared with the original decision.
The upside case may include identified commercial options, but every option should state the event required before value is recognised. Examples include an executed customer order, regulatory approval, energisation, supplier delivery, acceptance or funded expansion. The model should avoid treating several mutually competing customers as though each can use the same available capacity. Probability, timing and capital should be internally consistent.
The combined downside should connect risks that can occur together. It should calculate liquidity and claims as well as revenue and enterprise value. Monthly cash, covenant headroom, supplier deposits, refunds, service credits and required equity should remain visible. Management actions need credible timing, authority and cost. A proposed capital reduction or capacity deferral should identify which contracts and customer relationships it affects.
Updates should be evidence driven. Contract execution changes the document state; acceptance changes billable capacity; invoice and bank records change cash conversion; telemetry changes utilisation; supplier and utility records change delivery. The board should receive a reconciliation of prior and current cases, separating actual performance, approved scope change, external conditions and management assumption. This discipline allows public support and independent commercial adoption to be evaluated consistently through the investment period.
The protocol should also retain rejected assumptions and the reason for rejection. This audit trail helps directors, lenders and future investors understand how the case evolved, where judgement was applied and whether subsequent outcomes reflect execution, market movement or an original evidence gap. Material exceptions should reach the board before they are absorbed into an updated forecast.
Appendix F. India GPU-cloud valuation data dictionary
The customer table should identify legal customer, ultimate parent, sector, procurement route, IndiaAI or other public allocation, contracting currency, executed minimum, optional use, delivery condition, acceptance, service levels, credits, termination, renewal, invoice terms, subsidy payer and collection account. A separate economic-customer identifier should aggregate affiliates and channel transactions. The model should retain the original contract currency and translate it using a controlled rate table.
The programme table should record provider empanelment, eligible service, rate card, allocation, user contribution, subsidy percentage, validity period, required start date, bill of materials, accepted hours, provider invoice, settlement claim, settlement receipt and exceptions. Allocation is an operating opportunity until service and payment evidence support revenue. The table should calculate days between accepted usage, user billing, subsidy claim and cash receipt.
The landed-cost table should identify purchase order, supplier, equipment cohort, configuration, quantity, serial evidence, Incoterm, purchase currency, contracted exchange rate, deposit, balance, freight, insurance, customs classification, duty, tax, tax recoverability, integration, local warranty, commissioning and final acceptance. Qualified tax and customs advisers should confirm the treatment used. The valuation should separate recoverable tax from permanent cost and working-capital timing.
The currency table should connect every foreign-currency payment and borrowing to its hedge, natural offset and forecast cash date. Required fields include notional, currency, hedge instrument, rate, maturity, counterparty, collateral, accounting treatment and realised settlement. Sensitivities should apply to the net unhedged exposure after verified hedges. A forecast customer price increase does not constitute a hedge unless the contract permits timely recovery and customer behaviour supports it.
The capacity table should record site, landlord or owner, permitted IT load, contracted power, energised power, cooling configuration, network capacity, equipment installed, commissioning, customer usability, acceptance, remaining capital and earliest service date. Capacity values should preserve gross and redundant load definitions. Every customer allocation should connect to one or more specific sites and cohorts without exceeding tested headroom.
The utilisation table should distinguish available, reserved, delivered, accepted, billable, subsidised, paid and collected GPU hours. It should record accelerator type, workload, customer, site, scheduler data, maintenance, failed jobs, internal use, promotional use, credits and price. Cohorts begin at the first accepted billable month. The board dashboard should show conversion from supported to unsubsidised use and the contribution margin associated with each stage.
The financing table should identify borrower, lender, instrument, currency, principal, draw condition, interest, fees, amortisation, maturity, security, guarantee, covenant, reserve, cash sweep, change-of-control and prepayment. Link equipment finance to serialised assets and project debt to site and customer cash flows. Record vendor credit, shareholder facilities, customer prepayments and unpaid committed capex even when they sit outside reported bank debt.
The cash model should reconcile opening cash, customer receipts, subsidy receipts, taxes, working capital, supplier deposits, final equipment payments, operating cost, leases, interest, amortisation, maintenance, refresh and restricted-reserve movements. It should identify the first month in which minimum liquidity or covenant headroom fails. Funding remedies should state committed amount, authority, timing and conditions.
The valuation table should retain method, valuation date, currency, forecast version, discount rate, terminal assumption, accepted capacity, utilisation, contribution margin, refresh, tax and claim definition. Discounted cash flow, capacity references and market references should use the same operating evidence. Differences between methods remain visible, with a written explanation of adjustments for subsidy, customer concentration, currency, hardware age, power, software and financing.
The governance table should record data owner, source system, review frequency, tolerance, exception, remedy and approval. Material changes in contracts, allocation, exchange rate, equipment delivery, power, acceptance, utilisation, collection or financing should trigger an updated case. The archive should preserve each approved input set and the bridge to the next version. This creates an auditable record of how operating evidence changed enterprise and equity value.
Appendix G. Decision figures and tables
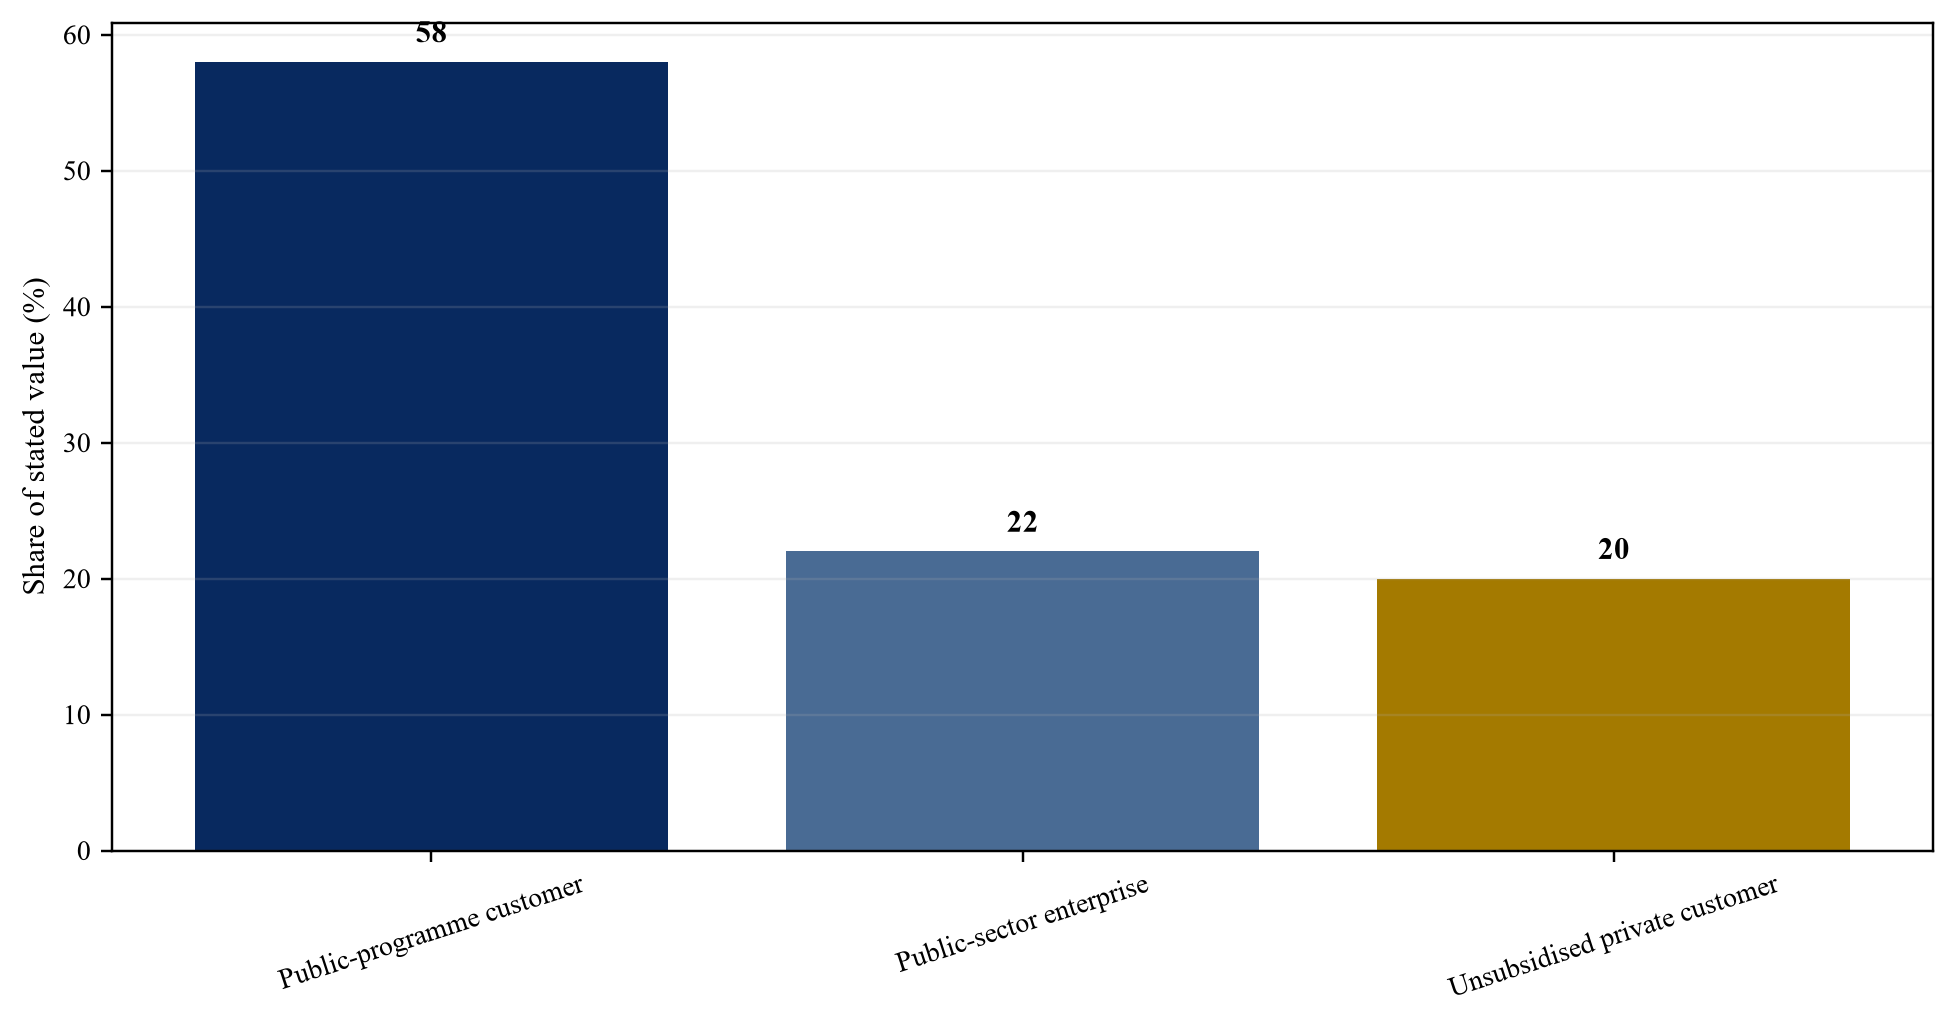
Wholly hypothetical; Matchpoint Partners analysis.
| Class | Decision evidence | Key risk |
|---|---|---|
| Public-programme customer | authority, budget and executed obligation | policy or budget concentration |
| Public-sector enterprise | independent procurement and own budget | common ownership or programme |
| Unsubsidised private customer | arm's-length purchase and paid use | price sensitivity and churn |
Proposed framework unless stated otherwise.
| State | Minimum evidence | Model treatment |
|---|---|---|
| MOU or announcement | signed non-binding document | pipeline only |
| Executed minimum | binding order and conditions | condition-adjusted schedule |
| Accepted and billed | acceptance, invoice and service record | revenue and credit test |
| Collected and renewed | bank receipt and new commitment | highest adoption evidence |
Proposed framework unless stated otherwise.
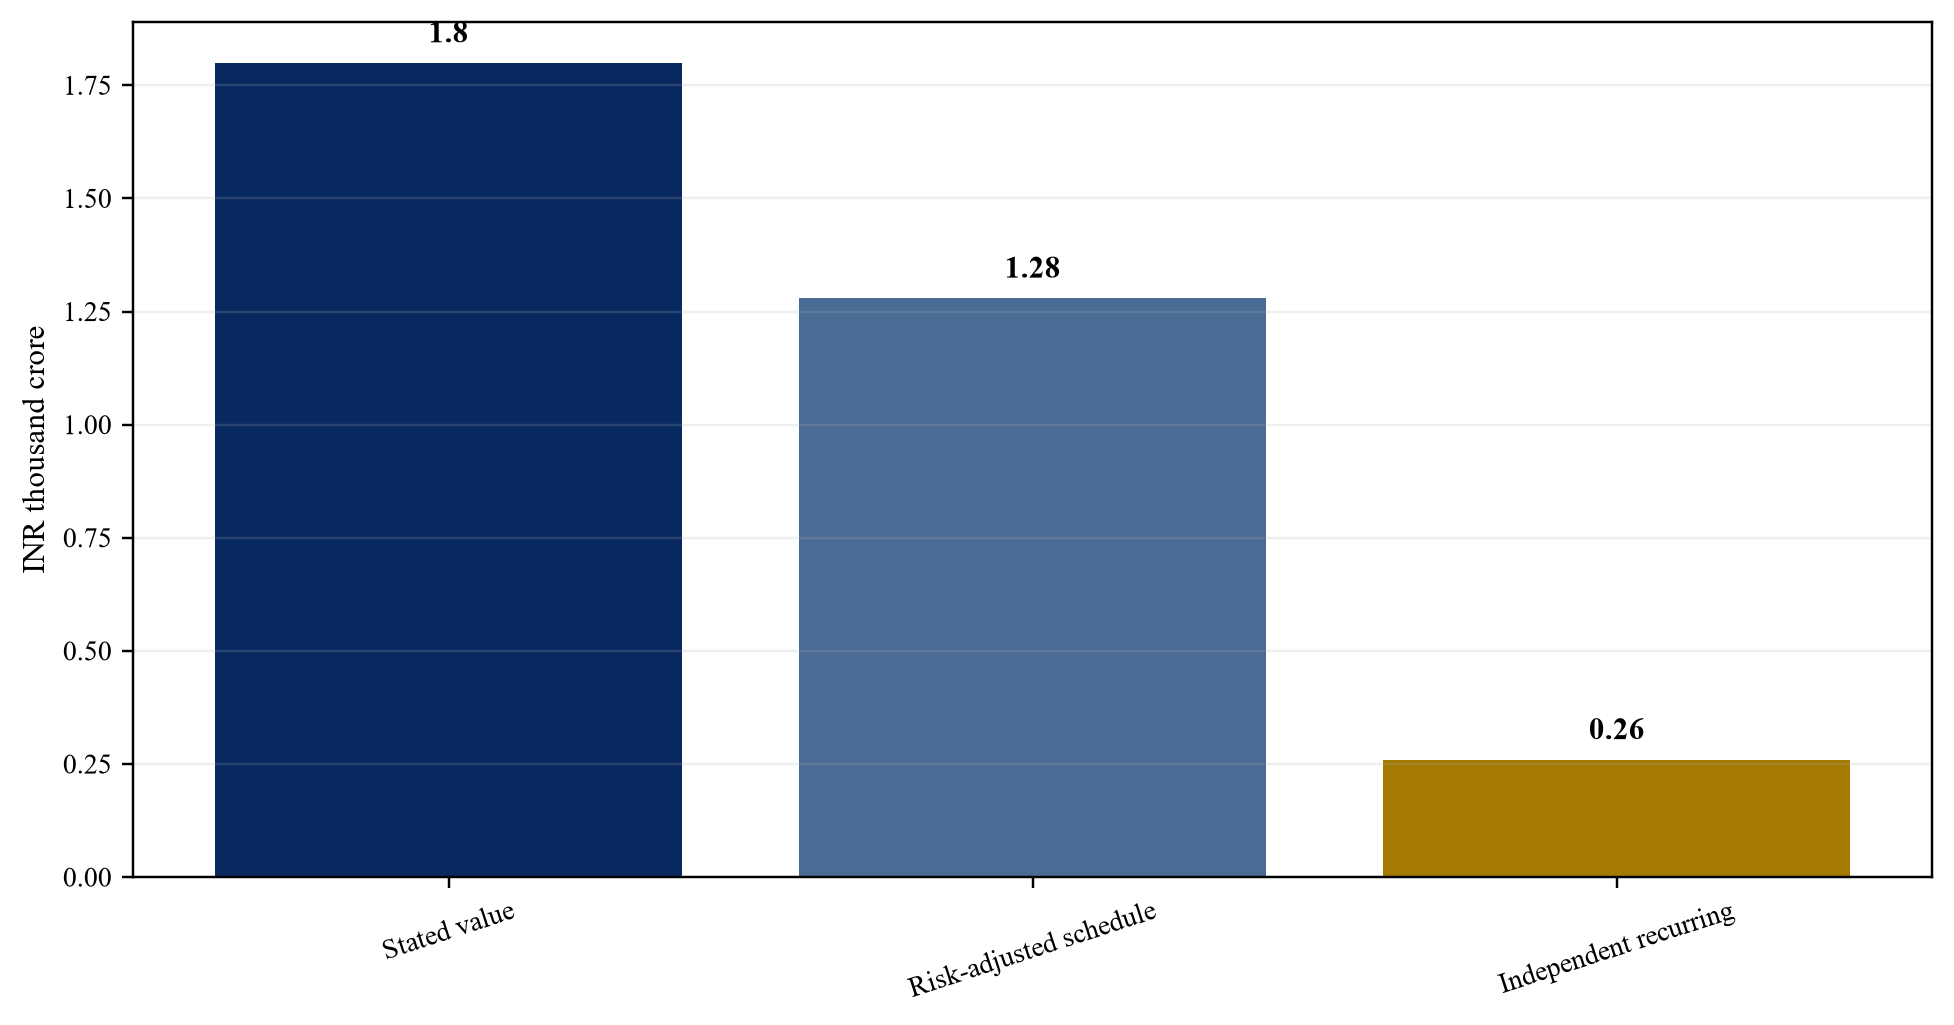
Wholly hypothetical; Matchpoint Partners analysis.
| Question | Evidence | Model response |
|---|---|---|
| Authority | law, delegation and approvals | eligibility |
| Budget | appropriation or funded commitment | timing and credit |
| Performance | acceptance and service levels | credits and start date |
| Exit | termination, change and dispute | effective tenor |
Proposed framework unless stated otherwise.
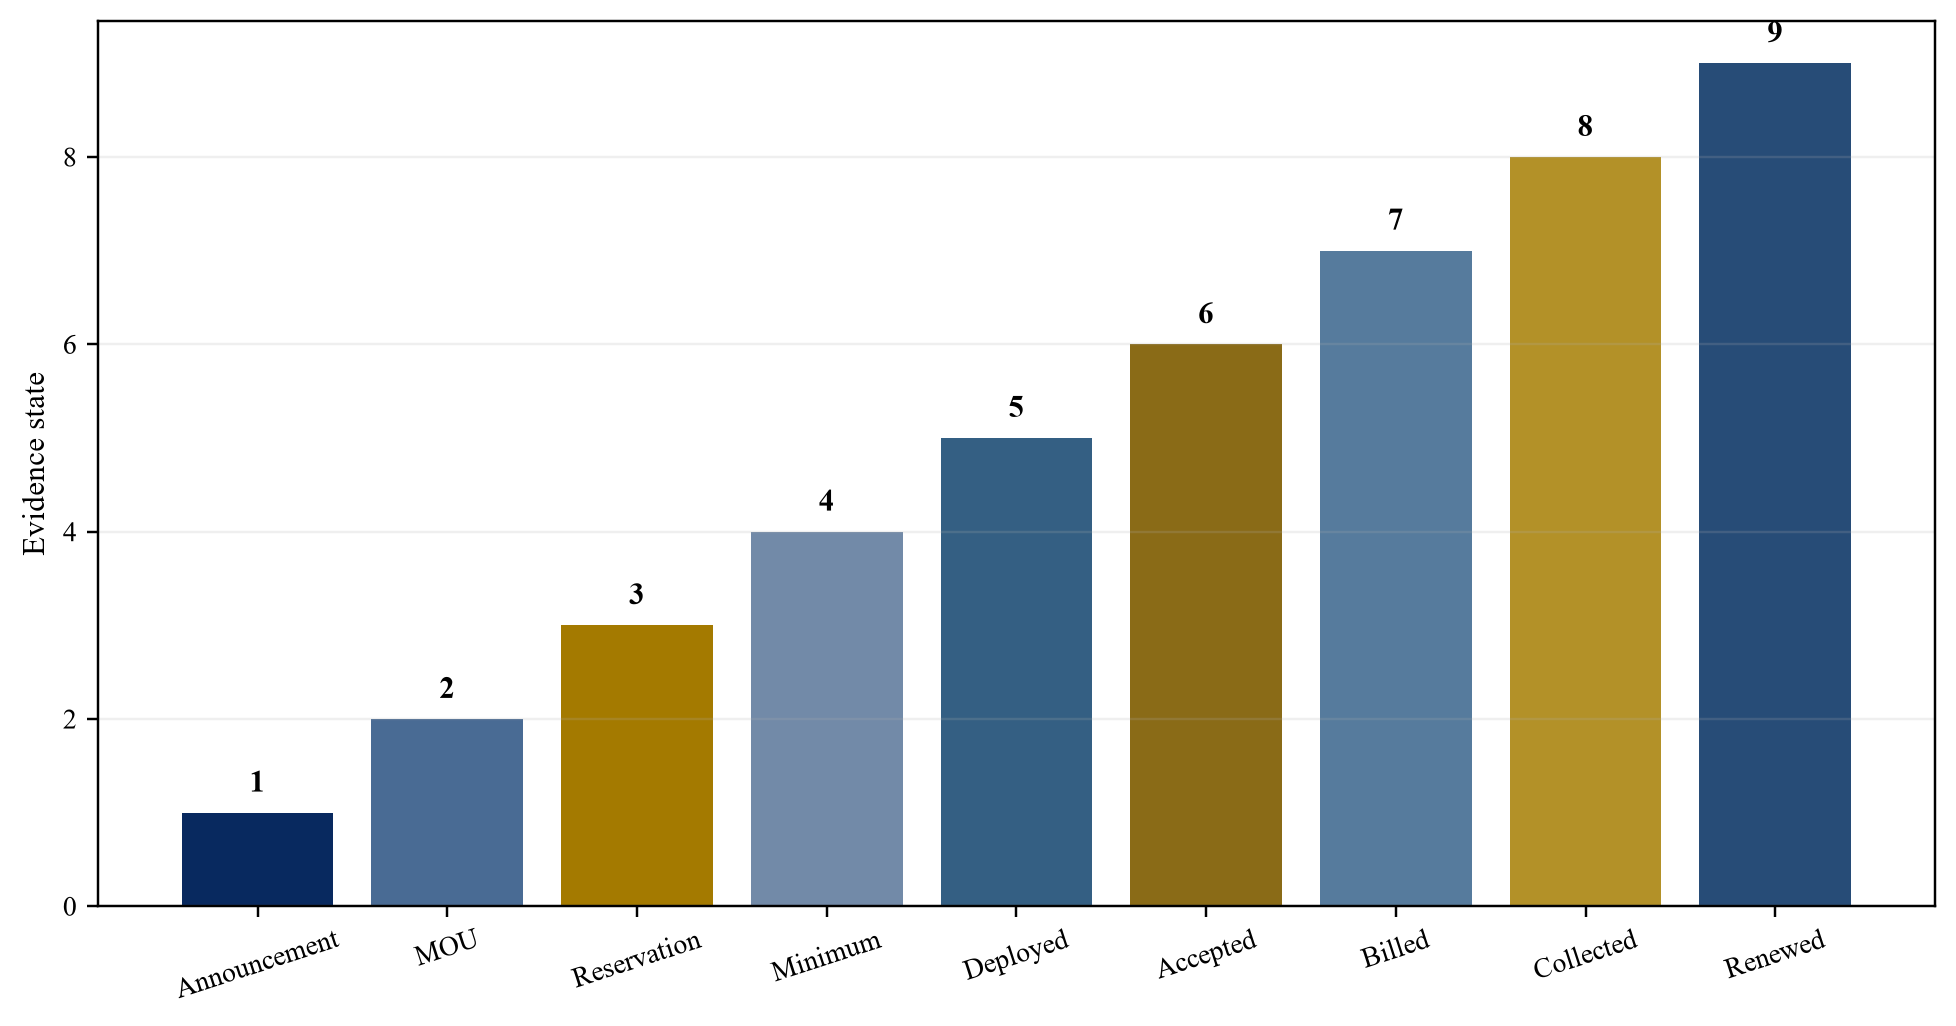
Wholly hypothetical; Matchpoint Partners analysis.
| Field | Evidence | Financial use |
|---|---|---|
| Hardware and configuration | serials and bill of materials | workload fit |
| Commissioning and telemetry | tests and scheduler | revenue timing |
| Title and security | invoice and financing | claims bridge |
| Refresh and residual | approved plan and support | free cash flow |
Proposed framework unless stated otherwise.
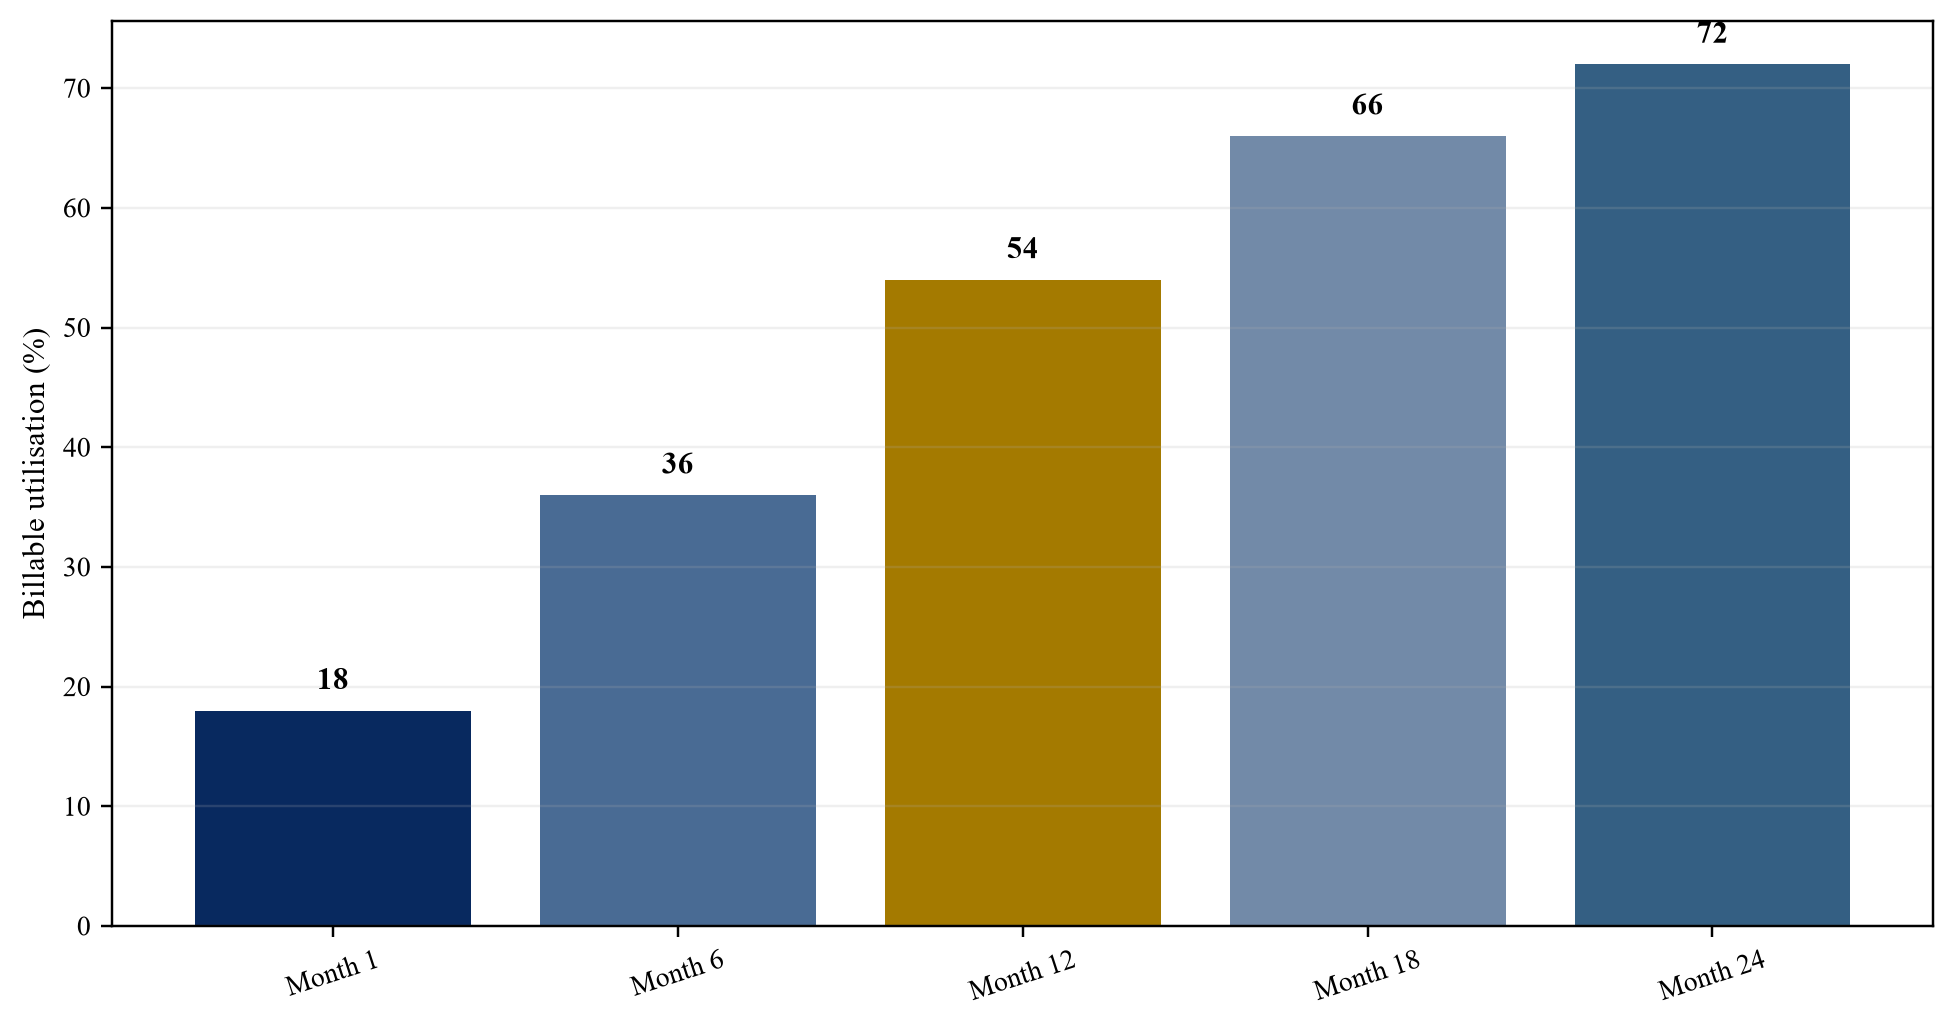
Wholly hypothetical; Matchpoint Partners analysis.
| Instrument | Primary linkage | Closing test |
|---|---|---|
| Equipment finance | identified GPU cohort | life versus amortisation |
| Project debt | site and contracted cash | delivery and concentration |
| Lease | data-centre capacity | term and unavoidable cost |
| Customer prepayment | delivery obligation | refund and restriction |
Proposed framework unless stated otherwise.
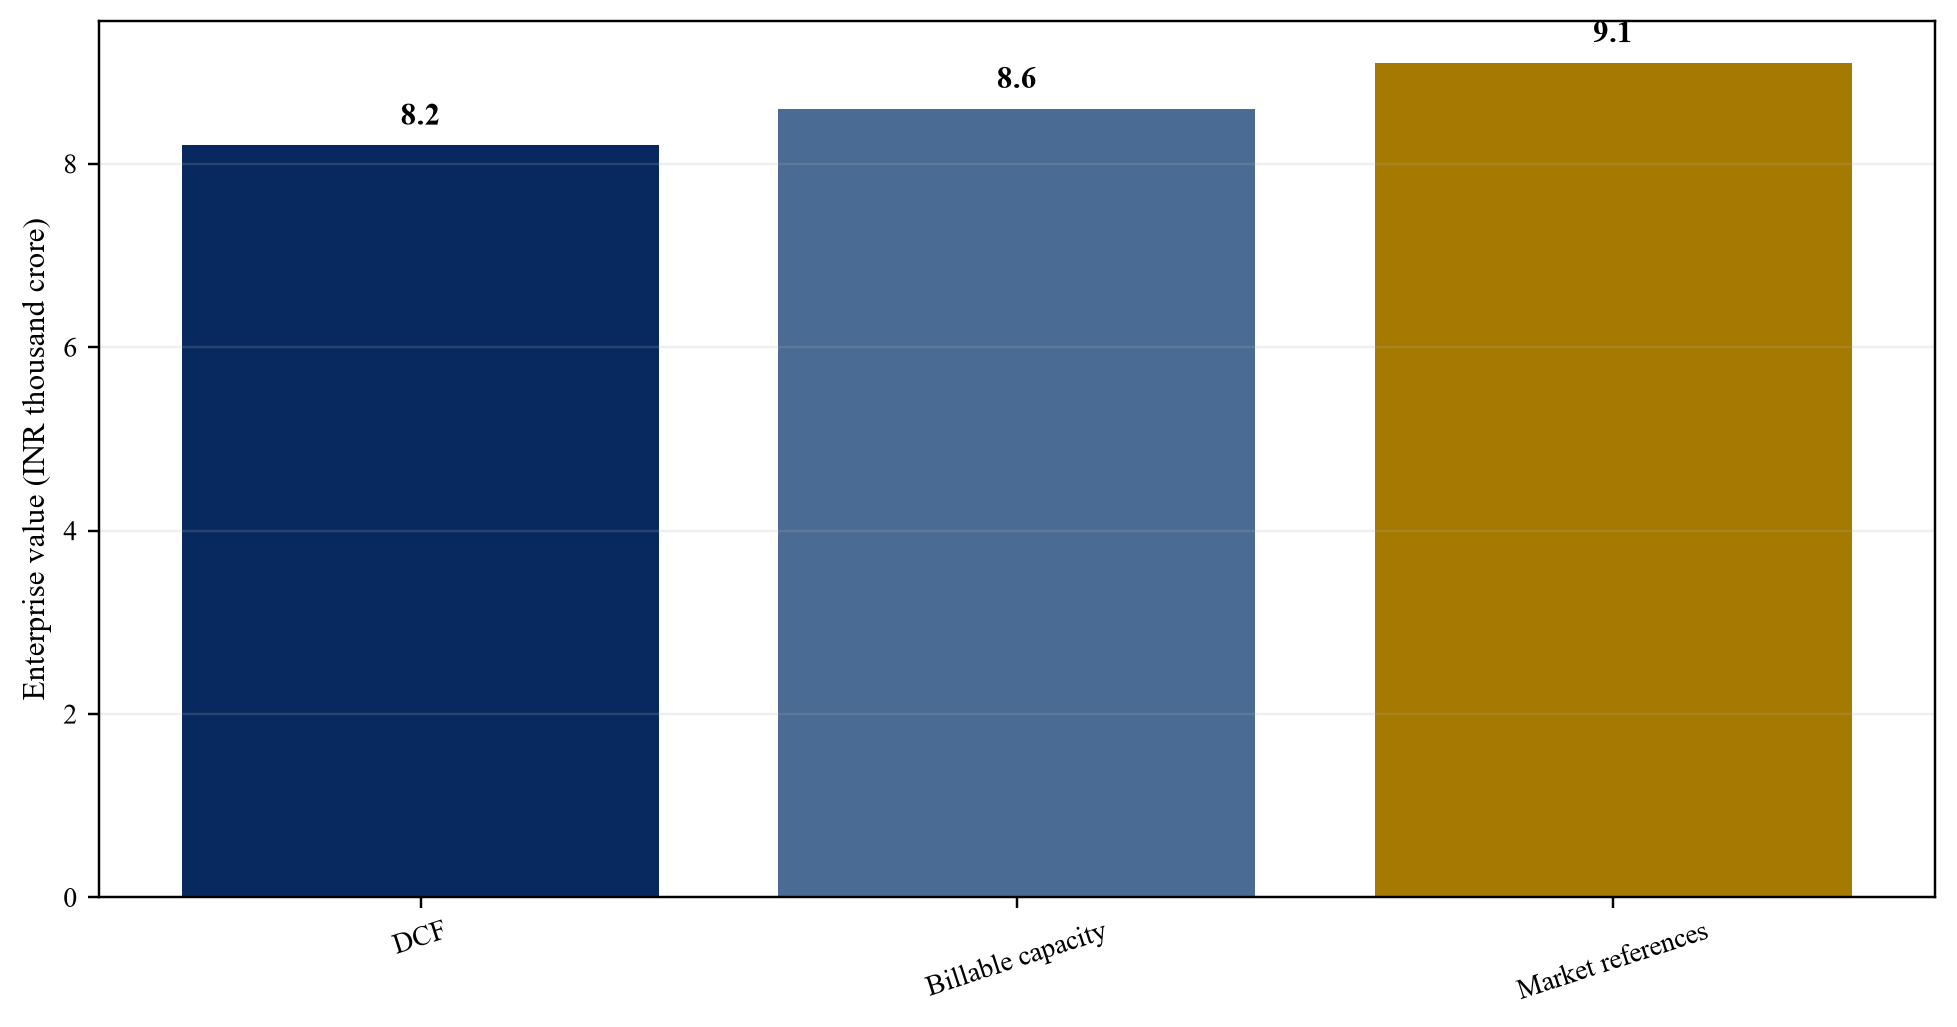
Wholly hypothetical; Matchpoint Partners analysis.
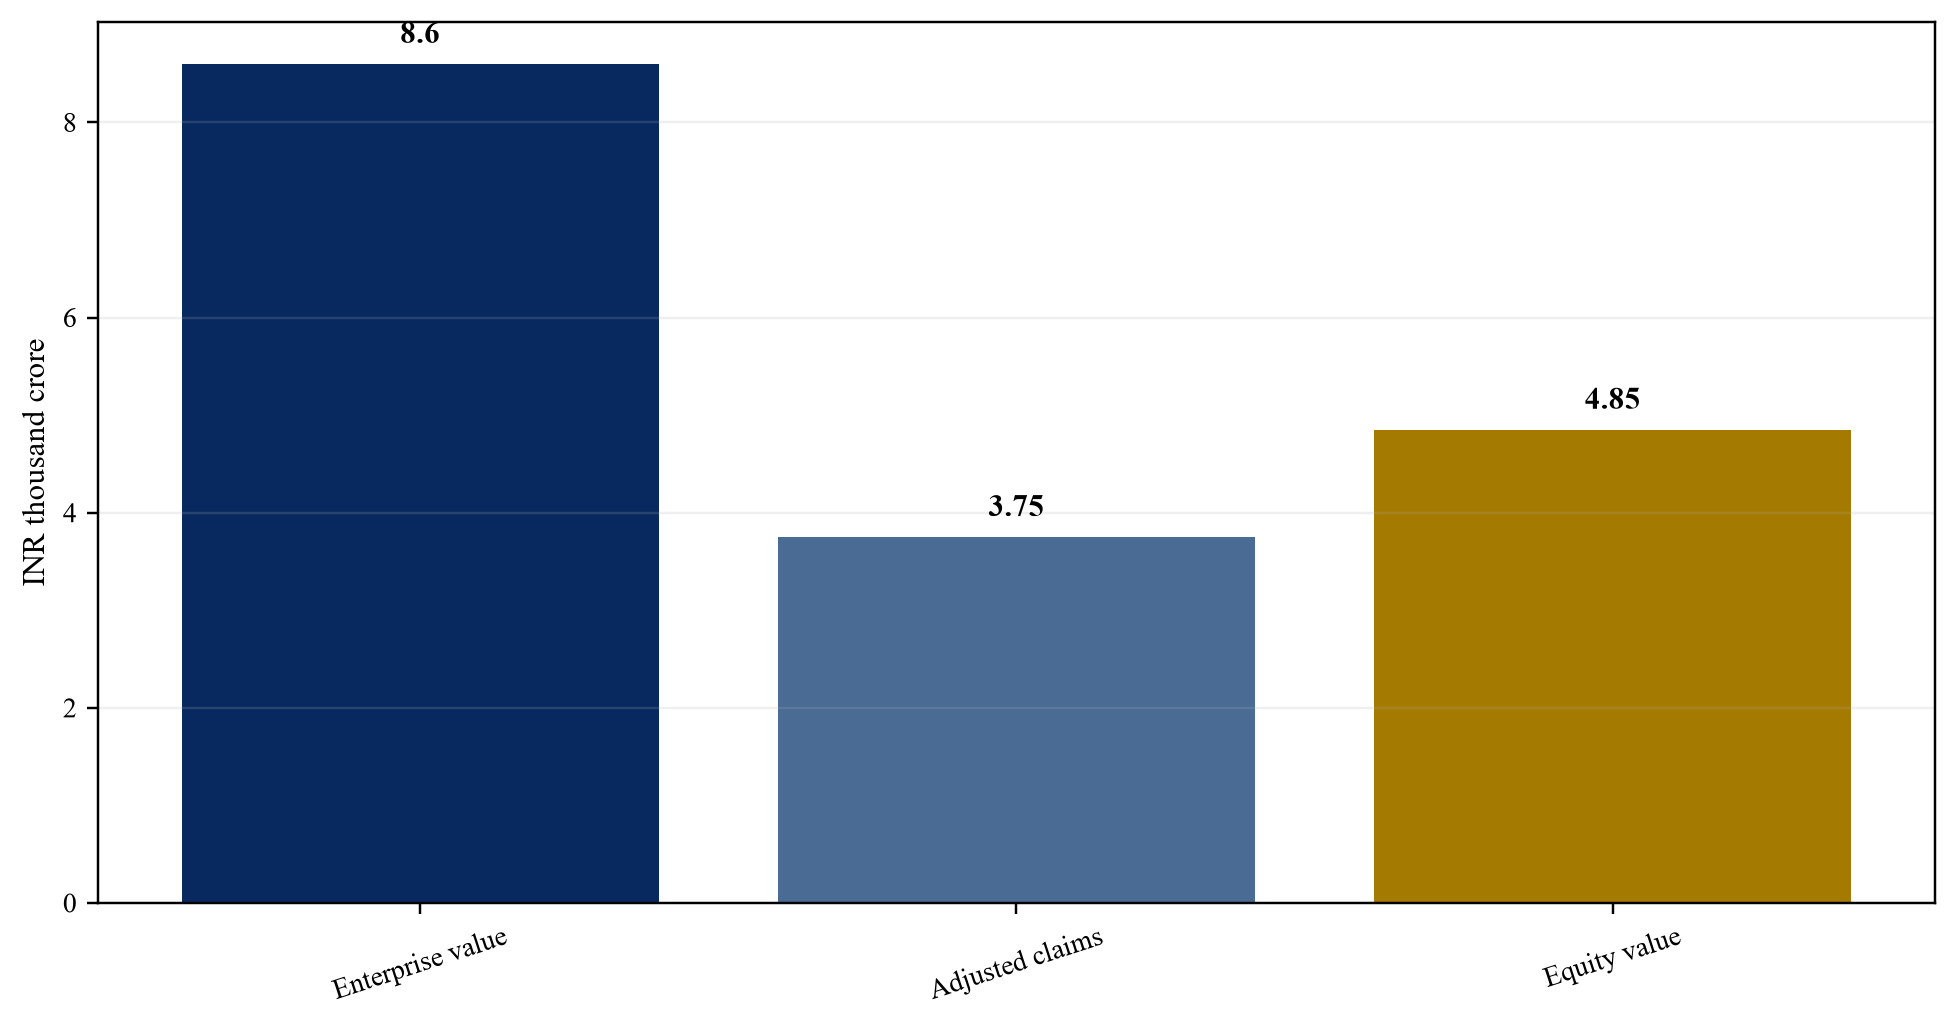
Wholly hypothetical; Matchpoint Partners analysis.
| Item | Central case | Combined downside |
|---|---|---|
| Enterprise value | INR 8,600 crore | INR 3,600 crore |
| Adjusted claims | INR 3,750 crore | INR 4,050 crore |
| Illustrative equity | INR 4,850 crore | INR 0 crore |
Proposed framework unless stated otherwise.
| Metric | Primary source | Trigger |
|---|---|---|
| Accepted billable capacity | customer acceptance and telemetry | delivery slippage |
| Independent collected revenue | invoice and bank | cohort contraction |
| Contribution margin | ledger and usage | pricing or cost variance |
| Liquidity and claims | treasury and facilities | headroom breach |
Proposed framework unless stated otherwise.
Sources
- Press Information Bureau, Cabinet approves IndiaAI Mission with outlay exceeding INR 10,300 crore, 7 March 2024. Read the primary source
- Press Information Bureau, India’s common compute capacity crosses 34,000 GPUs, 30 May 2025. Read the primary source
- Press Information Bureau, IndiaAI Mission expands AI ecosystem with affordable compute and startup support, 25 March 2026. Read the primary source
- Press Information Bureau, IndiaAI compute capacity and pricing support, 30 July 2025. Read the primary source
- IndiaAI, IndiaAI Compute Portal. Read the primary source
- IndiaAI, Compute Portal end-user allocations and service-provider data. Read the primary source
- IndiaAI, Ready Reckoner for Compute Users, March 2026. Read the primary source
- Press Information Bureau, IndiaAI Mission foundation and common compute update, 13 February 2026. Read the primary source
- Press Information Bureau, Compute capacity and AI infrastructure in India, February 2026. Read the primary source
- Yotta Data Services, Yotta empanelled in India AI Mission, 17 February 2025. Read the primary source
- Yotta Data Services, Yotta and NVIDIA launch Shakti Cloud on DGX Cloud Lepton, 19 May 2025. Read the primary source
- Yotta Data Services, Yotta and Microsoft advance AI innovation in India, 28 May 2025. Read the primary source
- Yotta Data Services, Shakti Cloud product information. Read the primary source
- Bharti Airtel, Integrated Report and Annual Financial Statements 2024-25. Read the primary source
- Nxtra Data, Sustainability Report 2025. Read the primary source
- Reserve Bank of India, External Commercial Borrowings and Trade Credits FAQs. Read the primary source
- Reserve Bank of India, Master Direction on Risk Management and Inter-Bank Dealings. Read the primary source
- Reserve Bank of India, Historical foreign-exchange market data. Read the primary source
- Central Electricity Authority, Load Generation Balance Reports. Read the primary source
- Ministry of Power, Green Energy Open Access Rules. Read the primary source
- Ministry of Electronics and Information Technology, IndiaAI Mission. Read the primary source
- Digital Personal Data Protection Act, 2023. Read the primary source
- CERT-In, Directions relating to information security practices and incident reporting. Read the primary source
- International Energy Agency, Energy and AI. Read the primary source
- NVIDIA Corporation, Annual Report for fiscal 2026. Read the primary source
- IFRS Foundation, IFRS 15 Revenue from Contracts with Customers. Read the primary source
- IFRS Foundation, IAS 16 Property, Plant and Equipment. Read the primary source
- IFRS Foundation, IAS 36 Impairment of Assets. Read the primary source
- IFRS Foundation, IFRS 16 Leases. Read the primary source
- International Valuation Standards Council, International Valuation Standards. Read the primary source
