

1. Define the programme and financing perimeter
A national compute programme can include policy, procurement, subsidy administration, provider-owned equipment, cloud services, data-centre infrastructure, networks, user projects and sovereign clusters. Financing analysis must identify which entity owns each asset, contracts with each user, receives each payment and bears each service obligation. The analysis should identify the legal owner, service operator, payer, beneficiary and party bearing remediation or transition cost. [1][2][8][11]
The evidence file should begin with mission approvals, procurement documents, provider agreements, subsidy rules, service orders, asset registers, invoices, payment flows and intended financing perimeter. Each record should state scope, effective date, expiry or refresh point, accountable owner and relationship to usable capacity, user outcomes and cash. Policy announcements establish context. Financing conclusions require executed obligations and observed service performance.
The principal failure is that the programme name is treated as one project company even though assets, cash and obligations sit across public and private entities. The practical response is to draw the legal and cash-flow perimeter before sizing capital or assigning value. Central assumptions should reflect enforceable arrangements and observed utilisation. Downside cases should combine related demand, price, technology, power, provider, cybersecurity, policy and liquidity risks. Management estimates should be identified in the model and refreshed as evidence changes.
2. Read official capacity numbers through an evidence ladder
Official disclosures show rapid expansion from the initial mission target to more than 45,000 onboarded GPUs. Onboarded capacity can include provider resources available through a portal and should be distinguished from owned, reserved, installed, energised, scheduled, consumed and paid capacity. The analysis should identify the legal owner, service operator, payer, beneficiary and party bearing remediation or transition cost. [1][2][3][4][5][6]
The evidence file should begin with official disclosures, provider empanelment, serialised equipment or instance inventory, portal availability, service logs, invoices and receipts. Each record should state scope, effective date, expiry or refresh point, accountable owner and relationship to usable capacity, user outcomes and cash. Policy announcements establish context. Financing conclusions require executed obligations and observed service performance.
The principal failure is that headline GPU counts are converted directly into capital expenditure, utilisation or sovereign ownership. The practical response is to classify each capacity number by ownership, location, configuration, availability, use and payment evidence. Central assumptions should reflect enforceable arrangements and observed utilisation. Downside cases should combine related demand, price, technology, power, provider, cybersecurity, policy and liquidity risks. Management estimates should be identified in the model and refreshed as evidence changes.
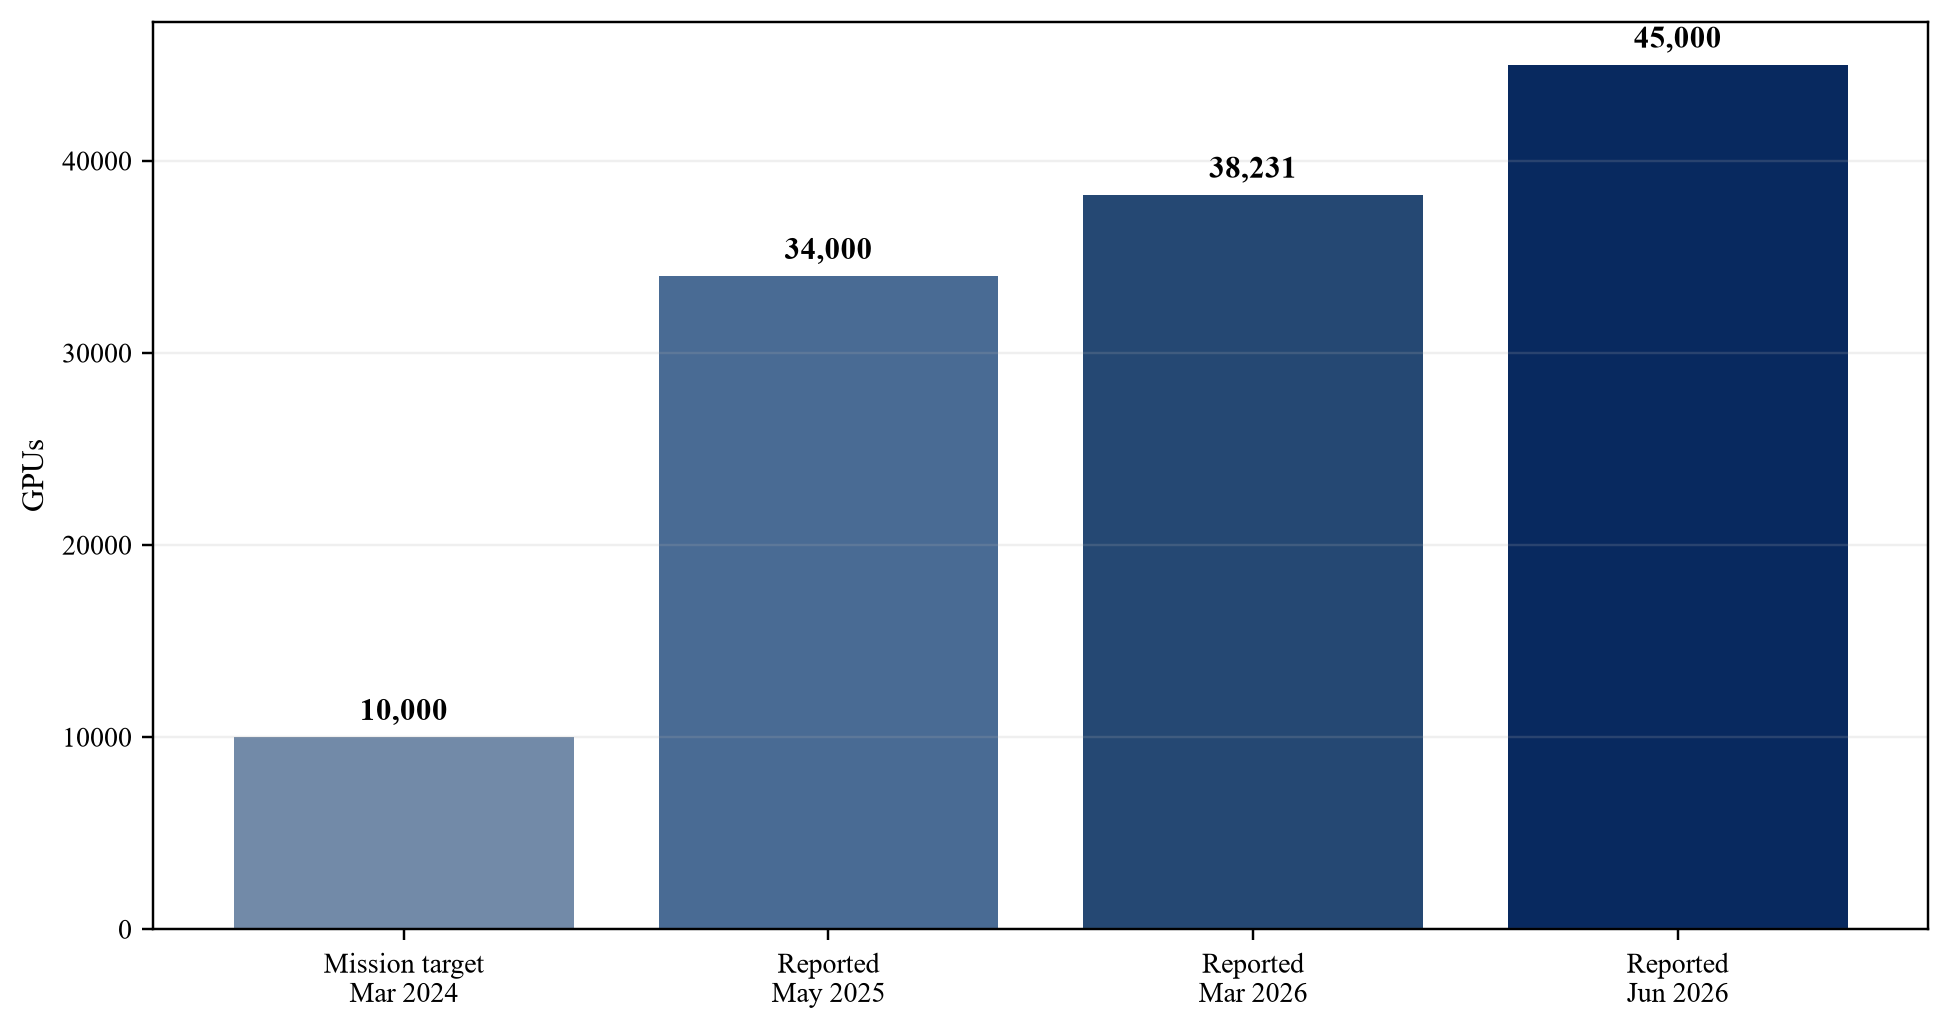
Government disclosures; GPU counts describe onboarded or provisioned shared capacity, not common ownership.
| Stage | Evidence | Permitted use |
|---|---|---|
| policy target | approved mission document | strategic context |
| empanelled capacity | provider and service listing | potential supply |
| available service | portal and technical acceptance | service capacity |
| approved request | sanctioned user hours | demand pipeline |
| consumed service | provider telemetry | delivered use |
| accepted and invoiced | customer acceptance and bill | revenue test |
| collected cash | bank receipt and reconciliation | repayment evidence |
Proposed classification; direct records determine treatment.
3. Define the public-service objective
Affordable shared compute can reduce entry barriers for research, start-ups, public services and smaller firms. A financing structure needs a measurable service objective such as eligible access, project completion, queue time, cost reduction, regional reach or strategic workload capability. The analysis should identify the legal owner, service operator, payer, beneficiary and party bearing remediation or transition cost. [1][5][7][9]
The evidence file should begin with beneficiary definition, baseline access cost, project criteria, allocation rules, service levels, outcome records and counterfactual options. Each record should state scope, effective date, expiry or refresh point, accountable owner and relationship to usable capacity, user outcomes and cash. Policy announcements establish context. Financing conclusions require executed obligations and observed service performance.
The principal failure is that public benefit is described broadly while payment and performance tests reward installed capacity rather than useful service. The practical response is to select a small set of measurable access and capability outcomes and connect public support to verified delivery. Central assumptions should reflect enforceable arrangements and observed utilisation. Downside cases should combine related demand, price, technology, power, provider, cybersecurity, policy and liquidity risks. Management estimates should be identified in the model and refreshed as evidence changes.
4. Separate the portal from the asset base
The Compute Portal is an access and approval layer. The underlying accelerators, servers, storage, networks, software and facilities can be owned or controlled by empanelled providers. The buyer or lender should avoid assuming the portal owns recoverable hardware. The analysis should identify the legal owner, service operator, payer, beneficiary and party bearing remediation or transition cost. [2][7][8]
The evidence file should begin with portal terms, empanelment contracts, provider asset registers, title, leases, licences, locations and substitution rights. Each record should state scope, effective date, expiry or refresh point, accountable owner and relationship to usable capacity, user outcomes and cash. Policy announcements establish context. Financing conclusions require executed obligations and observed service performance.
The principal failure is that a common interface is treated as common ownership and one security perimeter. The practical response is to map each service listing to the provider, asset cohort, site, licence, performance obligation and recovery route. Central assumptions should reflect enforceable arrangements and observed utilisation. Downside cases should combine related demand, price, technology, power, provider, cybersecurity, policy and liquidity risks. Management estimates should be identified in the model and refreshed as evidence changes.
5. Convert user eligibility into demand evidence
Eligibility and registration create a potential user base. Financeable demand requires approved requests, budget, service configuration, reservation, consumption, acceptance and payment. Auto-approval for smaller requests can reduce friction while still requiring usage evidence. The analysis should identify the legal owner, service operator, payer, beneficiary and party bearing remediation or transition cost. [2][6][7]
The evidence file should begin with registrations, approvals, requested configurations, sanctioned hours, reservations, service logs, acceptance, invoices and payments. Each record should state scope, effective date, expiry or refresh point, accountable owner and relationship to usable capacity, user outcomes and cash. Policy announcements establish context. Financing conclusions require executed obligations and observed service performance.
The principal failure is that registered users or sanctioned hours are modelled as guaranteed paid utilisation. The practical response is to build a demand ladder from eligible user through collected cash and report conversion at every stage. Central assumptions should reflect enforceable arrangements and observed utilisation. Downside cases should combine related demand, price, technology, power, provider, cybersecurity, policy and liquidity risks. Management estimates should be identified in the model and refreshed as evidence changes.
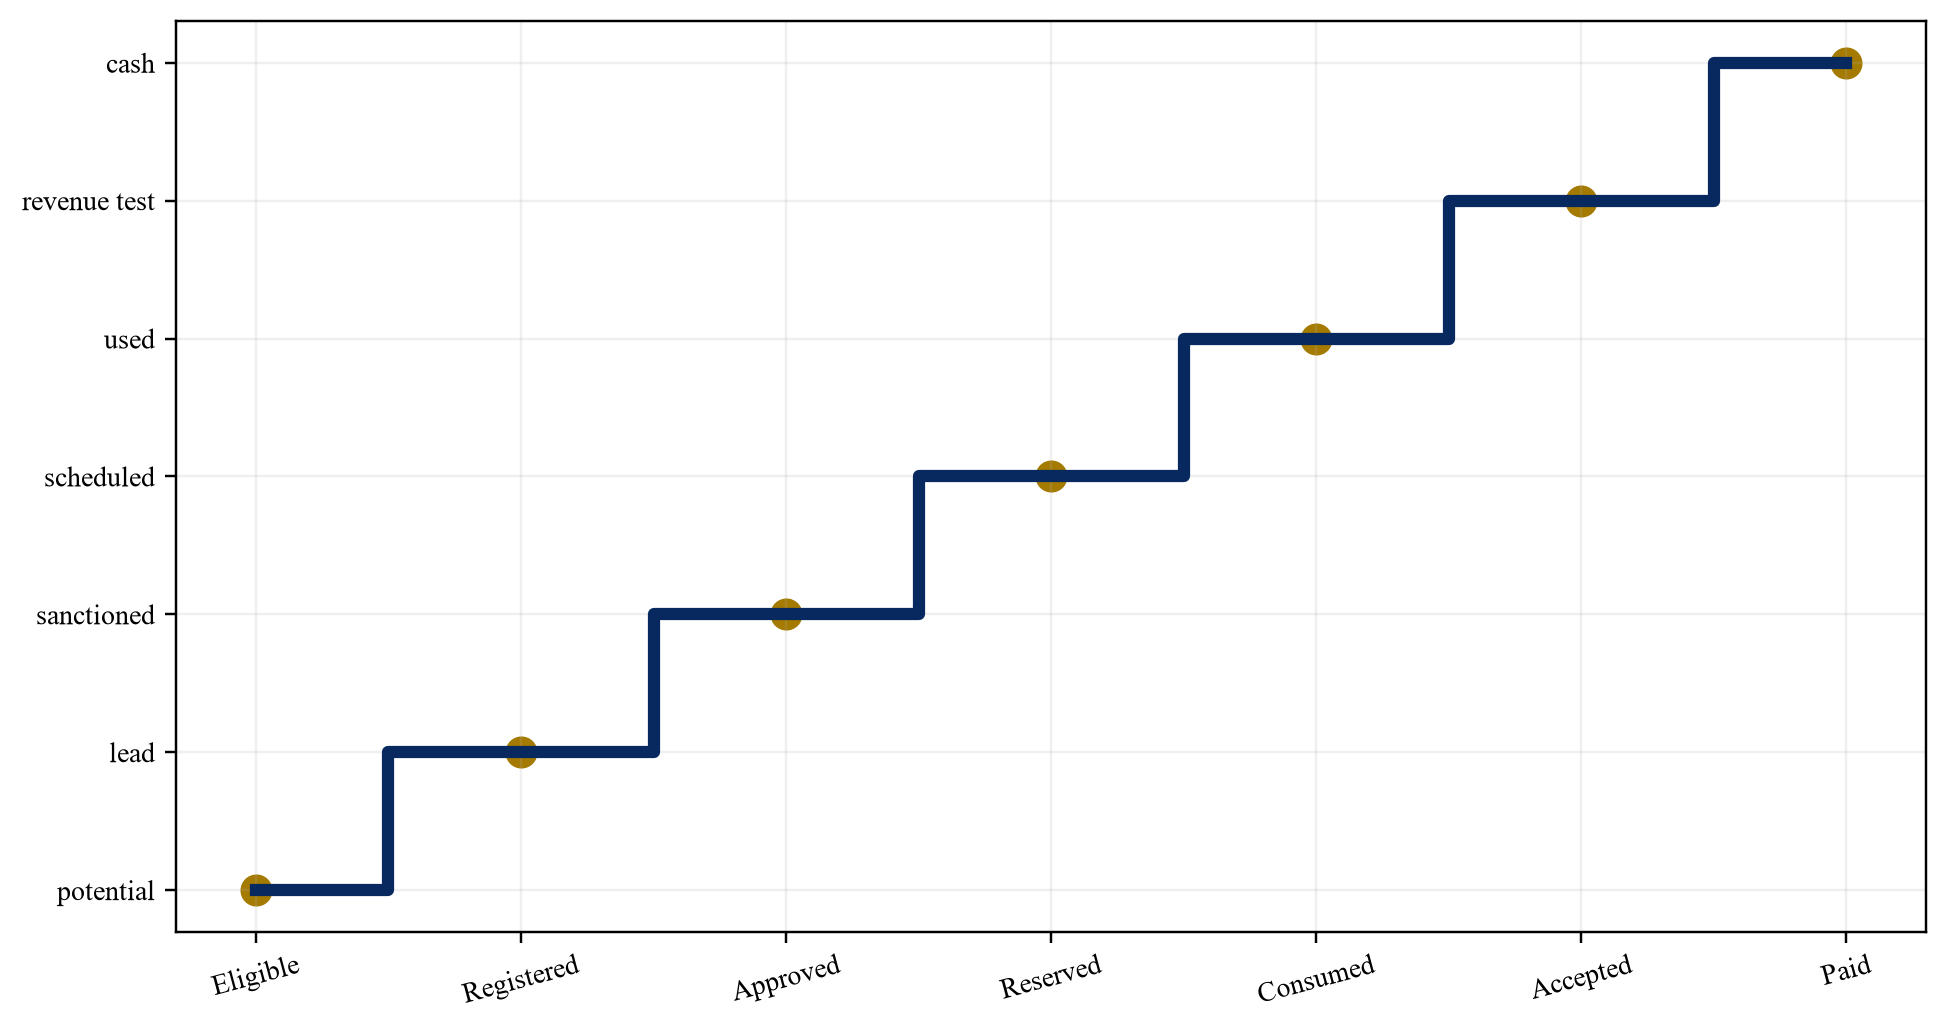
Proposed framework; financeable treatment depends on direct records.
6. Segment strategic and commercial workloads
Foundation-model training, research, public-service applications, start-up experimentation and commercial inference have different duration, configuration, data, security and price requirements. Capacity planning should not aggregate them into one fungible demand pool. The analysis should identify the legal owner, service operator, payer, beneficiary and party bearing remediation or transition cost. [6][9][10]
The evidence file should begin with project purpose, model size, workload profile, accelerator configuration, storage, network, security, duration, budget and scheduling flexibility. Each record should state scope, effective date, expiry or refresh point, accountable owner and relationship to usable capacity, user outcomes and cash. Policy announcements establish context. Financing conclusions require executed obligations and observed service performance.
The principal failure is that one average GPU-hour price and utilisation assumption is applied to technically different workloads. The practical response is to create capacity products and queues that match workload requirements and disclose cross-subsidy. Central assumptions should reflect enforceable arrangements and observed utilisation. Downside cases should combine related demand, price, technology, power, provider, cybersecurity, policy and liquidity risks. Management estimates should be identified in the model and refreshed as evidence changes.
7. Choose the market failure before the subsidy instrument
Public support can address high access cost, early demand uncertainty, strategic capability, geographic inclusion, domestic supply development or positive research spillovers. Each problem requires a different instrument and termination condition. The analysis should identify the legal owner, service operator, payer, beneficiary and party bearing remediation or transition cost. [1][3][5][12]
The evidence file should begin with market evidence, beneficiary economics, provider bids, alternative services, cost gap, spillover case and measurable additionality. Each record should state scope, effective date, expiry or refresh point, accountable owner and relationship to usable capacity, user outcomes and cash. Policy announcements establish context. Financing conclusions require executed obligations and observed service performance.
The principal failure is that a uniform percentage subsidy pays for usage that would have occurred without support or rewards expensive supply. The practical response is to target the verified gap and use competitive pricing, caps, expiry and outcome review. Central assumptions should reflect enforceable arrangements and observed utilisation. Downside cases should combine related demand, price, technology, power, provider, cybersecurity, policy and liquidity risks. Management estimates should be identified in the model and refreshed as evidence changes.
| Instrument | Market problem | Release test |
|---|---|---|
| user subsidy | access cost | accepted eligible usage |
| availability payment | early demand uncertainty | tested available capacity |
| capital grant | public-good capability | competitive award and completion |
| first-loss reserve | limited credit history | verified portfolio loss |
| credit enhancement | debt tenor or rating gap | defined debt obligation |
| outcome payment | research or service spillover | independently measured result |
Proposed framework; legal authority and scheme terms govern.
8. Use competitive procurement to discover price
Empanelment can preserve provider competition when service specifications, comparison units, performance and allocation rules are clear. Price alone may be misleading where accelerators, memory, interconnect, storage, software and support differ. The analysis should identify the legal owner, service operator, payer, beneficiary and party bearing remediation or transition cost. [2][6][8][9]
The evidence file should begin with bid documents, technical configurations, benchmark results, price cards, discounts, service credits, change rules and award decisions. Each record should state scope, effective date, expiry or refresh point, accountable owner and relationship to usable capacity, user outcomes and cash. Policy announcements establish context. Financing conclusions require executed obligations and observed service performance.
The principal failure is that nominal GPU-hour prices are compared across non-equivalent configurations and service levels. The practical response is to use workload-normalised units, total job cost, completion time and quality-adjusted performance. Central assumptions should reflect enforceable arrangements and observed utilisation. Downside cases should combine related demand, price, technology, power, provider, cybersecurity, policy and liquidity risks. Management estimates should be identified in the model and refreshed as evidence changes.
9. Design transparent allocation and queue governance
Scarce capacity requires rules for eligibility, priority, request size, scheduling, extensions, unused reservations and appeals. Transparent reporting can protect access objectives and show whether subsidised capacity reaches intended users. The analysis should identify the legal owner, service operator, payer, beneficiary and party bearing remediation or transition cost. [2][6][7]
The evidence file should begin with allocation policy, scoring, committee records, queue data, approvals, actual usage, expiry, exception and appeal logs. Each record should state scope, effective date, expiry or refresh point, accountable owner and relationship to usable capacity, user outcomes and cash. Policy announcements establish context. Financing conclusions require executed obligations and observed service performance.
The principal failure is that strategic labels or sponsor relationships override published allocation rules without an auditable record. The practical response is to publish aggregate allocation, queue, completion and exception metrics while protecting sensitive project information. Central assumptions should reflect enforceable arrangements and observed utilisation. Downside cases should combine related demand, price, technology, power, provider, cybersecurity, policy and liquidity risks. Management estimates should be identified in the model and refreshed as evidence changes.
10. Translate capacity into usable service
A GPU count does not describe memory, performance, interconnect, software, storage, network, power availability, uptime or support. User value depends on a tested service that completes the intended workload. The analysis should identify the legal owner, service operator, payer, beneficiary and party bearing remediation or transition cost. [6][9][10]
The evidence file should begin with configuration inventory, benchmark suite, availability, job completion, failure rate, queue time, support, security and customer acceptance. Each record should state scope, effective date, expiry or refresh point, accountable owner and relationship to usable capacity, user outcomes and cash. Policy announcements establish context. Financing conclusions require executed obligations and observed service performance.
The principal failure is that capacity is counted when listed even though configuration or service constraints prevent productive use. The practical response is to recognise usable capacity only after technical and service acceptance against a defined product. Central assumptions should reflect enforceable arrangements and observed utilisation. Downside cases should combine related demand, price, technology, power, provider, cybersecurity, policy and liquidity risks. Management estimates should be identified in the model and refreshed as evidence changes.
| Dimension | Minimum record | User-facing disclosure |
|---|---|---|
| accelerator | model, memory and quantity | configuration and price |
| interconnect | topology and bandwidth | scaling constraint |
| storage and network | throughput and location | included and variable cost |
| software | versions and licences | permitted use |
| availability | maintenance and credits | service level |
| support and security | response and control tier | eligibility and escalation |
Proposed specification; each provider product requires technical acceptance.
11. Match funding to asset and service lives
Buildings, power and cooling can support long-tenor infrastructure finance. Accelerators, networking and storage have shorter technology and economic lives. Software and public access support follow service periods rather than physical-asset lives. The analysis should identify the legal owner, service operator, payer, beneficiary and party bearing remediation or transition cost. [10][18][24]
The evidence file should begin with asset cohorts, purchase and lease terms, useful lives, maintenance, refresh plan, residual evidence, service contracts and cash waterfalls. Each record should state scope, effective date, expiry or refresh point, accountable owner and relationship to usable capacity, user outcomes and cash. Policy announcements establish context. Financing conclusions require executed obligations and observed service performance.
The principal failure is that long-term debt assumes the initial accelerator cohort remains competitive through the facility tenor. The practical response is to combine infrastructure debt, cohort equipment finance, equity and refresh reserves matched to the relevant cash flow. Central assumptions should reflect enforceable arrangements and observed utilisation. Downside cases should combine related demand, price, technology, power, provider, cybersecurity, policy and liquidity risks. Management estimates should be identified in the model and refreshed as evidence changes.
12. Structure public support as a bounded instrument
Support can be paid as a customer subsidy, provider availability payment, competitively bid capital grant, first-loss reserve or outcome payment. The instrument should state beneficiary, purpose, cap, duration, release test, audit and clawback. The analysis should identify the legal owner, service operator, payer, beneficiary and party bearing remediation or transition cost. [1][12][13][14]
The evidence file should begin with approved scheme, appropriation, contract, payment milestones, measurement protocol, audit rights, expiry and recovery provisions. Each record should state scope, effective date, expiry or refresh point, accountable owner and relationship to usable capacity, user outcomes and cash. Policy announcements establish context. Financing conclusions require executed obligations and observed service performance.
The principal failure is that policy intent is treated as an unconditional long-term revenue stream. The practical response is to include support only when an enforceable instrument and verified conditions connect it to the financed entity. Central assumptions should reflect enforceable arrangements and observed utilisation. Downside cases should combine related demand, price, technology, power, provider, cybersecurity, policy and liquidity risks. Management estimates should be identified in the model and refreshed as evidence changes.
13. Contract anchor users without crowding out access
Government bodies, public research institutions, foundation-model teams and enterprises can improve capacity planning through reservations or minimum use. The programme should prevent a few anchors from consuming subsidised capacity intended for wider access. The analysis should identify the legal owner, service operator, payer, beneficiary and party bearing remediation or transition cost. [5][6][7]
The evidence file should begin with reservation contracts, minimum payments, user class, capacity windows, release rights, price, credit and access caps. Each record should state scope, effective date, expiry or refresh point, accountable owner and relationship to usable capacity, user outcomes and cash. Policy announcements establish context. Financing conclusions require executed obligations and observed service performance.
The principal failure is that non-binding expressions of interest are used to size debt or anchor reservations displace eligible smaller users. The practical response is to use paid reservations, release unused blocks and maintain separate access pools with disclosed utilisation. Central assumptions should reflect enforceable arrangements and observed utilisation. Downside cases should combine related demand, price, technology, power, provider, cybersecurity, policy and liquidity risks. Management estimates should be identified in the model and refreshed as evidence changes.
14. Measure utilisation consistently
Installed, available, reserved, scheduled, active, billable and paid hours measure different states. A finance model should reconcile physical capacity to service availability and cash without double counting reservations or failed jobs. The analysis should identify the legal owner, service operator, payer, beneficiary and party bearing remediation or transition cost. [2][6][9]
The evidence file should begin with capacity calendar, maintenance, service logs, reservations, active jobs, billing records, credits, invoices and cash receipts. Each record should state scope, effective date, expiry or refresh point, accountable owner and relationship to usable capacity, user outcomes and cash. Policy announcements establish context. Financing conclusions require executed obligations and observed service performance.
The principal failure is that utilisation uses the most favourable numerator and denominator and masks outage, queue or non-payment. The practical response is to publish a capacity waterfall and define every utilisation measure in contracts and lender reports. Central assumptions should reflect enforceable arrangements and observed utilisation. Downside cases should combine related demand, price, technology, power, provider, cybersecurity, policy and liquidity risks. Management estimates should be identified in the model and refreshed as evidence changes.
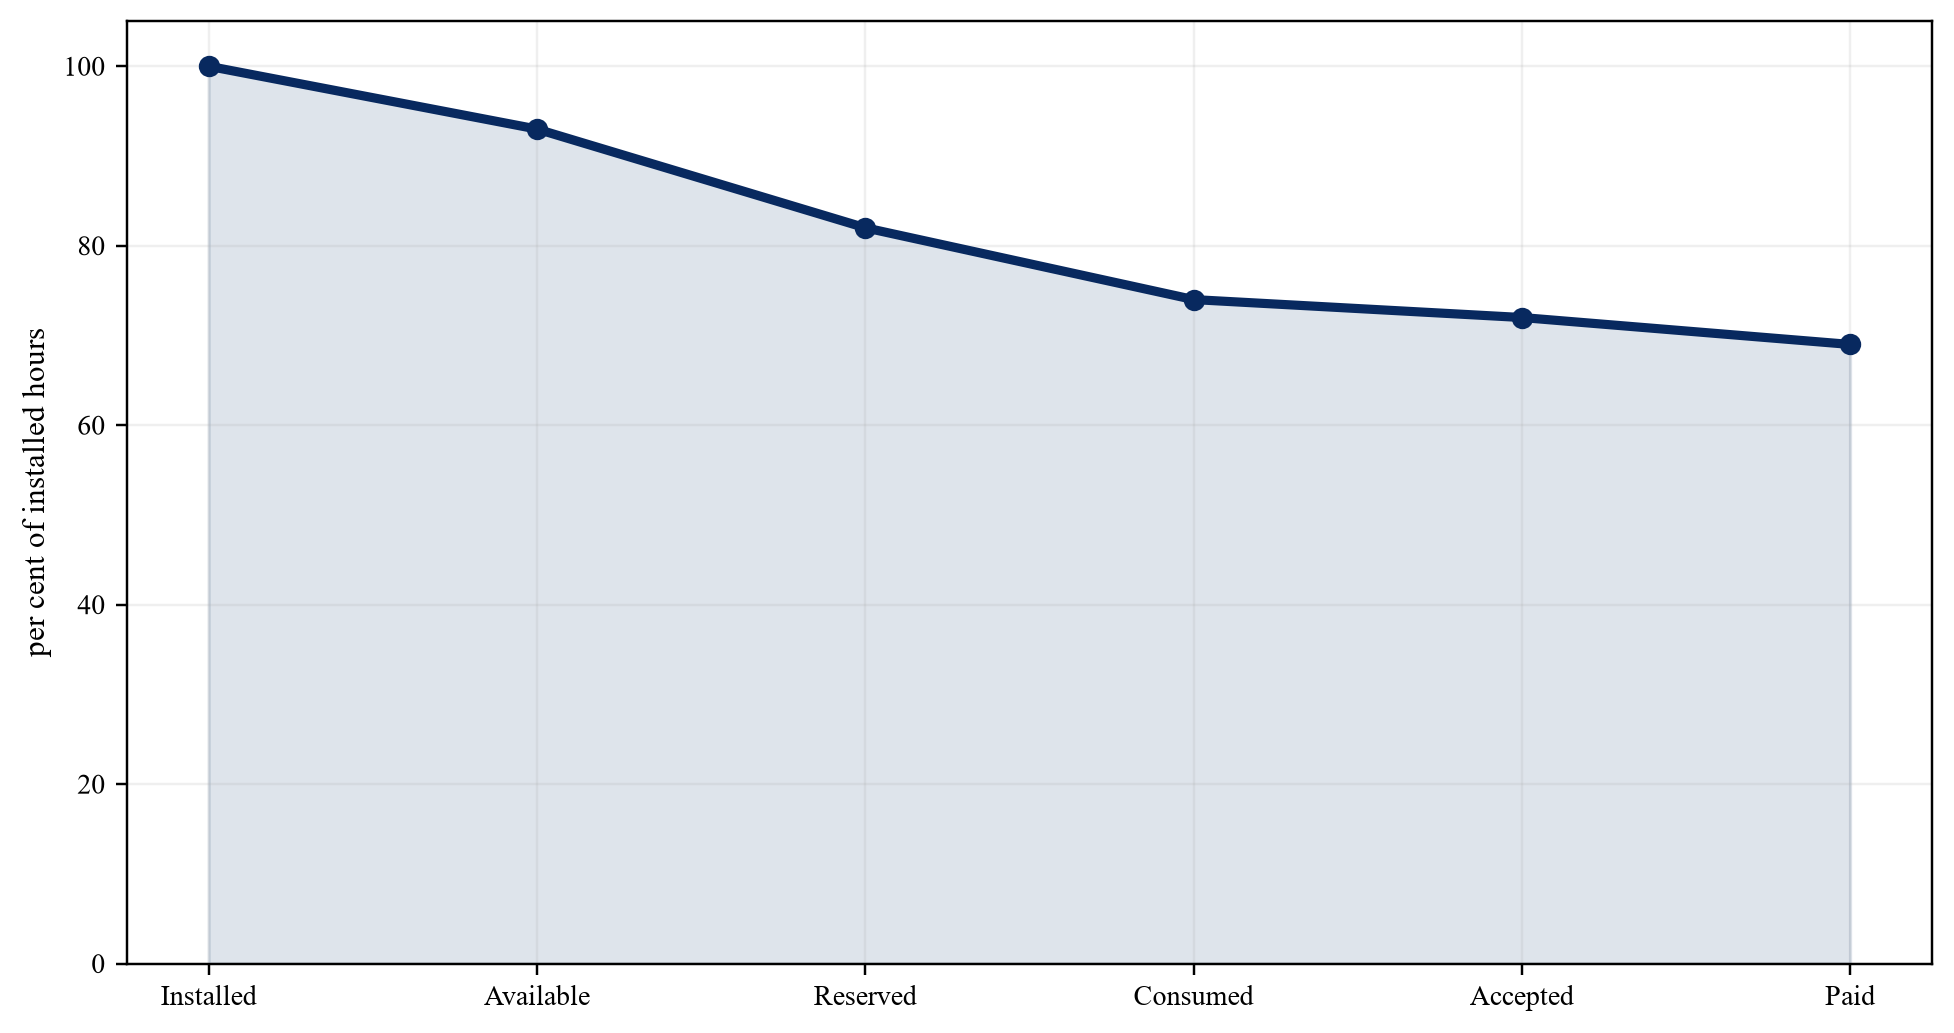
Wholly hypothetical; share of annual accelerator-hours.
15. Build unit economics by workload
Revenue per hour, subsidy, power, facility, licence, support, network, maintenance and refresh cost vary by product. A blended average can conceal loss-making strategic workloads and profitable commercial demand. The analysis should identify the legal owner, service operator, payer, beneficiary and party bearing remediation or transition cost. [6][9][10]
The evidence file should begin with product price, subsidy, technical configuration, energy telemetry, software licence, support effort, failure rate and refresh allocation. Each record should state scope, effective date, expiry or refresh point, accountable owner and relationship to usable capacity, user outcomes and cash. Policy announcements establish context. Financing conclusions require executed obligations and observed service performance.
The principal failure is that all hours receive one margin even when configurations and service intensity differ materially. The practical response is to calculate contribution by workload and show the public cost and commercial margin separately. Central assumptions should reflect enforceable arrangements and observed utilisation. Downside cases should combine related demand, price, technology, power, provider, cybersecurity, policy and liquidity risks. Management estimates should be identified in the model and refreshed as evidence changes.
| Component | Revenue or cost driver | Evidence |
|---|---|---|
| user payment | accepted billable hours | invoice and cash |
| public subsidy | eligible accepted hours | scheme payment |
| power and cooling | energy per billable hour | meter and tariff |
| software and support | configuration and service tier | licences and staffing |
| maintenance | cohort and uptime | service records |
| refresh | economic life and residual | asset cohort plan |
Proposed treatment; product contracts and accounting advice govern.
16. Link power, water and location to service cost
AI compute depends on grid capacity, backup, cooling, water strategy, fibre and reliable facilities. Geographic diversity can improve resilience and access while increasing network and operating complexity. The analysis should identify the legal owner, service operator, payer, beneficiary and party bearing remediation or transition cost. [15][16][17]
The evidence file should begin with site power, tariffs, open-access arrangements, renewable contracts, cooling design, water use, fibre, outage history and expansion rights. Each record should state scope, effective date, expiry or refresh point, accountable owner and relationship to usable capacity, user outcomes and cash. Policy announcements establish context. Financing conclusions require executed obligations and observed service performance.
The principal failure is that capacity is allocated without the energy and cooling evidence needed to operate at the promised cost and availability. The practical response is to gate new service capacity by concurrent site, utility, network and environmental evidence. Central assumptions should reflect enforceable arrangements and observed utilisation. Downside cases should combine related demand, price, technology, power, provider, cybersecurity, policy and liquidity risks. Management estimates should be identified in the model and refreshed as evidence changes.
17. Manage imported hardware and supply concentration
Official sources acknowledge globally sourced accelerators and the concentration of advanced GPU manufacturing. Financing should address allocation, delivery, export control, currency, warranty, spares, support and replacement. The analysis should identify the legal owner, service operator, payer, beneficiary and party bearing remediation or transition cost. [3][4][18]
The evidence file should begin with purchase orders, supplier allocation, import approvals, currency hedges, warranties, support, serial numbers, delivery and substitution. Each record should state scope, effective date, expiry or refresh point, accountable owner and relationship to usable capacity, user outcomes and cash. Policy announcements establish context. Financing conclusions require executed obligations and observed service performance.
The principal failure is that public programme scale is assumed to guarantee access to future technology generations. The practical response is to fund verified cohorts, diversify qualified suppliers and maintain substitution and refresh options. Central assumptions should reflect enforceable arrangements and observed utilisation. Downside cases should combine related demand, price, technology, power, provider, cybersecurity, policy and liquidity risks. Management estimates should be identified in the model and refreshed as evidence changes.
18. Protect data, cybersecurity and strategic workloads
Shared capacity can process public, personal, research and commercially sensitive data. Architecture and contracts should define tenant isolation, location, access, encryption, incident response, logs, deletion and strategic-workload separation. The analysis should identify the legal owner, service operator, payer, beneficiary and party bearing remediation or transition cost. [19][20][21]
The evidence file should begin with data classification, DPDP applicability, security architecture, key management, access logs, incident tests, CERT-In duties and customer terms. Each record should state scope, effective date, expiry or refresh point, accountable owner and relationship to usable capacity, user outcomes and cash. Policy announcements establish context. Financing conclusions require executed obligations and observed service performance.
The principal failure is that multi-tenant access is expanded before control ownership and strategic workload segregation are evidenced. The practical response is to create control tiers and restrict each workload to services meeting its legal and security requirements. Central assumptions should reflect enforceable arrangements and observed utilisation. Downside cases should combine related demand, price, technology, power, provider, cybersecurity, policy and liquidity risks. Management estimates should be identified in the model and refreshed as evidence changes.
19. Develop domestic capability with measured additionality
Local assembly, system integration, software, operations, research, skills and future processor development can create capability. Invoice location alone does not demonstrate additional domestic value or resilience. The analysis should identify the legal owner, service operator, payer, beneficiary and party bearing remediation or transition cost. [3][10][18]
The evidence file should begin with baseline workforce and suppliers, role map, manufacturing records, design rights, IP, training assessment, retention and operating authority. Each record should state scope, effective date, expiry or refresh point, accountable owner and relationship to usable capacity, user outcomes and cash. Policy announcements establish context. Financing conclusions require executed obligations and observed service performance.
The principal failure is that localisation targets reward spend without testing capability, quality, cost or continuity. The practical response is to use a weighted score for skilled roles, verified output, IP, supplier performance and independent operating capability. Central assumptions should reflect enforceable arrangements and observed utilisation. Downside cases should combine related demand, price, technology, power, provider, cybersecurity, policy and liquidity risks. Management estimates should be identified in the model and refreshed as evidence changes.
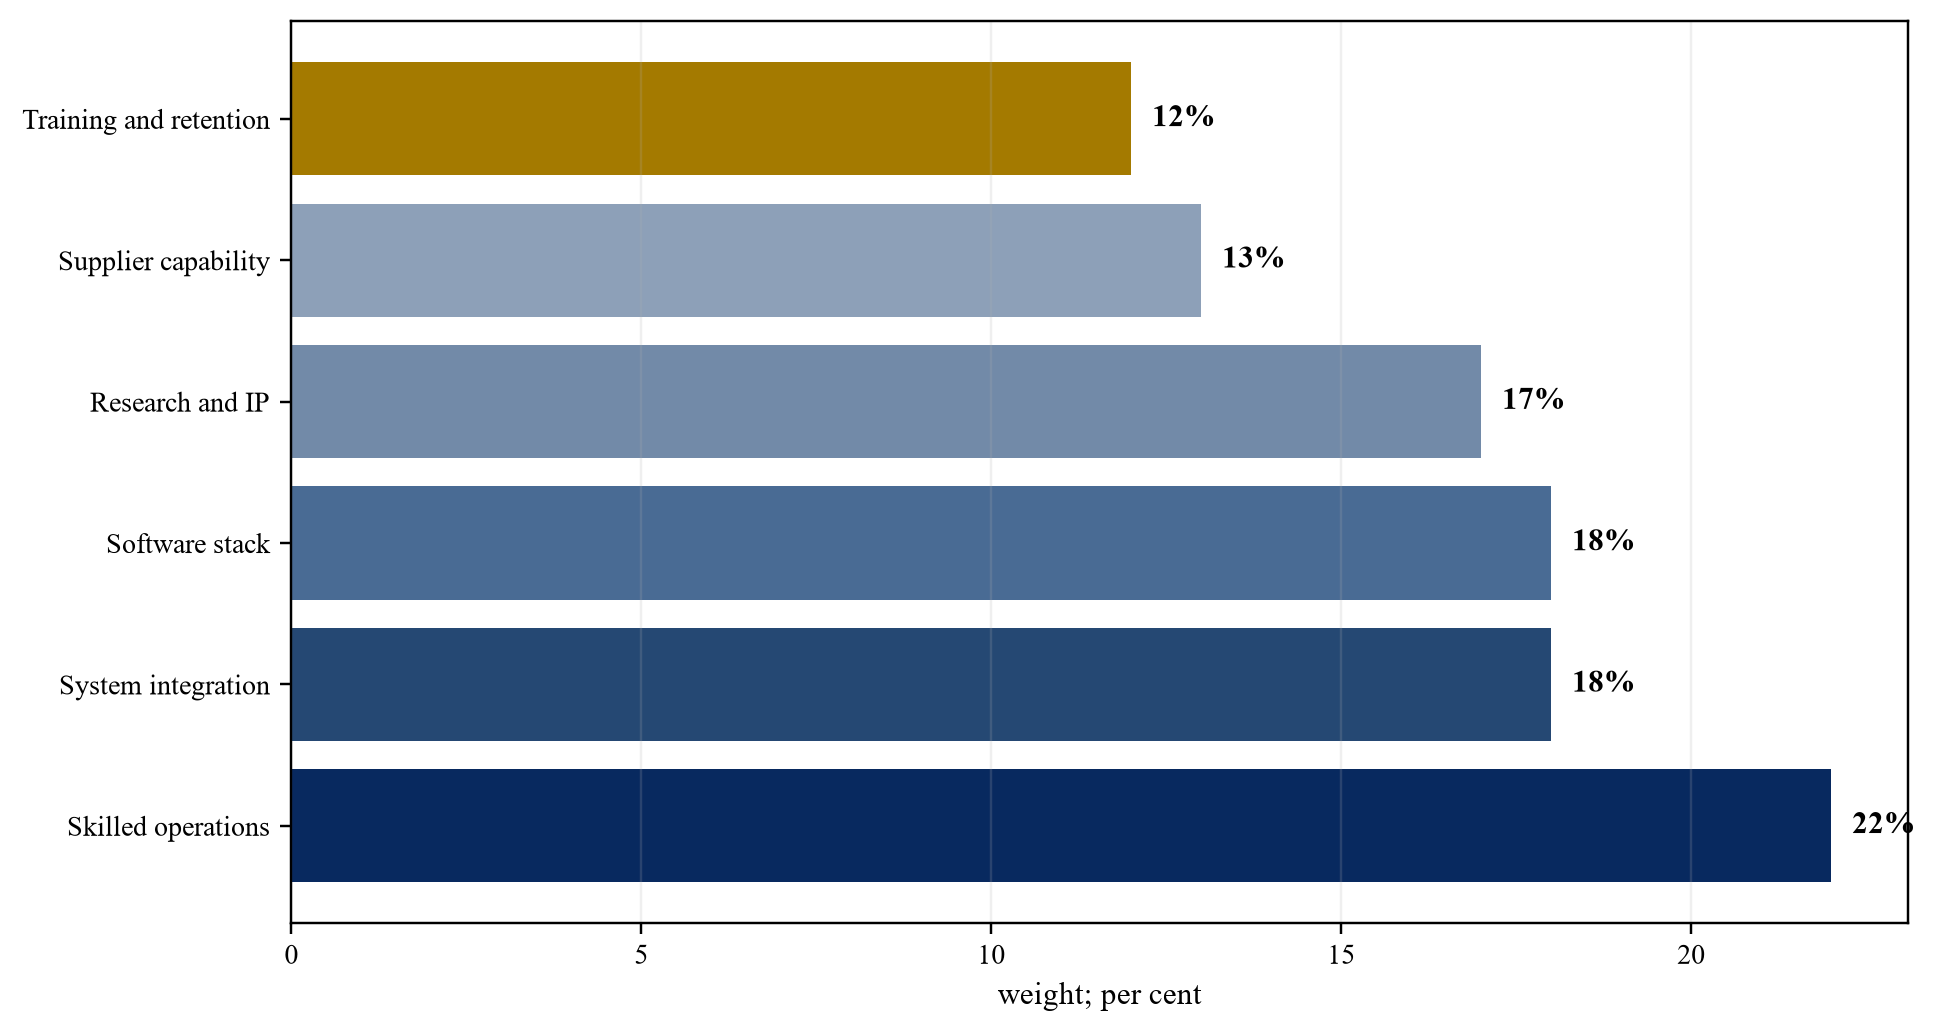
Proposed analytical weights; programme objectives should determine final weights.
20. Define the lender security and cash waterfall
Lenders need a borrower with enforceable provider or user cash, controlled accounts, asset or contract security, insurance and cure rights. Public programme receivables may require assignment and appropriation analysis. The analysis should identify the legal owner, service operator, payer, beneficiary and party bearing remediation or transition cost. [12][22][24]
The evidence file should begin with borrower structure, contracts, payment authority, escrow, security, direct agreements, insurance, reserves, covenant and enforcement advice. Each record should state scope, effective date, expiry or refresh point, accountable owner and relationship to usable capacity, user outcomes and cash. Policy announcements establish context. Financing conclusions require executed obligations and observed service performance.
The principal failure is that national importance is treated as an implicit guarantee or substitute for security and repayment evidence. The practical response is to size debt to stressed eligible cash and document the security and step-in perimeter precisely. Central assumptions should reflect enforceable arrangements and observed utilisation. Downside cases should combine related demand, price, technology, power, provider, cybersecurity, policy and liquidity risks. Management estimates should be identified in the model and refreshed as evidence changes.
21. Apply the hypothetical expansion case
The case tests a 10,000-accelerator-equivalent service tranche with multiple providers, explicit public access support and customer reservations. It is a decision model rather than a forecast of an announced expansion. The analysis should identify the legal owner, service operator, payer, beneficiary and party bearing remediation or transition cost. [1][3][22][24]
The evidence file should begin with the stated hypothetical capacity, cost, price, utilisation, support, funding, energy and refresh assumptions. Each record should state scope, effective date, expiry or refresh point, accountable owner and relationship to usable capacity, user outcomes and cash. Policy announcements establish context. Financing conclusions require executed obligations and observed service performance.
The principal failure is that headline capacity and subsidy are used to fill the model without product-level demand or cost. The practical response is to show sources, uses, utilisation, contribution, debt service and public outcomes on separate schedules. Central assumptions should reflect enforceable arrangements and observed utilisation. Downside cases should combine related demand, price, technology, power, provider, cybersecurity, policy and liquidity risks. Management estimates should be identified in the model and refreshed as evidence changes.
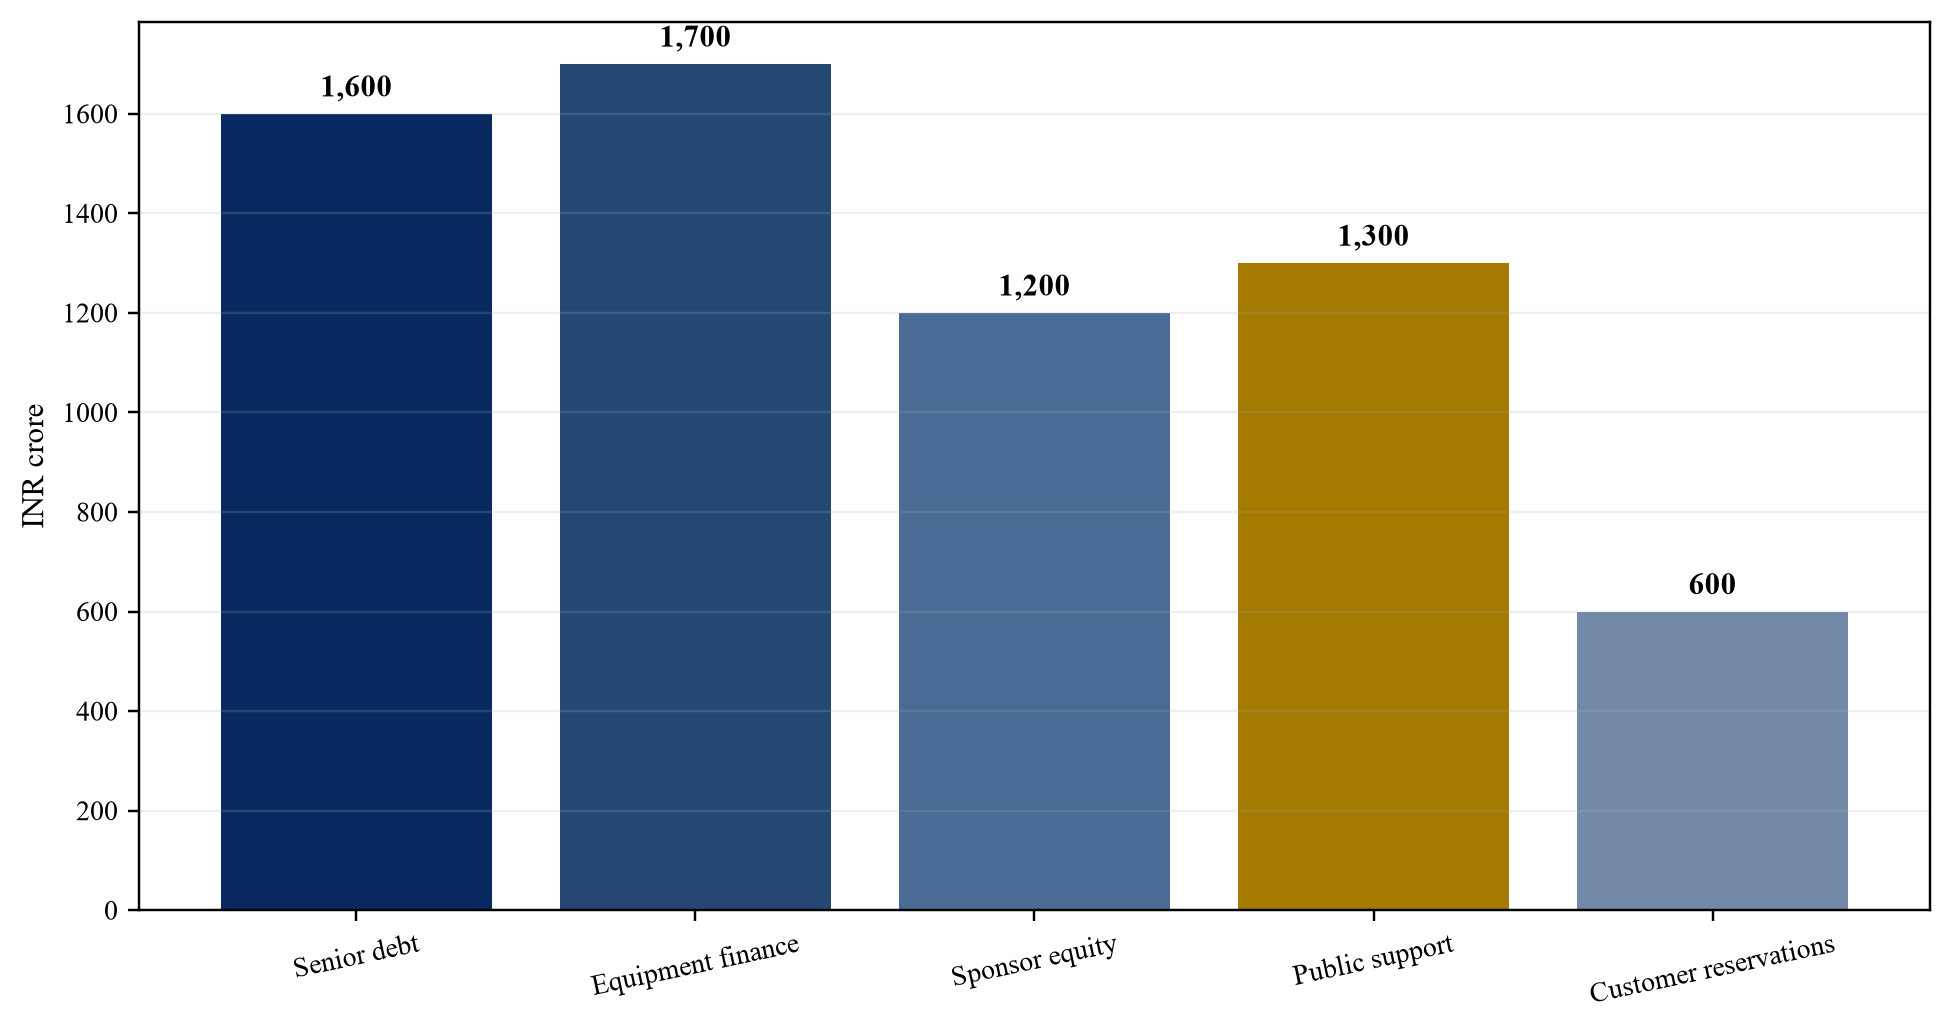
Wholly hypothetical; INR crore.
| Metric | Central case | Downside or gate |
|---|---|---|
| initial uses | INR 6,400 crore | INR 7,050 crore cap |
| senior secured debt | INR 1,600 crore | stressed cash-flow cap |
| equipment finance | INR 1,700 crore | eligible cohorts only |
| sponsor equity | INR 1,200 crore | committed before debt draw |
| public access support | INR 1,300 crore | milestone and usage based |
| customer reservations | INR 600 crore | paid and releasable |
| year-four billable utilisation | 72% | 51% combined downside |
| realised pre-subsidy price | INR 118 per hour | INR 90 downside |
| energy intensity | 0.78 kWh per billable hour | provider metering required |
Wholly hypothetical; figures do not describe an announced transaction.
22. Allocate risk to the party able to manage it
Technology obsolescence, construction, power, service availability, user demand, price, currency, cybersecurity and policy risks should follow control. Risk retained by government should be explicit, capped and reported as a contingent exposure. The analysis should identify the legal owner, service operator, payer, beneficiary and party bearing remediation or transition cost. [12][13][14]
The evidence file should begin with risk matrix, contracts, caps, insurance, guarantees, change mechanisms, relief events, termination and compensation. Each record should state scope, effective date, expiry or refresh point, accountable owner and relationship to usable capacity, user outcomes and cash. Policy announcements establish context. Financing conclusions require executed obligations and observed service performance.
The principal failure is that general support language transfers open-ended downside to the public programme or leaves providers unable to finance. The practical response is to assign measurable risk, price it and create time-bounded remedies and termination values. Central assumptions should reflect enforceable arrangements and observed utilisation. Downside cases should combine related demand, price, technology, power, provider, cybersecurity, policy and liquidity risks. Management estimates should be identified in the model and refreshed as evidence changes.
| Risk | Primary controller | Core protection |
|---|---|---|
| hardware delivery | provider and supplier | verified order and substitution |
| power and facility | provider | availability and relief regime |
| user demand | provider and programme | reservations and flexible capacity |
| access affordability | programme | capped targeted subsidy |
| service performance | provider | credits, cure and replacement |
| strategic continuity | programme and operator | transition and reserved capacity |
Proposed framework; final contracts and public authority determine allocation.
23. Stress utilisation, price and refresh together
Lower demand can coincide with technology repricing, higher power cost and earlier refresh. Combined scenarios matter because price competition can lower revenue while old equipment loses utilisation and residual value. The analysis should identify the legal owner, service operator, payer, beneficiary and party bearing remediation or transition cost. [3][6][10][24]
The evidence file should begin with scenario model, product cohorts, demand pipeline, power sensitivity, supplier terms, liquidity, reserve and corrective actions. Each record should state scope, effective date, expiry or refresh point, accountable owner and relationship to usable capacity, user outcomes and cash. Policy announcements establish context. Financing conclusions require executed obligations and observed service performance.
The principal failure is that single-variable sensitivities preserve debt capacity even though related market and technology changes occur together. The practical response is to run combined cases and define capacity deferral, repricing, equity cure and equipment redeployment actions. Central assumptions should reflect enforceable arrangements and observed utilisation. Downside cases should combine related demand, price, technology, power, provider, cybersecurity, policy and liquidity risks. Management estimates should be identified in the model and refreshed as evidence changes.
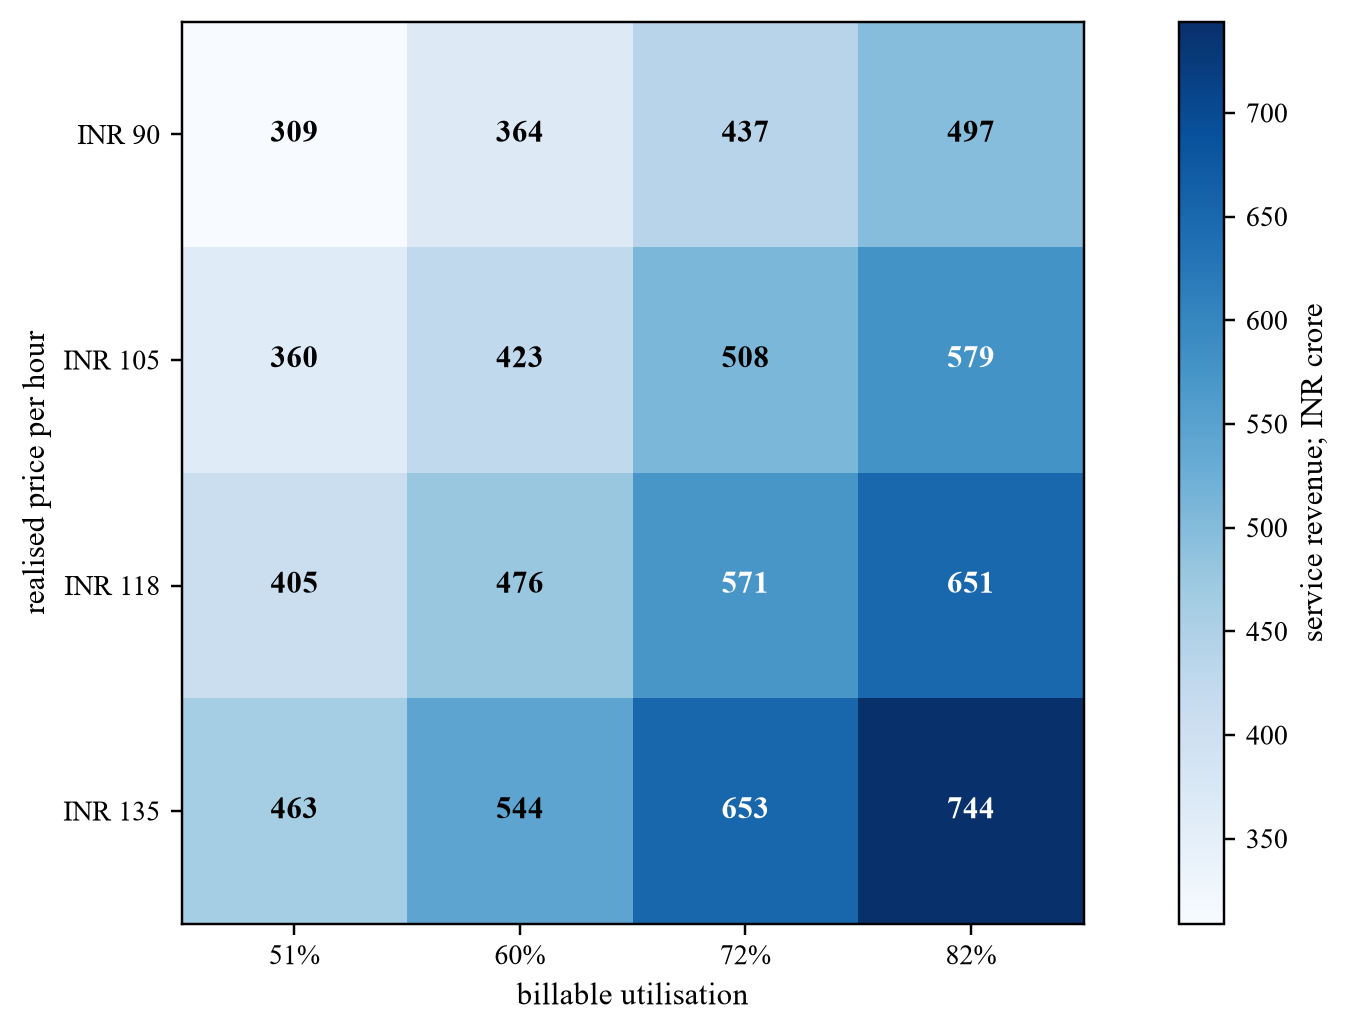
Wholly hypothetical; annual service revenue in INR crore.
24. Account for revenue, grants and financial instruments
IFRS 15 governs customer revenue, while grant accounting, leases and financial instruments require separate analysis. Service subsidies paid on behalf of users should be traced to the relevant performance obligation and payer. The analysis should identify the legal owner, service operator, payer, beneficiary and party bearing remediation or transition cost. [23][24][25][26]
The evidence file should begin with contracts, invoices, acceptance, subsidy instrument, grant conditions, leases, debt terms, expected credit loss and accounting opinions. Each record should state scope, effective date, expiry or refresh point, accountable owner and relationship to usable capacity, user outcomes and cash. Policy announcements establish context. Financing conclusions require executed obligations and observed service performance.
The principal failure is that all public receipts are recognised as customer revenue or recurring EBITDA without testing their nature and conditions. The practical response is to document accounting by instrument and reconcile reported earnings to financeable cash. Central assumptions should reflect enforceable arrangements and observed utilisation. Downside cases should combine related demand, price, technology, power, provider, cybersecurity, policy and liquidity risks. Management estimates should be identified in the model and refreshed as evidence changes.
25. Value transferable commercial cash separately
IFRS 13 uses a market-participant perspective. Public spillovers, national resilience and research benefits can support a policy decision but do not automatically transfer to a buyer or repay debt. The analysis should identify the legal owner, service operator, payer, beneficiary and party bearing remediation or transition cost. [25][27]
The evidence file should begin with contract cash, market prices, public outcome measures, replacement cost, synergies, restrictions and exit rights. Each record should state scope, effective date, expiry or refresh point, accountable owner and relationship to usable capacity, user outcomes and cash. Policy announcements establish context. Financing conclusions require executed obligations and observed service performance.
The principal failure is that public value is added to enterprise value without an enforceable payment or transferable right. The practical response is to show commercial enterprise value, provider-specific benefits and public outcomes in separate decision records. Central assumptions should reflect enforceable arrangements and observed utilisation. Downside cases should combine related demand, price, technology, power, provider, cybersecurity, policy and liquidity risks. Management estimates should be identified in the model and refreshed as evidence changes.
26. Design monitoring around source data
Programme and financing oversight should receive direct data on capacity, availability, queue, usage, completion, billing, subsidy, payment, energy, incidents and outcomes. Definitions should remain stable across providers. The analysis should identify the legal owner, service operator, payer, beneficiary and party bearing remediation or transition cost. [2][6][9]
The evidence file should begin with data dictionary, provider feeds, portal records, invoice reconciliation, telemetry, audit trail, exceptions and signed certifications. Each record should state scope, effective date, expiry or refresh point, accountable owner and relationship to usable capacity, user outcomes and cash. Policy announcements establish context. Financing conclusions require executed obligations and observed service performance.
The principal failure is that management dashboards cannot be reconciled to service logs, invoices or cash. The practical response is to create a common measurement protocol, automated reconciliation and independent sample verification. Central assumptions should reflect enforceable arrangements and observed utilisation. Downside cases should combine related demand, price, technology, power, provider, cybersecurity, policy and liquidity risks. Management estimates should be identified in the model and refreshed as evidence changes.
27. Plan refresh, transition and exit
Capacity should be refreshed without interrupting users or trapping public support in obsolete equipment. Provider exit, distress or non-performance requires workload migration, data return, licence continuity and replacement capacity. The analysis should identify the legal owner, service operator, payer, beneficiary and party bearing remediation or transition cost. [8][10][18]
The evidence file should begin with refresh triggers, residual channels, transition plan, data portability, escrow, direct agreements, replacement procurement and reserve. Each record should state scope, effective date, expiry or refresh point, accountable owner and relationship to usable capacity, user outcomes and cash. Policy announcements establish context. Financing conclusions require executed obligations and observed service performance.
The principal failure is that the initial provider cohort is assumed to remain available and competitive for the full programme horizon. The practical response is to contract cohort replacement, preserve interoperability and pre-fund transition where continuity is critical. Central assumptions should reflect enforceable arrangements and observed utilisation. Downside cases should combine related demand, price, technology, power, provider, cybersecurity, policy and liquidity risks. Management estimates should be identified in the model and refreshed as evidence changes.
28. Reach the capital and policy decision
Approval should rest on verified demand, usable service, transparent allocation, efficient support, matched funding, secure operations and a credible refresh route. The decision record should identify public cost, private risk and accountable outcomes. The analysis should identify the legal owner, service operator, payer, beneficiary and party bearing remediation or transition cost. [1][12][22][25]
The evidence file should begin with reconciled capacity and demand ladders, unit economics, support instrument, funding model, risk allocation, controls, scenarios and approvals. Each record should state scope, effective date, expiry or refresh point, accountable owner and relationship to usable capacity, user outcomes and cash. Policy announcements establish context. Financing conclusions require executed obligations and observed service performance.
The principal failure is that strategic importance substitutes for evidence that the proposed tranche is additional, affordable and financeable. The practical response is to approve only the capacity, support and private capital supported by auditable contracts, utilisation and public-value tests. Central assumptions should reflect enforceable arrangements and observed utilisation. Downside cases should combine related demand, price, technology, power, provider, cybersecurity, policy and liquidity risks. Management estimates should be identified in the model and refreshed as evidence changes.
| Decision | Minimum evidence | Possible action |
|---|---|---|
| capacity tranche | demand and usable service | approve, resize or defer |
| public support | market failure and additionality | grant, target or decline |
| debt | stressed eligible cash | lend, condition or reduce |
| provider award | price, quality and resilience | empanel, cap or replace |
| allocation | published criteria and outcomes | continue or redesign |
| refresh | cohort performance and residual | retain, redeploy or replace |
| scale-up | paid utilisation and public value | expand, rebid or stop |
Proposed governance; each approval retains its legal authority.
Sources
- Press Information Bureau, *Cabinet approves IndiaAI Mission with an outlay of over INR 10,300 crore* (2024). Read the primary source
- IndiaAI, *IndiaAI Compute Portal*. Read the primary source
- Press Information Bureau, *Government expands sovereign AI infrastructure through IndiaAI Mission and semiconductor initiatives* (2026). Read the primary source
- Press Information Bureau, *IndiaAI Mission expands AI ecosystem with affordable compute and startup support* (2026). Read the primary source
- Press Information Bureau, *IndiaAI Mission shared compute capacity and project access* (2026). Read the primary source
- Press Information Bureau, *IndiaAI Compute Capacity; 34,381 GPUs and pricing support* (2025). Read the primary source
- IndiaAI, *Compute Portal eligibility and access process*. Read the primary source
- Ministry of Electronics and Information Technology, *Annual Report 2025-26*. Read the primary source
- IndiaAI, *Ready Reckoner for Compute Users* (2026). Read the primary source
- Government of India, *Compute Capacity and AI Infrastructure in India* (2026). Read the primary source
- Ministry of Electronics and Information Technology, *IndiaAI Compute Pillar*. Read the primary source
- Department of Economic Affairs, *Viability Gap Funding Scheme*. Read the primary source
- Department of Economic Affairs, *Guidelines for financial support to PPPs in infrastructure*. Read the primary source
- Department of Economic Affairs, *India Infrastructure Project Development Fund Scheme*. Read the primary source
- Ministry of Power, *Green Energy Open Access Rules 2022*. Read the primary source
- Central Electricity Authority, *National Electricity Plan*. Read the primary source
- Bureau of Energy Efficiency, *Energy efficiency and data centre guidance*. Read the primary source
- Ministry of Electronics and Information Technology, *National Supercomputing Mission*. Read the primary source
- Government of India, *Digital Personal Data Protection Act 2023*. Read the primary source
- CERT-In, *Directions relating to information security practices, procedure, prevention, response and reporting of cyber incidents*. Read the primary source
- National Critical Information Infrastructure Protection Centre, *Guidelines and advisories*. Read the primary source
- Reserve Bank of India, *Prudential Framework for Income Recognition, Asset Classification and Provisioning pertaining to Advances; Projects Under Implementation*. Read the primary source
- IFRS Foundation, *IFRS 15 Revenue from Contracts with Customers*. Read the primary source
- IFRS Foundation, *IFRS 9 Financial Instruments*. Read the primary source
- IFRS Foundation, *IFRS 13 Fair Value Measurement*. Read the primary source
- IFRS Foundation, *IAS 20 Accounting for Government Grants and Disclosure of Government Assistance*. Read the primary source
- IFRS Foundation, *IAS 36 Impairment of Assets*. Read the primary source
- Government of India, *Economic Survey 2025-26; technology and AI chapter*. Read the primary source
