

1. Define the investment decision
Decide whether a staged regional edge platform can earn an acceptable return after node, network, equipment, integration, refresh and financing costs. [1][2][3][4] The analysis should identify the asset owner, operator, customer, payer, financier and party responsible for service failure or remediation. A city-level statistic can prioritise diligence. It cannot replace a contract, technical test or bank receipt.
The evidence file should begin with asset perimeter, candidate-city rationale, workload, customer, payer, baseline, technical design, service contract, capital plan and downside liquidity. Each item should state its geographic and service scope, definition, effective date, expiry or refresh point, accountable owner and relationship to accepted service and collected cash. National statistics, standards and policy documents provide context. Site value requires node-level rights, utility and network evidence, executed customer obligations, measured performance and financial reconciliation.
The principal failure is that population, broadband growth or a national digital trend is treated as site-level demand. The practical response is to approve only nodes supported by customer, network, utility and cash evidence. Management estimates belong in a clearly identified model input register and should be replaced when observed evidence becomes available. Forecast changes should preserve the original case, the revised assumption, the source and the effect on utilisation, liquidity and debt coverage.
2. Define the market perimeter
Use an operational definition of regional markets and disclose that it is not an official Indian city classification. [1][5][6][7] The analysis should identify the asset owner, operator, customer, payer, financier and party responsible for service failure or remediation. A city-level statistic can prioritise diligence. It cannot replace a contract, technical test or bank receipt.
The evidence file should begin with city boundary, catchment, travel and network paths, enterprise base, existing facilities, customer locations and comparison hubs. Each item should state its geographic and service scope, definition, effective date, expiry or refresh point, accountable owner and relationship to accepted service and collected cash. National statistics, standards and policy documents provide context. Site value requires node-level rights, utility and network evidence, executed customer obligations, measured performance and financial reconciliation.
The principal failure is that the label tier-two is used as a demand proxy or a fixed regulatory category. The practical response is to define every candidate node through observable catchment and service attributes. Management estimates belong in a clearly identified model input register and should be replaced when observed evidence becomes available. Forecast changes should preserve the original case, the revised assumption, the source and the effect on utilisation, liquidity and debt coverage.
3. Separate workload classes
Regional colocation, caching, telecom edge, enterprise cloud, regulated workloads and AI inference have different customers, service requirements and revenue models. [2][3][8][9] The analysis should identify the asset owner, operator, customer, payer, financier and party responsible for service failure or remediation. A city-level statistic can prioritise diligence. It cannot replace a contract, technical test or bank receipt.
The evidence file should begin with application inventory, customer segment, data path, latency tolerance, storage, compute, continuity, regulation and price. Each item should state its geographic and service scope, definition, effective date, expiry or refresh point, accountable owner and relationship to accepted service and collected cash. National statistics, standards and policy documents provide context. Site value requires node-level rights, utility and network evidence, executed customer obligations, measured performance and financial reconciliation.
The principal failure is that all digital traffic is converted into one undifferentiated capacity forecast. The practical response is to forecast, contract and finance each workload class separately. Management estimates belong in a clearly identified model input register and should be replaced when observed evidence becomes available. Forecast changes should preserve the original case, the revised assumption, the source and the effect on utilisation, liquidity and debt coverage.
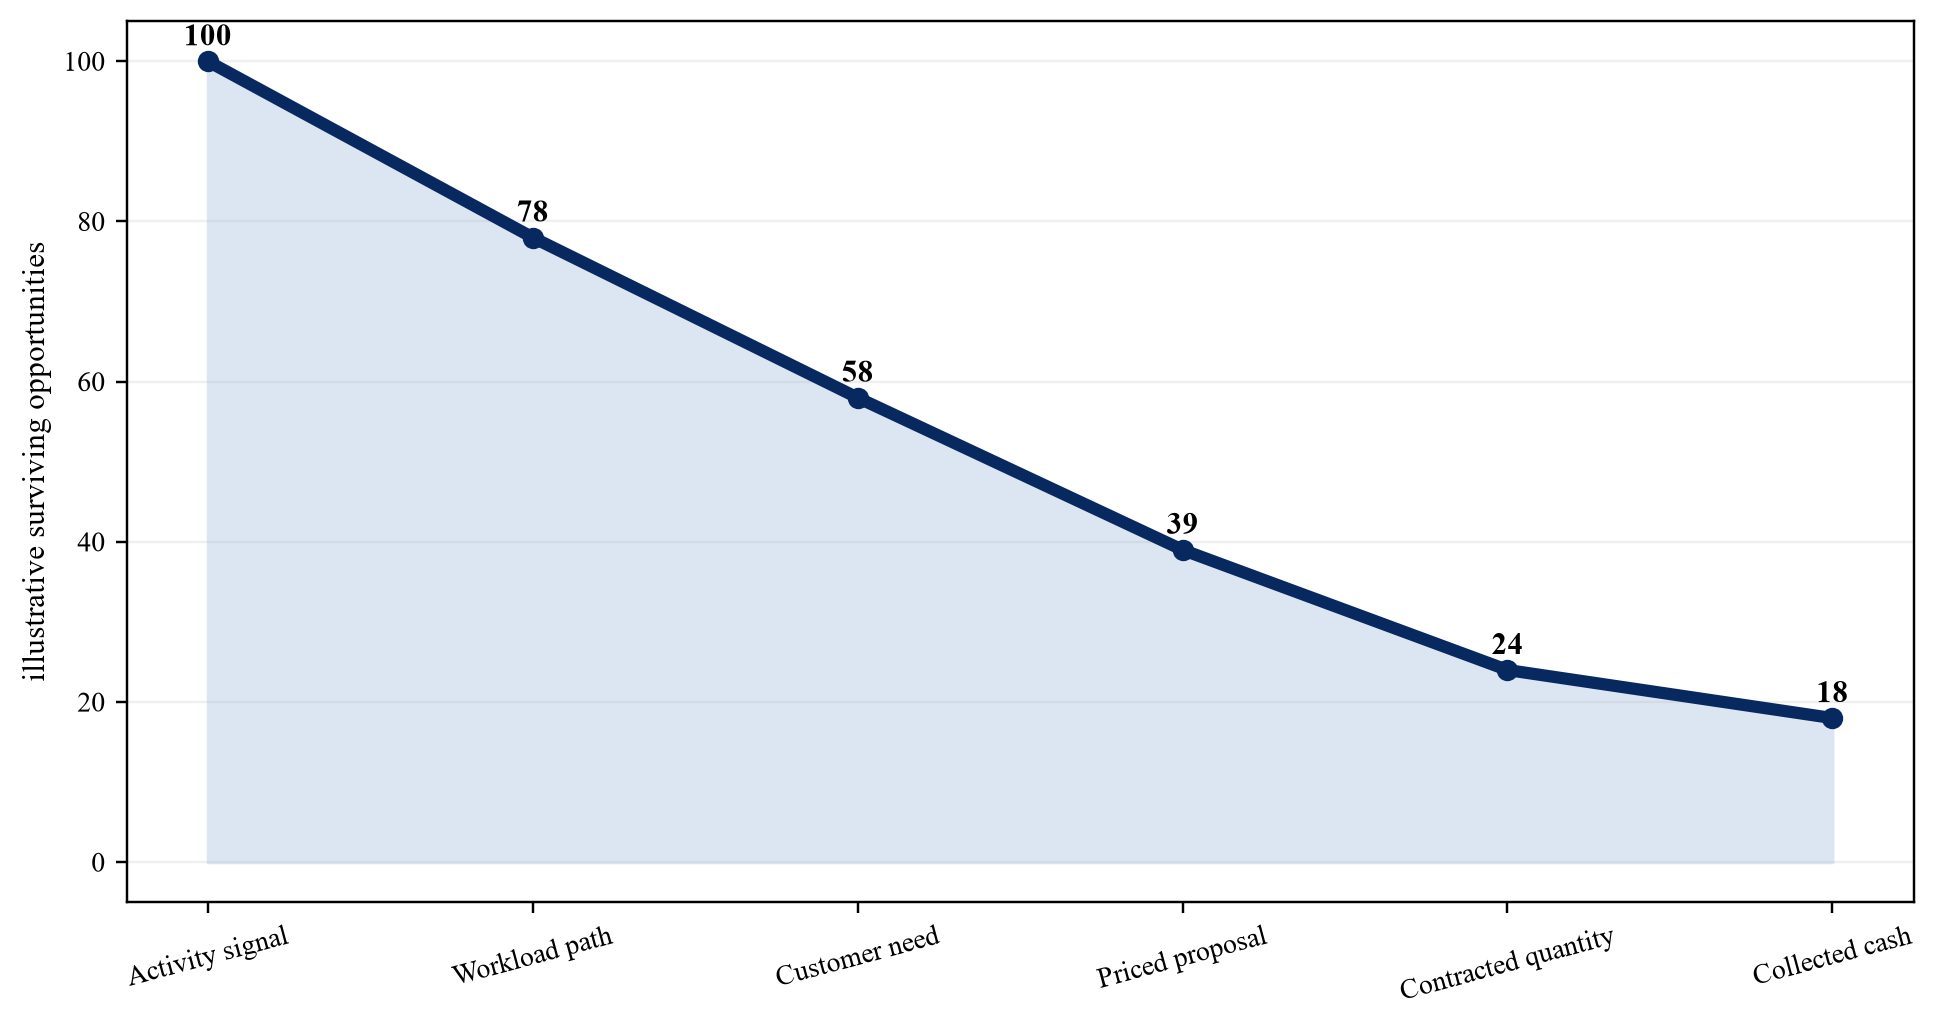
Proposed framework; each layer requires evidence before capacity can support financing.
| Signal | Useful question | Required conversion evidence |
|---|---|---|
| broadband and mobile activity | where are users and traffic growing | application path and buyer |
| payments and devices | where is digital activity concentrated | edge-hosted workload and budget |
| enterprise base | which organisations may migrate | approved workload and contract |
| fibre and carrier presence | which service paths are feasible | diverse route and SLA |
| existing facilities | how much supply and competition exists | available capacity, price and churn |
Proposed framework; signals prioritise diligence and do not prove revenue.
4. Map enterprise demand
Enterprise demand begins with named applications, users, sites and migration decisions rather than city-level company counts. [5][8][10][11] The analysis should identify the asset owner, operator, customer, payer, financier and party responsible for service failure or remediation. A city-level statistic can prioritise diligence. It cannot replace a contract, technical test or bank receipt.
The evidence file should begin with customer interviews, application portfolio, current hosting, data volumes, performance, migration cost, procurement cycle and budget. Each item should state its geographic and service scope, definition, effective date, expiry or refresh point, accountable owner and relationship to accepted service and collected cash. National statistics, standards and policy documents provide context. Site value requires node-level rights, utility and network evidence, executed customer obligations, measured performance and financial reconciliation.
The principal failure is that registered businesses or office space are multiplied by an assumed server footprint. The practical response is to require a documented migration or new-workload pathway for every forecast cohort. Management estimates belong in a clearly identified model input register and should be replaced when observed evidence becomes available. Forecast changes should preserve the original case, the revised assumption, the source and the effect on utilisation, liquidity and debt coverage.
5. Map telecom and network demand
Network demand depends on traffic paths, peering, cache economics, mobile architecture and the ability to avoid transport or improve service. [1][6][12][13] The analysis should identify the asset owner, operator, customer, payer, financier and party responsible for service failure or remediation. A city-level statistic can prioritise diligence. It cannot replace a contract, technical test or bank receipt.
The evidence file should begin with operator and carrier data, route maps, traffic exchange, cache hit rates, backhaul cost, service targets and interconnection contracts. Each item should state its geographic and service scope, definition, effective date, expiry or refresh point, accountable owner and relationship to accepted service and collected cash. National statistics, standards and policy documents provide context. Site value requires node-level rights, utility and network evidence, executed customer obligations, measured performance and financial reconciliation.
The principal failure is that mobile subscriber totals are treated as local colocation revenue. The practical response is to connect network demand to a defined service, buyer and payment obligation. Management estimates belong in a clearly identified model input register and should be replaced when observed evidence becomes available. Forecast changes should preserve the original case, the revised assumption, the source and the effect on utilisation, liquidity and debt coverage.
6. Map device and transaction signals
Payments, devices and public digital services can help locate activity, but they remain indicators until linked to an edge-hosted workload. [2][14][15][16] The analysis should identify the asset owner, operator, customer, payer, financier and party responsible for service failure or remediation. A city-level statistic can prioritise diligence. It cannot replace a contract, technical test or bank receipt.
The evidence file should begin with state and district statistics, transaction type, device base, time profile, application architecture, data residency and buyer evidence. Each item should state its geographic and service scope, definition, effective date, expiry or refresh point, accountable owner and relationship to accepted service and collected cash. National statistics, standards and policy documents provide context. Site value requires node-level rights, utility and network evidence, executed customer obligations, measured performance and financial reconciliation.
The principal failure is that transaction volume is assumed to require local compute in the same geography. The practical response is to use distributed digital activity to prioritise diligence, not to book revenue. Management estimates belong in a clearly identified model input register and should be replaced when observed evidence becomes available. Forecast changes should preserve the original case, the revised assumption, the source and the effect on utilisation, liquidity and debt coverage.
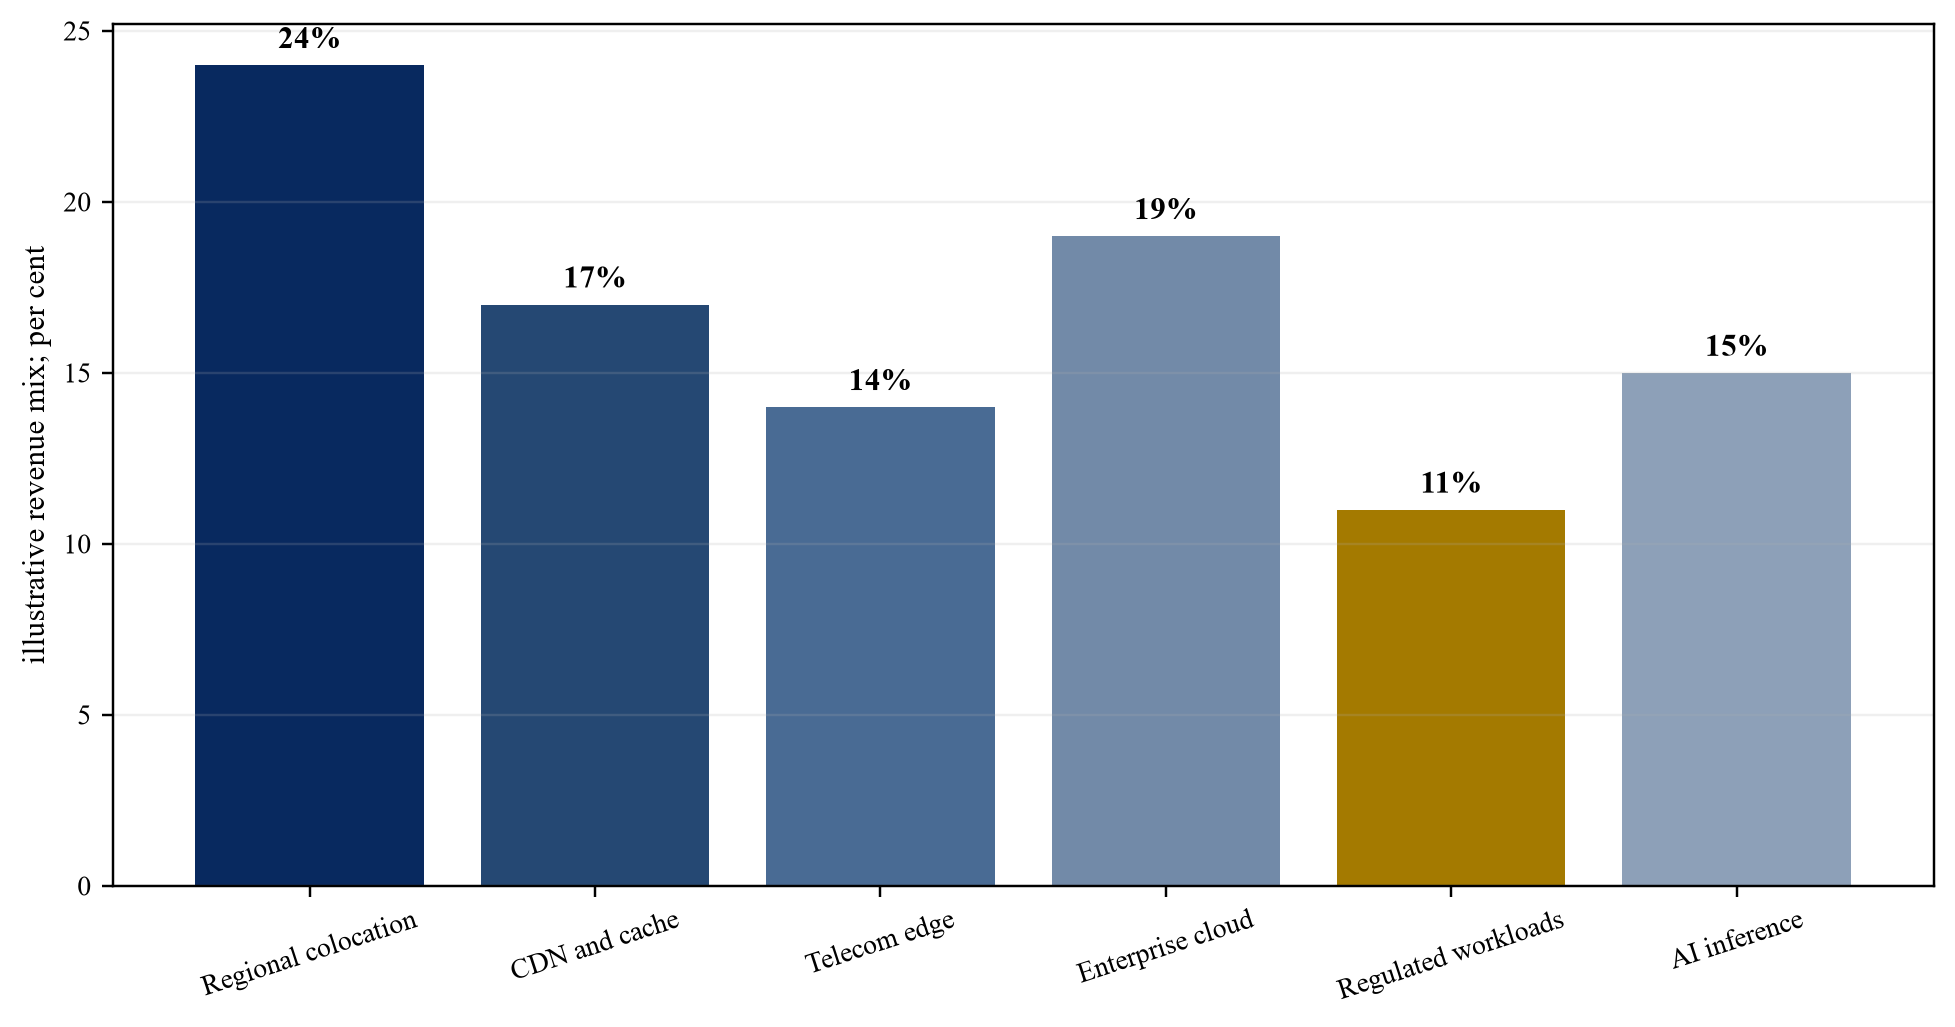
Wholly hypothetical; actual mix requires customer and application evidence.
7. Avoid double counting traffic
A workload served from a metro hub, operator cache, enterprise site or public cloud should appear once in the addressable-demand model. [6][8][12][17] The analysis should identify the asset owner, operator, customer, payer, financier and party responsible for service failure or remediation. A city-level statistic can prioritise diligence. It cannot replace a contract, technical test or bank receipt.
The evidence file should begin with application routing, origin and cache logs, operator topology, current hosting, failover design, customer account and service boundary. Each item should state its geographic and service scope, definition, effective date, expiry or refresh point, accountable owner and relationship to accepted service and collected cash. National statistics, standards and policy documents provide context. Site value requires node-level rights, utility and network evidence, executed customer obligations, measured performance and financial reconciliation.
The principal failure is that the same traffic is counted as enterprise, telecom, content and AI demand. The practical response is to assign one primary placement decision and reconcile overlaps before aggregation. Management estimates belong in a clearly identified model input register and should be replaced when observed evidence becomes available. Forecast changes should preserve the original case, the revised assumption, the source and the effect on utilisation, liquidity and debt coverage.
8. Measure end-to-end latency
Relevant latency includes device capture, access, transport, queueing, data retrieval, compute, response delivery and operational action. [18][19][20][21] The analysis should identify the asset owner, operator, customer, payer, financier and party responsible for service failure or remediation. A city-level statistic can prioritise diligence. It cannot replace a contract, technical test or bank receipt.
The evidence file should begin with representative traces, percentile distribution, jitter, loss, queue depth, failure tests, user outcome and service requirement. Each item should state its geographic and service scope, definition, effective date, expiry or refresh point, accountable owner and relationship to accepted service and collected cash. National statistics, standards and policy documents provide context. Site value requires node-level rights, utility and network evidence, executed customer obligations, measured performance and financial reconciliation.
The principal failure is that geographic proximity or server inference time substitutes for end-to-end evidence. The practical response is to test the complete path under normal, peak and degraded conditions. Management estimates belong in a clearly identified model input register and should be replaced when observed evidence becomes available. Forecast changes should preserve the original case, the revised assumption, the source and the effect on utilisation, liquidity and debt coverage.
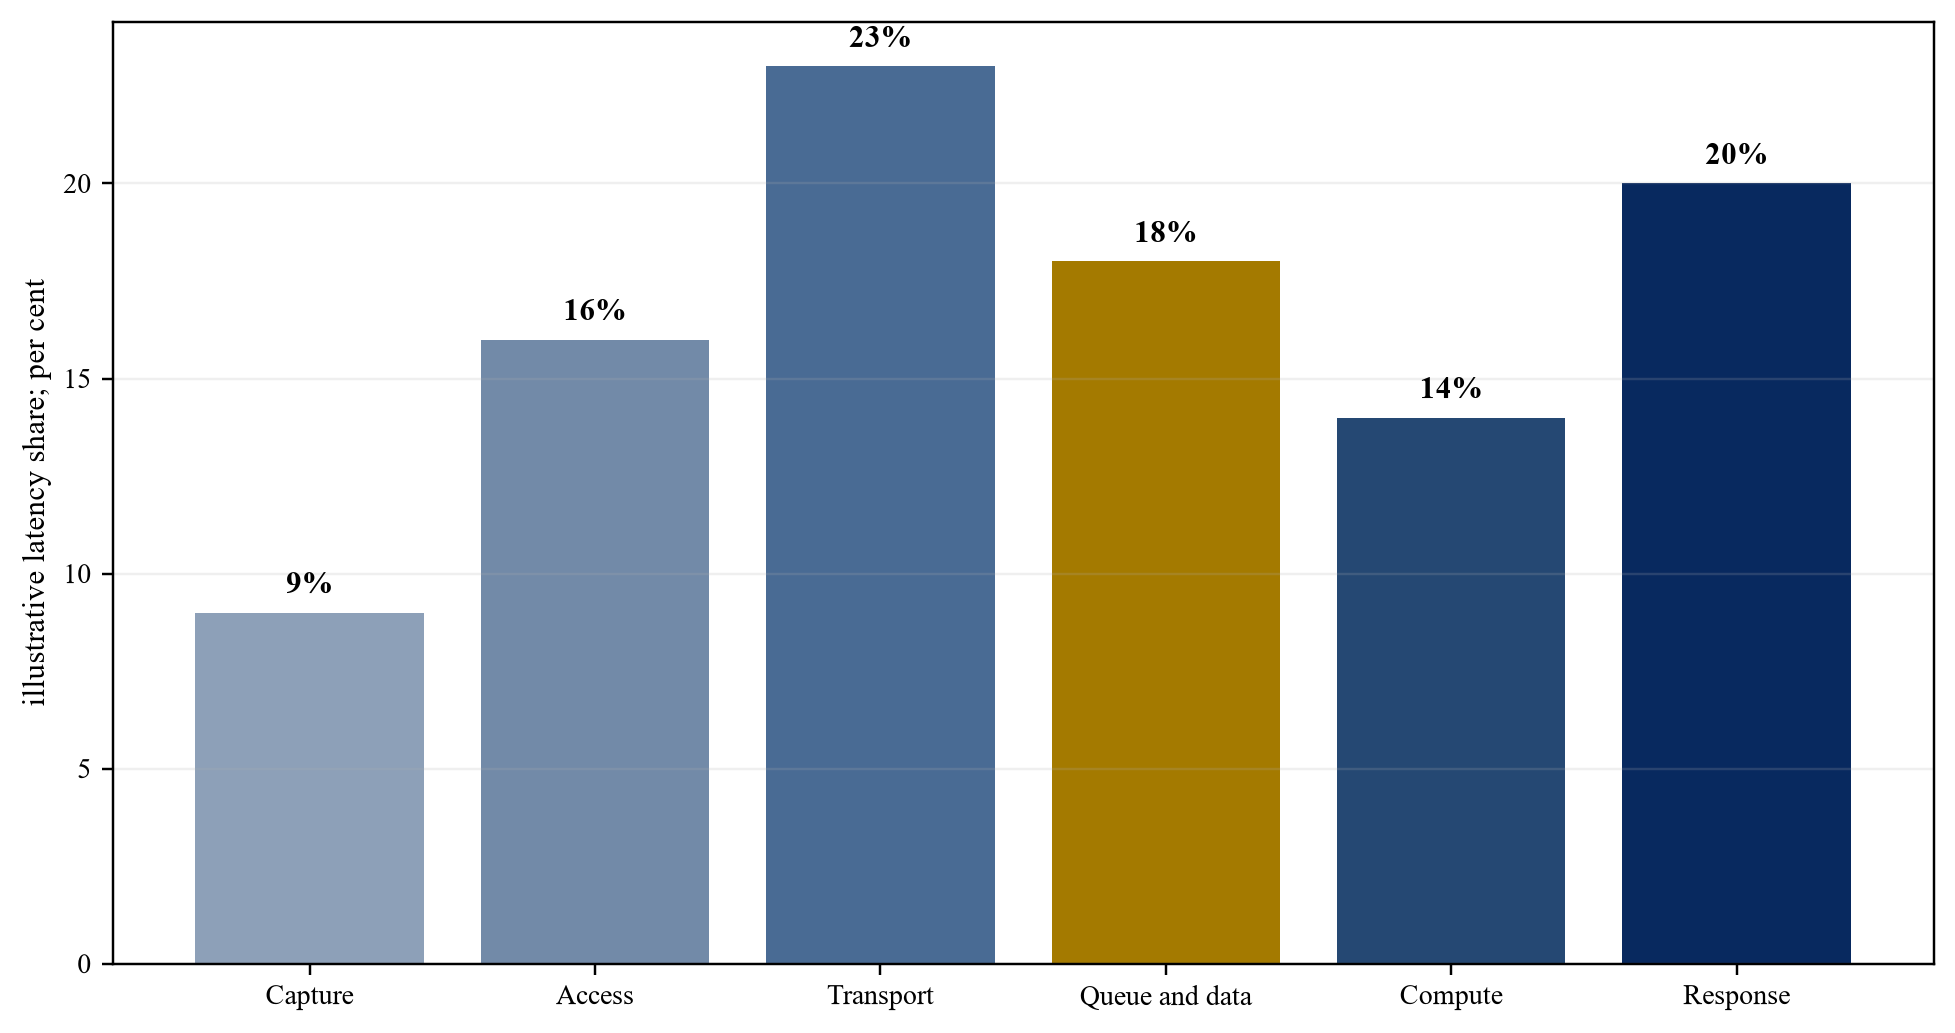
Wholly hypothetical allocation; replace with traced application data.
| Workload | Local placement driver | Evidence |
|---|---|---|
| CDN and cache | transport reduction and user performance | cache logs and contract |
| telecom edge | network function or low-latency service | operator design and SLA |
| enterprise cloud | continuity, migration and control | application inventory and budget |
| regulated workload | location or sector obligation | counsel and customer approval |
| AI inference | response time, data control or bandwidth | traced service test and payer |
Proposed framework; final placement follows measured service and commercial requirements.
9. Establish the node catchment
A node catchment is the set of customers and workloads it can serve at the required performance, resilience, price and legal conditions. [6][18][22][23] The analysis should identify the asset owner, operator, customer, payer, financier and party responsible for service failure or remediation. A city-level statistic can prioritise diligence. It cannot replace a contract, technical test or bank receipt.
The evidence file should begin with route distance, carrier paths, latency tests, customer sites, alternate facilities, disaster zones, data obligations and service price. Each item should state its geographic and service scope, definition, effective date, expiry or refresh point, accountable owner and relationship to accepted service and collected cash. National statistics, standards and policy documents provide context. Site value requires node-level rights, utility and network evidence, executed customer obligations, measured performance and financial reconciliation.
The principal failure is that administrative city boundaries or a radius determine demand without network and customer evidence. The practical response is to build workload-specific catchments and test overlap with metro hubs and adjacent nodes. Management estimates belong in a clearly identified model input register and should be replaced when observed evidence becomes available. Forecast changes should preserve the original case, the revised assumption, the source and the effect on utilisation, liquidity and debt coverage.
10. Test willingness to pay
A faster or more local service creates revenue only when a budget owner values it above migration, duplication and operating cost. [8][10][24][25] The analysis should identify the asset owner, operator, customer, payer, financier and party responsible for service failure or remediation. A city-level statistic can prioritise diligence. It cannot replace a contract, technical test or bank receipt.
The evidence file should begin with request for proposal, budget, reservation, price test, procurement approval, migration plan, contract term and alternative cost. Each item should state its geographic and service scope, definition, effective date, expiry or refresh point, accountable owner and relationship to accepted service and collected cash. National statistics, standards and policy documents provide context. Site value requires node-level rights, utility and network evidence, executed customer obligations, measured performance and financial reconciliation.
The principal failure is that stated interest, pilot participation or technical preference is treated as committed revenue. The practical response is to progress demand from interview to priced proposal, approved budget, contract and collection. Management estimates belong in a clearly identified model input register and should be replaced when observed evidence becomes available. Forecast changes should preserve the original case, the revised assumption, the source and the effect on utilisation, liquidity and debt coverage.
11. Contract anchor demand
Anchor contracts can use reserved capacity, minimum spend, take-or-pay, availability payments or prepayments with explicit acceptance conditions. [24][25][26][27] The analysis should identify the asset owner, operator, customer, payer, financier and party responsible for service failure or remediation. A city-level statistic can prioritise diligence. It cannot replace a contract, technical test or bank receipt.
The evidence file should begin with signed agreement, quantity, term, price, commissioning, service levels, credits, termination, security and payer credit. Each item should state its geographic and service scope, definition, effective date, expiry or refresh point, accountable owner and relationship to accepted service and collected cash. National statistics, standards and policy documents provide context. Site value requires node-level rights, utility and network evidence, executed customer obligations, measured performance and financial reconciliation.
The principal failure is that letters of intent and non-binding forecasts support debt sizing. The practical response is to value commitments according to enforceability, conditions, tenor and customer credit. Management estimates belong in a clearly identified model input register and should be replaced when observed evidence becomes available. Forecast changes should preserve the original case, the revised assumption, the source and the effect on utilisation, liquidity and debt coverage.
| Term | Evidence | Financing concern |
|---|---|---|
| reserved quantity | unit and commencement | acceptance condition |
| price and indexation | tariff schedule | margin and inflation |
| service level | measurable performance | credits and termination |
| credit support | payer and security | collection and set-off |
| renewal and exit | notice and migration | residual utilisation |
Proposed comparison; governing contracts determine enforceability.
12. Gate site control
Site tenure, permitted use, physical access, equipment ownership, assignment and lender step-in determine whether the node can be built and financed. [4][22][26][28] The analysis should identify the asset owner, operator, customer, payer, financier and party responsible for service failure or remediation. A city-level statistic can prioritise diligence. It cannot replace a contract, technical test or bank receipt.
The evidence file should begin with title or lease, land-use approval, access, construction rights, equipment rights, assignment, direct agreement and exit route. Each item should state its geographic and service scope, definition, effective date, expiry or refresh point, accountable owner and relationship to accepted service and collected cash. National statistics, standards and policy documents provide context. Site value requires node-level rights, utility and network evidence, executed customer obligations, measured performance and financial reconciliation.
The principal failure is that a preferred site or government discussion is treated as controlled land. The practical response is to make site and transfer rights conditions precedent to material capital. Management estimates belong in a clearly identified model input register and should be replaced when observed evidence becomes available. Forecast changes should preserve the original case, the revised assumption, the source and the effect on utilisation, liquidity and debt coverage.
13. Gate power and cooling
The model needs deliverable power, redundancy, tariff, metering, quality, backup, cooling performance and expansion rights at each node. [3][22][29][30] The analysis should identify the asset owner, operator, customer, payer, financier and party responsible for service failure or remediation. A city-level statistic can prioritise diligence. It cannot replace a contract, technical test or bank receipt.
The evidence file should begin with connection agreement, sanctioned load, substation path, outage history, tariff, meter, backup test, cooling design and commissioning. Each item should state its geographic and service scope, definition, effective date, expiry or refresh point, accountable owner and relationship to accepted service and collected cash. National statistics, standards and policy documents provide context. Site value requires node-level rights, utility and network evidence, executed customer obligations, measured performance and financial reconciliation.
The principal failure is that state-level supply or nominal capacity is presented as continuous usable power. The practical response is to size capacity to commissioned power and stress tariff, outage and backup cost. Management estimates belong in a clearly identified model input register and should be replaced when observed evidence becomes available. Forecast changes should preserve the original case, the revised assumption, the source and the effect on utilisation, liquidity and debt coverage.
14. Gate fibre diversity
A regional node needs physically diverse routes, carrier competition, interconnection, tested failover and clear restoration obligations. [6][12][18][31] The analysis should identify the asset owner, operator, customer, payer, financier and party responsible for service failure or remediation. A city-level statistic can prioritise diligence. It cannot replace a contract, technical test or bank receipt.
The evidence file should begin with route survey, duct and right-of-way evidence, carrier contracts, landing or hub path, capacity, latency, failover and repair history. Each item should state its geographic and service scope, definition, effective date, expiry or refresh point, accountable owner and relationship to accepted service and collected cash. National statistics, standards and policy documents provide context. Site value requires node-level rights, utility and network evidence, executed customer obligations, measured performance and financial reconciliation.
The principal failure is that two contracts are described as diverse when they share a duct, exchange or upstream dependency. The practical response is to verify physical and logical diversity and contract restoration targets. Management estimates belong in a clearly identified model input register and should be replaced when observed evidence becomes available. Forecast changes should preserve the original case, the revised assumption, the source and the effect on utilisation, liquidity and debt coverage.
| Gate | Required evidence | Capital action |
|---|---|---|
| site and permits | transferable rights and approvals | condition precedent |
| power and cooling | commissioned capacity and test | size or defer |
| fibre | diverse routes and failover test | procure or reject |
| cyber and recovery | approved controls and exercise | remediate before service |
| customer and payer | acceptance schedule and contract | release or hold |
Proposed minimum gate; local requirements may add conditions.
15. Gate permits and data obligations
Building, electrical, fire, environmental, telecom, privacy, cyber and sector rules affect time, cost and customer eligibility. [4][11][28][32] The analysis should identify the asset owner, operator, customer, payer, financier and party responsible for service failure or remediation. A city-level statistic can prioritise diligence. It cannot replace a contract, technical test or bank receipt.
The evidence file should begin with permit register, responsible authority, filing status, conditions, data inventory, cross-border path, sector obligations and counsel review. Each item should state its geographic and service scope, definition, effective date, expiry or refresh point, accountable owner and relationship to accepted service and collected cash. National statistics, standards and policy documents provide context. Site value requires node-level rights, utility and network evidence, executed customer obligations, measured performance and financial reconciliation.
The principal failure is that national policy is assumed to satisfy state, municipal, utility and customer requirements. The practical response is to maintain a city-specific compliance path with dated evidence and accountable owners. Management estimates belong in a clearly identified model input register and should be replaced when observed evidence becomes available. Forecast changes should preserve the original case, the revised assumption, the source and the effect on utilisation, liquidity and debt coverage.
16. Design cyber and resilience controls
Regional distribution increases the operational surface across identity, remote access, suppliers, physical security, monitoring and recovery. [9][20][21][32] The analysis should identify the asset owner, operator, customer, payer, financier and party responsible for service failure or remediation. A city-level statistic can prioritise diligence. It cannot replace a contract, technical test or bank receipt.
The evidence file should begin with asset inventory, trust boundaries, privileged access, segmentation, logging, incident plan, recovery test, vendor controls and insurance. Each item should state its geographic and service scope, definition, effective date, expiry or refresh point, accountable owner and relationship to accepted service and collected cash. National statistics, standards and policy documents provide context. Site value requires node-level rights, utility and network evidence, executed customer obligations, measured performance and financial reconciliation.
The principal failure is that resilience is reduced to redundancy labels without tested operating recovery. The practical response is to embed controls and recovery evidence in design, acceptance and service contracts. Management estimates belong in a clearly identified model input register and should be replaced when observed evidence becomes available. Forecast changes should preserve the original case, the revised assumption, the source and the effect on utilisation, liquidity and debt coverage.
17. Build node unit economics
Each node must show revenue, power and network cost, occupancy, support, service credits, maintenance, refresh, tax and working-capital conversion. [3][8][24][25] The analysis should identify the asset owner, operator, customer, payer, financier and party responsible for service failure or remediation. A city-level statistic can prioritise diligence. It cannot replace a contract, technical test or bank receipt.
The evidence file should begin with billable unit, rack or compute mix, price, utilisation, energy, bandwidth, staffing, maintenance, credits, receivables and refresh. Each item should state its geographic and service scope, definition, effective date, expiry or refresh point, accountable owner and relationship to accepted service and collected cash. National statistics, standards and policy documents provide context. Site value requires node-level rights, utility and network evidence, executed customer obligations, measured performance and financial reconciliation.
The principal failure is that revenue per megawatt or rack omits idle capacity, customer mix, integration and cash timing. The practical response is to measure contribution and cash by customer, workload and node. Management estimates belong in a clearly identified model input register and should be replaced when observed evidence becomes available. Forecast changes should preserve the original case, the revised assumption, the source and the effect on utilisation, liquidity and debt coverage.
18. Separate capacity states
Identified, controlled, powered, installed, commissioned, accepted, reserved, billable and collected capacity have different financing value. [4][13][24][26] The analysis should identify the asset owner, operator, customer, payer, financier and party responsible for service failure or remediation. A city-level statistic can prioritise diligence. It cannot replace a contract, technical test or bank receipt.
The evidence file should begin with state definition, evidence, date, expiry, owner, remaining conditions, cost to advance and linked customer. Each item should state its geographic and service scope, definition, effective date, expiry or refresh point, accountable owner and relationship to accepted service and collected cash. National statistics, standards and policy documents provide context. Site value requires node-level rights, utility and network evidence, executed customer obligations, measured performance and financial reconciliation.
The principal failure is that announced, permitted or installed capacity is reported as utilised capacity. The practical response is to use a capacity waterfall with evidence rules for every movement. Management estimates belong in a clearly identified model input register and should be replaced when observed evidence becomes available. Forecast changes should preserve the original case, the revised assumption, the source and the effect on utilisation, liquidity and debt coverage.
19. Forecast adoption in cohorts
Customers move through discovery, design, procurement, migration, acceptance, ramp and renewal at different speeds. [5][8][10][24] The analysis should identify the asset owner, operator, customer, payer, financier and party responsible for service failure or remediation. A city-level statistic can prioritise diligence. It cannot replace a contract, technical test or bank receipt.
The evidence file should begin with cohort size, entry date, conversion rate, sales cycle, migration duration, churn, expansion, price and evidence basis. Each item should state its geographic and service scope, definition, effective date, expiry or refresh point, accountable owner and relationship to accepted service and collected cash. National statistics, standards and policy documents provide context. Site value requires node-level rights, utility and network evidence, executed customer obligations, measured performance and financial reconciliation.
The principal failure is that one top-down growth rate creates smooth utilisation that ignores procurement and delivery constraints. The practical response is to forecast signed and prospective cohorts separately and update them with observed conversion. Management estimates belong in a clearly identified model input register and should be replaced when observed evidence becomes available. Forecast changes should preserve the original case, the revised assumption, the source and the effect on utilisation, liquidity and debt coverage.
20. Stage the eight-node platform
The hypothetical programme releases four first-wave nodes, preserves two options and defers two until readiness and customer evidence improve. [3][4][22][26] The analysis should identify the asset owner, operator, customer, payer, financier and party responsible for service failure or remediation. A city-level statistic can prioritise diligence. It cannot replace a contract, technical test or bank receipt.
The evidence file should begin with node dossier, readiness gate, anchor customer, cost, schedule, acceptance, ramp, liquidity, option expiry and stop authority. Each item should state its geographic and service scope, definition, effective date, expiry or refresh point, accountable owner and relationship to accepted service and collected cash. National statistics, standards and policy documents provide context. Site value requires node-level rights, utility and network evidence, executed customer obligations, measured performance and financial reconciliation.
The principal failure is that all candidate cities receive simultaneous capacity despite different demand and infrastructure readiness. The practical response is to use modular deployment and explicit options to preserve deferral and relocation. Management estimates belong in a clearly identified model input register and should be replaced when observed evidence becomes available. Forecast changes should preserve the original case, the revised assumption, the source and the effect on utilisation, liquidity and debt coverage.
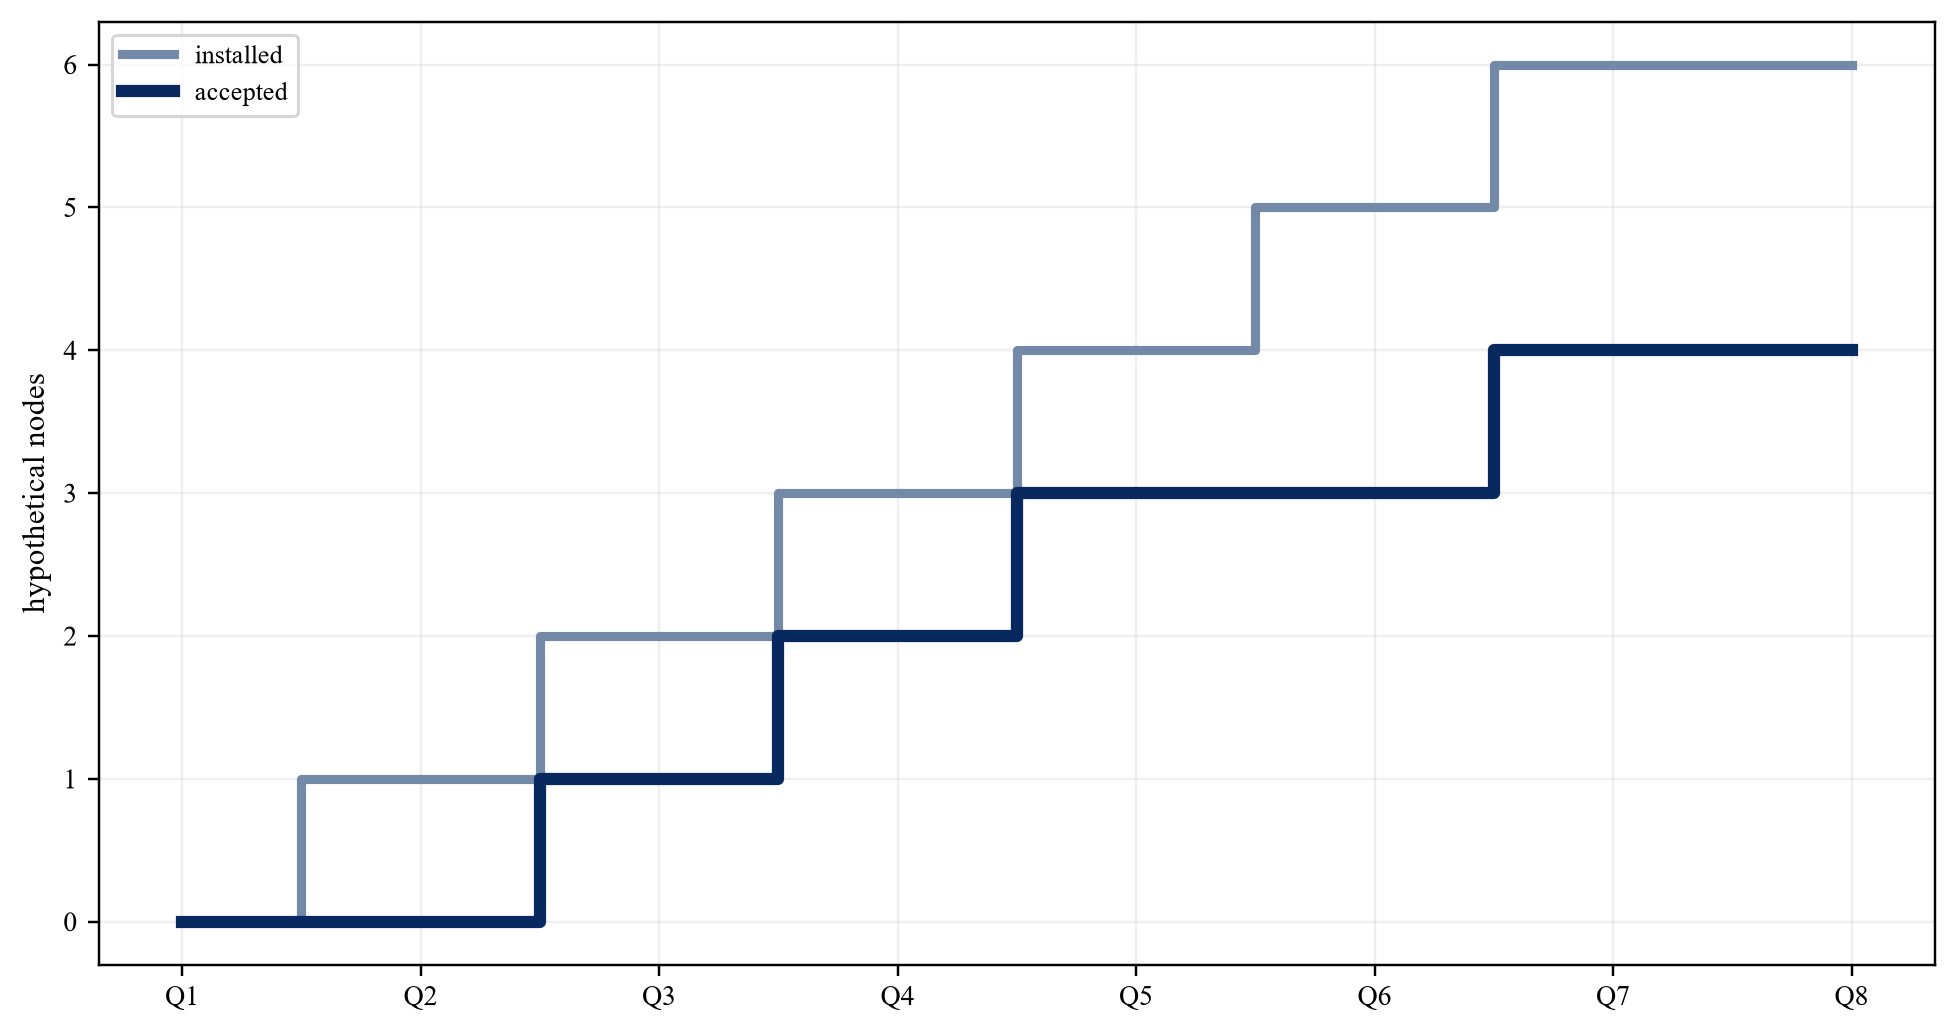
Wholly hypothetical; accepted nodes lag installed nodes until customer and service acceptance.
21. Apply the hypothetical funding plan
The USD 280 million case separates site and infrastructure, equipment, software and integration, working capital, contingency and reserves. [25][26][27][33] The analysis should identify the asset owner, operator, customer, payer, financier and party responsible for service failure or remediation. A city-level statistic can prioritise diligence. It cannot replace a contract, technical test or bank receipt.
The evidence file should begin with wholly hypothetical sources and uses, draw conditions, amortisation, reserve policy, anchor support, vendor terms and sponsor cure. Each item should state its geographic and service scope, definition, effective date, expiry or refresh point, accountable owner and relationship to accepted service and collected cash. National statistics, standards and policy documents provide context. Site value requires node-level rights, utility and network evidence, executed customer obligations, measured performance and financial reconciliation.
The principal failure is that funding categories hide which capital absorbs development, technology, demand and construction risk. The practical response is to allocate senior debt to eligible durable cash, equipment finance to movable assets and equity to uncertainty. Management estimates belong in a clearly identified model input register and should be replaced when observed evidence becomes available. Forecast changes should preserve the original case, the revised assumption, the source and the effect on utilisation, liquidity and debt coverage.
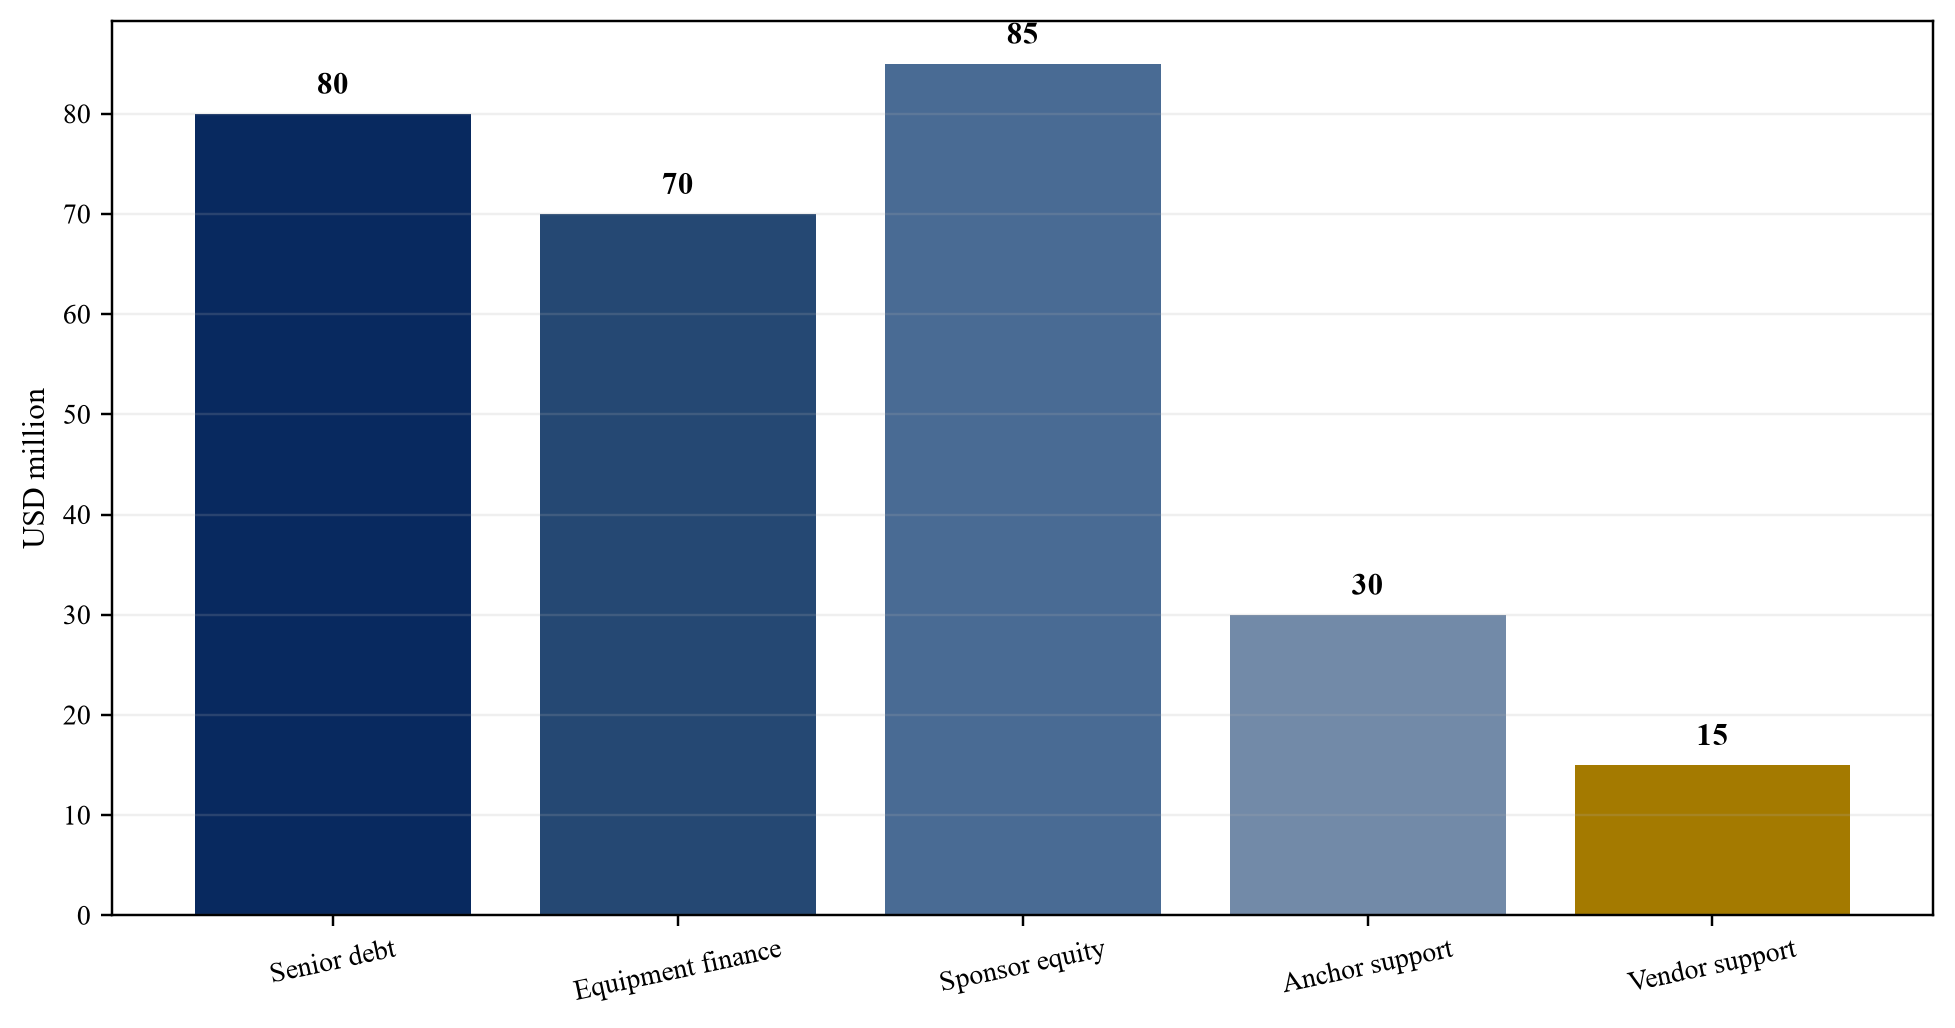
Wholly hypothetical; USD million.
| Metric | Central case | Combined downside |
|---|---|---|
| accepted nodes in year four | 4 | 3 |
| billable utilisation | 65% | 42% |
| recurring revenue | USD 41 million | USD 24 million |
| deployment delay | none beyond plan | 9 months |
| capital-cost variance | base | +15% |
| debt-service coverage ratio | 1.50x | 0.82x |
Wholly hypothetical; figures do not describe an announced project.
22. Match capital to asset lives
Long-lived electrical and fibre assets, medium-lived cooling, shorter-lived servers and continuously changing software need different terms. [25][27][30][33] The analysis should identify the asset owner, operator, customer, payer, financier and party responsible for service failure or remediation. A city-level statistic can prioritise diligence. It cannot replace a contract, technical test or bank receipt.
The evidence file should begin with asset register, useful life, maintenance, residual value, replacement cycle, security, amortisation, cash sweep and refresh reserve. Each item should state its geographic and service scope, definition, effective date, expiry or refresh point, accountable owner and relationship to accepted service and collected cash. National statistics, standards and policy documents provide context. Site value requires node-level rights, utility and network evidence, executed customer obligations, measured performance and financial reconciliation.
The principal failure is that long-dated debt and terminal value rely on hardware beyond its economic life. The practical response is to separate borrowing bases and fund refresh inside coverage and valuation. Management estimates belong in a clearly identified model input register and should be replaced when observed evidence becomes available. Forecast changes should preserve the original case, the revised assumption, the source and the effect on utilisation, liquidity and debt coverage.
23. Allocate delivery and performance risk
Site owner, utility, carrier, equipment vendor, integrator, software provider, operator, customer and sponsor control different risks. [20][21][26][27] The analysis should identify the asset owner, operator, customer, payer, financier and party responsible for service failure or remediation. A city-level statistic can prioritise diligence. It cannot replace a contract, technical test or bank receipt.
The evidence file should begin with risk matrix, milestone, warranty, service credit, delay remedy, insurance, direct agreement, cap, relief, step-in and termination. Each item should state its geographic and service scope, definition, effective date, expiry or refresh point, accountable owner and relationship to accepted service and collected cash. National statistics, standards and policy documents provide context. Site value requires node-level rights, utility and network evidence, executed customer obligations, measured performance and financial reconciliation.
The principal failure is that the project company retains correlated risks without price, recourse, reserve or control. The practical response is to place each risk with the party able to prevent, measure or remedy it and fund the remainder. Management estimates belong in a clearly identified model input register and should be replaced when observed evidence becomes available. Forecast changes should preserve the original case, the revised assumption, the source and the effect on utilisation, liquidity and debt coverage.
| Risk | Primary controller | Core protection |
|---|---|---|
| site and permits | site owner and project company | conditions and direct agreement |
| power and fibre | utility and carriers | capacity, diversity and remedies |
| equipment and integration | vendor and integrator | milestone, warranty and remedy |
| customer ramp | customer and sponsor | minimum payment and staging |
| cyber and continuity | operator and suppliers | controls, recovery test and insurance |
| technology refresh | project company and sponsor | reserve and relocation |
Proposed framework; final contracts and applicable law govern.
24. Stress correlated downside
Customer delay, lower utilisation, power or fibre constraint, cost increase, service failure and early refresh can occur together. [3][22][25][27] The analysis should identify the asset owner, operator, customer, payer, financier and party responsible for service failure or remediation. A city-level statistic can prioritise diligence. It cannot replace a contract, technical test or bank receipt.
The evidence file should begin with combined scenarios, monthly cash, covenant headroom, deferred modules, relocation value, sponsor cure and termination cash. Each item should state its geographic and service scope, definition, effective date, expiry or refresh point, accountable owner and relationship to accepted service and collected cash. National statistics, standards and policy documents provide context. Site value requires node-level rights, utility and network evidence, executed customer obligations, measured performance and financial reconciliation.
The principal failure is that single-variable sensitivities understate the interaction between demand, delivery, technology and financing. The practical response is to test the three-node, 42 per cent utilisation, nine-month delay and 15 per cent overrun case together. Management estimates belong in a clearly identified model input register and should be replaced when observed evidence becomes available. Forecast changes should preserve the original case, the revised assumption, the source and the effect on utilisation, liquidity and debt coverage.
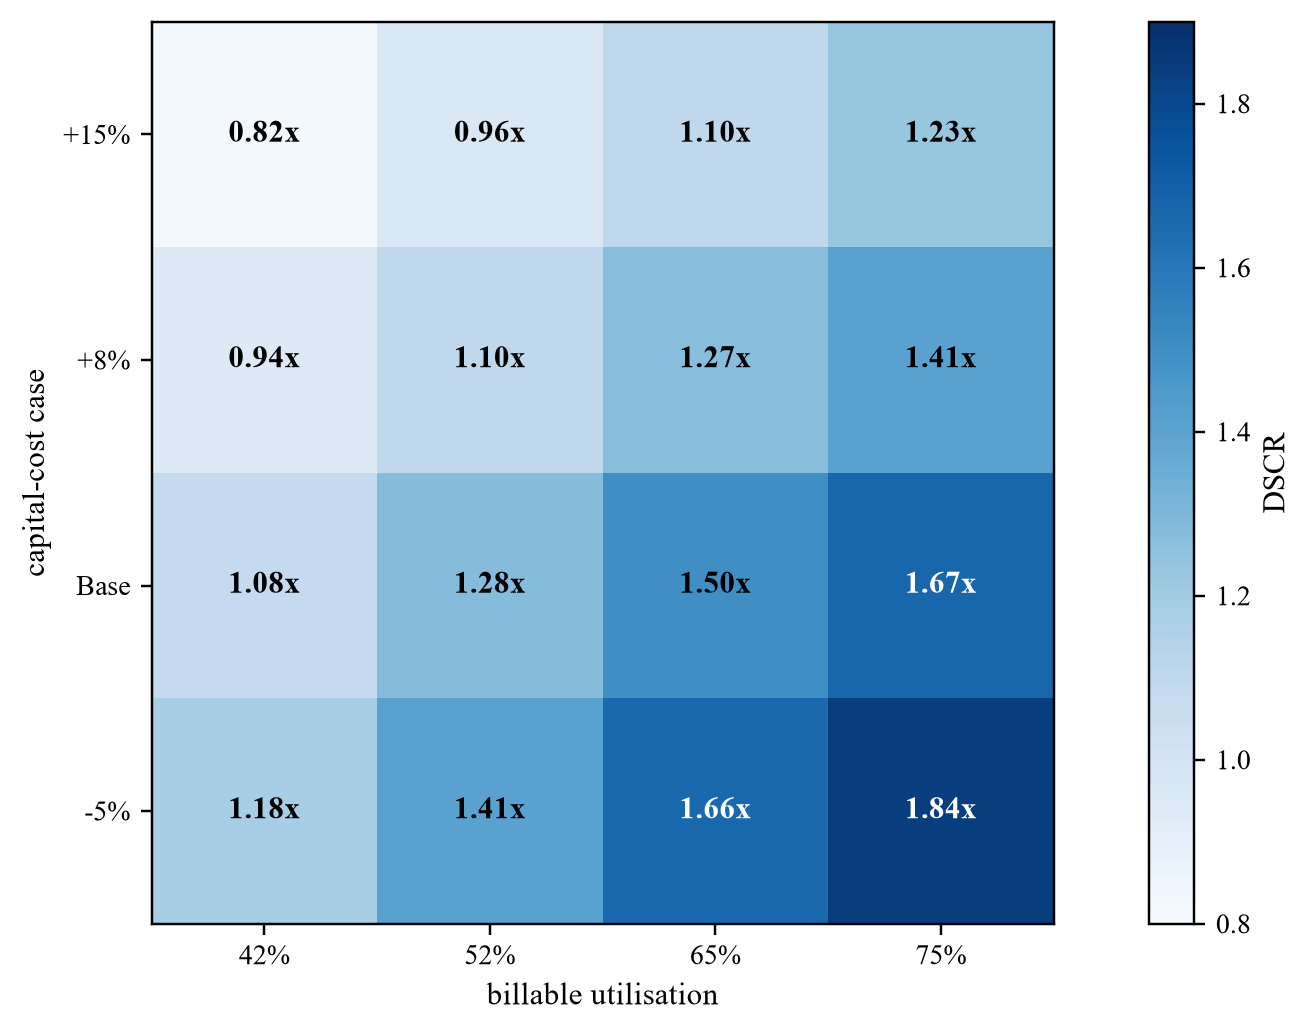
Wholly hypothetical; combined utilisation and cost cases.
25. Monitor signal to cash
A common control model should link demand signal, proposal, contract, capacity, service telemetry, acceptance, invoice, credit and collection. [2][8][24][25] The analysis should identify the asset owner, operator, customer, payer, financier and party responsible for service failure or remediation. A city-level statistic can prioritise diligence. It cannot replace a contract, technical test or bank receipt.
The evidence file should begin with unique identifiers, timestamps, data lineage, contract schedule, service measurement, invoice support, bank receipt and exception log. Each item should state its geographic and service scope, definition, effective date, expiry or refresh point, accountable owner and relationship to accepted service and collected cash. National statistics, standards and policy documents provide context. Site value requires node-level rights, utility and network evidence, executed customer obligations, measured performance and financial reconciliation.
The principal failure is that market, operations and finance dashboards report favourable metrics that cannot be reconciled. The practical response is to make eligible cash depend on a complete auditable chain. Management estimates belong in a clearly identified model input register and should be replaced when observed evidence becomes available. Forecast changes should preserve the original case, the revised assumption, the source and the effect on utilisation, liquidity and debt coverage.
26. Preserve relocation and exit routes
Financiers need practical remedies when a customer, node, vendor or market fails. [22][26][27][33] The analysis should identify the asset owner, operator, customer, payer, financier and party responsible for service failure or remediation. A city-level statistic can prioritise diligence. It cannot replace a contract, technical test or bank receipt.
The evidence file should begin with security package, direct agreements, equipment title, software and data continuity, relocation cost, alternate site, alternate users and sale route. Each item should state its geographic and service scope, definition, effective date, expiry or refresh point, accountable owner and relationship to accepted service and collected cash. National statistics, standards and policy documents provide context. Site value requires node-level rights, utility and network evidence, executed customer obligations, measured performance and financial reconciliation.
The principal failure is that security is taken over equipment and rights that cannot move, transfer or operate after enforcement. The practical response is to test and value recovery routes net of consent, time, configuration and remarketing cost. Management estimates belong in a clearly identified model input register and should be replaced when observed evidence becomes available. Forecast changes should preserve the original case, the revised assumption, the source and the effect on utilisation, liquidity and debt coverage.
27. Apply accounting and impairment discipline
Revenue, leases, borrowing costs, financial instruments, asset components and impairment affect covenant data and loss recognition. [25][27][30][33] The analysis should identify the asset owner, operator, customer, payer, financier and party responsible for service failure or remediation. A city-level statistic can prioritise diligence. It cannot replace a contract, technical test or bank receipt.
The evidence file should begin with contract analysis, performance obligations, lease terms, financing conditions, useful lives, impairment indicators and disclosure controls. Each item should state its geographic and service scope, definition, effective date, expiry or refresh point, accountable owner and relationship to accepted service and collected cash. National statistics, standards and policy documents provide context. Site value requires node-level rights, utility and network evidence, executed customer obligations, measured performance and financial reconciliation.
The principal failure is that accounting treatment follows the commercial forecast and delays recognition of underperforming nodes or obsolete equipment. The practical response is to align the model with IFRS analysis and define early reforecast and impairment triggers. Management estimates belong in a clearly identified model input register and should be replaced when observed evidence becomes available. Forecast changes should preserve the original case, the revised assumption, the source and the effect on utilisation, liquidity and debt coverage.
28. Reach the investment decision
Approval requires a defined catchment, contracted anchor cash, controlled site, commissioned infrastructure, measured unit economics, funded refresh and combined downside liquidity. [1][3][24][26] The analysis should identify the asset owner, operator, customer, payer, financier and party responsible for service failure or remediation. A city-level statistic can prioritise diligence. It cannot replace a contract, technical test or bank receipt.
The evidence file should begin with investment memorandum, evidence ledger, contracts, technical acceptance, model, financing, security, risk allocation, scenarios and approval record. Each item should state its geographic and service scope, definition, effective date, expiry or refresh point, accountable owner and relationship to accepted service and collected cash. National statistics, standards and policy documents provide context. Site value requires node-level rights, utility and network evidence, executed customer obligations, measured performance and financial reconciliation.
The principal failure is that national digital growth or strategic urgency replaces evidence for the specific node. The practical response is to approve one node and customer cohort at a time with named owners, expiry dates and stop authority. Management estimates belong in a clearly identified model input register and should be replaced when observed evidence becomes available. Forecast changes should preserve the original case, the revised assumption, the source and the effect on utilisation, liquidity and debt coverage.
| Decision | Minimum evidence | Possible action |
|---|---|---|
| node release | site, power, fibre and permits | fund, resize or defer |
| workload release | service test, acceptance and payer | launch, redesign or stop |
| debt draw | eligible contracted cash and coverage | draw, condition or reduce |
| equipment draw | delivery, title and relocation value | finance or hold |
| next cohort | acceptance, cash and liquidity | expand, relocate or stop |
Proposed governance; each approval records evidence, owner and expiry.
Sources
- Telecom Regulatory Authority of India, *Performance Indicators Reports*. Read the primary source
- National Payments Corporation of India, *UPI Product Statistics*. Read the primary source
- Central Electricity Authority, *Dashboard*. Read the primary source
- Ministry of Electronics and Information Technology, *Draft Data Centre Policy 2020*. Read the primary source
- Ministry of Statistics and Programme Implementation, *National Sample Survey and official statistics portal*. Read the primary source
- Department of Telecommunications, *National Digital Communications Policy*. Read the primary source
- Ministry of Housing and Urban Affairs, *Urban development programmes*. Read the primary source
- IndiaAI, *IndiaAI Compute Portal*. Read the primary source
- IndiaAI, *End-User Policy for AI Services on the Cloud*. Read the primary source
- Reserve Bank of India, *Database on Indian Economy*. Read the primary source
- Digital Personal Data Protection Act 2023, India Code. Read the primary source
- Telecom Regulatory Authority of India, *Telecom Subscriptions Reports*. Read the primary source
- Department of Telecommunications, *Telecommunications Act 2023*. Read the primary source
- National Payments Corporation of India, *UPI Ecosystem Statistics*. Read the primary source
- Reserve Bank of India, *Payment System Indicators*. Read the primary source
- Ministry of Electronics and Information Technology, *Digital India*. Read the primary source
- India Internet Governance Forum, *Resources*. Read the primary source
- ITU-T Recommendation Y.1541, *Network performance objectives for IP-based services*. Read the primary source
- 3GPP, *Specifications*. Read the primary source
- NIST, *Cybersecurity Framework 2.0*. Read the primary source
- CERT-In, *Directions and advisories*. Read the primary source
- Central Electricity Authority, *General Review Report and All India Electricity Statistics 2025*. Read the primary source
- India Meteorological Department, *Climate and hazard services*. Read the primary source
- IFRS Foundation, *IFRS 15 Revenue from Contracts with Customers*. Read the primary source
- IFRS Foundation, *IFRS 9 Financial Instruments*. Read the primary source
- International Finance Corporation, *Environmental Health and Safety Guidelines for Telecommunications*. Read the primary source
- World Bank, *Guidance on PPP contractual provisions*. Read the primary source
- Bureau of Indian Standards, *Know Your Standard*. Read the primary source
- Bureau of Indian Standards, *Study of Data Centre Infrastructure in India*. Read the primary source
- IFRS Foundation, *IAS 36 Impairment of Assets*. Read the primary source
- Internet Society, *Internet Resilience Index*. Read the primary source
- ISO, *ISO IEC 27001 Information security management systems*. Read the primary source
- IFRS Foundation, *IAS 16 Property Plant and Equipment*. Read the primary source
