

1. Define the valuation question
Inference infrastructure combines real estate, utility access, network position, specialised equipment and a managed service. The valuation question is which cash flows are location-dependent, which are portable and which remain speculative development options. The analysis should identify the asset owner, utility counterparty, network operator, service provider, customer, financier and party bearing remediation or transition cost. [1][2][3][4]
The evidence file should begin with workload inventory, customer contracts, service specifications, site rights, utility agreements, network tests, equipment schedules, operating records and cash receipts. Every record should state scope, definition, effective date, expiry or refresh point, accountable owner and relationship to accepted service and cash. Public reports establish market and regulatory context. Valuation and financing conclusions require property-level rights, executed obligations, operating measurements and payment evidence.
The principal failure is that the investment case applies one multiple to land, powered shell, accelerators, service revenue and uncontracted pipeline. The practical response is to value each cash-flow and asset cohort against its own evidence, life, control and transferability. Central assumptions should be reconciled to source documents and system records. Downside cases should combine related demand, price, latency, network, power, construction, technology, customer, regulatory and liquidity risks. Management estimates should be identified in the model and refreshed when the supporting evidence changes.
2. Separate training from inference economics
Training jobs often tolerate scheduling and geographic flexibility, while inference can range from delay-tolerant batch processing to interactive or safety-sensitive decisions. Falling unit costs in one compute task do not prove that every inference workload should move to a local node. The analysis should identify the asset owner, utility counterparty, network operator, service provider, customer, financier and party bearing remediation or transition cost. [5][6][7][8]
The evidence file should begin with model architecture, request size, response target, traffic pattern, accelerator need, data path, service window, retry tolerance and customer economics. Every record should state scope, definition, effective date, expiry or refresh point, accountable owner and relationship to accepted service and cash. Public reports establish market and regulatory context. Valuation and financing conclusions require property-level rights, executed obligations, operating measurements and payment evidence.
The principal failure is that a general claim about cheaper training is used to justify an edge premium without evidence about inference demand. The practical response is to classify the actual workload and price the lowest-cost architecture that satisfies its accepted service requirement. Central assumptions should be reconciled to source documents and system records. Downside cases should combine related demand, price, latency, network, power, construction, technology, customer, regulatory and liquidity risks. Management estimates should be identified in the model and refreshed when the supporting evidence changes.
3. Classify workloads by latency sensitivity
A defensible portfolio begins with workload classes. Consumer assistants, advertising, fraud controls, industrial vision, connected vehicles, healthcare and public safety can have different performance, control and continuity needs. The analysis should identify the asset owner, utility counterparty, network operator, service provider, customer, financier and party bearing remediation or transition cost. [6][7][9][10]
The evidence file should begin with request and response logs, user location, application deadline, error budget, load profile, concurrency, model size and operational consequence. Every record should state scope, definition, effective date, expiry or refresh point, accountable owner and relationship to accepted service and cash. Public reports establish market and regulatory context. Valuation and financing conclusions require property-level rights, executed obligations, operating measurements and payment evidence.
The principal failure is that all AI demand is described as latency-sensitive even where users will accept a remote or asynchronous result. The practical response is to place each workload on a latency-and-criticality ladder and require evidence before assigning local capacity. Central assumptions should be reconciled to source documents and system records. Downside cases should combine related demand, price, latency, network, power, construction, technology, customer, regulatory and liquidity risks. Management estimates should be identified in the model and refreshed when the supporting evidence changes.
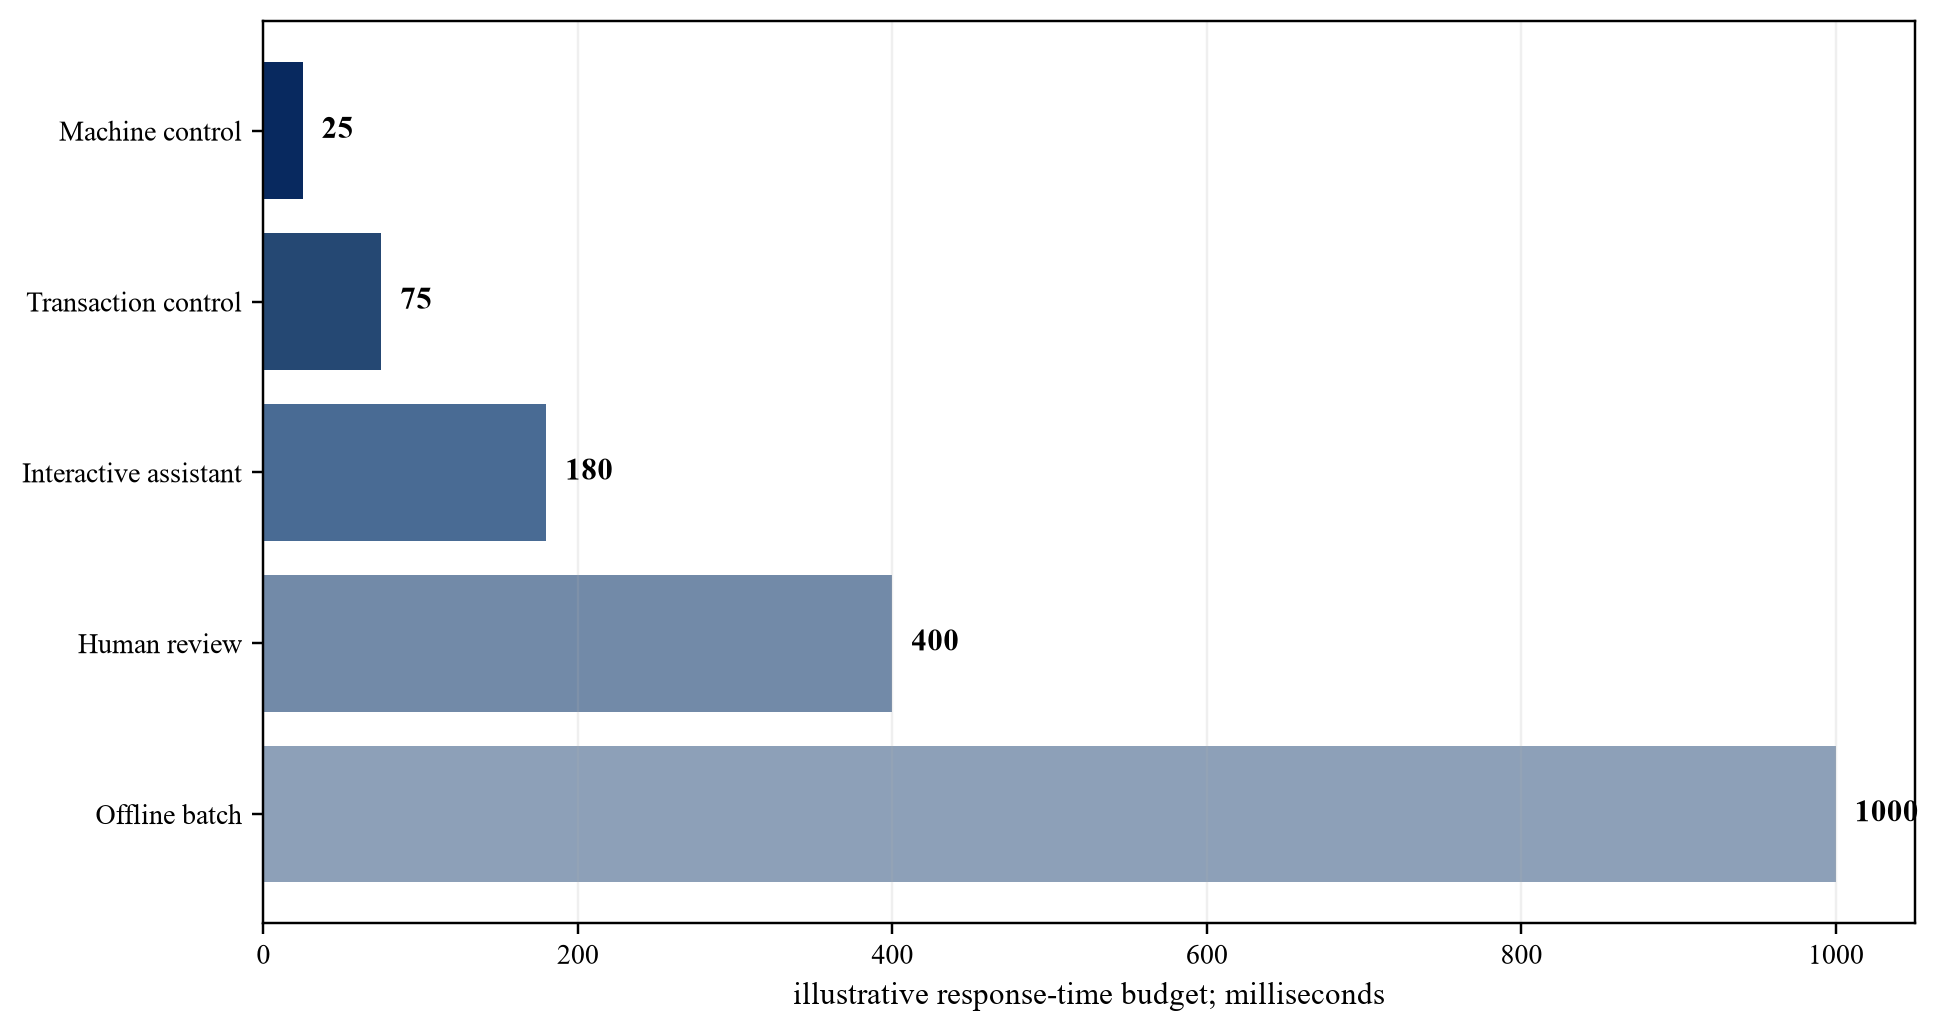
Proposed classification; application owners must validate actual performance and consequence.
| Workload class | Location sensitivity | Minimum evidence |
|---|---|---|
| offline batch | low | completion window and total cost |
| human-reviewed | moderate | user wait tolerance and queue profile |
| interactive | medium to high | loaded response trace and user acceptance |
| transaction control | high | deadline, error budget and continuity |
| machine or safety control | application-specific | validated control and fail-safe design |
Proposed framework; application evidence determines the final tier.
4. Measure the full request path
User experience depends on device processing, access network, transit, routing, queuing, data retrieval, model execution and response delivery. Server inference time represents only one component of the service. The analysis should identify the asset owner, utility counterparty, network operator, service provider, customer, financier and party bearing remediation or transition cost. [7][9][11][12]
The evidence file should begin with timestamped traces, round-trip tests, route records, peering data, congestion measures, accelerator queue and application telemetry. Every record should state scope, definition, effective date, expiry or refresh point, accountable owner and relationship to accepted service and cash. Public reports establish market and regulatory context. Valuation and financing conclusions require property-level rights, executed obligations, operating measurements and payment evidence.
The principal failure is that a facility benchmark is presented as end-to-end latency or straight-line distance is used as a service proxy. The practical response is to measure the complete path under representative load and reconcile the result to the contractual service level. Central assumptions should be reconciled to source documents and system records. Downside cases should combine related demand, price, latency, network, power, construction, technology, customer, regulatory and liquidity risks. Management estimates should be identified in the model and refreshed when the supporting evidence changes.
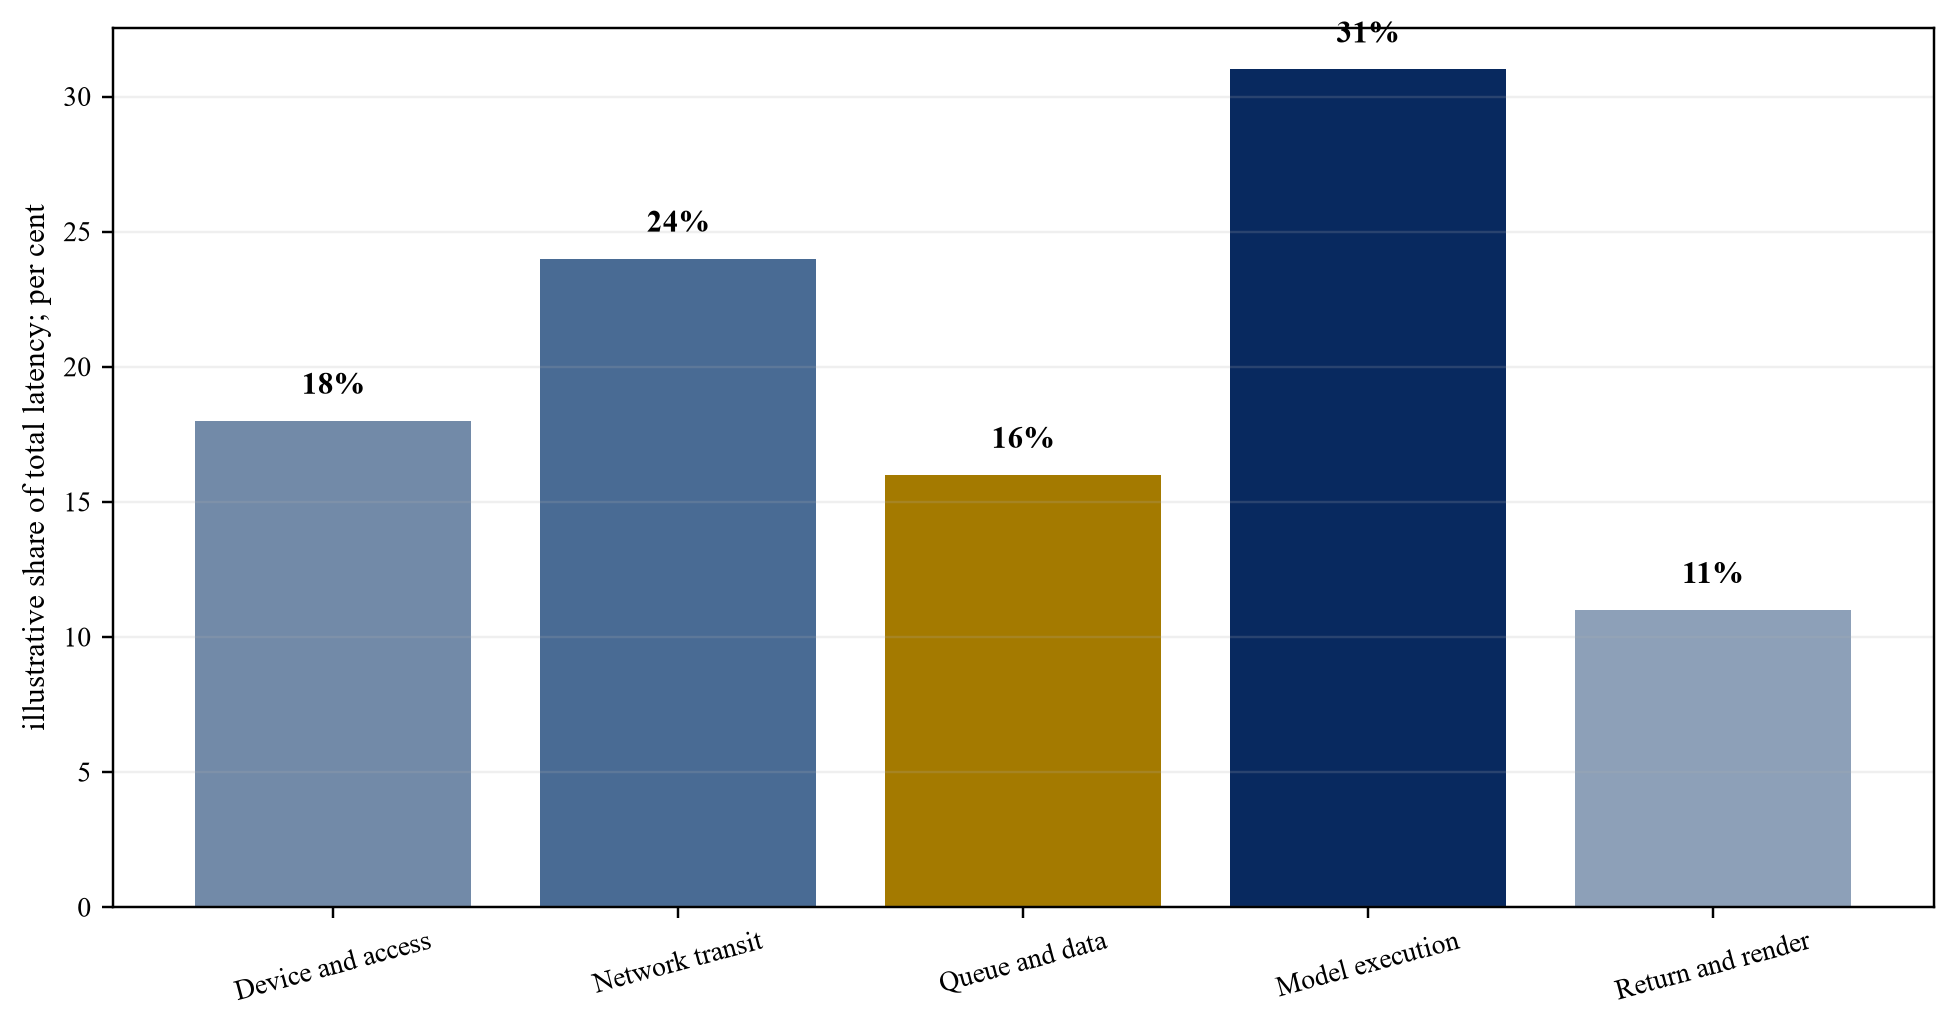
Proposed measurement framework; values are illustrative and must be replaced by traced service data.
| Layer | Evidence | Valuation use |
|---|---|---|
| device and access | client telemetry | user starting condition |
| network path | round trip, route, loss and jitter | proximity advantage |
| queue and data | request and retrieval logs | operating performance |
| model execution | accepted benchmark | compute service quality |
| end-to-end result | application trace and SLA | contracted outcome |
Proposed framework; each layer requires a timestamped, reproducible test.
5. Distinguish network proximity from geography
A nearby facility can perform poorly if fibre routes, peering, congestion or cloud on-ramps are weak. A more distant facility can outperform it through better interconnection and traffic engineering. The analysis should identify the asset owner, utility counterparty, network operator, service provider, customer, financier and party bearing remediation or transition cost. [3][4][9][11]
The evidence file should begin with fibre routes, carrier diversity, internet exchanges, cloud on-ramps, autonomous-system paths, packet loss, jitter and restoration history. Every record should state scope, definition, effective date, expiry or refresh point, accountable owner and relationship to accepted service and cash. Public reports establish market and regulatory context. Valuation and financing conclusions require property-level rights, executed obligations, operating measurements and payment evidence.
The principal failure is that metro labels and map distance substitute for tested network performance. The practical response is to use measured path quality and route diversity as the location evidence, then retest after material network changes. Central assumptions should be reconciled to source documents and system records. Downside cases should combine related demand, price, latency, network, power, construction, technology, customer, regulatory and liquidity risks. Management estimates should be identified in the model and refreshed when the supporting evidence changes.
6. Convert performance need into contracted demand
Technical need becomes financeable only when a creditworthy customer buys a defined service for a defined period. Reservation, minimum-spend, take-or-pay and termination terms determine how much demand can support capital. The analysis should identify the asset owner, utility counterparty, network operator, service provider, customer, financier and party bearing remediation or transition cost. [2][3][13][14]
The evidence file should begin with customer identity, product, committed quantity, term, price, indexation, acceptance, minimum payment, credit support, termination and renewal. Every record should state scope, definition, effective date, expiry or refresh point, accountable owner and relationship to accepted service and cash. Public reports establish market and regulatory context. Valuation and financing conclusions require property-level rights, executed obligations, operating measurements and payment evidence.
The principal failure is that customer interest, cloud pipeline or total addressable market is treated as contracted utilisation. The practical response is to size the committed module to enforceable demand and treat uncommitted pipeline as scenario upside. Central assumptions should be reconciled to source documents and system records. Downside cases should combine related demand, price, latency, network, power, construction, technology, customer, regulatory and liquidity risks. Management estimates should be identified in the model and refreshed when the supporting evidence changes.
7. Define the inference service product
A location premium attaches to a service product rather than to a building. The product must define compute, memory, interconnect, storage, network, software, observability, security, support, availability and performance. The analysis should identify the asset owner, utility counterparty, network operator, service provider, customer, financier and party bearing remediation or transition cost. [5][6][10][15]
The evidence file should begin with technical schedule, benchmark, software stack, identity, data handling, monitoring, support, service credits and acceptance protocol. Every record should state scope, definition, effective date, expiry or refresh point, accountable owner and relationship to accepted service and cash. Public reports establish market and regulatory context. Valuation and financing conclusions require property-level rights, executed obligations, operating measurements and payment evidence.
The principal failure is that providers quote nominal accelerator counts or megawatts that do not establish usable or comparable service. The practical response is to contract a workload-normalised product and require acceptance before recognising revenue or completed capacity. Central assumptions should be reconciled to source documents and system records. Downside cases should combine related demand, price, latency, network, power, construction, technology, customer, regulatory and liquidity risks. Management estimates should be identified in the model and refreshed when the supporting evidence changes.
| Dimension | Required record | Acceptance measure |
|---|---|---|
| compute | accelerator, memory and topology | workload benchmark |
| network | route, bandwidth and diversity | loaded-path latency |
| software | versions, licences and portability | reproducible deployment |
| control | data, identity, keys and logs | control test |
| service | availability, support and credits | SLA result |
| commercial | quantity, price and term | invoice and cash |
Proposed specification; contract and acceptance records govern.
8. Treat data location and security separately
Some customers need domestic processing, sector controls, controlled administrator access, encryption or auditable data deletion. These requirements can support local demand; they require legal and contractual evidence. The analysis should identify the asset owner, utility counterparty, network operator, service provider, customer, financier and party bearing remediation or transition cost. [10][16][17][18]
The evidence file should begin with data inventory, controller roles, applicable law, sector rule, threat model, access design, key custody, retention and audit rights. Every record should state scope, definition, effective date, expiry or refresh point, accountable owner and relationship to accepted service and cash. Public reports establish market and regulatory context. Valuation and financing conclusions require property-level rights, executed obligations, operating measurements and payment evidence.
The principal failure is that general sovereignty language is converted into a premium without a customer-specific control requirement. The practical response is to map each control to a contract and operating test, and separate compliance cost from commercial margin. Central assumptions should be reconciled to source documents and system records. Downside cases should combine related demand, price, latency, network, power, construction, technology, customer, regulatory and liquidity risks. Management estimates should be identified in the model and refreshed when the supporting evidence changes.
9. Gate every site by deliverable power
The DOE and LBNL evidence shows rapid growth in national data-centre electricity demand. Local value still depends on interconnection, tariff, generation, curtailment, upgrade cost and delivery timing at the specific site. The analysis should identify the asset owner, utility counterparty, network operator, service provider, customer, financier and party bearing remediation or transition cost. [1][19][20][21]
The evidence file should begin with utility agreement, study, milestones, security, construction scope, tariff, demand charge, curtailment, backup and energisation test. Every record should state scope, definition, effective date, expiry or refresh point, accountable owner and relationship to accepted service and cash. Public reports establish market and regulatory context. Valuation and financing conclusions require property-level rights, executed obligations, operating measurements and payment evidence.
The principal failure is that announced or requested megawatts are counted as operating capacity and used to support value. The practical response is to recognise power value only as rights and works move through explicit evidence gates to energised service. Central assumptions should be reconciled to source documents and system records. Downside cases should combine related demand, price, latency, network, power, construction, technology, customer, regulatory and liquidity risks. Management estimates should be identified in the model and refreshed when the supporting evidence changes.
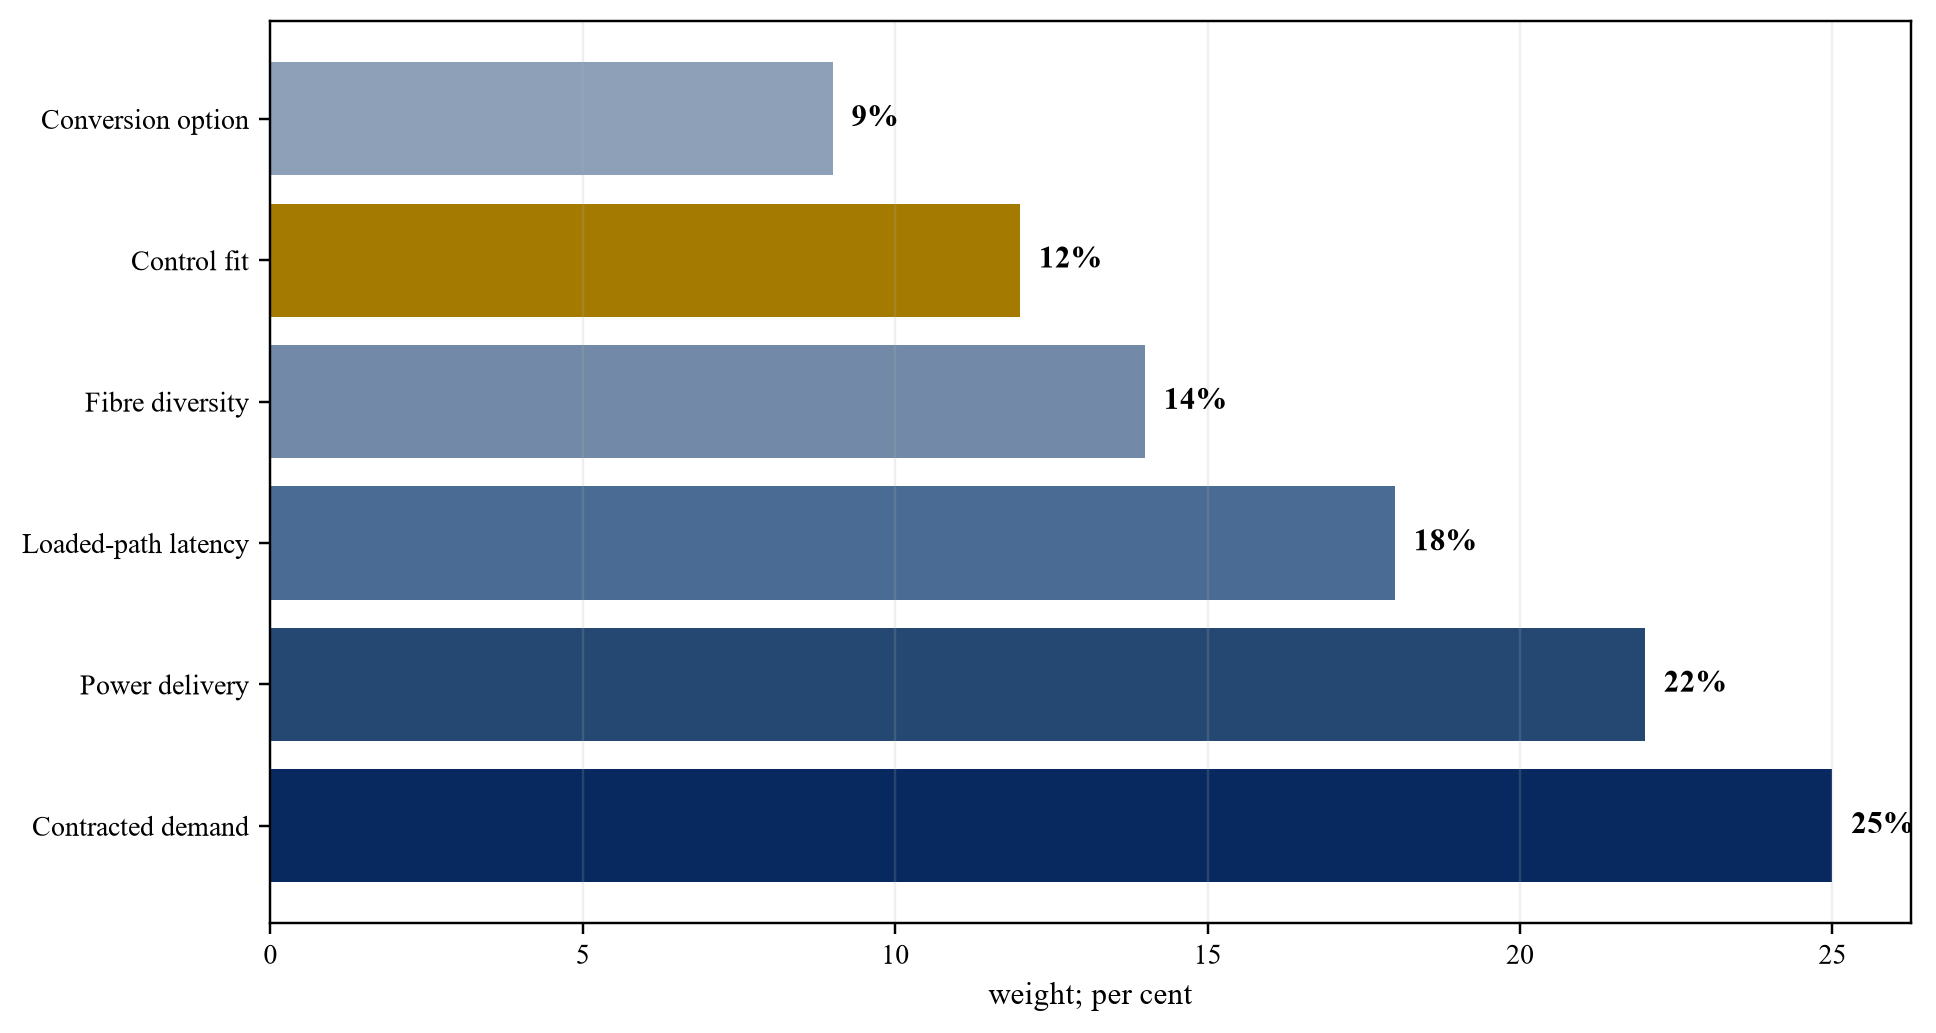
Proposed score; investment committees should approve weights and evidence thresholds.
10. Price large-load interconnection risk
FERC proceedings show that large-load and co-located arrangements raise reliability, cost-allocation and tariff questions. A power strategy can alter timing, operating flexibility and third-party cost exposure. The analysis should identify the asset owner, utility counterparty, network operator, service provider, customer, financier and party bearing remediation or transition cost. [19][20][21][22]
The evidence file should begin with RTO or ISO tariff, utility rules, interconnection study, system upgrades, transmission service, co-location terms, flexibility obligation and regulatory orders. Every record should state scope, definition, effective date, expiry or refresh point, accountable owner and relationship to accepted service and cash. Public reports establish market and regulatory context. Valuation and financing conclusions require property-level rights, executed obligations, operating measurements and payment evidence.
The principal failure is that the model assumes a fixed energisation date and unchanged cost allocation while the governing process remains open. The practical response is to apply milestone probabilities, contingency, delay liquidity and contract relief to unresolved interconnection exposure. Central assumptions should be reconciled to source documents and system records. Downside cases should combine related demand, price, latency, network, power, construction, technology, customer, regulatory and liquidity risks. Management estimates should be identified in the model and refreshed when the supporting evidence changes.
11. Underwrite energy price and flexibility
Inference demand can be continuous, bursty or scheduled. Flexible workloads may shift location or time; critical workloads may require firm supply and redundancy. The commercial value of flexibility depends on customer permission and service design. The analysis should identify the asset owner, utility counterparty, network operator, service provider, customer, financier and party bearing remediation or transition cost. [1][20][23][24]
The evidence file should begin with load shape, curtailment right, workload mobility, tariff, hedge, generation profile, storage, backup, emissions requirement and service credit. Every record should state scope, definition, effective date, expiry or refresh point, accountable owner and relationship to accepted service and cash. Public reports establish market and regulatory context. Valuation and financing conclusions require property-level rights, executed obligations, operating measurements and payment evidence.
The principal failure is that management assumes flexible load without confirming that workloads, software and customers permit interruption or migration. The practical response is to contract the flexibility product, test migration and model revenue lost during curtailment. Central assumptions should be reconciled to source documents and system records. Downside cases should combine related demand, price, latency, network, power, construction, technology, customer, regulatory and liquidity risks. Management estimates should be identified in the model and refreshed when the supporting evidence changes.
12. Model fibre and interconnection as productive assets
Carrier entrances, cross-connects, meet-me rooms, cloud adjacency and peering can improve service quality and switching cost. Their value depends on active use, diversity and customer contracts. The analysis should identify the asset owner, utility counterparty, network operator, service provider, customer, financier and party bearing remediation or transition cost. [2][3][9][11]
The evidence file should begin with installed routes, carrier agreements, cross-connect inventory, traffic, route diversity, failure history, pricing and customer dependencies. Every record should state scope, definition, effective date, expiry or refresh point, accountable owner and relationship to accepted service and cash. Public reports establish market and regulatory context. Valuation and financing conclusions require property-level rights, executed obligations, operating measurements and payment evidence.
The principal failure is that an interconnection ecosystem is valued from provider counts without evidence of traffic, redundancy or paid relationships. The practical response is to link network value to contracted services, tested failover and observable usage. Central assumptions should be reconciled to source documents and system records. Downside cases should combine related demand, price, latency, network, power, construction, technology, customer, regulatory and liquidity risks. Management estimates should be identified in the model and refreshed when the supporting evidence changes.
13. Choose the right deployment tier
The architecture may use device, premises, metro edge, regional facility or central cloud capacity. A portfolio can combine tiers when workload needs differ or when local capacity is used for resilience. The analysis should identify the asset owner, utility counterparty, network operator, service provider, customer, financier and party bearing remediation or transition cost. [6][7][8][10]
The evidence file should begin with latency target, data volume, user density, model size, update frequency, resilience, operating skill and total cost. Every record should state scope, definition, effective date, expiry or refresh point, accountable owner and relationship to accepted service and cash. Public reports establish market and regulatory context. Valuation and financing conclusions require property-level rights, executed obligations, operating measurements and payment evidence.
The principal failure is that metro deployment is selected before comparing the service and economics of other tiers. The practical response is to run a placement decision for every workload and reserve local capacity for the constraints it uniquely satisfies. Central assumptions should be reconciled to source documents and system records. Downside cases should combine related demand, price, latency, network, power, construction, technology, customer, regulatory and liquidity risks. Management estimates should be identified in the model and refreshed when the supporting evidence changes.
14. Preserve provider and hardware optionality
Accelerator supply, software ecosystems and model architectures can change faster than the shell and utility assets. Optionality requires compatible power, cooling, network, software and contractual rights. The analysis should identify the asset owner, utility counterparty, network operator, service provider, customer, financier and party bearing remediation or transition cost. [2][3][15][25]
The evidence file should begin with rack density, cooling range, electrical design, equipment dimensions, software licences, model portability, vendor terms and conversion scope. Every record should state scope, definition, effective date, expiry or refresh point, accountable owner and relationship to accepted service and cash. Public reports establish market and regulatory context. Valuation and financing conclusions require property-level rights, executed obligations, operating measurements and payment evidence.
The principal failure is that the base case assumes that current hardware remains competitive for the full property or debt tenor. The practical response is to separate shell and equipment lives, fund conversion reserves and maintain tested deployment alternatives. Central assumptions should be reconciled to source documents and system records. Downside cases should combine related demand, price, latency, network, power, construction, technology, customer, regulatory and liquidity risks. Management estimates should be identified in the model and refreshed when the supporting evidence changes.
15. Stage capacity in financeable modules
Modular development can align capital with verified demand, utility delivery and equipment availability. A 10-megawatt block is useful only if shared infrastructure and procurement allow a genuine pause. The analysis should identify the asset owner, utility counterparty, network operator, service provider, customer, financier and party bearing remediation or transition cost. [1][3][13][14]
The evidence file should begin with module scope, common works, long-lead orders, cancellation rights, independent commissioning, customer demand and funding conditions. Every record should state scope, definition, effective date, expiry or refresh point, accountable owner and relationship to accepted service and cash. Public reports establish market and regulatory context. Valuation and financing conclusions require property-level rights, executed obligations, operating measurements and payment evidence.
The principal failure is that the plan is labelled modular while the first commitment economically locks the entire campus. The practical response is to identify sunk shared costs, decision dates and contractual stop rights for every module. Central assumptions should be reconciled to source documents and system records. Downside cases should combine related demand, price, latency, network, power, construction, technology, customer, regulatory and liquidity risks. Management estimates should be identified in the model and refreshed when the supporting evidence changes.
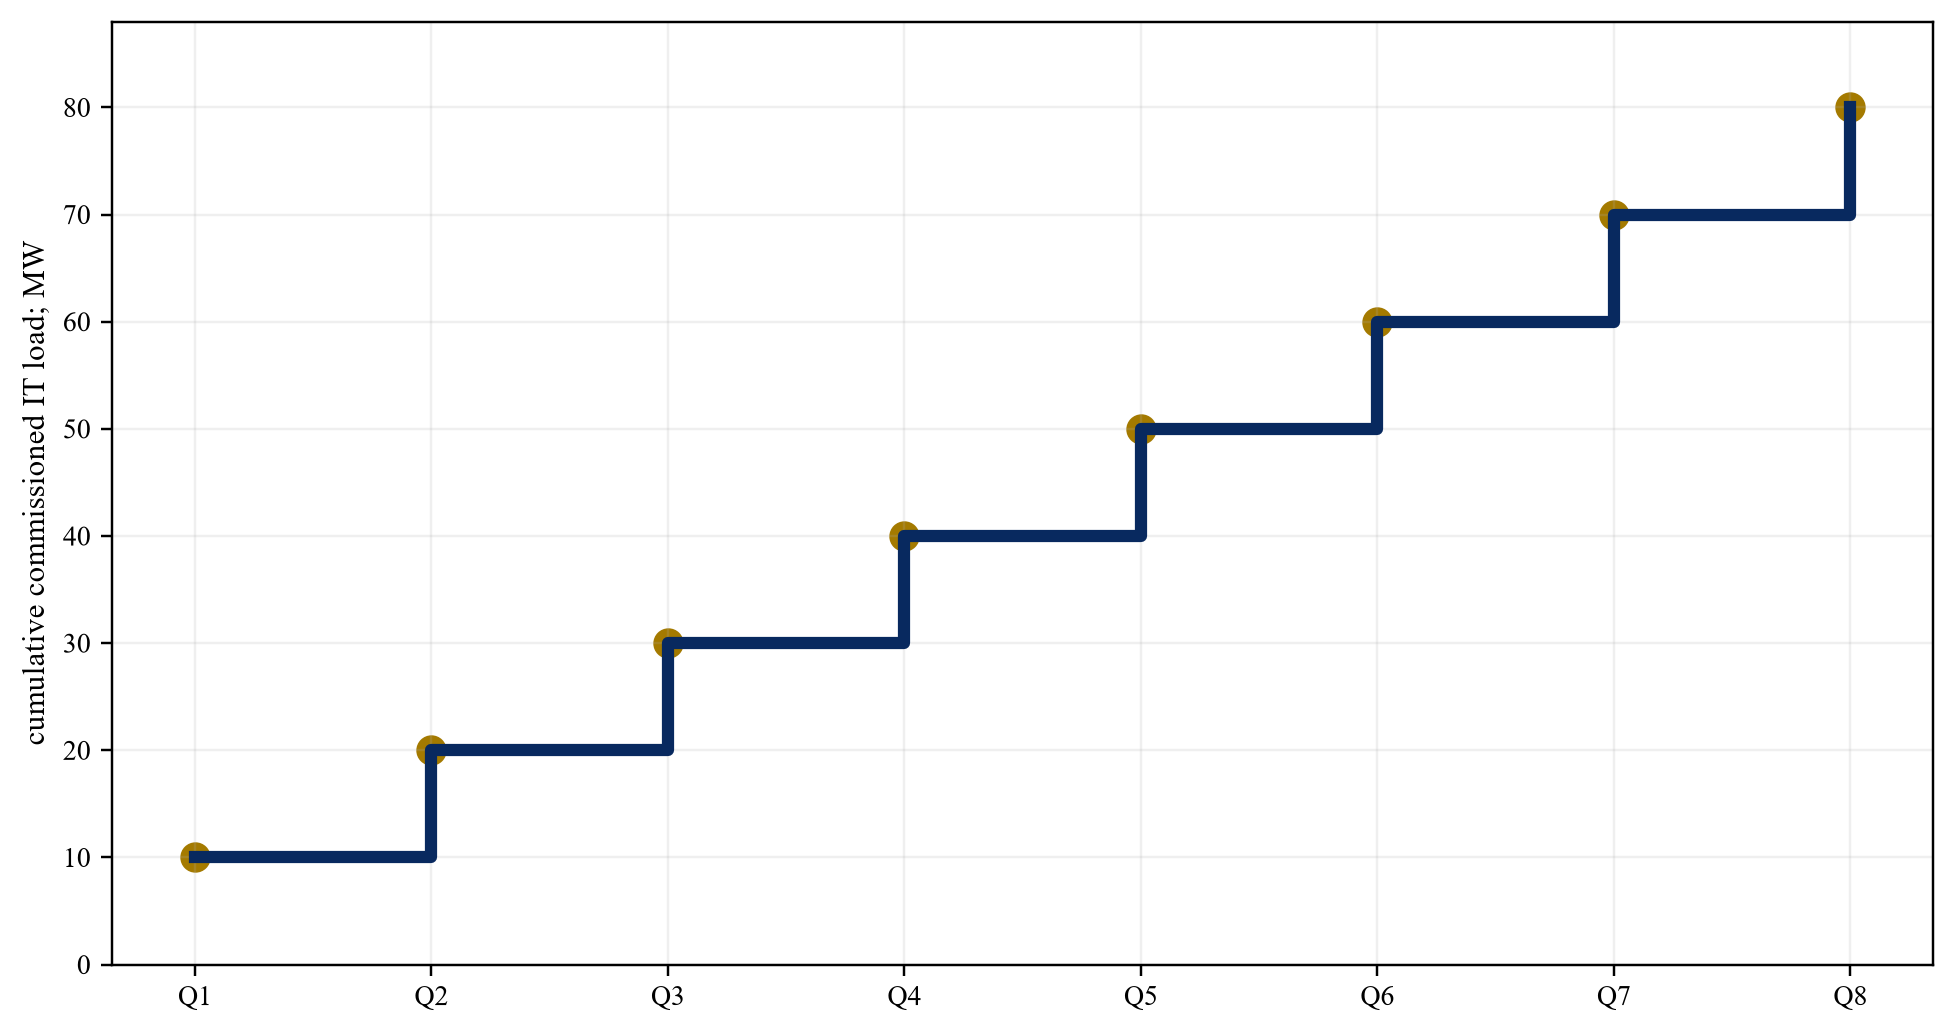
Wholly hypothetical; each 10-megawatt module requires its own demand, power and funding release.
16. Build unit economics by workload and site
Revenue per compute unit must be reconciled to accelerator utilisation, power, cooling, network, licences, support, failure, service credits, refresh, tax and financing. Portfolio averages can hide weak modules. The analysis should identify the asset owner, utility counterparty, network operator, service provider, customer, financier and party bearing remediation or transition cost. [2][3][13][14]
The evidence file should begin with accepted capacity, scheduled and active time, request volume, realised price, discounts, electricity, network, software, staff, maintenance and credits. Every record should state scope, definition, effective date, expiry or refresh point, accountable owner and relationship to accepted service and cash. Public reports establish market and regulatory context. Valuation and financing conclusions require property-level rights, executed obligations, operating measurements and payment evidence.
The principal failure is that headline revenue or gross margin excludes the costs needed to deliver the promised response and availability. The practical response is to calculate contribution by product, customer, workload and site before consolidation. Central assumptions should be reconciled to source documents and system records. Downside cases should combine related demand, price, latency, network, power, construction, technology, customer, regulatory and liquidity risks. Management estimates should be identified in the model and refreshed when the supporting evidence changes.
| Revenue or cost | Measurement basis | Common omission |
|---|---|---|
| service revenue | accepted billable unit | pipeline or reservation double count |
| electricity and cooling | metered delivered service | demand and loss charges |
| network | committed and variable traffic | cross-connect and transit |
| software and support | licence and service use | portability cost |
| equipment | depreciation, lease and refresh | residual and removal |
| service failure | credits, retries and lost use | customer remedy |
Proposed framework; costs should reconcile to invoices and operating systems.
17. Separate capacity states
Land, utility study, power reservation, construction, energised shell, installed equipment, accepted service, reserved capacity, billable use and collected cash represent different economic states. The analysis should identify the asset owner, utility counterparty, network operator, service provider, customer, financier and party bearing remediation or transition cost. [1][2][3][4]
The evidence file should begin with evidence definition, owner, date, dependency, acceptance, invoice and payment for each state. Every record should state scope, definition, effective date, expiry or refresh point, accountable owner and relationship to accepted service and cash. Public reports establish market and regulatory context. Valuation and financing conclusions require property-level rights, executed obligations, operating measurements and payment evidence.
The principal failure is that pipeline megawatts are added to operating megawatts or reservations are counted as utilisation. The practical response is to publish a capacity-to-cash waterfall and prohibit double counting across states. Central assumptions should be reconciled to source documents and system records. Downside cases should combine related demand, price, latency, network, power, construction, technology, customer, regulatory and liquidity risks. Management estimates should be identified in the model and refreshed when the supporting evidence changes.
18. Match capital to asset lives
Land, utility works, shell, cooling, network, accelerators and software have different useful lives, residual risks and security. Financing should follow the recoverable asset and cash-flow duration. The analysis should identify the asset owner, utility counterparty, network operator, service provider, customer, financier and party bearing remediation or transition cost. [26][27][28][29]
The evidence file should begin with asset register, cost, useful life, residual evidence, lease, lien, service contract, refresh plan, security and lender rights. Every record should state scope, definition, effective date, expiry or refresh point, accountable owner and relationship to accepted service and cash. Public reports establish market and regulatory context. Valuation and financing conclusions require property-level rights, executed obligations, operating measurements and payment evidence.
The principal failure is that long-term project debt funds short-lived technology whose cash flow disappears before maturity. The practical response is to use long-duration debt for durable site assets, cohort finance for equipment and equity for uncertain demand and refresh. Central assumptions should be reconciled to source documents and system records. Downside cases should combine related demand, price, latency, network, power, construction, technology, customer, regulatory and liquidity risks. Management estimates should be identified in the model and refreshed when the supporting evidence changes.
19. Contract anchors without creating stranded capacity
Anchor customers can support a module when the contract fixes product, quantity, commencement, price, acceptance and remedies. Concentration and technology specificity can weaken reletting value. The analysis should identify the asset owner, utility counterparty, network operator, service provider, customer, financier and party bearing remediation or transition cost. [2][3][13][14]
The evidence file should begin with anchor credit, term, capacity schedule, ramp, prepayment, termination, credit support, equipment specificity and substitution rights. Every record should state scope, definition, effective date, expiry or refresh point, accountable owner and relationship to accepted service and cash. Public reports establish market and regulatory context. Valuation and financing conclusions require property-level rights, executed obligations, operating measurements and payment evidence.
The principal failure is that a large customer name substitutes for contract analysis and future reletting assumptions. The practical response is to size debt to stressed anchor cash and value alternative use after conversion cost and downtime. Central assumptions should be reconciled to source documents and system records. Downside cases should combine related demand, price, latency, network, power, construction, technology, customer, regulatory and liquidity risks. Management estimates should be identified in the model and refreshed when the supporting evidence changes.
20. Plan technology refresh and residual value
Inference hardware can become economically obsolete before physical failure. Residual value depends on secondary demand, software support, energy efficiency, redeployment cost and lease terms. The analysis should identify the asset owner, utility counterparty, network operator, service provider, customer, financier and party bearing remediation or transition cost. [3][15][25][29]
The evidence file should begin with cohort age, performance per watt, software support, maintenance, secondary-market evidence, removal cost, redeployment and impairment indicators. Every record should state scope, definition, effective date, expiry or refresh point, accountable owner and relationship to accepted service and cash. Public reports establish market and regulatory context. Valuation and financing conclusions require property-level rights, executed obligations, operating measurements and payment evidence.
The principal failure is that book value or vendor list price is treated as recoverable value through the forecast. The practical response is to use conservative cohort residuals, scheduled refresh reserves and early impairment triggers. Central assumptions should be reconciled to source documents and system records. Downside cases should combine related demand, price, latency, network, power, construction, technology, customer, regulatory and liquidity risks. Management estimates should be identified in the model and refreshed when the supporting evidence changes.
21. Apply a hypothetical 80-megawatt portfolio
The case tests four US metro clusters, each delivered through two 10-megawatt modules. It provides a decision model and does not describe an announced project, customer or capital commitment. The analysis should identify the asset owner, utility counterparty, network operator, service provider, customer, financier and party bearing remediation or transition cost. [1][2][19][26]
The evidence file should begin with the stated hypothetical uses, sources, module gates, customer reservations, utilisation, price index, power, refresh and downside assumptions. Every record should state scope, definition, effective date, expiry or refresh point, accountable owner and relationship to accepted service and cash. Public reports establish market and regulatory context. Valuation and financing conclusions require property-level rights, executed obligations, operating measurements and payment evidence.
The principal failure is that the model fills all modules from a market-growth narrative rather than contracted service evidence. The practical response is to release capital one module at a time and preserve the right to defer, convert or relocate equipment. Central assumptions should be reconciled to source documents and system records. Downside cases should combine related demand, price, latency, network, power, construction, technology, customer, regulatory and liquidity risks. Management estimates should be identified in the model and refreshed when the supporting evidence changes.
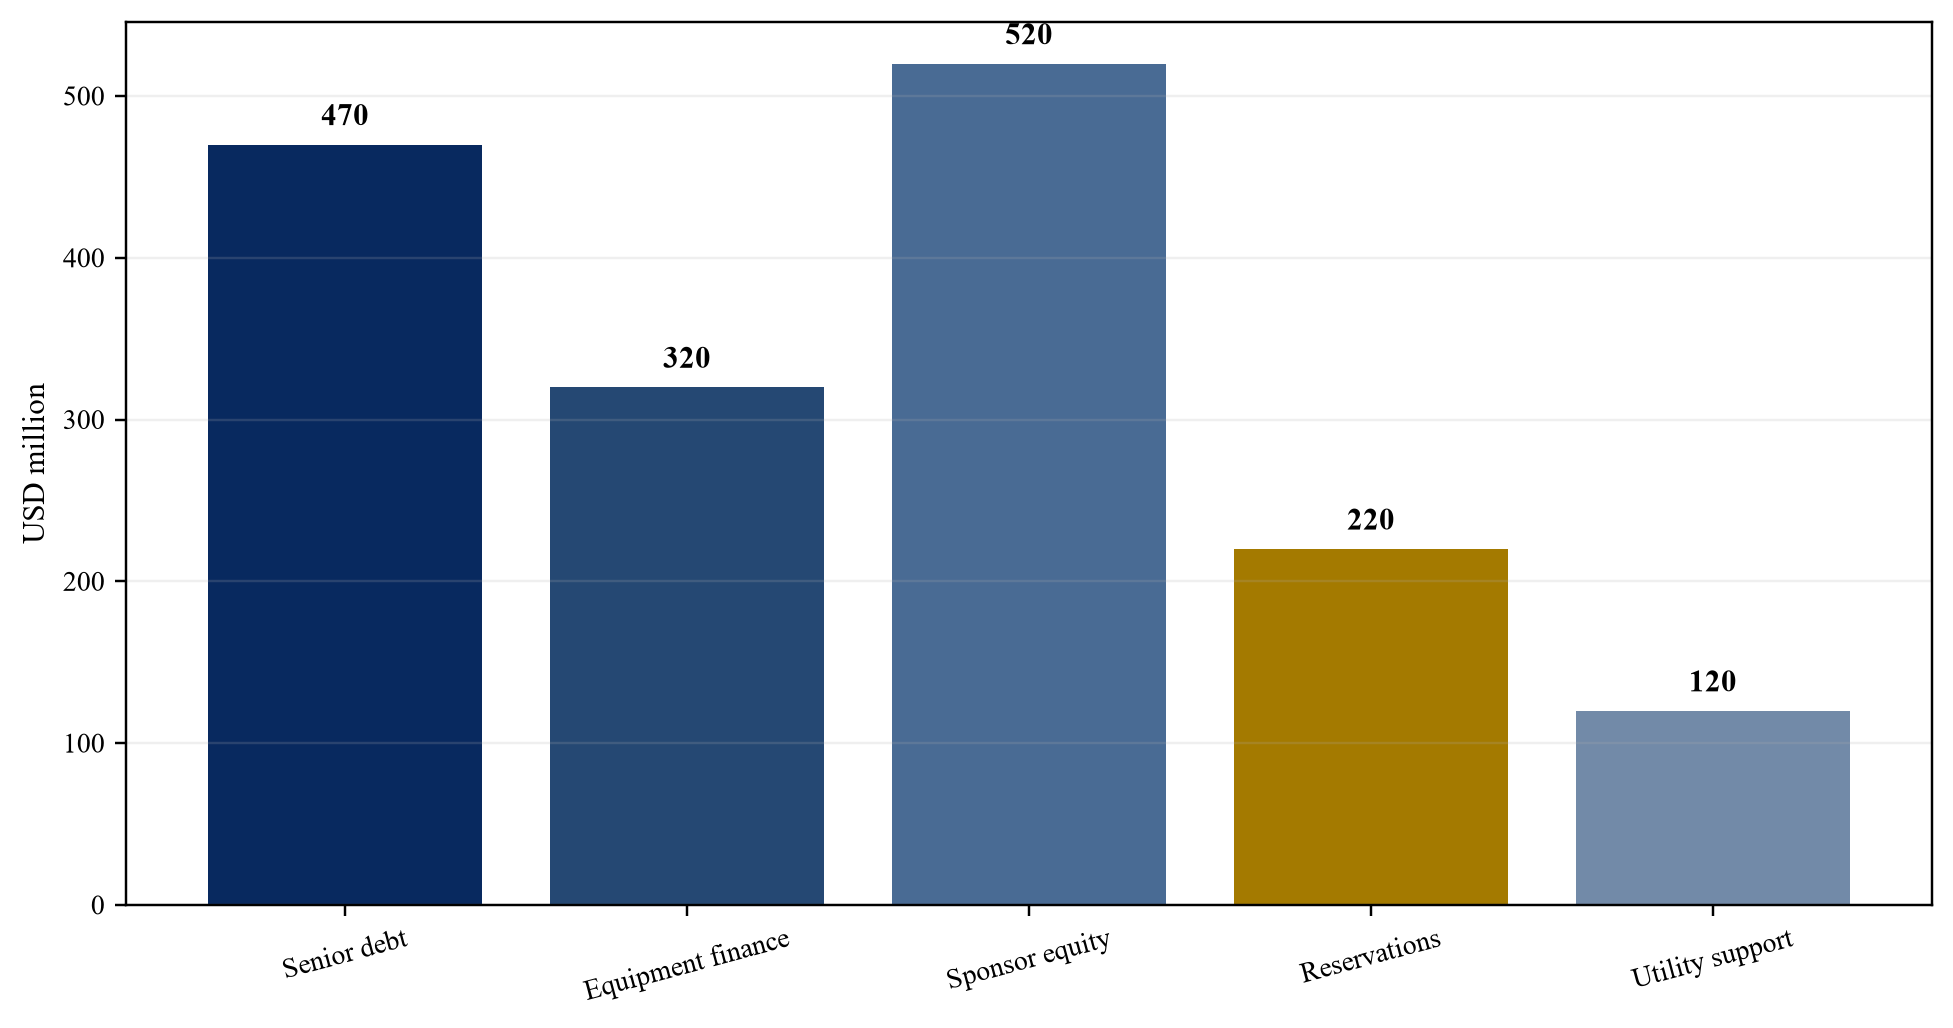
Wholly hypothetical; USD million.
| Metric | Central case | Downside or gate |
|---|---|---|
| initial IT load | 80 MW across four metro clusters | eight 10 MW modules |
| initial uses | USD 1,650 million | USD 1,820 million cap |
| senior debt | USD 470 million | durable site cash only |
| equipment finance and leases | USD 320 million | eligible cohorts only |
| sponsor equity | USD 520 million | funded before debt draw |
| paid capacity reservations | USD 220 million | service and release terms |
| utility or transition support | USD 120 million | milestone based |
| year-four billable utilisation | 67% | 46% combined downside |
Wholly hypothetical; figures do not describe an announced project or transaction.
22. Allocate construction and operating risk
Land, permitting, utility, network, equipment, commissioning, service, cybersecurity and customer risks sit with different parties. Contract allocation should follow control and balance-sheet capacity. The analysis should identify the asset owner, utility counterparty, network operator, service provider, customer, financier and party bearing remediation or transition cost. [19][20][26][27]
The evidence file should begin with risk matrix, contract caps, insurance, guarantees, direct agreements, relief events, termination, service credits and step-in rights. Every record should state scope, definition, effective date, expiry or refresh point, accountable owner and relationship to accepted service and cash. Public reports establish market and regulatory context. Valuation and financing conclusions require property-level rights, executed obligations, operating measurements and payment evidence.
The principal failure is that the project company retains risks controlled by utilities, vendors or customers without compensation or recourse. The practical response is to assign each risk to the controlling party and maintain reserves for retained correlated exposures. Central assumptions should be reconciled to source documents and system records. Downside cases should combine related demand, price, latency, network, power, construction, technology, customer, regulatory and liquidity risks. Management estimates should be identified in the model and refreshed when the supporting evidence changes.
| Risk | Primary controller | Core protection |
|---|---|---|
| utility and energisation | utility and site company | milestone, security and relief |
| network and route | carrier and operator | diversity and restoration |
| equipment and commissioning | vendor and operator | acceptance and warranty |
| customer demand | customer and sponsor | minimum payment and staging |
| service performance | operator | monitoring and credits |
| refresh and residual | sponsor and financier | cohort limits and reserve |
Proposed framework; final contracts and law determine allocation.
23. Stress utilisation, price, power and refresh together
Inference facilities face correlated downside. Delayed power can miss customer dates; weaker demand can reduce price; technology change can require unplanned refresh; concentration can amplify all three. The analysis should identify the asset owner, utility counterparty, network operator, service provider, customer, financier and party bearing remediation or transition cost. [1][2][3][29]
The evidence file should begin with base and downside assumptions, correlations, module timing, liquidity, covenant, cure, sponsor support and redeployment cases. Every record should state scope, definition, effective date, expiry or refresh point, accountable owner and relationship to accepted service and cash. Public reports establish market and regulatory context. Valuation and financing conclusions require property-level rights, executed obligations, operating measurements and payment evidence.
The principal failure is that single-variable sensitivity understates the liquidity effect of combined delay, price and refresh shocks. The practical response is to run combined scenarios and identify the earliest cash, covenant and funding failure. Central assumptions should be reconciled to source documents and system records. Downside cases should combine related demand, price, latency, network, power, construction, technology, customer, regulatory and liquidity risks. Management estimates should be identified in the model and refreshed when the supporting evidence changes.
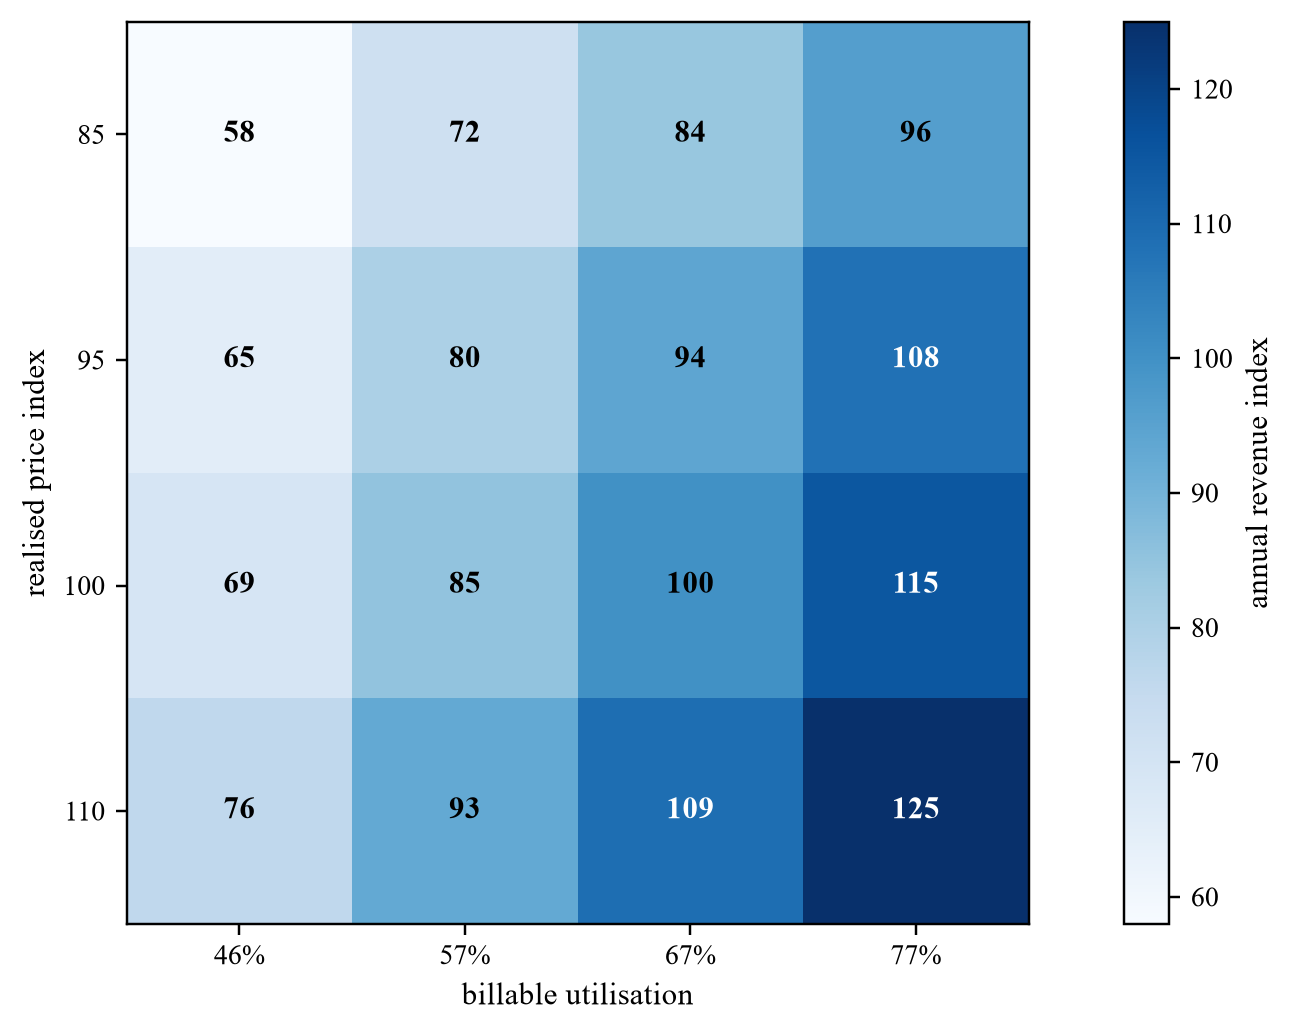
Wholly hypothetical; annual service-revenue index where the central case equals 100.
24. Value contracted and portable cash separately
Cash tied to a tested metro requirement can support location value. Portable or short-term demand can move when price, technology or power changes. Pipeline and optional expansion require probability and cost. The analysis should identify the asset owner, utility counterparty, network operator, service provider, customer, financier and party bearing remediation or transition cost. [2][3][13][14]
The evidence file should begin with contract term, location clause, performance obligation, termination, switching cost, portability, renewal and alternative provider evidence. Every record should state scope, definition, effective date, expiry or refresh point, accountable owner and relationship to accepted service and cash. Public reports establish market and regulatory context. Valuation and financing conclusions require property-level rights, executed obligations, operating measurements and payment evidence.
The principal failure is that all revenue receives the same multiple because it is labelled AI infrastructure. The practical response is to segment cash by durability, location dependence, margin, capital need and transferability before applying value. Central assumptions should be reconciled to source documents and system records. Downside cases should combine related demand, price, latency, network, power, construction, technology, customer, regulatory and liquidity risks. Management estimates should be identified in the model and refreshed when the supporting evidence changes.
25. Recognise a latency premium only when earned
A premium requires a measurable response advantage, a customer need for that advantage, an enforceable payment and a cost structure that preserves margin. The result can differ by workload and time of day. The analysis should identify the asset owner, utility counterparty, network operator, service provider, customer, financier and party bearing remediation or transition cost. [7][9][11][12]
The evidence file should begin with controlled benchmark, loaded-path test, customer acceptance, price schedule, minimum payment, service credits, alternative-site comparison and retained margin. Every record should state scope, definition, effective date, expiry or refresh point, accountable owner and relationship to accepted service and cash. Public reports establish market and regulatory context. Valuation and financing conclusions require property-level rights, executed obligations, operating measurements and payment evidence.
The principal failure is that marketing claims, benchmark milliseconds or metro proximity are capitalised without paid evidence. The practical response is to recognise the premium only after service acceptance and cash, then retest it against the next-best architecture. Central assumptions should be reconciled to source documents and system records. Downside cases should combine related demand, price, latency, network, power, construction, technology, customer, regulatory and liquidity risks. Management estimates should be identified in the model and refreshed when the supporting evidence changes.
26. Design monitoring for lenders and investors
Monitoring should connect capacity, network performance, customer service, power, equipment, revenue and cash. It should distinguish temporary operating variance from structural value impairment. The analysis should identify the asset owner, utility counterparty, network operator, service provider, customer, financier and party bearing remediation or transition cost. [2][3][13][29]
The evidence file should begin with data dictionary, facility telemetry, network traces, service logs, utility invoices, customer invoices, credits, cash, cohort records and exceptions. Every record should state scope, definition, effective date, expiry or refresh point, accountable owner and relationship to accepted service and cash. Public reports establish market and regulatory context. Valuation and financing conclusions require property-level rights, executed obligations, operating measurements and payment evidence.
The principal failure is that dashboards report favourable uptime and utilisation measures that cannot reconcile to customer acceptance and cash. The practical response is to maintain an auditable capacity-to-service-to-cash record by module, workload and customer. Central assumptions should be reconciled to source documents and system records. Downside cases should combine related demand, price, latency, network, power, construction, technology, customer, regulatory and liquidity risks. Management estimates should be identified in the model and refreshed when the supporting evidence changes.
27. Plan exit, conversion and redeployment
Exit value may come from stabilised infrastructure cash, strategic network position, redevelopment rights, equipment sale or operating platform value. Each route requires a different buyer and evidence set. The analysis should identify the asset owner, utility counterparty, network operator, service provider, customer, financier and party bearing remediation or transition cost. [2][3][4][25]
The evidence file should begin with title, utility rights, contracts, network relationships, equipment ownership, software rights, transfer consents, conversion budget and buyer universe. Every record should state scope, definition, effective date, expiry or refresh point, accountable owner and relationship to accepted service and cash. Public reports establish market and regulatory context. Valuation and financing conclusions require property-level rights, executed obligations, operating measurements and payment evidence.
The principal failure is that the terminal value assumes a generic data-centre multiple after specialised contracts and hardware expire. The practical response is to model buyer-specific value, conversion cost, downtime and residual rights for each exit route. Central assumptions should be reconciled to source documents and system records. Downside cases should combine related demand, price, latency, network, power, construction, technology, customer, regulatory and liquidity risks. Management estimates should be identified in the model and refreshed when the supporting evidence changes.
28. Reach the investment and valuation decision
Approval should follow measured workload need, accepted service, deliverable power, resilient fibre, modular capital, matched financing, refresh capacity and downside liquidity. Location value remains conditional until these elements are present. The analysis should identify the asset owner, utility counterparty, network operator, service provider, customer, financier and party bearing remediation or transition cost. [1][9][19][26]
The evidence file should begin with workload map, latency evidence, customer contracts, site gates, capital plan, asset lives, risk allocation, scenarios, controls and approval record. Every record should state scope, definition, effective date, expiry or refresh point, accountable owner and relationship to accepted service and cash. Public reports establish market and regulatory context. Valuation and financing conclusions require property-level rights, executed obligations, operating measurements and payment evidence.
The principal failure is that strategic urgency or AI market growth becomes a reason to commit the full portfolio before evidence matures. The practical response is to approve staged capital and recognise value as each module moves from rights to accepted service and collected cash. Central assumptions should be reconciled to source documents and system records. Downside cases should combine related demand, price, latency, network, power, construction, technology, customer, regulatory and liquidity risks. Management estimates should be identified in the model and refreshed when the supporting evidence changes.
| Decision | Minimum evidence | Possible action |
|---|---|---|
| workload placement | tested need and alternatives | local, regional or central |
| site module | demand, power, fibre and permits | approve, resize or defer |
| debt | stressed eligible cash and security | lend, condition or reduce |
| equipment cohort | accepted service and residual | finance, lease or hold |
| location premium | paid latency or control need | recognise, cap or reject |
| next module | utilisation, cash and liquidity | release, convert or stop |
Proposed governance; each approval should identify evidence, owner and expiry.
Sources
- Lawrence Berkeley National Laboratory, *United States Data Center Energy Usage Report: 2025 Update* (2026). Read the primary source
- Equinix, *Annual Report on Form 10-K for 2025* (2026). Read the primary source
- Digital Realty Trust, *Annual Report on Form 10-K for 2025* (2026). Read the primary source
- Digital Realty Trust, *Quarterly Report on Form 10-Q for the quarter ended 31 March 2026*. Read the primary source
- National Institute of Standards and Technology, *The NIST Definition of Cloud Computing*, SP 800-145. Read the primary source
- National Institute of Standards and Technology, *Fog Computing Conceptual Model*, SP 500-325. Read the primary source
- Federal Communications Commission, *Thirteenth Measuring Broadband America Fixed Broadband Report*, FCC 24-136 (2024). Read the primary source
- National Institute of Standards and Technology, *Edge AI*. Read the primary source
- Federal Communications Commission, *2024 Communications Marketplace Report*, FCC 24-136. Read the primary source
- National Institute of Standards and Technology, *AI Risk Management Framework*. Read the primary source
- National Institute of Standards and Technology, *Information Centric Networking Program*. Read the primary source
- Federal Communications Commission, *Measuring Broadband America Methodology*. Read the primary source
- Equinix, *2025 Annual Report print version*. Read the primary source
- Digital Realty Trust, *Second-quarter 2026 investor presentation*. Read the primary source
- MLCommons, *MLPerf Inference Benchmark*. Read the primary source
- National Institute of Standards and Technology, *Zero Trust Architecture*, SP 800-207. Read the primary source
- National Institute of Standards and Technology, *Security and Privacy Controls for Information Systems and Organizations*, SP 800-53 Rev. 5. Read the primary source
- National Institute of Standards and Technology, *Cybersecurity Framework 2.0*. Read the primary source
- Federal Energy Regulatory Commission, *Interconnection of Large Loads to the Interstate Transmission System*, Docket RM26-4. Read the primary source
- Federal Energy Regulatory Commission, *FERC Launches Targeted Action to Speed Large Load Integration* (2026). Read the primary source
- Federal Energy Regulatory Commission, *FERC Orders Action on Co-Location Issues Related to Data Centers Running AI* (2025). Read the primary source
- North American Electric Reliability Corporation, *Characteristics and Risks of Emerging Large Loads* (2025). Read the primary source
- U.S. Energy Information Administration, *Electric Power Monthly*. Read the primary source
- U.S. Energy Information Administration, *Annual Energy Outlook*. Read the primary source
- Core Scientific, *Annual Report on Form 10-K for 2025* (2026). Read the primary source
- IFRS Foundation, *IFRS 16 Leases*. Read the primary source
- IFRS Foundation, *IFRS 9 Financial Instruments*. Read the primary source
- IFRS Foundation, *IFRS 15 Revenue from Contracts with Customers*. Read the primary source
- IFRS Foundation, *IAS 36 Impairment of Assets*. Read the primary source
- IFRS Foundation, *IFRS 13 Fair Value Measurement*. Read the primary source
- International Energy Agency, *Energy and AI* (2025). Read the primary source
- U.S. Department of Energy, *Powering America's AI Future; Data Center Resource Hub* (2026). Read the primary source
- Lawrence Berkeley National Laboratory, *2024 United States Data Center Energy Usage Report*. Read the primary source
