

1. Define the investable question before defining the city
The investable question is whether a retailer can reproduce attractive cash economics in a new city without weakening inventory control, service quality or governance. A broad city label cannot answer it. India uses several official and commercial classifications for administrative, population, compensation, banking and market-analysis purposes. They serve different objectives. The investment team should therefore state its own measurable cohort definition, disclose the variables and preserve the underlying city data.
A practical definition can begin with population, household consumption, customer density, travel time to the existing network, retail rent, organised-retail penetration, logistics service, digital-payment acceptance and the availability of operating talent. The resulting cohort may include cities normally described as tier two while excluding a city whose economics or execution risk do not fit the retailer. It may also include a peripheral metropolitan cluster if the evidence is comparable. The decision remains traceable because every inclusion rests on recorded attributes.
The paper uses the phrase tier-two retail as a familiar description of non-primary metropolitan growth. The model itself uses city-specific evidence. The first board paper should identify the legal entity, store format, customer proposition, product categories, channels, target city cohort, capital requirement and decision date. It should state which facts are observed, which values are management estimates and which values are hypothetical analytical assumptions.
This discipline prevents an attractive national narrative from carrying an individual store decision. India can have rising aggregate consumption while a particular format, price point or catchment fails. Growth capital should be attached to a falsifiable operating thesis: a defined customer will buy a defined assortment at a defined gross margin often enough to recover store and inventory investment within an approved period.
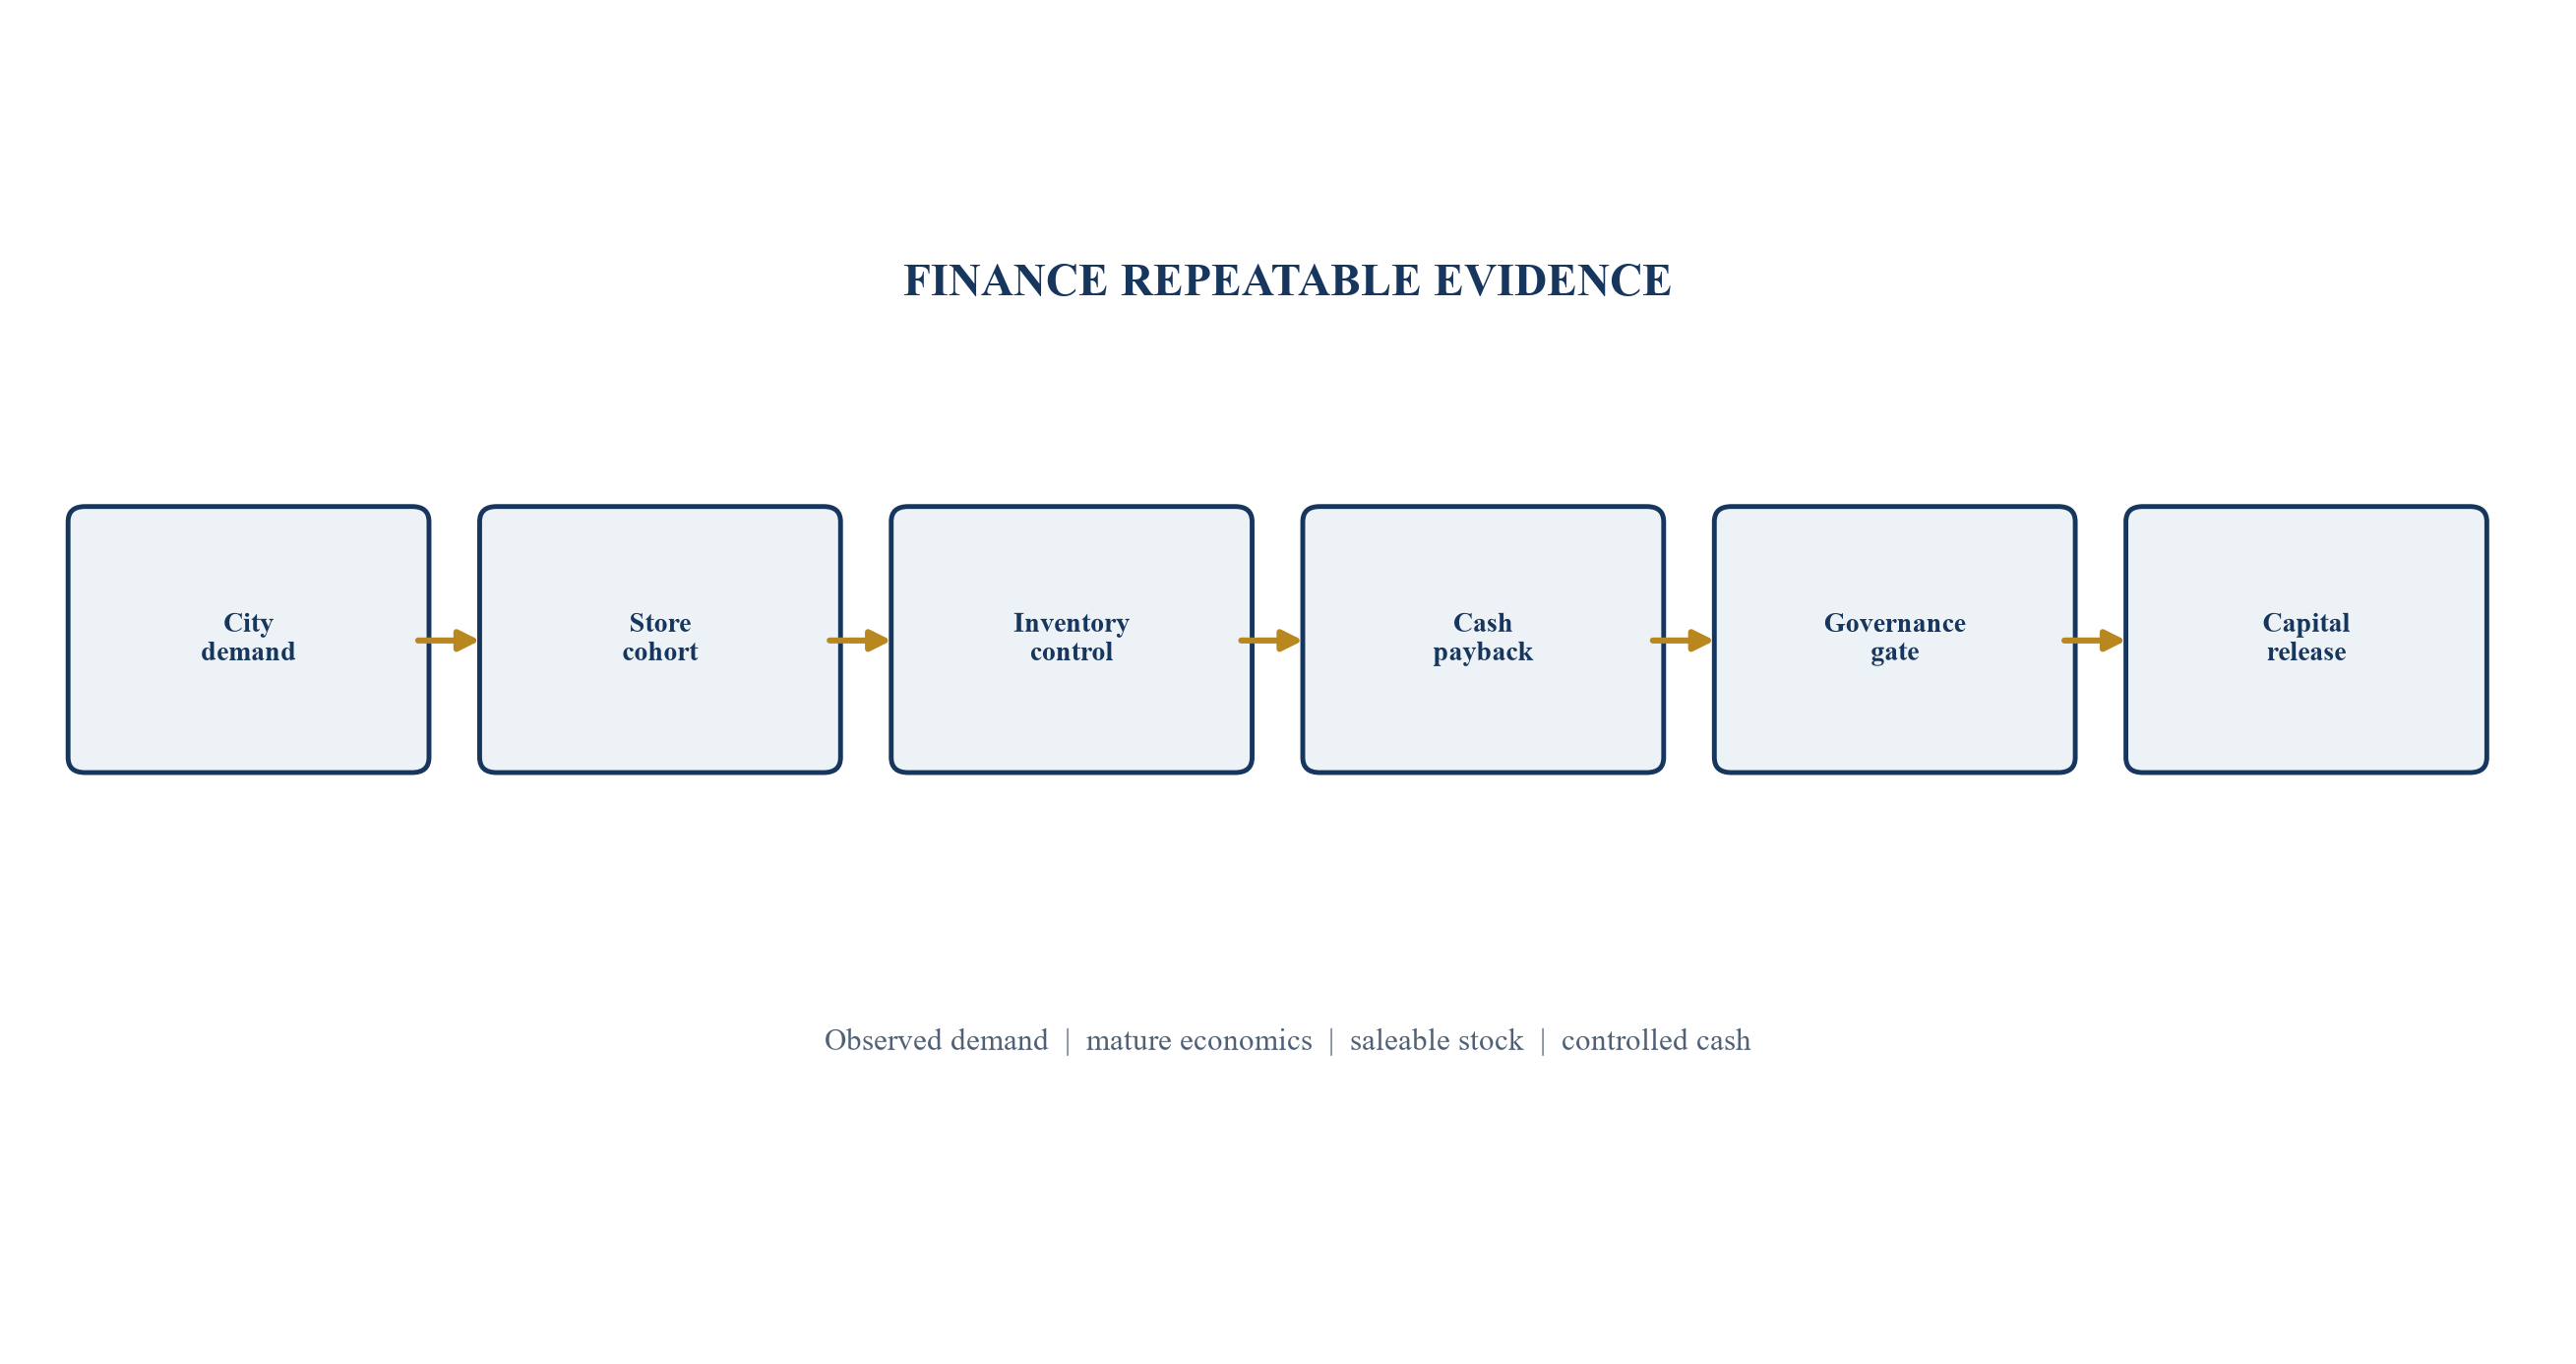
The sequence is an analytical framework; every gate requires company-specific verification.
2. Establish one decision-grade data model
Retail data commonly sits across point-of-sale systems, enterprise resource planning, warehouse management, ecommerce, marketplaces, loyalty platforms, payment processors, bank accounts and spreadsheets. Each system may use different product, customer, store and time identifiers. A board can receive a polished monthly dashboard while the underlying sales, returns, inventory and cash records fail to reconcile. Growth magnifies that weakness because new locations add opening stock, transfers, markdowns, local promotions and staff discretion.
The decision-grade model needs controlled master data. Each store should have a unique identifier, opening date, format, catchment, floor area, lease terms, fit-out cost and closure status. Each stock-keeping unit should have category, brand, season, purchase cost, landed cost, tax treatment, list price and lifecycle status. Each transaction should connect order, item, discount, tax, return, payment and settlement identifiers. Inventory movements should capture receipts, transfers, sales, returns, damage, shrinkage and write-offs.
Reconciliation is part of the model. Net sales should bridge to payment settlements and bank receipts. Cost of goods sold should bridge to inventory movement and the general ledger. Store payroll and occupancy should bridge to contracts and payments. Manual journal entries, stock adjustments and promotional overrides should be separately visible. A data dictionary should define every metric and name its owner.
Investors should receive both the metric and its lineage. A reported inventory turn of four times has limited meaning if cost of goods sold uses a different period from average inventory, if goods in transit are excluded inconsistently or if obsolete stock remains at cost. The diligence file should preserve source extracts, transformations, exception logs and approvals. This enables repeatable monitoring after investment and reduces dependence on a single analyst.
Table 1. Minimum store-cohort data room
| Data family | Minimum fields | Key reconciliation | Principal decision use |
|---|---|---|---|
| store master | identifier, opening date, format, area, catchment, lease, capex | lease and fixed-asset register | cohort assignment and invested capital |
| transactions | order, item, quantity, price, discount, tax, return, payment | POS to settlement and bank | revenue quality and demand |
| inventory | SKU, location, age, cost, receipt, transfer, sale, write-off | subledger to general ledger | turns, ageing and cash requirement |
| operating cost | payroll, rent, utilities, local marketing, fulfilment | contracts, invoices and payroll | store contribution and payback |
| customer and channel | cohort, acquisition source, repeat behaviour, store/digital touchpoint | loyalty and campaign records | incremental demand and attribution |
The required depth depends on the retailer, category and transaction; fields should reconcile to source systems and financial statements.
3. Build store cohorts before comparing stores
A store opened three months ago should not be compared directly with one operating for four years. The first months include launch promotions, incomplete awareness, staff learning, assortment adjustment and opening-stock effects. Store cohorts create a comparable clock. Each store is assigned to an opening vintage, format, size band and city type; performance is then measured at the same months since opening.
The cohort curve should show net sales, gross margin, transaction count, average basket, repeat-customer share, payroll, occupancy, local marketing, store contribution and cash investment by month since opening. The median and dispersion matter. One exceptional flagship can conceal weak repeatability. The board should view the proportion of stores that reach each maturity gate and the reasons for misses.
Comparable-store growth begins only after an approved maturity point and excludes temporary closures or material format changes under a documented policy. New-store productivity is a separate measure. Cannibalisation should be estimated where catchments overlap, with customer and postcode evidence where available. A network can report positive total growth while existing stores decline and new stores consume cash.
The curve should distinguish operational maturation from calendar seasonality. A store opened before a major festival may appear to ramp faster than a store opened in a quieter quarter. The model can align both months-since-opening and comparable calendar periods. Where history is short, the uncertainty should reduce confidence and delay capital rather than create a precise-looking forecast.
4. Measure contribution before corporate allocation
Store economics should bridge revenue to cash in layers. Net sales follow returns, discounts and taxes. Product gross margin follows landed product cost. Fulfilment margin deducts store-specific delivery, payment and packaging costs where relevant. Store contribution deducts controllable payroll, occupancy, utilities, local marketing and maintenance. Cash contribution then reflects working-capital movement and store-level capital expenditure.
Central overhead remains economically real, but allocating it too early can obscure whether the store proposition works. The board should view both store contribution and a fully loaded network case. The allocation method should be stable and disclosed. Shared technology, regional management and warehouse capacity may step up as the network expands, creating a lumpy cost rather than a constant percentage of revenue.
The gross-margin bridge should separate price, mix, markdown, procurement cost, freight, shrinkage and returns. A retailer can grow sales by discounting while reducing contribution. It can also improve headline margin through capitalised or deferred costs that do not improve cash. The bridge should reconcile to accounting records and cash payments.
Expansion readiness depends on a repeatable range, not a single point estimate. The investment case should show median mature-store contribution, lower-quartile performance, downside sensitivity and closure economics. A store model that works only at the top quartile is unsuitable for rapid replication. Capital release can require a minimum proportion of mature stores above the approved contribution and payback gates.
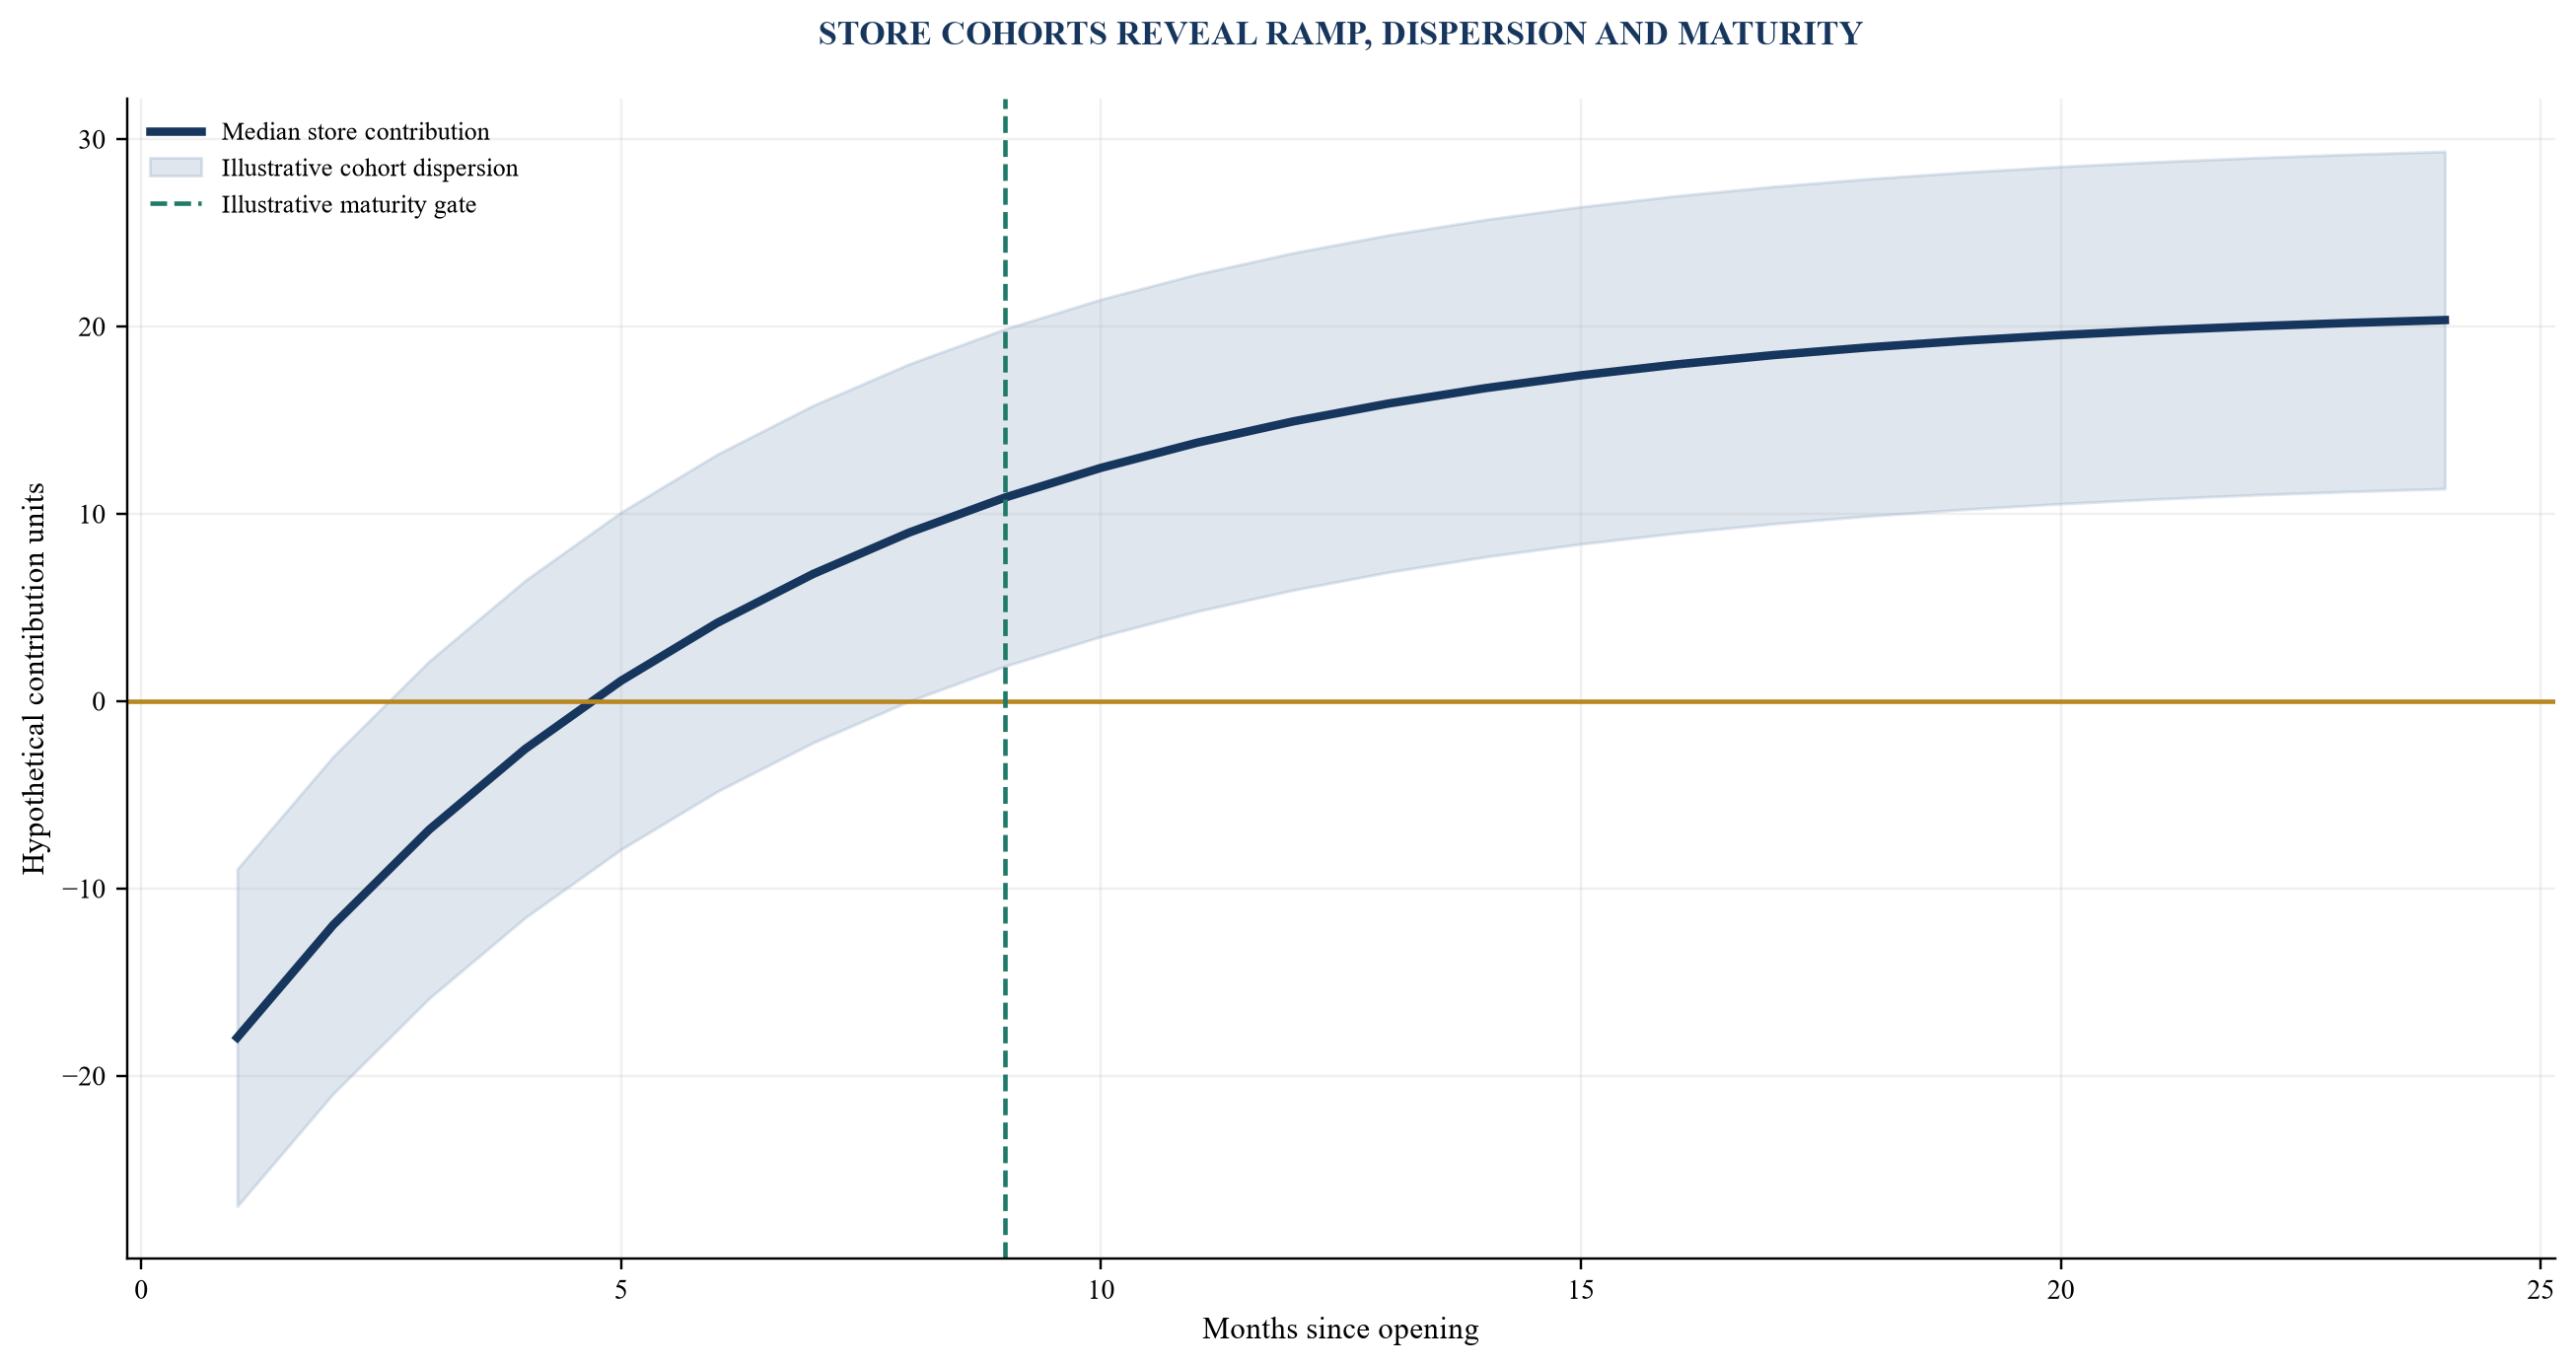
Values are hypothetical analytical assumptions and do not represent a company forecast.
5. Make payback a cash measure
Payback should measure the time required for cumulative store cash contribution to recover all incremental cash invested. The opening investment includes fit-out, equipment, deposits, pre-opening payroll, launch marketing, technology, licences and opening inventory. It should also include central capacity added specifically for the expansion, such as warehouse space or a regional team.
Accounting profit can diverge from payback. Lease accounting, depreciation, supplier terms, capitalised costs and inventory build affect timing. A store may report positive earnings before it returns its opening cash. Conversely, a supplier-funded opening stock position can improve early cash while creating a later payment obligation. The model should show both economic contribution and cash movements.
Closure and salvage should be modelled. Fit-out may have little recovery value; lease exit may require payments; deposits can be delayed; stock can be transferred or marked down. A decision rule based only on successful stores creates survivorship bias. Closed, relocated and reformatted stores remain in the cohort record with their full cash outcome.
The payback gate should use observed mature cohorts and a downside case. Management may approve a longer payback for a strategic flagship or a city-entry store, but that exception should be explicit and separately funded. Routine rollout capital should depend on a standard format producing an acceptable cash recovery across a sufficiently broad sample.
6. Treat inventory as invested cash
Inventory is often the largest expansion cash requirement and the least reliable asset in a high-growth retail model. The general ledger can show stock at cost while commercial value varies by age, season, fashion, location, damage, return rights and markdown requirements. Ind AS 2 requires measurement at the lower of cost and net realisable value and recognises write-downs when expected selling value after completion and selling costs falls below cost.[5]
The operating model should calculate average inventory consistently and report turns as cost of goods sold divided by average inventory for the same period. Days inventory outstanding provides an alternative expression. Both require careful treatment of goods in transit, consignment, customer returns, vendor returns and stock held for new openings. A network-wide average can hide slow categories or stranded city stock.
Ageing should be based on the most decision-relevant clock, normally receipt date or season, and should survive inter-store transfers. Moving an old item to a new store must not reset its age. Stock status should identify available, reserved, damaged, returned, in transit, quarantined and written off. Cycle counts and periodic physical counts should reconcile system quantities to observed stock.
Growth capital should fund saleable inventory aligned with the store ramp. Opening buys can be staged, replenishment can follow sell-through and slow stock can trigger markdown or transfer. A board should challenge minimum-order quantities, vendor concentration, lead times, currency exposure and return rights. Inventory discipline protects both cash and customer availability.
Table 2. Inventory productivity and control measures
| Measure | Calculation or evidence | Risk revealed | Capital response |
|---|---|---|---|
| inventory turns | cost of goods sold divided by consistent average inventory | cash trapped in stock | cap opening buy and replenish by sell-through |
| age profile | cost and units by receipt age, category and location | obsolescence and markdown | exclude or haircut old stock in funding plan |
| sell-through | units sold divided by units available for the defined period | range acceptance | shift assortment and reorder policy |
| stock accuracy | counted quantity versus system quantity | shrinkage and data weakness | require cycle-count remediation |
| net realisable value | expected selling price less completion and selling costs | accounting and recovery shortfall | recognise write-down and lower capital attribution |
Thresholds should be calibrated to verified category history and accounting policy.
7. Separate turns, availability and margin
Fast inventory turns are not automatically attractive. A low-margin product can turn rapidly while contributing little cash after fulfilment. A high-margin product can turn slowly yet remain valuable if demand is predictable and markdown risk is limited. The board should examine the joint distribution of turn, gross margin, availability and working capital by category.
A useful category matrix has four quadrants. High-turn, high-margin items are core replenishment candidates. High-turn, low-margin items require procurement, pricing or basket analysis. Low-turn, high-margin items require demand and range review. Low-turn, low-margin items are exit or markdown candidates unless they serve a documented strategic role. The matrix should use realised margin after discounts and returns.
Availability matters because excessive inventory reduction can create lost sales and weaken customer trust. The model should track in-stock rate for priority items, demand lost to stock-outs, substitution and fulfilment delay. Safety stock should be derived from demand variability, lead time and service target, with explicit treatment of supplier reliability and city-level replenishment time.
The expansion plan should identify where additional stores improve inventory pooling and where they fragment stock. A regional hub may reduce lead time and increase availability, while too many store-specific assortments can increase stranded stock. Capital should fund the logistics design required for the network rather than assume the current warehouse can absorb growth indefinitely.
8. Reconcile purchase obligations with inventory
Recorded inventory shows goods already received or recognised. Purchase orders and supplier commitments show cash that may arrive later. A retailer can appear liquid while having placed large seasonal orders, opened letters of credit or accepted minimum-volume obligations. The funding model should include open orders, deposits, import duties, freight, taxes and expected payment dates.
Supplier terms should be analysed by vendor, category and currency. Extended terms can support growth but may incorporate higher prices, security, guarantees or termination rights. Early-payment discounts can create an attractive return on cash where the retailer has liquidity. Delayed payment that breaches agreed terms can damage supply continuity and should not be treated as a financing strategy.
The stock plan should bridge beginning inventory, receipts, sales at cost, transfers, write-offs and ending inventory by month. The cash plan should separately show order date, deposit, shipment, customs, receipt and supplier payment. This exposes the gap between inventory accounting and liquidity. It also reveals the capital effect of faster or slower lead times.
Investors should test downside obligations if stores open late, demand is weaker or imports are delayed. Committed goods may arrive even when the rollout pauses. Cancellation rights, vendor returns and resale channels therefore belong in diligence. Milestone funding can reserve cash for unavoidable commitments while stopping discretionary new orders.
9. Score cities using observed evidence
A city scorecard should convert the expansion thesis into measurable evidence. Demand variables can include existing ecommerce orders, customer enquiries, loyalty members, website traffic, delivery economics, category search, competitor presence and local household consumption. Supply variables include rent, store availability, labour, logistics, utilities, permits and vendor service. The scorecard should preserve source, date and confidence for each input.
Official household consumption data provides a national and state context. The HCES 2023-24 factsheet estimated urban average monthly per-capita consumption expenditure above rural expenditure and reported different food and non-food shares.[1] These aggregates should not be applied mechanically to a catchment. The retailer should test its own price point, category and customer density through observed orders, pop-ups, concessions, partnerships or controlled marketing experiments.
Weights should reflect the business model. A premium discretionary retailer may weight target-customer density, destination retail and brand adjacency heavily. A value retailer may weight catchment population, rent and replenishment cost. A bulky-goods format may weight logistics and parking. The board should approve the weights before reviewing final rankings to reduce outcome-driven scoring.
A score is a screening device. Site-level diligence remains necessary. Two sites in the same city can have different footfall quality, visibility, access, lease economics and competitor proximity. The investment memo should show both city and site decisions, including rejected alternatives and sensitivity to key assumptions.
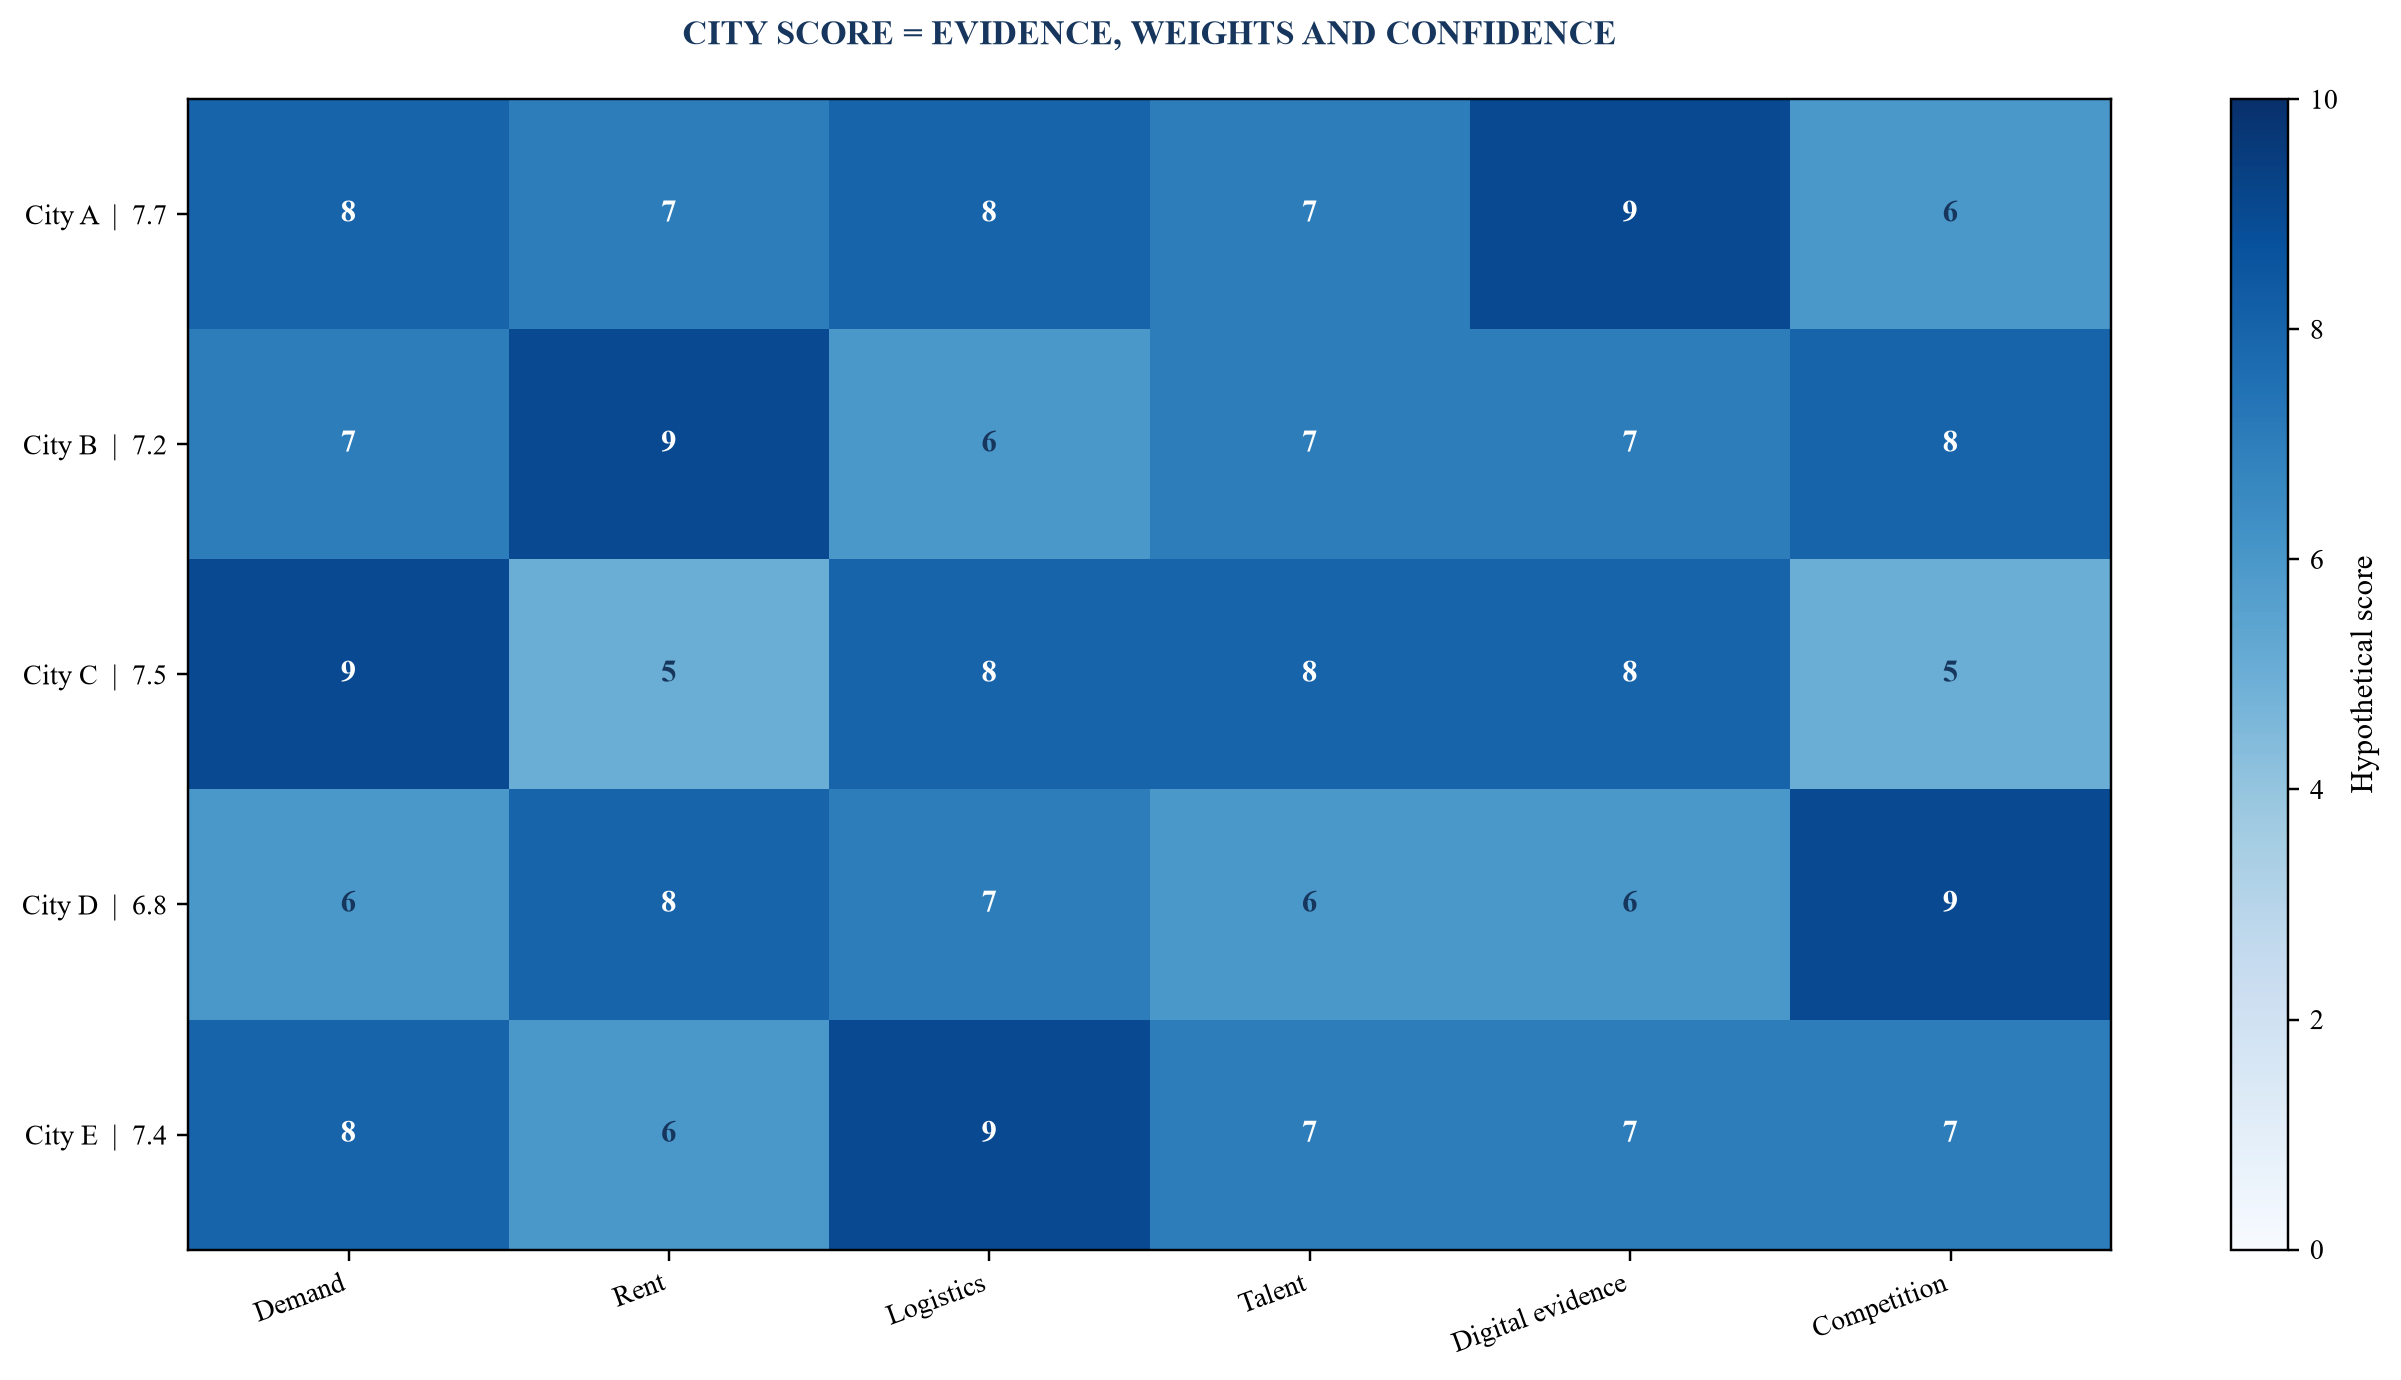
Scores and weights are hypothetical analytical assumptions and must be replaced with verified evidence.
10. Use digital demand as a test, not a promise
Digital channels can reveal demand before a store opens. Orders, repeat rates, delivery addresses, returns, category mix and acquisition costs can show whether a city already supports the proposition. NPCI's UPI statistics demonstrate the national scale of digital payments, with more than 22.7 billion transactions reported for June 2026.[3] Payment availability supports measurement; it does not establish profitable local demand.
The evidence should distinguish organic demand from paid acquisition and marketplace exposure. A city may show high online orders because a marketplace subsidises visibility or shipping. A store may improve conversion, pickup and returns while shifting transactions that would have occurred online. The incremental effect must be estimated rather than counting all local digital sales as new-store revenue.
Controlled tests can include geo-targeted marketing, temporary pop-ups, shop-in-shop formats, appointment events and local delivery offers. Each test should have a pre-defined decision rule, clean tracking and a comparison group where feasible. Results should include acquisition cost, first-order margin, repeat behaviour, return rate and fulfilment cost.
Privacy and consent requirements apply to customer data. The diligence team should review collection purpose, notices, access, retention, security and vendor arrangements under applicable Indian law and contracts.[17][18] City decisions should use aggregated, governed analysis rather than uncontrolled sharing of identifiable customer records.
11. Attribute omnichannel value consistently
A customer may discover a product online, inspect it in a store, purchase through an app and return it to another location. Channel-level revenue can therefore misstate the store's economic role. The retailer needs an attribution policy that is stable, understandable and suitable for decisions. The policy should show both direct transactions and assisted or influenced demand.
Useful measures include store-originated sales, local online sales, click-and-collect, ship-from-store, returns processed, new-customer acquisition, repeat behaviour and fulfilment savings. Each metric should have a defined attribution window and location rule. Double counting should be prevented. The board should see performance under more than one reasonable attribution approach where the result is sensitive.
Store contribution should also reflect omnichannel costs. A location that fulfils online orders consumes labour, packaging and inventory. A location handling returns can protect customer value while creating processing and markdown cost. Transfer pricing between channel profit centres should not obscure the consolidated cash outcome.
Capital allocation can recognise strategic store roles without abandoning discipline. A showroom, pickup hub or service centre may have lower direct revenue but measurable network benefits. Those benefits should be evidenced through experiments and customer behaviour. A vague halo effect is unsuitable for an investment case.
12. Model rent as a complete occupancy obligation
Headline rent is only one component of occupancy. The model should include common-area charges, taxes, deposits, escalation, turnover rent, utilities, insurance, fit-out contribution, restoration, registration and renewal. Rent-free periods improve early cash but can conceal the steady-state burden. Lease incentives should be spread consistently for economic comparison.
Ind AS 116 addresses recognition and measurement of lease liabilities and right-of-use assets for lessees.[6] Qualified advisers should determine the accounting treatment. For capital decisions, the board should view contractual cash payments, accounting expense and economic occupancy separately. The store payback model needs the actual cash schedule.
Lease flexibility has option value. Break rights, assignment, subletting, contraction, expansion and exclusivity can change downside recovery. A lower rent with a long inflexible term may be less attractive than a higher rent with an executable break. The analysis should include security deposits, guarantees and conditions attached to exit.
Site approval should occur after legal and technical diligence. Permitted use, licences, fire and safety requirements, signage, power, access, fit-out approvals and handover condition can affect opening date and capex. Delays consume pre-opening cost and can strand inventory. Milestone capital should require a complete site checklist before irreversible spending.
13. Build capex from quantities and responsibilities
Store capex should be built from a bill of quantities rather than a benchmark multiplied by area. The estimate should identify civil works, mechanical and electrical systems, fixtures, technology, security, signage, professional fees, permits, contingency, pre-opening cost and landlord contribution. It should state who owns each asset and who bears overruns.
Benchmarking remains useful. Comparable completed stores can show cost per square foot, duration, change orders and contractor performance. Differences should be explained by format, building condition, city, materials and scope. Inflation and lead-time assumptions should be dated and sourced. Founder-supplied forecasts should be labelled as management estimates until contracted.
Payment terms influence cash risk. Deposits, progress payments, retention and performance security should align with verified work. Related-party contractors or landlord arrangements require conflict review. The company should maintain tender records, approvals, variation orders and completion evidence.
Reusable fixtures and modular design can improve downside recovery and speed. Standardisation can also reduce local relevance if applied mechanically. The rollout model should identify which elements are fixed, which adapt to the site and which are experimental. Capital release can follow design approval, executed lease, contractor appointment, verified progress and opening readiness.
Table 3. Store investment and cash-payback bridge
| Investment or cash item | Hypothetical amount | Evidence gate | Payback treatment |
|---|---|---|---|
| fit-out and equipment | 48 | approved bill, tender and progress certification | opening cash investment |
| deposits and pre-opening | 14 | lease, permits, payroll and launch plan | opening cash investment |
| opening saleable inventory | 30 | SKU plan, purchase orders and ageing policy | working-capital investment |
| central capacity allocation | 8 | incremental warehouse and team evidence | network growth investment |
| total opening cash | 100 | all gates completed | denominator for cash recovery |
| mature annual cash contribution | 34 | observed comparable cohort | hypothetical payback input |
Values are hypothetical analytical assumptions in currency units and do not represent a forecast or proposed investment.
14. Design a format portfolio rather than one average store
Retailers often operate flagships, standard stores, compact stores, kiosks, concessions and digital fulfilment points. Each format has different demand capture, capex, occupancy, assortment and staffing. A network average can conceal whether the proposed format is proven. The cohort analysis should therefore separate format and size.
The board should define the job of each format. A flagship may build brand and carry the full range. A compact store may prioritise proven categories and rapid payback. A concession may provide lower-risk demand testing with less control. A fulfilment point may improve delivery economics. Format choice should follow city evidence and customer mission.
Pilot status should be explicit. A new format needs a limited test budget, learning agenda and stop rule. It should not be included in the same rollout multiple as a mature format until it passes contribution, inventory and customer gates. Capital providers can fund discovery separately from replication.
Standard operating procedures should adapt to format while preserving control. Opening and closing, cash, refunds, stock counts, discounts, transfers, customer data and health and safety require documented ownership. A smaller footprint is not inherently simpler if it relies on frequent replenishment and more precise assortment.
15. Plan people before stores
Store growth creates demand for managers, frontline staff, trainers, merchandisers, loss-prevention specialists, finance controllers and regional leaders. Recruitment after leases are signed can delay openings or weaken service. The capital plan should include workforce capacity by opening wave and city.
The people model should measure time to hire, training completion, early attrition, productivity, span of control and manager bench strength. Store economics should include realistic wages, incentives, benefits, recruitment and training. A low assumed labour cost may disappear when the company needs experienced managers in a new market.
Leadership capacity is a gating variable. A founder and central team that successfully managed ten stores may not have the systems or delegation for fifty. Regional management, internal audit, merchandise planning and treasury may need to be built before the next wave. The board should fund these capabilities as part of growth rather than treat them as overhead leakage.
Incentives should align with quality of growth. Sales-only targets can encourage excessive discounting, stock transfers or weak return control. Balanced measures can include contribution, stock accuracy, shrinkage, customer outcomes, compliance and team retention. The design should be reviewed for applicable employment and tax requirements.
16. Protect cash through the opening wave
The monthly cash model should combine store capex, deposits, inventory, supplier payments, pre-opening cost, operating losses, tax, debt service and central capacity. It should reflect the actual opening schedule and procurement lead times. A single annual funding number can hide a cash trough between inventory purchase and store maturity.
The base case should be accompanied by delay, demand, margin and inventory stresses. Openings may slip while rent, payroll and committed orders continue. Sales may ramp more slowly, gross margin may compress and stock may require markdown. The model should show minimum liquidity and the actions available before cash reaches that point.
Actions have lead times. Slowing new leases can be immediate; cancelling inventory may be contractually difficult; reducing staff can harm operations and involve legal obligations; raising new equity can take months. A contingency plan should rank actions by cash effect, execution time and long-term damage.
The company should maintain a thirteen-week cash forecast during rapid rollout, reconciled to bank accounts and purchase commitments. Forecast accuracy should be measured. Variances need owners and explanations. Investors can condition later tranches on accuracy and minimum liquidity.
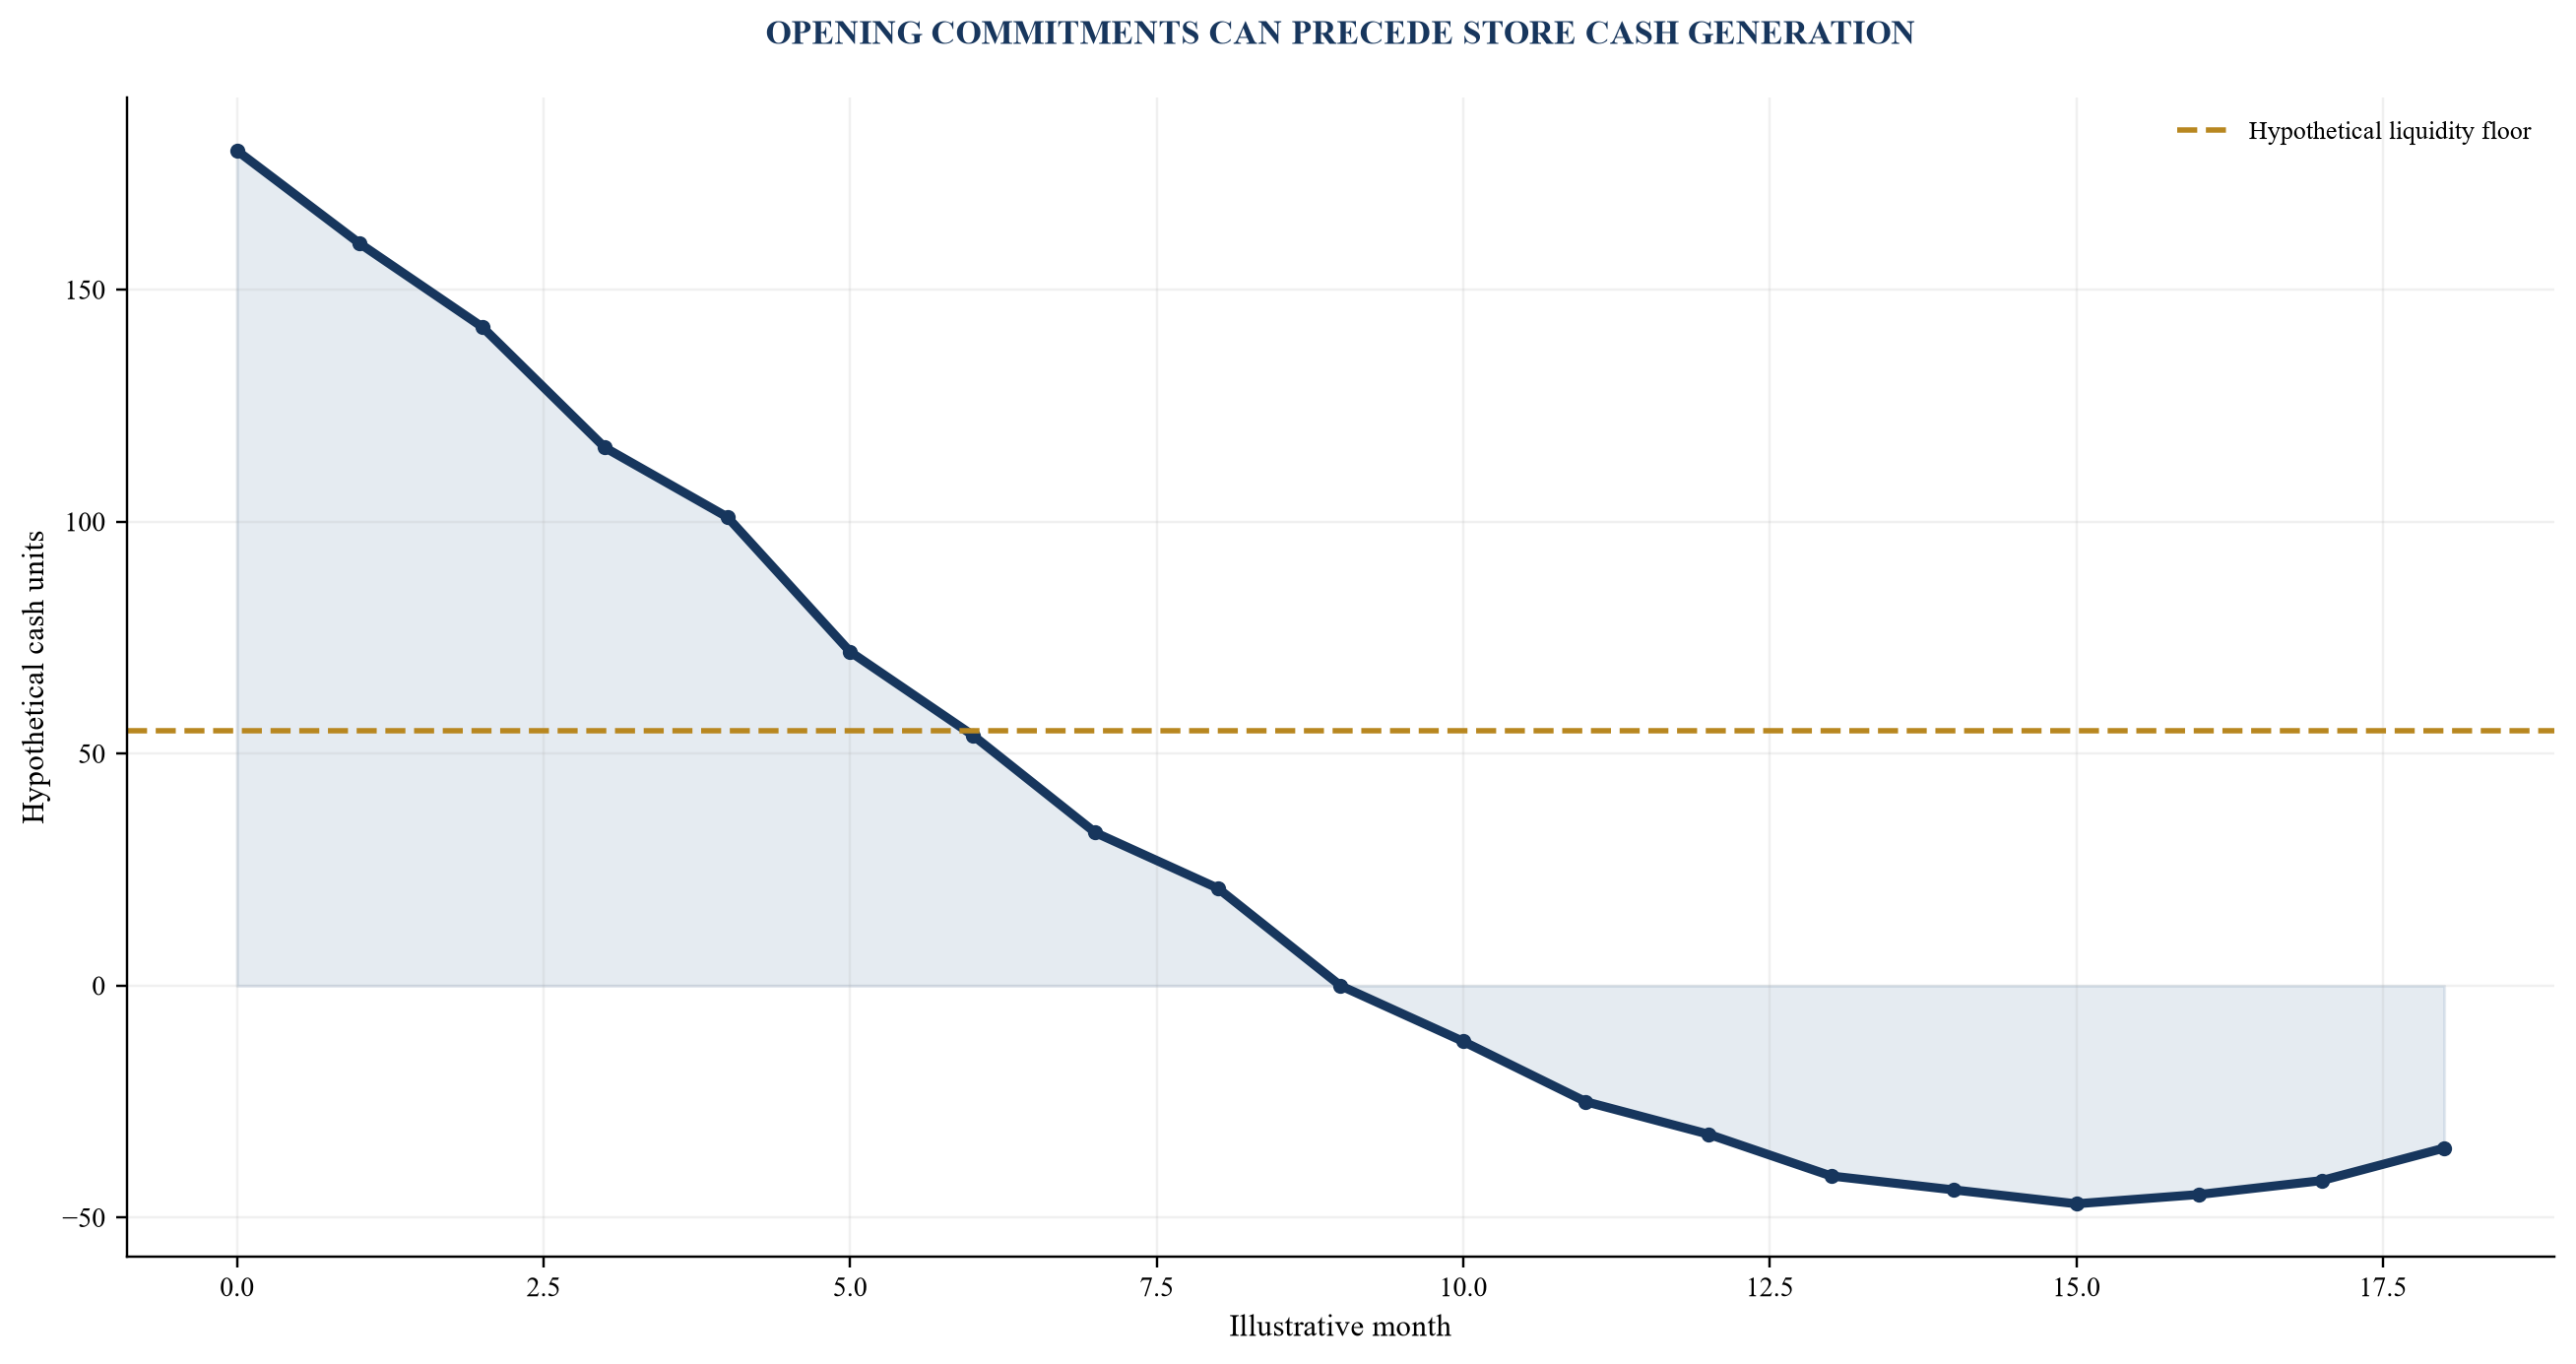
Values are hypothetical analytical assumptions used to illustrate timing and liquidity gates.
17. Match the instrument to the risk
Equity is appropriate for uncertain growth, new formats, brand investment and capability build because repayment does not depend on a fixed near-term schedule. Working-capital facilities can support verified receivables or inventory once controls and cash conversion are stable. Equipment or lease-linked finance may suit identifiable assets. The complete capital stack should reflect downside cash capacity and legal priority.
The board should reconcile all debt-like obligations, including bank loans, leases, supplier finance, marketplace advances, guarantees and shareholder loans. Labels do not determine economic burden. Fixed payments, cash sweeps, covenants, security and priority can constrain expansion even when an instrument is described as operational.
Growth equity terms should be evaluated alongside price. Governance, reserved matters, liquidation preference, anti-dilution, information rights, founder vesting, exit rights and future financing provisions affect control and outcomes. The company should model reasonable downside and follow-on scenarios with qualified legal and tax advice.
Capital should provide enough runway to reach the next evidence milestone under a downside case. A small round that funds openings without central capacity or working capital can increase financing risk. An oversized round can weaken discipline. The milestone architecture connects amount to a defined proof point.
18. Release capital through observable milestones
Milestone funding divides the programme into decision stages. The first stage can fund data remediation, a limited pilot and central capabilities. The second can fund replication after mature cohorts pass contribution and payback gates. Later stages can fund new regions after city-level demand and operating capacity are verified.
Each gate should be observable, time-bounded and within reasonable management influence. A vague target such as strong growth creates dispute. A gate can specify a minimum number of mature stores, a proportion above contribution threshold, inventory-age limits, forecast accuracy, liquidity, executed sites and governance hires. Definitions should be agreed before funding.
The company needs flexibility for external shocks. A cure period, waiver process and board discretion can address temporary events while preserving accountability. The documentation should distinguish a pause in new expansion from a default affecting the existing business. Legal advice is required for enforceability and investor rights.
Milestones also protect management. Founders can demonstrate value before issuing the full amount of equity. Investors obtain information and control without managing daily operations. The shared model reduces debate because both parties use the same definitions and evidence.
Table 4. Hypothetical milestone-equity architecture
| Stage | Use of funds | Evidence gate for next release | Illustrative response to a miss |
|---|---|---|---|
| foundation | data, controls, leadership and limited pilots | reconciled data and approved cohort baseline | extend remediation; defer rollout |
| replicate | proven-format stores and working capital | mature contribution, payback and stock-age gates | pause new leases; correct economics |
| regionalise | city clusters, logistics and regional team | city score, site readiness and service levels | narrow geography; revise hub plan |
| accelerate | larger network and brand investment | forecast accuracy, liquidity and governance | reduce wave size; preserve cash |
| follow-on | selective formats and adjacent categories | separate pilot evidence and board approval | retain experiment status |
Amounts and thresholds are hypothetical analytical assumptions and require transaction-specific negotiation.
19. Establish governance before acceleration
Rapid store growth increases the number of leases, vendors, employees, cash points, stock movements and local decisions. Governance should scale before the network. The board needs an approved expansion policy, delegated authorities, investment committee process, related-party policy, data definitions and exception reporting.
Reserved matters can cover new cities, leases above thresholds, capex overruns, debt, guarantees, related parties, acquisitions and changes to accounting policy. The thresholds should permit normal operations while protecting material capital decisions. Minutes should record evidence, assumptions, dissent and conditions.
Management reporting should combine commercial and financial measures. A weekly rollout dashboard can show site milestones, capex, staffing, inventory and risks. A monthly investment dashboard can show cohort economics, cash, liquidity, stock ageing and forecast variance. Quarterly strategy review can examine city portfolio, format learning and capital allocation.
Internal audit or independent review becomes valuable when store count, system complexity or investor requirements increase. Scope can include inventory, cash, refunds, procurement, leases, related parties, data access and cyber controls. Findings should have owners and deadlines. The purpose is to maintain confidence in the evidence supporting continued capital release.
20. Control shrinkage, returns and markdowns
Shrinkage converts inventory investment into loss and can indicate process, fraud or data weaknesses. It should be measured by store, category, reason and cohort using physical counts. A low reported rate is not credible when counts are infrequent or adjustments are delayed. The board should view stock accuracy and count completion alongside shrinkage.
Returns affect revenue, margin, inventory condition and cash. Policies should distinguish customer rights, discretionary service, fraud and product defects. Returned stock should be inspected and assigned a saleable status promptly. Refund settlements should reconcile to original transactions and payment rails.
Markdown governance should preserve commercial speed while preventing hidden margin erosion. The merchandise team can use approved ladders by age and season, with exceptions logged. Realised margin should incorporate markdown and return outcomes. Buying decisions should be reviewed against final recovery, not initial ticket price.
Expansion capital can include a loss reserve calibrated to verified history, but reserves should not normalise weak control. A spike beyond tolerance should pause new stock deployment until causes are identified. Corrective actions may include assortment change, security, training, vendor recovery, transfer or clearance.
21. Test legal, tax and regulatory readiness by city
Retail expansion can involve entity registrations, goods and services tax, shops and establishments requirements, labour, trade licences, fire and safety, weights and measures, consumer protection, food or product-specific licences, signage and local permissions. The exact requirements depend on location, format and category. Qualified advisers should maintain a city and site checklist.
India's foreign direct investment policy distinguishes marketplace and inventory-based ecommerce models and provides sector-specific conditions relevant to retail structures.[7][8] A company with foreign investment should obtain transaction-specific advice on its business model, entity, product and channel. The legal form should match actual operations and books.
Tax and invoice controls should connect product classification, rate, place of supply, discount, return, credit note and input credit. CBIC publishes GST legislation and invoice rules.[9][10] The operating system should apply approved tax logic and retain evidence. A new city can add registrations, warehouses or inter-state movements that change workflows.
Compliance readiness is a funding gate because delay can consume rent and payroll, and non-compliance can threaten operations or reputation. The board should receive a signed readiness certificate from accountable management and advisers before opening. Open items should have risk acceptance and contingency.
22. Protect systems and customer trust
Retail growth increases endpoints, users, vendors and data flows. Point-of-sale devices, store networks, ecommerce, loyalty, warehouse systems and payment integrations create a broad attack surface. A new-store checklist should cover device configuration, access, patching, encryption, backups, logging, incident response and vendor support.
Payment-card handling should follow applicable contracts and security standards. UPI and other payment rails provide extensive transaction capability, while the retailer remains responsible for its own integrations, reconciliation and customer communication. Payment failure, duplicate charge or refund delay can damage trust even when the external rail operates correctly.
India's Digital Personal Data Protection Act 2023 establishes obligations concerning digital personal data, subject to commencement and applicable rules.[17] The Digital Personal Data Protection Rules 2025 provide additional implementation detail.[18] The company should obtain current legal advice, map personal data, assign access and retain only what is justified.
Cyber and privacy readiness should be tested before rapid rollout. Incident simulations can include payment outage, ransomware, credential theft, customer-data exposure and third-party failure. Capital should include security capacity and insurance analysis where appropriate. A growth model that depends on fragile systems carries an unpriced liability.
23. Value the business through evidence, not store count
Store count is an operating statistic. Value depends on durable cash generation, reinvestment requirements, growth opportunity, risk and capital structure. A retailer adding stores rapidly can destroy value if each opening consumes more cash than it returns. The valuation should therefore connect cohort economics and future rollout to free cash flow.
A discounted cash-flow case can model existing mature stores, immature stores and future openings separately. Mature stores use observed contribution and maintenance needs. Immature stores use their current cohort position and verified ramp evidence. Future openings use a risk-adjusted rollout with city, capex, inventory and central capacity. The terminal case should not assume expansion beyond operational capacity.
Comparable-company multiples can provide a market reference but require careful normalisation for category, channel, growth, margin, lease treatment, geography and maturity. Enterprise value to sales can reward unprofitable growth if used without unit economics. Enterprise value to earnings can penalise a company investing ahead of growth or obscure working-capital needs. Multiple methods and sensitivities are preferable.
The financing round should include a sources-and-uses bridge, dilution analysis and follow-on requirements. Value creation can be decomposed into mature-store improvement, successful new stores, inventory productivity, central operating leverage and lower risk from governance. This gives the board a measurable post-investment plan.
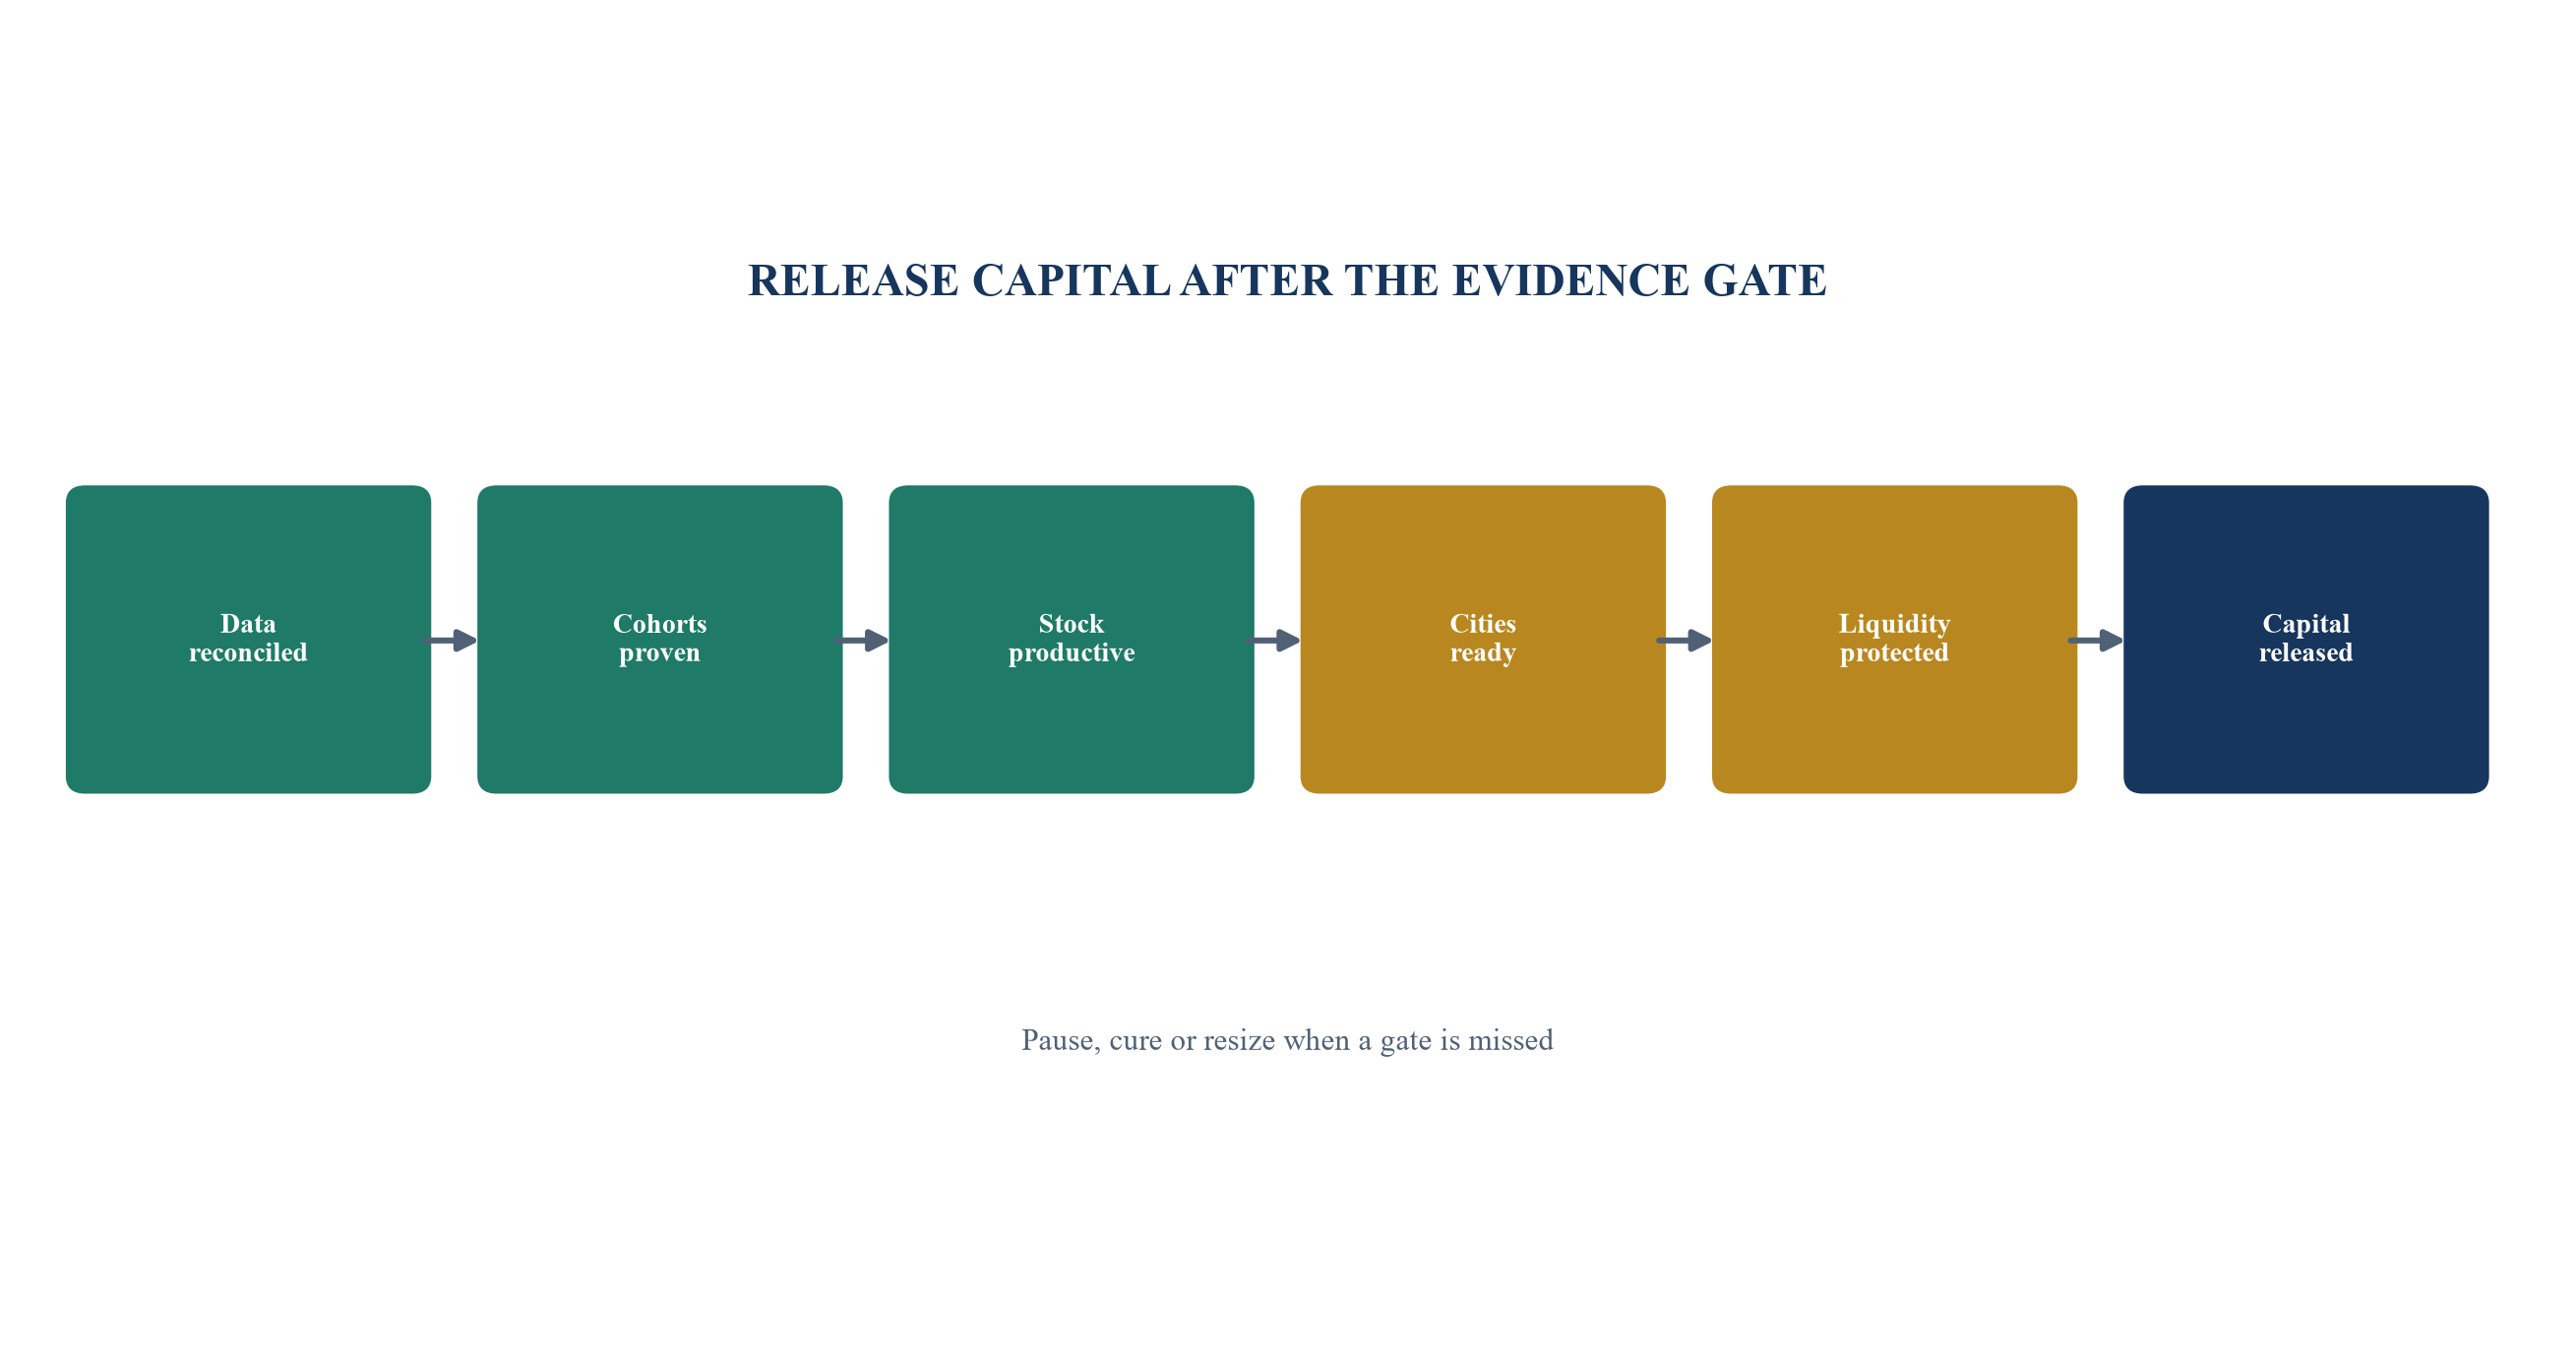
Thresholds and outcomes are hypothetical; actual gates require verified company evidence and negotiated documents.
24. Execute through a disciplined one-hundred-day programme
The first hundred days should establish the evidence and decision system before a large opening wave. The company begins by freezing definitions, mapping sources and reconciling sales, inventory and cash. It then rebuilds store cohorts, validates city demand, reviews sites and establishes governance. Capital decisions follow the verified baseline.
Workstreams should have named owners from finance, retail operations, merchandise, supply chain, technology, people and legal. An investor or adviser can coordinate the programme, while management remains accountable for records and decisions. Weekly issue logs should distinguish missing evidence, policy decisions and operational remediation.
The programme should deliver usable controls rather than a one-time diligence book. The data model, cohort dashboard, inventory ageing, city scorecard, cash forecast and approval workflow should continue after closing. Automation can reduce manual effort once definitions and reconciliations are stable.
Success is evidenced by decision quality. The board can identify which stores create cash, which stock is saleable, which cities have measured demand, how much liquidity remains and what condition governs the next capital release. The system should also make a stop decision possible before committed cost grows.
Table 5. One-hundred-day retail expansion programme
| Period | Primary work | Required output | Capital implication |
|---|---|---|---|
| days 1-20 | perimeter, definitions and source mapping | reconciled entity, store, SKU, transaction and cash map | hold discretionary rollout |
| days 21-40 | cohort and inventory reconstruction | mature-store curve, margin bridge, ageing and turns | identify proven format and stock needs |
| days 41-60 | city, site and people readiness | weighted city score, site checklist and leadership capacity | approve limited opening wave |
| days 61-80 | cash, downside and transaction design | thirteen-week cash, multi-year case and milestone terms | size first and reserved tranches |
| days 81-100 | governance and parallel run | board dashboard, authorities, controls and reporting cadence | release capital after verified gates |
Timing is illustrative and should be adapted to data quality, transaction timetable and operating complexity.
25. Apply a board decision checklist
The board should approve expansion only when the proposition, evidence and funding are aligned. The decision memo should state the customer, format, cities, sites, number and timing of openings, total cash requirement, instrument, liquidity floor and next milestone. It should identify every material assumption and evidence owner.
The operating case should show mature and immature cohorts separately, full store contribution, cash payback, format dispersion, cannibalisation and closure outcomes. The inventory case should show turns, ageing, sell-through, availability, stock accuracy, purchase commitments and downside recovery. The city case should show weights, sources, confidence, experiments and site alternatives.
The financial case should include capex quantities, working capital, supplier payments, lease cash, central capacity, taxes, debt service and stress scenarios. The governance case should include delegated authorities, reserved matters, reporting, audit, cyber, privacy and compliance readiness. The transaction case should include amount, tranches, terms, dilution and follow-on need.
A final red-team review should ask what must be true for the investment to work, what evidence could disprove it, how quickly management would know and which actions remain available. Approval conditions should be written into the execution plan. Growth capital then becomes a controlled sequence of experiments and replication rather than a one-time bet on aggregate market growth.
References
- Ministry of Statistics and Programme Implementation, Government of India. Household Consumption Expenditure Survey 2023-24: Fact Sheet. https://www.mospi.gov.in/sites/default/files/publication_reports/HCES%20FactSheet%202023-24.pdf
- Ministry of Statistics and Programme Implementation, Government of India. Household Consumption Expenditure Survey 2023-24: Final Report. https://www.mospi.gov.in/sites/default/files/publication_reports/Final_Report_HCES_2023-24L.pdf
- National Payments Corporation of India. UPI Product Statistics. https://www.npci.org.in/product/upi/product-statistics
- National Payments Corporation of India. Unified Payments Interface: Product Overview. https://www.npci.org.in/product/upi
- Ministry of Corporate Affairs, Government of India. Indian Accounting Standard 2: Inventories. https://www.mca.gov.in/Ministry/pdf/INDAS2.pdf
- Ministry of Corporate Affairs, Government of India. Indian Accounting Standard 116: Leases. https://www.mca.gov.in/Ministry/pdf/IndAS116_2020_10112020.pdf
- Department for Promotion of Industry and Internal Trade, Government of India. Consolidated FDI Policy. https://www.dpiit.gov.in/static/uploads/2025/07/3ab2ec2a3bdb91c69653b7c34618c14a.pdf
- Department for Promotion of Industry and Internal Trade, Government of India. Foreign Direct Investment Policy portal. https://www.dpiit.gov.in/documents/acts-and-policies/foreign-direct-investment-policy-cDNwATNtQWa?pageTitle=Foreign-Direct-Investment-Policy
- Central Board of Indirect Taxes and Customs, Government of India. Central Goods and Services Tax Act. https://cbic-gst.gov.in/CGST-bill-e.html
- Central Board of Indirect Taxes and Customs, Government of India. Tax Invoice, Credit and Debit Notes Rules. https://cbic-gst.gov.in/gst-invoice-rules.html
- Reserve Bank of India. Annual Report 2024-25. https://rbi.org.in/scripts/annualreportpublications.aspx
- Reserve Bank of India. Payment and Settlement Systems notifications. https://www.rbi.org.in/scripts/RTGS_Notification.aspx
- Securities and Exchange Board of India. Alternative Investment Funds Regulations, last amended 18 April 2026. https://www.sebi.gov.in/legal/regulations/apr-2026/securities-and-exchange-board-of-india-alternative-investment-funds-regulations-2012-last-amended-on-april-18-2026-_101019.html
- IFRS Foundation. IAS 2 Inventories. https://www.ifrs.org/issued-standards/list-of-standards/ias-2-inventories/
- IFRS Foundation. IFRS 16 Leases. https://www.ifrs.org/issued-standards/list-of-standards/ifrs-16-leases/
- IFRS Foundation. IFRS 15 Revenue from Contracts with Customers. https://www.ifrs.org/issued-standards/list-of-standards/ifrs-15-revenue-from-contracts-with-customers/
- Government of India. Digital Personal Data Protection Act 2023. https://www.meity.gov.in/static/uploads/2024/06/2bf1f0e9f04e6fb4f6f1f3b035f50c1d.pdf
- Ministry of Electronics and Information Technology, Government of India. Digital Personal Data Protection Rules 2025. https://www.meity.gov.in/static/uploads/2025/11/2ff8a0c9c7a3c6d3a1f65a3b0121d236.pdf
- Ministry of Consumer Affairs, Food and Public Distribution, Government of India. Consumer Protection (E-Commerce) Rules 2020. https://consumeraffairs.nic.in/sites/default/files/E%20commerce%20rules.pdf
- Bureau of Indian Standards. Retail service and consumer standards portal. https://www.bis.gov.in/
- Ministry of Statistics and Programme Implementation, Government of India. Periodic Labour Force Survey product portal. https://www.mospi.gov.in/themes/product/69-periodic-labour-force-survey-plfs
- World Bank. India Data. https://data.worldbank.org/country/india
