

1. Define the sustainable-return question
The transaction team should state the purchase price, leverage, investment horizon, operational plan, minimum asset standard and target equity return. The required output is a signed cash-return mandate. Use dated source data and link each material conclusion to retained asset, engineering, financial and contractual evidence [1][2].
Translate the asset assumption into monthly investment, downtime, working-capital, tax, debt and covenant effects. Identify the accountable owner, measurement method, remaining life, dependency, decision date and evidence threshold. Reconcile the engineering workplan, financial statements, fixed-asset register, operating forecast and financing model.
The principal risk is that the team can price the business on EBITDA before defining the investment required to sustain it. Quantify the effect on sustainable free cash flow, revolving-credit availability, leverage, debt-service coverage, minimum liquidity, refinancing and equity value. Show base, catch-up, failure and transition cases with enough buffer for forecast error and execution volatility.
Retain the source, model version, reviewer, technical approval and board response. Compare forecast expenditure, asset condition, availability and cash with realised outcomes; remove unsupported classifications; and assign every exception an owner and deadline.
2. Reconstruct the asset perimeter
The transaction team should reconcile owned, leased, concession, outsourced and customer-funded assets to legal entities and operating sites. The required output is an asset-perimeter certificate. Use dated source data and link each material conclusion to retained asset, engineering, financial and contractual evidence [3][4].
Translate the asset assumption into monthly investment, downtime, working-capital, tax, debt and covenant effects. Identify the accountable owner, measurement method, remaining life, dependency, decision date and evidence threshold. Reconcile the engineering workplan, financial statements, fixed-asset register, operating forecast and financing model.
The principal risk is that material operating assets and obligations can sit outside the headline fixed-asset register. Quantify the effect on sustainable free cash flow, revolving-credit availability, leverage, debt-service coverage, minimum liquidity, refinancing and equity value. Show base, catch-up, failure and transition cases with enough buffer for forecast error and execution volatility.
Retain the source, model version, reviewer, technical approval and board response. Compare forecast expenditure, asset condition, availability and cash with realised outcomes; remove unsupported classifications; and assign every exception an owner and deadline.
3. Reconcile the fixed-asset register
The transaction team should link asset class, location, acquisition date, cost, accumulated depreciation, useful life, condition and responsible owner. The required output is a verified fixed-asset ledger. Use dated source data and link each material conclusion to retained asset, engineering, financial and contractual evidence [3][5].
Translate the asset assumption into monthly investment, downtime, working-capital, tax, debt and covenant effects. Identify the accountable owner, measurement method, remaining life, dependency, decision date and evidence threshold. Reconcile the engineering workplan, financial statements, fixed-asset register, operating forecast and financing model.
The principal risk is that financial records can lack the engineering detail needed to forecast cash replacement. Quantify the effect on sustainable free cash flow, revolving-credit availability, leverage, debt-service coverage, minimum liquidity, refinancing and equity value. Show base, catch-up, failure and transition cases with enough buffer for forecast error and execution volatility.
Retain the source, model version, reviewer, technical approval and board response. Compare forecast expenditure, asset condition, availability and cash with realised outcomes; remove unsupported classifications; and assign every exception an owner and deadline.
4. Map asset age and condition
The transaction team should combine age, utilisation, inspection, failure, service history and remaining-life evidence. The required output is an asset-health heat map. Use dated source data and link each material conclusion to retained asset, engineering, financial and contractual evidence [3][6].
Translate the asset assumption into monthly investment, downtime, working-capital, tax, debt and covenant effects. Identify the accountable owner, measurement method, remaining life, dependency, decision date and evidence threshold. Reconcile the engineering workplan, financial statements, fixed-asset register, operating forecast and financing model.
The principal risk is that straight-line accounting lives can diverge materially from physical consumption and operational risk. Quantify the effect on sustainable free cash flow, revolving-credit availability, leverage, debt-service coverage, minimum liquidity, refinancing and equity value. Show base, catch-up, failure and transition cases with enough buffer for forecast error and execution volatility.
Retain the source, model version, reviewer, technical approval and board response. Compare forecast expenditure, asset condition, availability and cash with realised outcomes; remove unsupported classifications; and assign every exception an owner and deadline.
5. Separate depreciation from cash need
The transaction team should compare accounting depreciation with maintenance, overhaul and replacement expenditure by asset cohort. The required output is a depreciation-to-cash bridge. Use dated source data and link each material conclusion to retained asset, engineering, financial and contractual evidence [3][7].
Translate the asset assumption into monthly investment, downtime, working-capital, tax, debt and covenant effects. Identify the accountable owner, measurement method, remaining life, dependency, decision date and evidence threshold. Reconcile the engineering workplan, financial statements, fixed-asset register, operating forecast and financing model.
The principal risk is that EBITDA can rise while the underlying asset base consumes more cash. Quantify the effect on sustainable free cash flow, revolving-credit availability, leverage, debt-service coverage, minimum liquidity, refinancing and equity value. Show base, catch-up, failure and transition cases with enough buffer for forecast error and execution volatility.
Retain the source, model version, reviewer, technical approval and board response. Compare forecast expenditure, asset condition, availability and cash with realised outcomes; remove unsupported classifications; and assign every exception an owner and deadline.
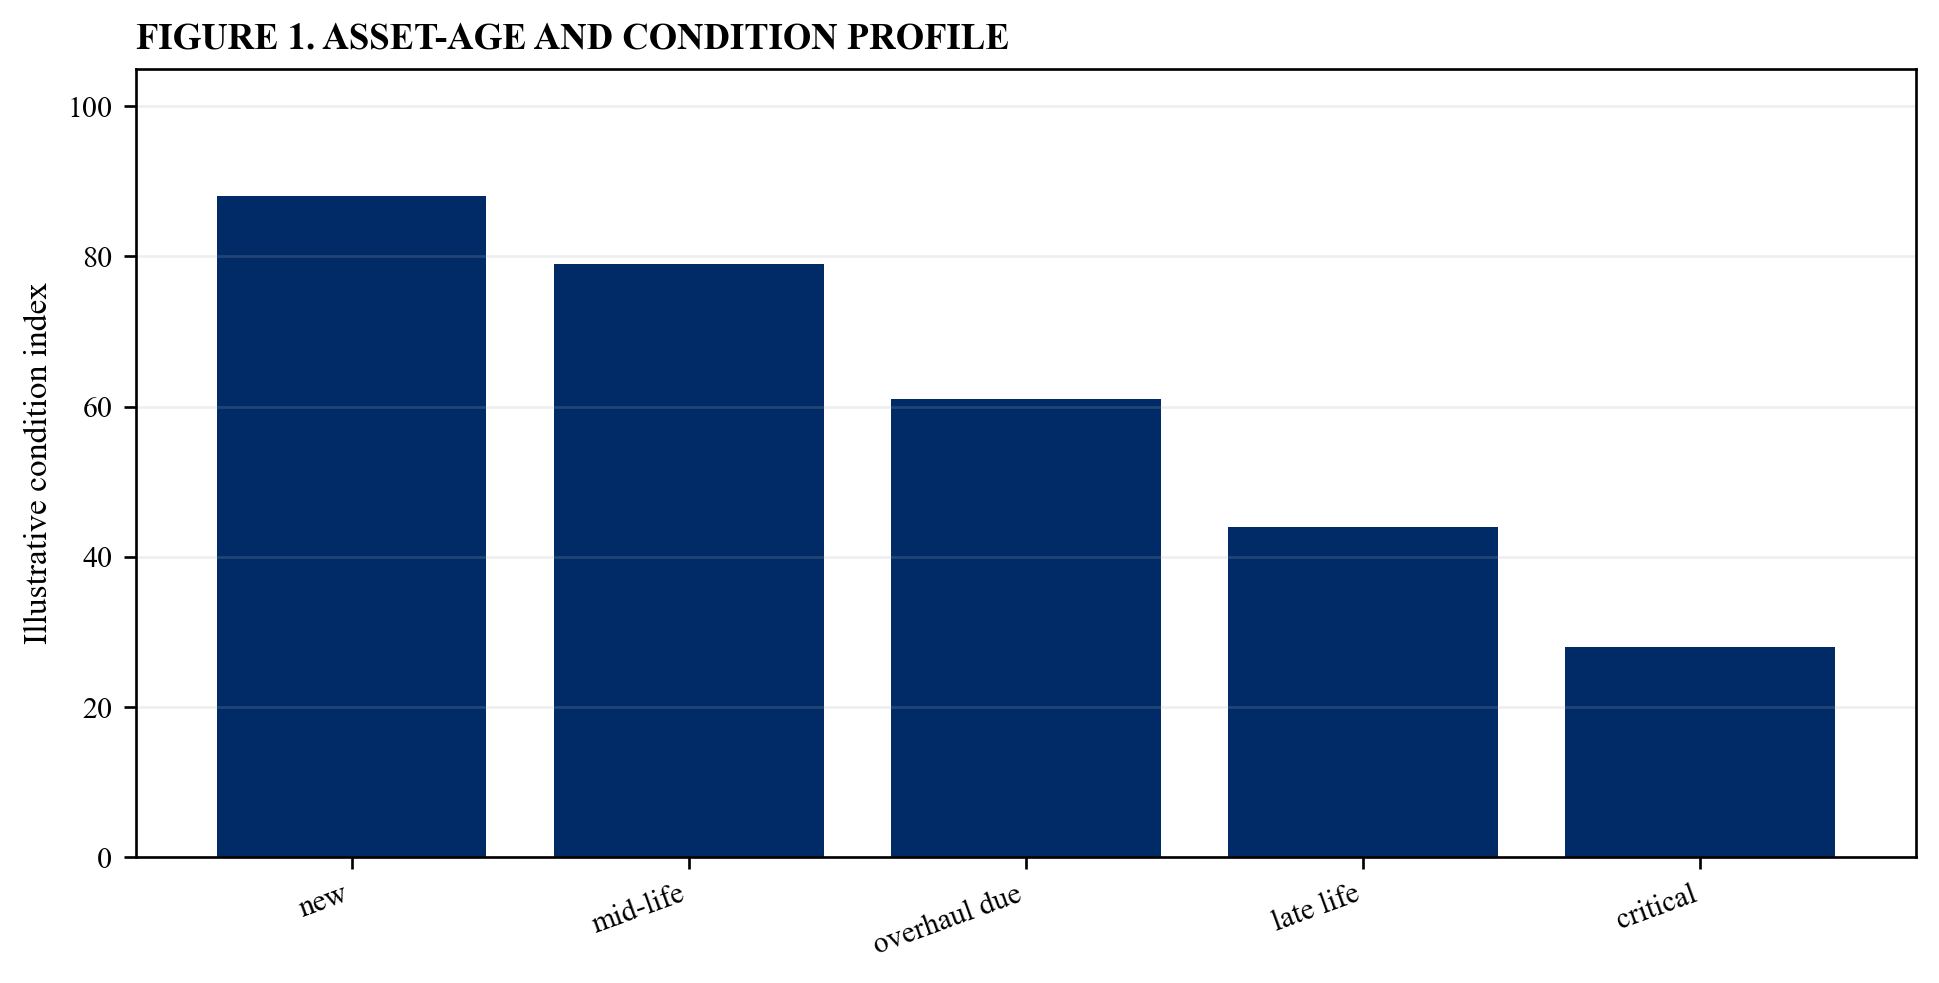
Illustrative analytical scenario; verified asset and transaction evidence should replace index values.
6. Define maintenance capital expenditure
The transaction team should identify expenditure required to preserve current capacity, reliability, safety, quality and licence to operate. The required output is a binding maintenance definition. Use dated source data and link each material conclusion to retained asset, engineering, financial and contractual evidence [2][8].
Translate the asset assumption into monthly investment, downtime, working-capital, tax, debt and covenant effects. Identify the accountable owner, measurement method, remaining life, dependency, decision date and evidence threshold. Reconcile the engineering workplan, financial statements, fixed-asset register, operating forecast and financing model.
The principal risk is that seller and buyer can classify the same necessary spend differently and produce incompatible cash-flow cases. Quantify the effect on sustainable free cash flow, revolving-credit availability, leverage, debt-service coverage, minimum liquidity, refinancing and equity value. Show base, catch-up, failure and transition cases with enough buffer for forecast error and execution volatility.
Retain the source, model version, reviewer, technical approval and board response. Compare forecast expenditure, asset condition, availability and cash with realised outcomes; remove unsupported classifications; and assign every exception an owner and deadline.
7. Separate growth capital expenditure
The transaction team should require capacity, revenue, margin, timing and incremental working-capital evidence for expansion spend. The required output is a growth-investment register. Use dated source data and link each material conclusion to retained asset, engineering, financial and contractual evidence [8][9].
Translate the asset assumption into monthly investment, downtime, working-capital, tax, debt and covenant effects. Identify the accountable owner, measurement method, remaining life, dependency, decision date and evidence threshold. Reconcile the engineering workplan, financial statements, fixed-asset register, operating forecast and financing model.
The principal risk is that necessary replacement can be labelled growth and excluded from sustainable free cash flow. Quantify the effect on sustainable free cash flow, revolving-credit availability, leverage, debt-service coverage, minimum liquidity, refinancing and equity value. Show base, catch-up, failure and transition cases with enough buffer for forecast error and execution volatility.
Retain the source, model version, reviewer, technical approval and board response. Compare forecast expenditure, asset condition, availability and cash with realised outcomes; remove unsupported classifications; and assign every exception an owner and deadline.
8. Identify catch-up maintenance
The transaction team should compare work orders, inspection findings, shutdown history, maintenance backlog and pre-sale spending patterns. The required output is a deferred-maintenance schedule. Use dated source data and link each material conclusion to retained asset, engineering, financial and contractual evidence [6][10].
Translate the asset assumption into monthly investment, downtime, working-capital, tax, debt and covenant effects. Identify the accountable owner, measurement method, remaining life, dependency, decision date and evidence threshold. Reconcile the engineering workplan, financial statements, fixed-asset register, operating forecast and financing model.
The principal risk is that temporarily low historical spend can create a large post-completion cash obligation. Quantify the effect on sustainable free cash flow, revolving-credit availability, leverage, debt-service coverage, minimum liquidity, refinancing and equity value. Show base, catch-up, failure and transition cases with enough buffer for forecast error and execution volatility.
Retain the source, model version, reviewer, technical approval and board response. Compare forecast expenditure, asset condition, availability and cash with realised outcomes; remove unsupported classifications; and assign every exception an owner and deadline.
Table 1. Maintenance evidence matrix
| Investment class | Minimum evidence | Core test |
|---|---|---|
| routine maintenance | work orders and invoices | sustains current output |
| major overhaul | life-cycle schedule | cash peak funded |
| replacement | condition and lead time | remaining life verified |
| growth | capacity and revenue case | incremental return evidenced |
Illustrative control framework; verified asset evidence and executed documents govern.
9. Test major overhaul cycles
The transaction team should map turbines, engines, vessels, vehicles, production lines, data-centre systems and other periodic overhaul requirements. The required output is a life-cycle overhaul calendar. Use dated source data and link each material conclusion to retained asset, engineering, financial and contractual evidence [3][11].
Translate the asset assumption into monthly investment, downtime, working-capital, tax, debt and covenant effects. Identify the accountable owner, measurement method, remaining life, dependency, decision date and evidence threshold. Reconcile the engineering workplan, financial statements, fixed-asset register, operating forecast and financing model.
The principal risk is that average annual capital expenditure can conceal concentrated cash peaks that breach liquidity or covenants. Quantify the effect on sustainable free cash flow, revolving-credit availability, leverage, debt-service coverage, minimum liquidity, refinancing and equity value. Show base, catch-up, failure and transition cases with enough buffer for forecast error and execution volatility.
Retain the source, model version, reviewer, technical approval and board response. Compare forecast expenditure, asset condition, availability and cash with realised outcomes; remove unsupported classifications; and assign every exception an owner and deadline.
10. Model replacement cohorts
The transaction team should group assets by remaining useful life, criticality, lead time, replacement cost and downtime. The required output is a replacement-wave forecast. Use dated source data and link each material conclusion to retained asset, engineering, financial and contractual evidence [3][12].
Translate the asset assumption into monthly investment, downtime, working-capital, tax, debt and covenant effects. Identify the accountable owner, measurement method, remaining life, dependency, decision date and evidence threshold. Reconcile the engineering workplan, financial statements, fixed-asset register, operating forecast and financing model.
The principal risk is that many assets can reach end of life within the same hold period. Quantify the effect on sustainable free cash flow, revolving-credit availability, leverage, debt-service coverage, minimum liquidity, refinancing and equity value. Show base, catch-up, failure and transition cases with enough buffer for forecast error and execution volatility.
Retain the source, model version, reviewer, technical approval and board response. Compare forecast expenditure, asset condition, availability and cash with realised outcomes; remove unsupported classifications; and assign every exception an owner and deadline.
11. Price inflation and supply constraints
The transaction team should apply equipment, construction, labour, freight, currency and lead-time scenarios to the investment plan. The required output is a replacement-cost escalation model. Use dated source data and link each material conclusion to retained asset, engineering, financial and contractual evidence [1][13].
Translate the asset assumption into monthly investment, downtime, working-capital, tax, debt and covenant effects. Identify the accountable owner, measurement method, remaining life, dependency, decision date and evidence threshold. Reconcile the engineering workplan, financial statements, fixed-asset register, operating forecast and financing model.
The principal risk is that book value and historical invoices can materially understate current cash replacement cost. Quantify the effect on sustainable free cash flow, revolving-credit availability, leverage, debt-service coverage, minimum liquidity, refinancing and equity value. Show base, catch-up, failure and transition cases with enough buffer for forecast error and execution volatility.
Retain the source, model version, reviewer, technical approval and board response. Compare forecast expenditure, asset condition, availability and cash with realised outcomes; remove unsupported classifications; and assign every exception an owner and deadline.
12. Test utilisation effects
The transaction team should connect throughput, operating hours, load, mileage, environmental conditions and maintenance intervals. The required output is a utilisation-to-investment curve. Use dated source data and link each material conclusion to retained asset, engineering, financial and contractual evidence [6][14].
Translate the asset assumption into monthly investment, downtime, working-capital, tax, debt and covenant effects. Identify the accountable owner, measurement method, remaining life, dependency, decision date and evidence threshold. Reconcile the engineering workplan, financial statements, fixed-asset register, operating forecast and financing model.
The principal risk is that the acquisition plan can increase output and accelerate wear without increasing maintenance cash. Quantify the effect on sustainable free cash flow, revolving-credit availability, leverage, debt-service coverage, minimum liquidity, refinancing and equity value. Show base, catch-up, failure and transition cases with enough buffer for forecast error and execution volatility.
Retain the source, model version, reviewer, technical approval and board response. Compare forecast expenditure, asset condition, availability and cash with realised outcomes; remove unsupported classifications; and assign every exception an owner and deadline.
13. Quantify reliability economics
The transaction team should link failure probability, lost output, service penalties, repair cost, safety exposure and customer churn. The required output is a reliability value-at-risk model. Use dated source data and link each material conclusion to retained asset, engineering, financial and contractual evidence [6][15].
Translate the asset assumption into monthly investment, downtime, working-capital, tax, debt and covenant effects. Identify the accountable owner, measurement method, remaining life, dependency, decision date and evidence threshold. Reconcile the engineering workplan, financial statements, fixed-asset register, operating forecast and financing model.
The principal risk is that cutting maintenance can improve near-term EBITDA while destroying availability and enterprise value. Quantify the effect on sustainable free cash flow, revolving-credit availability, leverage, debt-service coverage, minimum liquidity, refinancing and equity value. Show base, catch-up, failure and transition cases with enough buffer for forecast error and execution volatility.
Retain the source, model version, reviewer, technical approval and board response. Compare forecast expenditure, asset condition, availability and cash with realised outcomes; remove unsupported classifications; and assign every exception an owner and deadline.
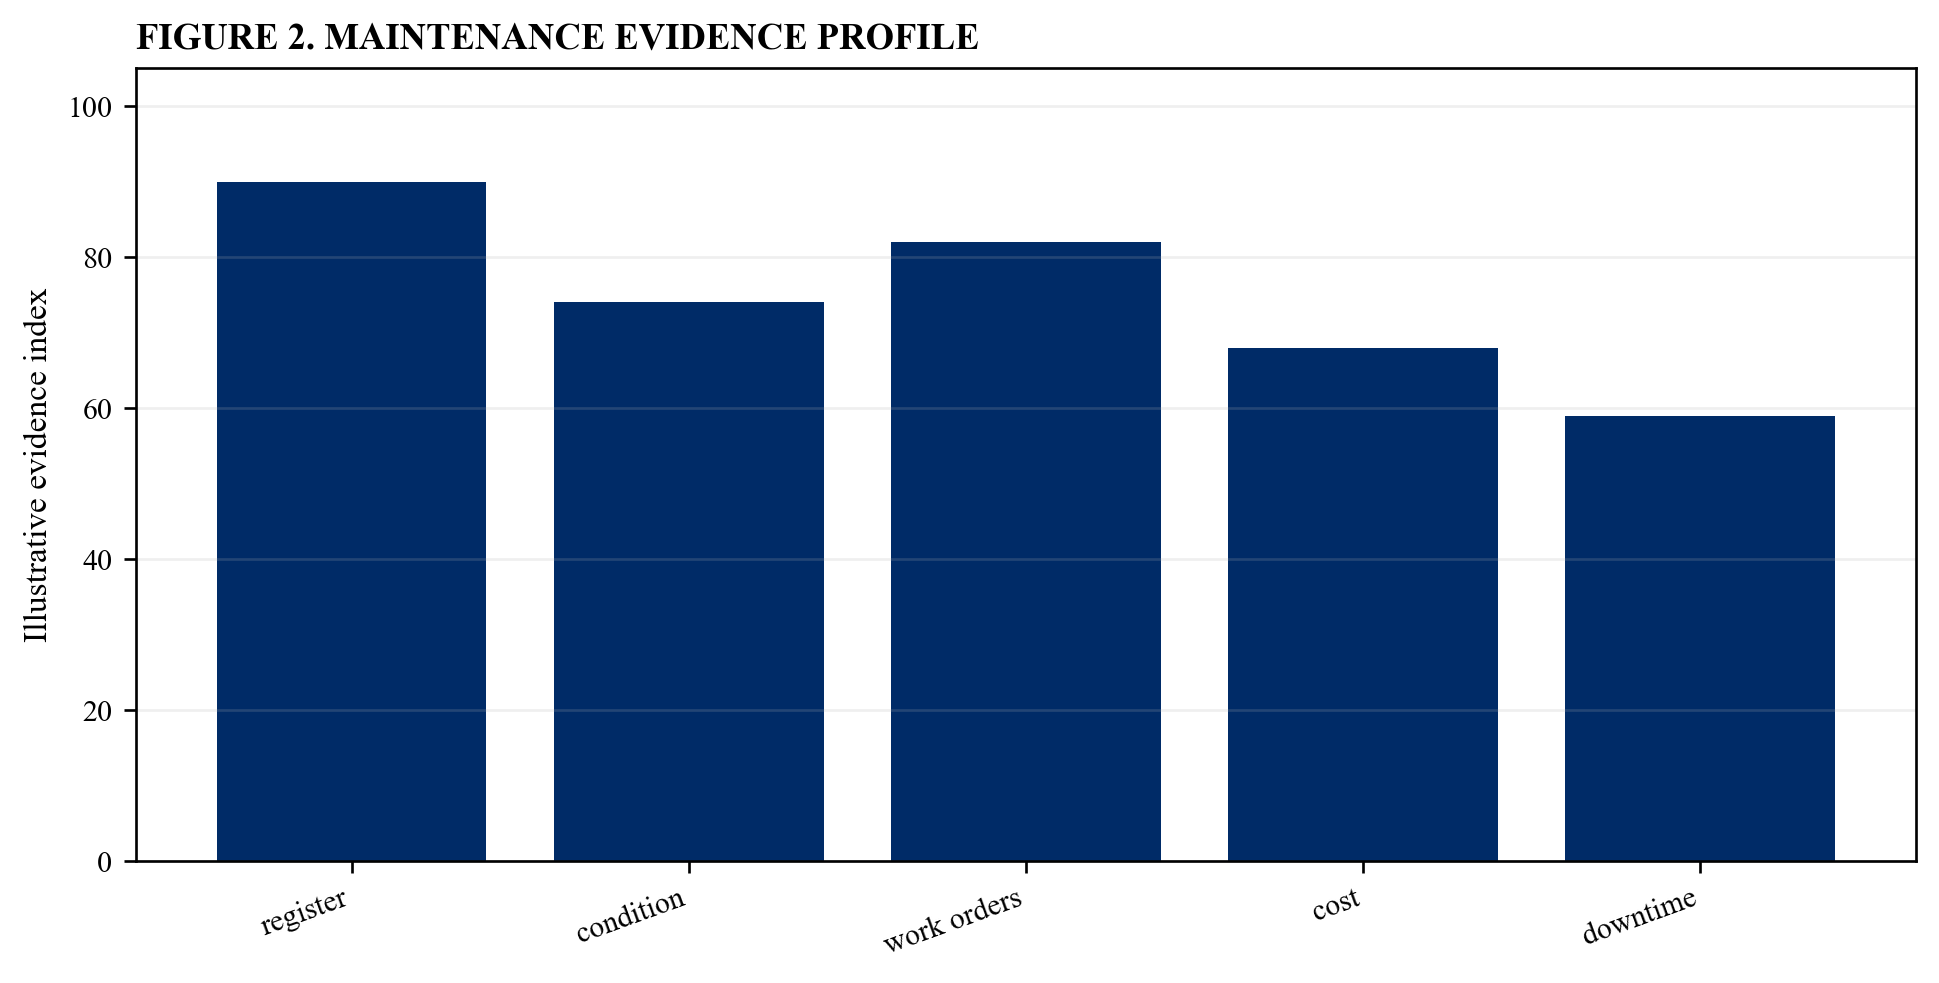
Illustrative analytical scenario; verified asset and transaction evidence should replace index values.
14. Capture compliance investment
The transaction team should map environmental, safety, cyber, building, grid, transport and sector-specific requirements to dated projects. The required output is a compliance capital register. Use dated source data and link each material conclusion to retained asset, engineering, financial and contractual evidence [16][17].
Translate the asset assumption into monthly investment, downtime, working-capital, tax, debt and covenant effects. Identify the accountable owner, measurement method, remaining life, dependency, decision date and evidence threshold. Reconcile the engineering workplan, financial statements, fixed-asset register, operating forecast and financing model.
The principal risk is that mandatory spend can be absent from management forecasts until regulators or insurers intervene. Quantify the effect on sustainable free cash flow, revolving-credit availability, leverage, debt-service coverage, minimum liquidity, refinancing and equity value. Show base, catch-up, failure and transition cases with enough buffer for forecast error and execution volatility.
Retain the source, model version, reviewer, technical approval and board response. Compare forecast expenditure, asset condition, availability and cash with realised outcomes; remove unsupported classifications; and assign every exception an owner and deadline.
15. Capture resilience investment
The transaction team should identify redundancy, climate adaptation, backup power, water, spares, security and business-continuity requirements. The required output is a resilience investment plan. Use dated source data and link each material conclusion to retained asset, engineering, financial and contractual evidence [17][18].
Translate the asset assumption into monthly investment, downtime, working-capital, tax, debt and covenant effects. Identify the accountable owner, measurement method, remaining life, dependency, decision date and evidence threshold. Reconcile the engineering workplan, financial statements, fixed-asset register, operating forecast and financing model.
The principal risk is that a lowest-cost maintenance case can leave the asset base unable to absorb foreseeable disruption. Quantify the effect on sustainable free cash flow, revolving-credit availability, leverage, debt-service coverage, minimum liquidity, refinancing and equity value. Show base, catch-up, failure and transition cases with enough buffer for forecast error and execution volatility.
Retain the source, model version, reviewer, technical approval and board response. Compare forecast expenditure, asset condition, availability and cash with realised outcomes; remove unsupported classifications; and assign every exception an owner and deadline.
16. Test lease and outsourcing economics
The transaction team should compare owned replacement cash with lease payments, maintenance obligations, residual risk and supplier concentration. The required output is an owned-versus-contracted bridge. Use dated source data and link each material conclusion to retained asset, engineering, financial and contractual evidence [4][19].
Translate the asset assumption into monthly investment, downtime, working-capital, tax, debt and covenant effects. Identify the accountable owner, measurement method, remaining life, dependency, decision date and evidence threshold. Reconcile the engineering workplan, financial statements, fixed-asset register, operating forecast and financing model.
The principal risk is that outsourcing can move capital expenditure into fixed operating cash without reducing economic asset dependence. Quantify the effect on sustainable free cash flow, revolving-credit availability, leverage, debt-service coverage, minimum liquidity, refinancing and equity value. Show base, catch-up, failure and transition cases with enough buffer for forecast error and execution volatility.
Retain the source, model version, reviewer, technical approval and board response. Compare forecast expenditure, asset condition, availability and cash with realised outcomes; remove unsupported classifications; and assign every exception an owner and deadline.
Table 2. Asset-level cash bridge
| Cash item | Forecast basis | Control |
|---|---|---|
| maintenance | asset workplan | engineering approval |
| compliance | dated obligation | legal owner |
| downtime | lost-output model | operations review |
| working capital | spares and activity | treasury funding |
Illustrative control framework; verified asset evidence and executed documents govern.
17. Reconcile capitalised labour and software
The transaction team should separate payroll, implementation, cloud, licences and internally generated asset costs by accounting and cash treatment. The required output is a capitalisation-policy bridge. Use dated source data and link each material conclusion to retained asset, engineering, financial and contractual evidence [20][21].
Translate the asset assumption into monthly investment, downtime, working-capital, tax, debt and covenant effects. Identify the accountable owner, measurement method, remaining life, dependency, decision date and evidence threshold. Reconcile the engineering workplan, financial statements, fixed-asset register, operating forecast and financing model.
The principal risk is that capitalised expenditure can support EBITDA while increasing cash consumption and future amortisation. Quantify the effect on sustainable free cash flow, revolving-credit availability, leverage, debt-service coverage, minimum liquidity, refinancing and equity value. Show base, catch-up, failure and transition cases with enough buffer for forecast error and execution volatility.
Retain the source, model version, reviewer, technical approval and board response. Compare forecast expenditure, asset condition, availability and cash with realised outcomes; remove unsupported classifications; and assign every exception an owner and deadline.
18. Model shutdown and downtime
The transaction team should schedule outages, lost production, restart cost, inventory buffers and customer commitments. The required output is an outage cash-flow schedule. Use dated source data and link each material conclusion to retained asset, engineering, financial and contractual evidence [11][15].
Translate the asset assumption into monthly investment, downtime, working-capital, tax, debt and covenant effects. Identify the accountable owner, measurement method, remaining life, dependency, decision date and evidence threshold. Reconcile the engineering workplan, financial statements, fixed-asset register, operating forecast and financing model.
The principal risk is that the cost of maintaining an asset includes operational cash effects beyond the contractor invoice. Quantify the effect on sustainable free cash flow, revolving-credit availability, leverage, debt-service coverage, minimum liquidity, refinancing and equity value. Show base, catch-up, failure and transition cases with enough buffer for forecast error and execution volatility.
Retain the source, model version, reviewer, technical approval and board response. Compare forecast expenditure, asset condition, availability and cash with realised outcomes; remove unsupported classifications; and assign every exception an owner and deadline.
19. Link spares and inventory
The transaction team should connect critical spares, obsolescence, service levels, procurement lead times and inventory funding. The required output is a spares working-capital model. Use dated source data and link each material conclusion to retained asset, engineering, financial and contractual evidence [9][22].
Translate the asset assumption into monthly investment, downtime, working-capital, tax, debt and covenant effects. Identify the accountable owner, measurement method, remaining life, dependency, decision date and evidence threshold. Reconcile the engineering workplan, financial statements, fixed-asset register, operating forecast and financing model.
The principal risk is that maintenance resilience can require cash tied up in components that EBITDA does not reveal. Quantify the effect on sustainable free cash flow, revolving-credit availability, leverage, debt-service coverage, minimum liquidity, refinancing and equity value. Show base, catch-up, failure and transition cases with enough buffer for forecast error and execution volatility.
Retain the source, model version, reviewer, technical approval and board response. Compare forecast expenditure, asset condition, availability and cash with realised outcomes; remove unsupported classifications; and assign every exception an owner and deadline.
20. Model supplier finance
The transaction team should identify extended payment terms, reverse factoring, deposits, retention and equipment financing. The required output is a supplier-finance reconciliation. Use dated source data and link each material conclusion to retained asset, engineering, financial and contractual evidence [7][23].
Translate the asset assumption into monthly investment, downtime, working-capital, tax, debt and covenant effects. Identify the accountable owner, measurement method, remaining life, dependency, decision date and evidence threshold. Reconcile the engineering workplan, financial statements, fixed-asset register, operating forecast and financing model.
The principal risk is that reported operating cash flow can benefit from funding arrangements that unwind after completion. Quantify the effect on sustainable free cash flow, revolving-credit availability, leverage, debt-service coverage, minimum liquidity, refinancing and equity value. Show base, catch-up, failure and transition cases with enough buffer for forecast error and execution volatility.
Retain the source, model version, reviewer, technical approval and board response. Compare forecast expenditure, asset condition, availability and cash with realised outcomes; remove unsupported classifications; and assign every exception an owner and deadline.
21. Build the EBITDA-to-cash bridge
The transaction team should deduct cash tax, working capital, maintenance, compliance, replacement, leases and other fixed charges from operating earnings. The required output is a sustainable free-cash-flow bridge. Use dated source data and link each material conclusion to retained asset, engineering, financial and contractual evidence [7][8].
Translate the asset assumption into monthly investment, downtime, working-capital, tax, debt and covenant effects. Identify the accountable owner, measurement method, remaining life, dependency, decision date and evidence threshold. Reconcile the engineering workplan, financial statements, fixed-asset register, operating forecast and financing model.
The principal risk is that headline EBITDA can support a valuation multiple that the business cannot convert into distributable cash. Quantify the effect on sustainable free cash flow, revolving-credit availability, leverage, debt-service coverage, minimum liquidity, refinancing and equity value. Show base, catch-up, failure and transition cases with enough buffer for forecast error and execution volatility.
Retain the source, model version, reviewer, technical approval and board response. Compare forecast expenditure, asset condition, availability and cash with realised outcomes; remove unsupported classifications; and assign every exception an owner and deadline.
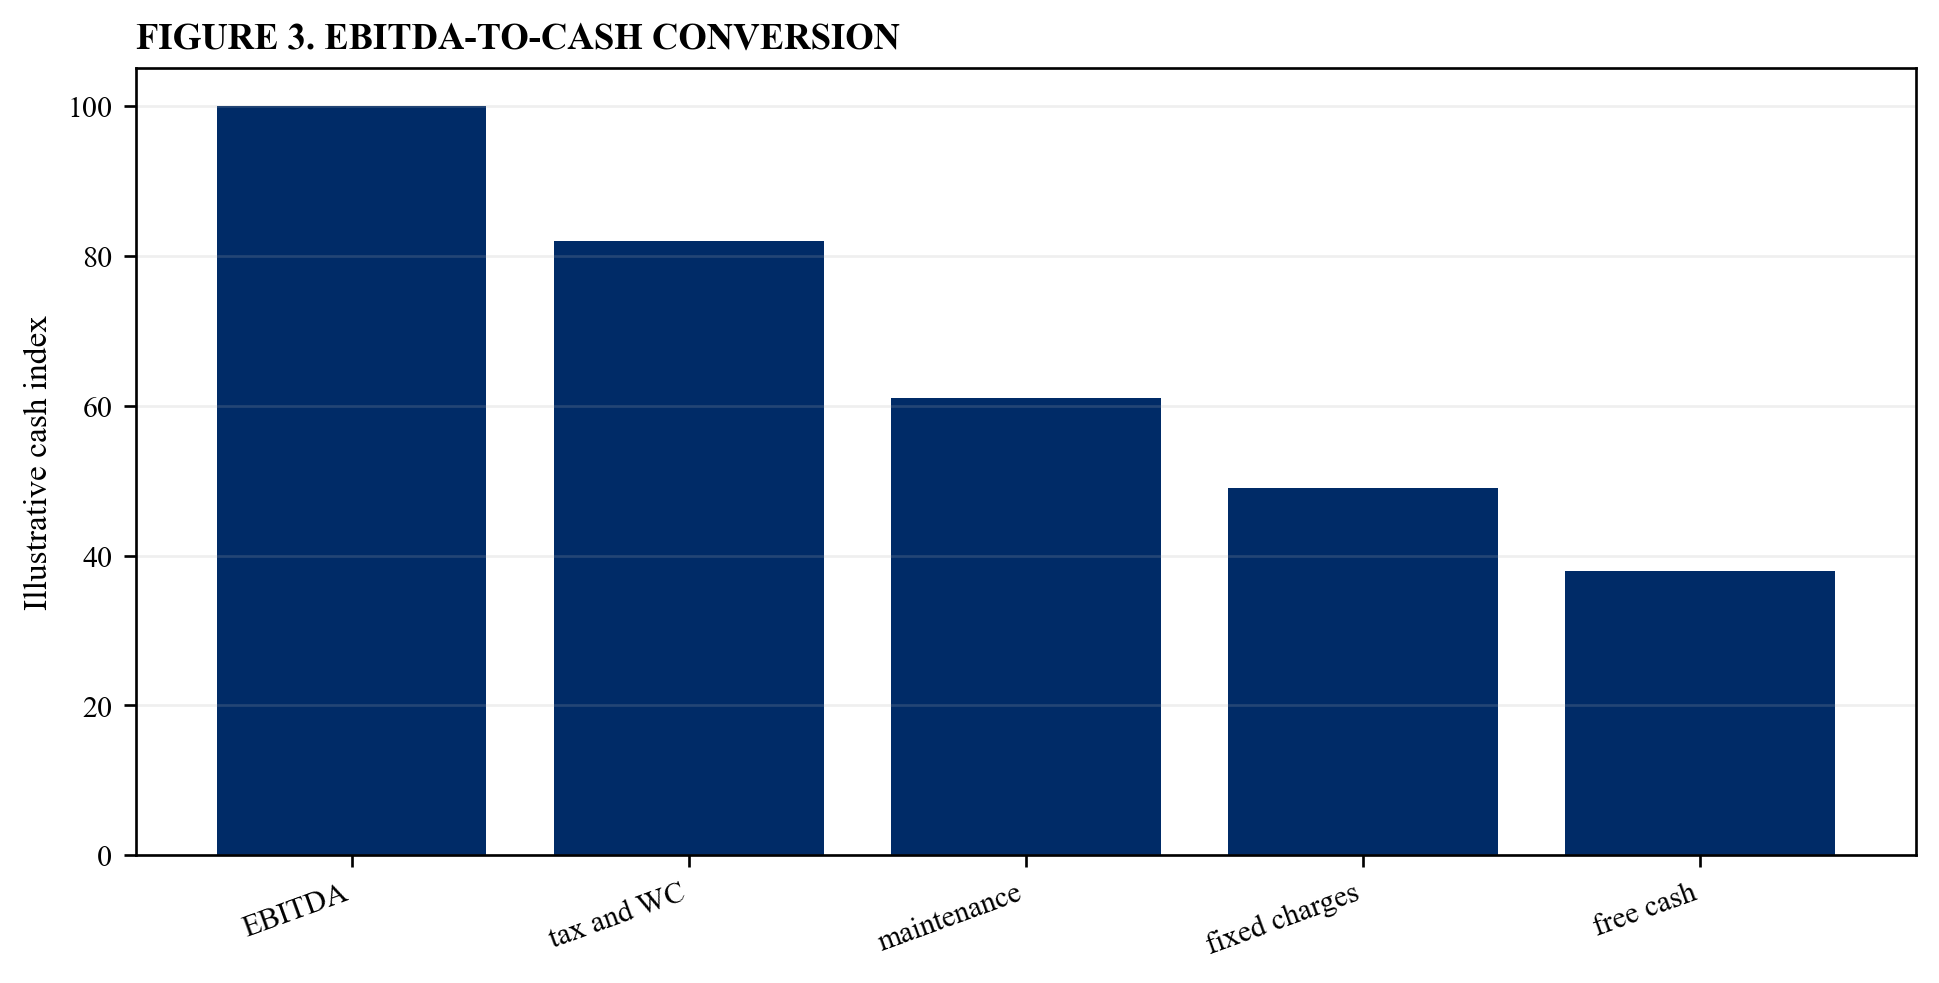
Illustrative analytical scenario; verified asset and transaction evidence should replace index values.
22. Normalise historical expenditure
The transaction team should adjust for shutdown timing, asset sales, acquisitions, capitalised items, grants, insurance proceeds and temporary deferral. The required output is a normalised investment history. Use dated source data and link each material conclusion to retained asset, engineering, financial and contractual evidence [3][7].
Translate the asset assumption into monthly investment, downtime, working-capital, tax, debt and covenant effects. Identify the accountable owner, measurement method, remaining life, dependency, decision date and evidence threshold. Reconcile the engineering workplan, financial statements, fixed-asset register, operating forecast and financing model.
The principal risk is that a simple multi-year average can mix unlike periods and conceal the forward requirement. Quantify the effect on sustainable free cash flow, revolving-credit availability, leverage, debt-service coverage, minimum liquidity, refinancing and equity value. Show base, catch-up, failure and transition cases with enough buffer for forecast error and execution volatility.
Retain the source, model version, reviewer, technical approval and board response. Compare forecast expenditure, asset condition, availability and cash with realised outcomes; remove unsupported classifications; and assign every exception an owner and deadline.
23. Build the engineering base case
The transaction team should use verified condition, work orders, operating plan, regulatory commitments and current replacement prices. The required output is an asset-led base forecast. Use dated source data and link each material conclusion to retained asset, engineering, financial and contractual evidence [3][6].
Translate the asset assumption into monthly investment, downtime, working-capital, tax, debt and covenant effects. Identify the accountable owner, measurement method, remaining life, dependency, decision date and evidence threshold. Reconcile the engineering workplan, financial statements, fixed-asset register, operating forecast and financing model.
The principal risk is that management's financial plan can omit engineering work that has no approved purchase order. Quantify the effect on sustainable free cash flow, revolving-credit availability, leverage, debt-service coverage, minimum liquidity, refinancing and equity value. Show base, catch-up, failure and transition cases with enough buffer for forecast error and execution volatility.
Retain the source, model version, reviewer, technical approval and board response. Compare forecast expenditure, asset condition, availability and cash with realised outcomes; remove unsupported classifications; and assign every exception an owner and deadline.
24. Build the catch-up case
The transaction team should accelerate deferred work, include outage effects and restore the asset base to the agreed operating standard. The required output is a post-completion recovery case. Use dated source data and link each material conclusion to retained asset, engineering, financial and contractual evidence [6][10].
Translate the asset assumption into monthly investment, downtime, working-capital, tax, debt and covenant effects. Identify the accountable owner, measurement method, remaining life, dependency, decision date and evidence threshold. Reconcile the engineering workplan, financial statements, fixed-asset register, operating forecast and financing model.
The principal risk is that catch-up expenditure can coincide with transaction debt service and integration cash. Quantify the effect on sustainable free cash flow, revolving-credit availability, leverage, debt-service coverage, minimum liquidity, refinancing and equity value. Show base, catch-up, failure and transition cases with enough buffer for forecast error and execution volatility.
Retain the source, model version, reviewer, technical approval and board response. Compare forecast expenditure, asset condition, availability and cash with realised outcomes; remove unsupported classifications; and assign every exception an owner and deadline.
Table 3. Scenario architecture
| Case | Primary pressure | Decision use |
|---|---|---|
| base | verified life-cycle plan | sustainable leverage |
| catch-up | deferred work | completion funding |
| failure | critical outage | contingency liquidity |
| transition | technology and regulation | exit resilience |
Illustrative control framework; verified asset evidence and executed documents govern.
25. Build the failure case
The transaction team should model critical asset loss, repair, replacement, lost output, insurance timing and customer consequences. The required output is a severe-but-plausible failure case. Use dated source data and link each material conclusion to retained asset, engineering, financial and contractual evidence [15][18].
Translate the asset assumption into monthly investment, downtime, working-capital, tax, debt and covenant effects. Identify the accountable owner, measurement method, remaining life, dependency, decision date and evidence threshold. Reconcile the engineering workplan, financial statements, fixed-asset register, operating forecast and financing model.
The principal risk is that low-frequency asset events can consume the entire equity buffer. Quantify the effect on sustainable free cash flow, revolving-credit availability, leverage, debt-service coverage, minimum liquidity, refinancing and equity value. Show base, catch-up, failure and transition cases with enough buffer for forecast error and execution volatility.
Retain the source, model version, reviewer, technical approval and board response. Compare forecast expenditure, asset condition, availability and cash with realised outcomes; remove unsupported classifications; and assign every exception an owner and deadline.
26. Build the transition case
The transaction team should model technology substitution, decarbonisation, electrification, automation and stranded-asset risk. The required output is an asset-transition case. Use dated source data and link each material conclusion to retained asset, engineering, financial and contractual evidence [17][24].
Translate the asset assumption into monthly investment, downtime, working-capital, tax, debt and covenant effects. Identify the accountable owner, measurement method, remaining life, dependency, decision date and evidence threshold. Reconcile the engineering workplan, financial statements, fixed-asset register, operating forecast and financing model.
The principal risk is that the existing base can require investment while becoming economically obsolete before the debt matures. Quantify the effect on sustainable free cash flow, revolving-credit availability, leverage, debt-service coverage, minimum liquidity, refinancing and equity value. Show base, catch-up, failure and transition cases with enough buffer for forecast error and execution volatility.
Retain the source, model version, reviewer, technical approval and board response. Compare forecast expenditure, asset condition, availability and cash with realised outcomes; remove unsupported classifications; and assign every exception an owner and deadline.
27. Calculate sustainable leverage
The transaction team should size debt from free cash flow after verified maintenance and fixed charges under all cases. The required output is an asset-adjusted debt-capacity model. Use dated source data and link each material conclusion to retained asset, engineering, financial and contractual evidence [1][2].
Translate the asset assumption into monthly investment, downtime, working-capital, tax, debt and covenant effects. Identify the accountable owner, measurement method, remaining life, dependency, decision date and evidence threshold. Reconcile the engineering workplan, financial statements, fixed-asset register, operating forecast and financing model.
The principal risk is that leverage based on accounting EBITDA can exceed the asset base's repayment capacity. Quantify the effect on sustainable free cash flow, revolving-credit availability, leverage, debt-service coverage, minimum liquidity, refinancing and equity value. Show base, catch-up, failure and transition cases with enough buffer for forecast error and execution volatility.
Retain the source, model version, reviewer, technical approval and board response. Compare forecast expenditure, asset condition, availability and cash with realised outcomes; remove unsupported classifications; and assign every exception an owner and deadline.
28. Test covenant definitions
The transaction team should map capital expenditure, leases, exceptional repairs, insurance proceeds and EBITDA adjustments to executed documents. The required output is a covenant eligibility schedule. Use dated source data and link each material conclusion to retained asset, engineering, financial and contractual evidence [2][5].
Translate the asset assumption into monthly investment, downtime, working-capital, tax, debt and covenant effects. Identify the accountable owner, measurement method, remaining life, dependency, decision date and evidence threshold. Reconcile the engineering workplan, financial statements, fixed-asset register, operating forecast and financing model.
The principal risk is that a maintenance shock can weaken cash while remaining partly invisible in the covenant ratio. Quantify the effect on sustainable free cash flow, revolving-credit availability, leverage, debt-service coverage, minimum liquidity, refinancing and equity value. Show base, catch-up, failure and transition cases with enough buffer for forecast error and execution volatility.
Retain the source, model version, reviewer, technical approval and board response. Compare forecast expenditure, asset condition, availability and cash with realised outcomes; remove unsupported classifications; and assign every exception an owner and deadline.
29. Forecast minimum liquidity
The transaction team should combine investment milestones, working capital, debt service, facility availability and contingency cash by month. The required output is a liquidity runway. Use dated source data and link each material conclusion to retained asset, engineering, financial and contractual evidence [1][7].
Translate the asset assumption into monthly investment, downtime, working-capital, tax, debt and covenant effects. Identify the accountable owner, measurement method, remaining life, dependency, decision date and evidence threshold. Reconcile the engineering workplan, financial statements, fixed-asset register, operating forecast and financing model.
The principal risk is that annual investment budgets can miss concentrated funding gaps. Quantify the effect on sustainable free cash flow, revolving-credit availability, leverage, debt-service coverage, minimum liquidity, refinancing and equity value. Show base, catch-up, failure and transition cases with enough buffer for forecast error and execution volatility.
Retain the source, model version, reviewer, technical approval and board response. Compare forecast expenditure, asset condition, availability and cash with realised outcomes; remove unsupported classifications; and assign every exception an owner and deadline.
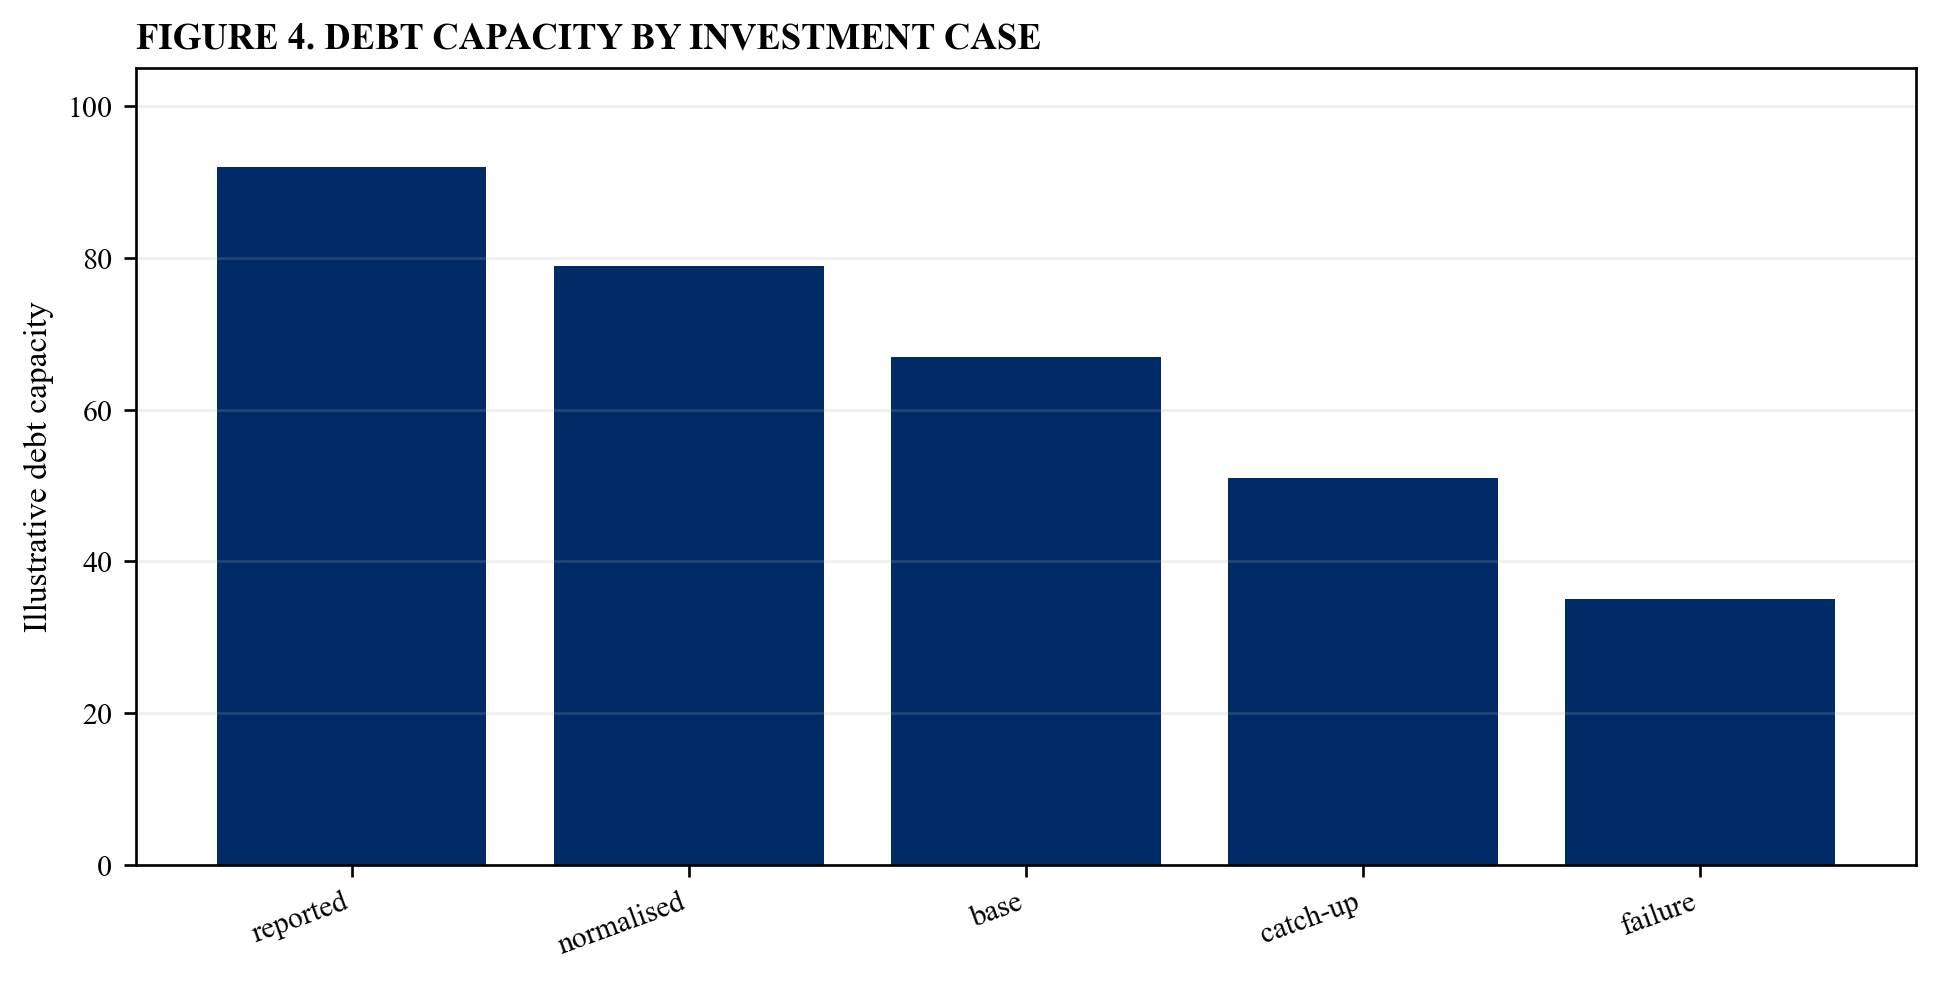
Illustrative analytical scenario; verified asset and transaction evidence should replace index values.
30. Test debt-service coverage
The transaction team should calculate cash interest, amortisation and fixed charges after sustainable maintenance under every case. The required output is a debt-service coverage certificate. Use dated source data and link each material conclusion to retained asset, engineering, financial and contractual evidence [2][7].
Translate the asset assumption into monthly investment, downtime, working-capital, tax, debt and covenant effects. Identify the accountable owner, measurement method, remaining life, dependency, decision date and evidence threshold. Reconcile the engineering workplan, financial statements, fixed-asset register, operating forecast and financing model.
The principal risk is that a business can report positive EBITDA and still lack cash for scheduled debt service. Quantify the effect on sustainable free cash flow, revolving-credit availability, leverage, debt-service coverage, minimum liquidity, refinancing and equity value. Show base, catch-up, failure and transition cases with enough buffer for forecast error and execution volatility.
Retain the source, model version, reviewer, technical approval and board response. Compare forecast expenditure, asset condition, availability and cash with realised outcomes; remove unsupported classifications; and assign every exception an owner and deadline.
31. Recalculate the entry multiple
The transaction team should compare enterprise value with accounting EBITDA, sustainable EBITDA-equivalent cash flow and asset-adjusted free cash flow. The required output is a multiple reconciliation. Use dated source data and link each material conclusion to retained asset, engineering, financial and contractual evidence [8][25].
Translate the asset assumption into monthly investment, downtime, working-capital, tax, debt and covenant effects. Identify the accountable owner, measurement method, remaining life, dependency, decision date and evidence threshold. Reconcile the engineering workplan, financial statements, fixed-asset register, operating forecast and financing model.
The principal risk is that the apparent acquisition discount can disappear after necessary investment is recognised. Quantify the effect on sustainable free cash flow, revolving-credit availability, leverage, debt-service coverage, minimum liquidity, refinancing and equity value. Show base, catch-up, failure and transition cases with enough buffer for forecast error and execution volatility.
Retain the source, model version, reviewer, technical approval and board response. Compare forecast expenditure, asset condition, availability and cash with realised outcomes; remove unsupported classifications; and assign every exception an owner and deadline.
32. Recalculate equity returns
The transaction team should integrate maintenance cash, downtime, financing, tax, debt paydown, exit capital need and exit multiple. The required output is an asset-adjusted equity case. Use dated source data and link each material conclusion to retained asset, engineering, financial and contractual evidence [1][25].
Translate the asset assumption into monthly investment, downtime, working-capital, tax, debt and covenant effects. Identify the accountable owner, measurement method, remaining life, dependency, decision date and evidence threshold. Reconcile the engineering workplan, financial statements, fixed-asset register, operating forecast and financing model.
The principal risk is that sponsor returns can rely on deferring expenditure to the next owner. Quantify the effect on sustainable free cash flow, revolving-credit availability, leverage, debt-service coverage, minimum liquidity, refinancing and equity value. Show base, catch-up, failure and transition cases with enough buffer for forecast error and execution volatility.
Retain the source, model version, reviewer, technical approval and board response. Compare forecast expenditure, asset condition, availability and cash with realised outcomes; remove unsupported classifications; and assign every exception an owner and deadline.
Table 4. Multiple reconciliation
| Measure | Required adjustment | Use |
|---|---|---|
| accounting EBITDA | reported bridge | headline comparison |
| maintenance-adjusted cash | verified sustaining spend | debt capacity |
| free cash flow | tax and working capital | equity paydown |
| exit cash flow | backlog and transition | terminal value |
Illustrative control framework; verified asset evidence and executed documents govern.
33. Test exit readiness
The transaction team should forecast asset condition, backlog, compliance, inspection evidence and buyer diligence at the planned sale date. The required output is an exit asset-integrity plan. Use dated source data and link each material conclusion to retained asset, engineering, financial and contractual evidence [6][26].
Translate the asset assumption into monthly investment, downtime, working-capital, tax, debt and covenant effects. Identify the accountable owner, measurement method, remaining life, dependency, decision date and evidence threshold. Reconcile the engineering workplan, financial statements, fixed-asset register, operating forecast and financing model.
The principal risk is that underinvestment during the hold can reappear as price reduction, indemnity or failed refinancing. Quantify the effect on sustainable free cash flow, revolving-credit availability, leverage, debt-service coverage, minimum liquidity, refinancing and equity value. Show base, catch-up, failure and transition cases with enough buffer for forecast error and execution volatility.
Retain the source, model version, reviewer, technical approval and board response. Compare forecast expenditure, asset condition, availability and cash with realised outcomes; remove unsupported classifications; and assign every exception an owner and deadline.
34. Negotiate purchase protection
The transaction team should translate identified backlog into price, completion accounts, escrow, warranty, indemnity, covenant and committed funding terms. The required output is an asset-risk negotiation map. Use dated source data and link each material conclusion to retained asset, engineering, financial and contractual evidence [8][26].
Translate the asset assumption into monthly investment, downtime, working-capital, tax, debt and covenant effects. Identify the accountable owner, measurement method, remaining life, dependency, decision date and evidence threshold. Reconcile the engineering workplan, financial statements, fixed-asset register, operating forecast and financing model.
The principal risk is that technical diligence findings can remain descriptive and fail to change transaction economics. Quantify the effect on sustainable free cash flow, revolving-credit availability, leverage, debt-service coverage, minimum liquidity, refinancing and equity value. Show base, catch-up, failure and transition cases with enough buffer for forecast error and execution volatility.
Retain the source, model version, reviewer, technical approval and board response. Compare forecast expenditure, asset condition, availability and cash with realised outcomes; remove unsupported classifications; and assign every exception an owner and deadline.
35. Design capital-expenditure controls
The transaction team should set approval thresholds, asset evidence, benefit classification, procurement controls and post-investment review. The required output is an investment governance protocol. Use dated source data and link each material conclusion to retained asset, engineering, financial and contractual evidence [6][22].
Translate the asset assumption into monthly investment, downtime, working-capital, tax, debt and covenant effects. Identify the accountable owner, measurement method, remaining life, dependency, decision date and evidence threshold. Reconcile the engineering workplan, financial statements, fixed-asset register, operating forecast and financing model.
The principal risk is that uncontrolled growth projects can crowd out mandatory maintenance. Quantify the effect on sustainable free cash flow, revolving-credit availability, leverage, debt-service coverage, minimum liquidity, refinancing and equity value. Show base, catch-up, failure and transition cases with enough buffer for forecast error and execution volatility.
Retain the source, model version, reviewer, technical approval and board response. Compare forecast expenditure, asset condition, availability and cash with realised outcomes; remove unsupported classifications; and assign every exception an owner and deadline.
36. Monitor asset indicators
The transaction team should track availability, failures, backlog, overdue inspection, utilisation, unit cost and forecast-to-actual investment. The required output is a monthly asset dashboard. Use dated source data and link each material conclusion to retained asset, engineering, financial and contractual evidence [6][15].
Translate the asset assumption into monthly investment, downtime, working-capital, tax, debt and covenant effects. Identify the accountable owner, measurement method, remaining life, dependency, decision date and evidence threshold. Reconcile the engineering workplan, financial statements, fixed-asset register, operating forecast and financing model.
The principal risk is that financial variance can emerge after physical deterioration has become expensive to reverse. Quantify the effect on sustainable free cash flow, revolving-credit availability, leverage, debt-service coverage, minimum liquidity, refinancing and equity value. Show base, catch-up, failure and transition cases with enough buffer for forecast error and execution volatility.
Retain the source, model version, reviewer, technical approval and board response. Compare forecast expenditure, asset condition, availability and cash with realised outcomes; remove unsupported classifications; and assign every exception an owner and deadline.
37. Back-test maintenance assumptions
The transaction team should compare forecast work, cost, timing, downtime and reliability with realised outcomes. The required output is an asset-plan variance report. Use dated source data and link each material conclusion to retained asset, engineering, financial and contractual evidence [3][10].
Translate the asset assumption into monthly investment, downtime, working-capital, tax, debt and covenant effects. Identify the accountable owner, measurement method, remaining life, dependency, decision date and evidence threshold. Reconcile the engineering workplan, financial statements, fixed-asset register, operating forecast and financing model.
The principal risk is that optimistic useful lives and low cost estimates can persist through successive refinancings. Quantify the effect on sustainable free cash flow, revolving-credit availability, leverage, debt-service coverage, minimum liquidity, refinancing and equity value. Show base, catch-up, failure and transition cases with enough buffer for forecast error and execution volatility.
Retain the source, model version, reviewer, technical approval and board response. Compare forecast expenditure, asset condition, availability and cash with realised outcomes; remove unsupported classifications; and assign every exception an owner and deadline.
38. Prepare the lender evidence pack
The transaction team should present the asset register, engineering forecast, investment bridge, downside cases, liquidity and covenant effects. The required output is a lender-ready asset memorandum. Use dated source data and link each material conclusion to retained asset, engineering, financial and contractual evidence [2][5].
Translate the asset assumption into monthly investment, downtime, working-capital, tax, debt and covenant effects. Identify the accountable owner, measurement method, remaining life, dependency, decision date and evidence threshold. Reconcile the engineering workplan, financial statements, fixed-asset register, operating forecast and financing model.
The principal risk is that insufficient evidence can reduce lender confidence and debt capacity late in the process. Quantify the effect on sustainable free cash flow, revolving-credit availability, leverage, debt-service coverage, minimum liquidity, refinancing and equity value. Show base, catch-up, failure and transition cases with enough buffer for forecast error and execution volatility.
Retain the source, model version, reviewer, technical approval and board response. Compare forecast expenditure, asset condition, availability and cash with realised outcomes; remove unsupported classifications; and assign every exception an owner and deadline.
39. Govern changes and exceptions
The transaction team should maintain source links, model versions, engineering approval, finance review, authority limits and escalation deadlines. The required output is an integrated asset-finance control. Use dated source data and link each material conclusion to retained asset, engineering, financial and contractual evidence [6][22].
Translate the asset assumption into monthly investment, downtime, working-capital, tax, debt and covenant effects. Identify the accountable owner, measurement method, remaining life, dependency, decision date and evidence threshold. Reconcile the engineering workplan, financial statements, fixed-asset register, operating forecast and financing model.
The principal risk is that manual reclassification can manufacture free cash flow without improving asset condition. Quantify the effect on sustainable free cash flow, revolving-credit availability, leverage, debt-service coverage, minimum liquidity, refinancing and equity value. Show base, catch-up, failure and transition cases with enough buffer for forecast error and execution volatility.
Retain the source, model version, reviewer, technical approval and board response. Compare forecast expenditure, asset condition, availability and cash with realised outcomes; remove unsupported classifications; and assign every exception an owner and deadline.
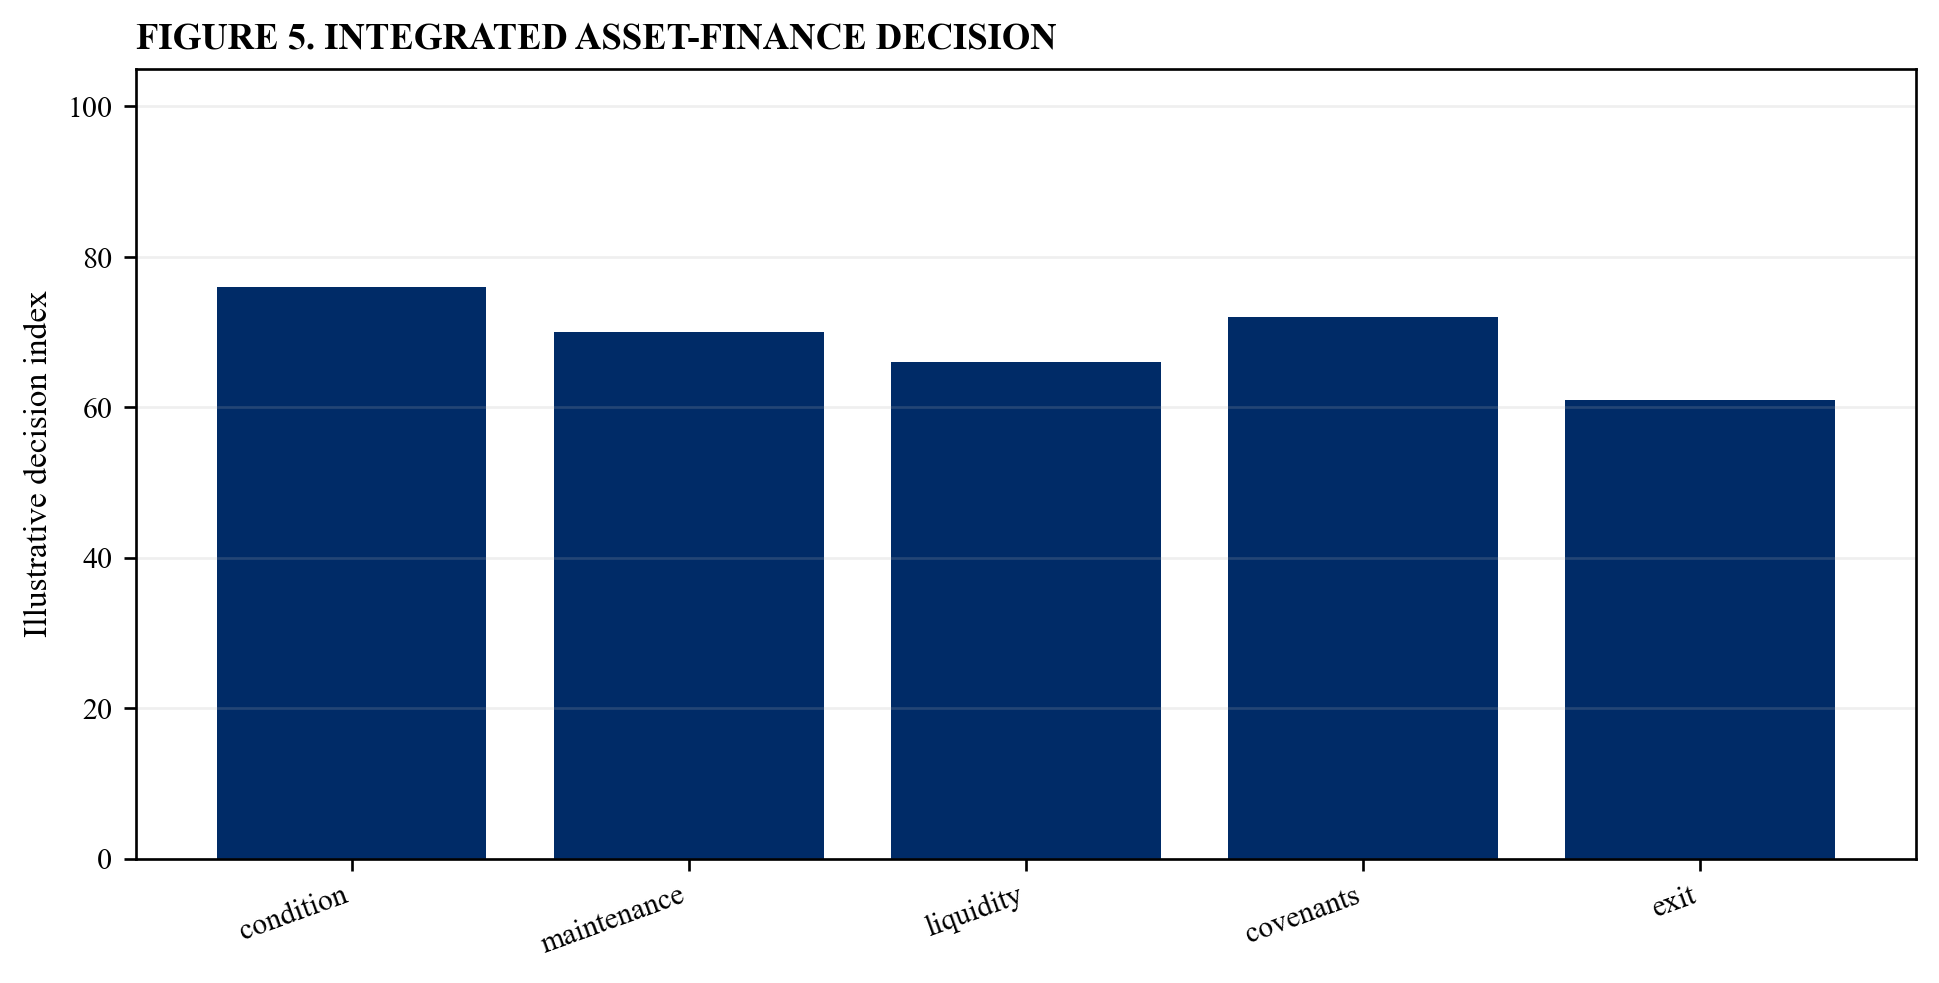
Illustrative analytical scenario; verified asset and transaction evidence should replace index values.
40. Issue the asset-integrity certificate
The transaction team should approve sustainable maintenance, liquidity, covenant headroom, debt capacity, equity returns and exit condition. The required output is a retained board certificate. Use dated source data and link each material conclusion to retained asset, engineering, financial and contractual evidence [22][26].
Translate the asset assumption into monthly investment, downtime, working-capital, tax, debt and covenant effects. Identify the accountable owner, measurement method, remaining life, dependency, decision date and evidence threshold. Reconcile the engineering workplan, financial statements, fixed-asset register, operating forecast and financing model.
The principal risk is that the board can approve an attractive multiple without seeing the cash investment that sustains it. Quantify the effect on sustainable free cash flow, revolving-credit availability, leverage, debt-service coverage, minimum liquidity, refinancing and equity value. Show base, catch-up, failure and transition cases with enough buffer for forecast error and execution volatility.
Retain the source, model version, reviewer, technical approval and board response. Compare forecast expenditure, asset condition, availability and cash with realised outcomes; remove unsupported classifications; and assign every exception an owner and deadline.
Table 5. Asset-integrity certificate
| Conclusion | Evidence | Approval test |
|---|---|---|
| maintenance need | asset-level forecast | complete and funded |
| liquidity | monthly cash model | above policy floor |
| debt capacity | downside free cash flow | repayment credible |
| exit condition | backlog and compliance | value preserved |
Illustrative control framework; verified asset evidence and executed documents govern.
References
- Bank of England, Financial Stability Report July 2026, https://www.bankofengland.co.uk/financial-stability-report/2026/july-2026
- European Central Bank, Guidance on leveraged transactions, https://www.bankingsupervision.europa.eu/ecb/pub/pdf/ssm.leveraged_transactions_guidance_201705.en.pdf
- IFRS Foundation, IAS 16 Property Plant and Equipment, https://www.ifrs.org/issued-standards/list-of-standards/ias-16-property-plant-and-equipment/
- IFRS Foundation, IFRS 16 Leases, https://www.ifrs.org/issued-standards/list-of-standards/ifrs-16-leases/
- European Banking Authority, Guidelines on leveraged transactions, https://www.eba.europa.eu/sites/default/files/documents/10180/1696305/1dba7657-6ccb-462a-b9f8-8df8686b9807/Final%20Guidelines%20on%20Leveraged%20Transactions.pdf
- International Organization for Standardization, ISO 55000 Asset management, https://www.iso.org/iso-55001-asset-management.html
- IFRS Foundation, IAS 7 Statement of Cash Flows, https://www.ifrs.org/issued-standards/list-of-standards/ias-7-statement-of-cash-flows/
- International Valuation Standards Council, International Valuation Standards, https://www.ivsc.org/standards/
- IFRS Foundation, IAS 2 Inventories, https://www.ifrs.org/issued-standards/list-of-standards/ias-2-inventories/
- IFRS Foundation, IAS 36 Impairment of Assets, https://www.ifrs.org/issued-standards/list-of-standards/ias-36-impairment-of-assets/
- IFRS Foundation, IAS 37 Provisions Contingent Liabilities and Contingent Assets, https://www.ifrs.org/issued-standards/list-of-standards/ias-37-provisions-contingent-liabilities-and-contingent-assets/
- IFRS Foundation, IFRS 5 Non-current Assets Held for Sale and Discontinued Operations, https://www.ifrs.org/issued-standards/list-of-standards/ifrs-5-non-current-assets-held-for-sale-and-discontinued-operations/
- Bank of England, Inflation Report and monetary policy data, https://www.bankofengland.co.uk/monetary-policy-report
- International Energy Agency, Energy Efficiency 2025, https://www.iea.org/reports/energy-efficiency-2025
- International Organization for Standardization, ISO 31000 Risk management, https://www.iso.org/iso-31000-risk-management.html
- International Labour Organization, Occupational safety and health, https://www.ilo.org/topics-and-sectors/safety-and-health-work
- IFRS Foundation, Effects of climate-related matters on financial statements, https://www.ifrs.org/news-and-events/news/2020/11/educational-material-on-the-effects-of-climate-related-matters/
- Network for Greening the Financial System, Climate scenarios, https://www.ngfs.net/ngfs-scenarios-portal/
- IFRS Foundation, IFRS 15 Revenue from Contracts with Customers, https://www.ifrs.org/issued-standards/list-of-standards/ifrs-15-revenue-from-contracts-with-customers/
- IFRS Foundation, IAS 38 Intangible Assets, https://www.ifrs.org/issued-standards/list-of-standards/ias-38-intangible-assets/
- IFRS Foundation, IAS 23 Borrowing Costs, https://www.ifrs.org/issued-standards/list-of-standards/ias-23-borrowing-costs/
- OECD, G20 OECD Principles of Corporate Governance 2023, https://www.oecd.org/corporate/principles-corporate-governance/
- IFRS Foundation, Supplier Finance Arrangements amendments to IAS 7 and IFRS 7, https://www.ifrs.org/projects/completed-projects/2023/supplier-finance-arrangements/
- International Energy Agency, World Energy Investment 2026, https://www.iea.org/reports/world-energy-investment-2026
- UK Financial Conduct Authority, Private market valuation practices, https://www.fca.org.uk/publications/multi-firm-reviews/private-market-valuation-practices
- UK Competition and Markets Authority, Merger assessment guidelines, https://www.gov.uk/government/publications/merger-assessment-guidelines
