

1. Treat every synergy as a claim requiring a mechanism
A synergy claim should describe a causal mechanism rather than a desirable outcome. The statement that a combination will save procurement cost is incomplete until it identifies spend categories, addressable volume, supplier terms, specification constraints, contract dates, implementation actions and the portion expected to reach cash. The statement that cross-selling will accelerate growth is incomplete until it identifies eligible customers, product fit, sales capacity, conversion evidence, timing, churn effects and delivery cost.
The claim should carry one identifier from diligence through board approval and integration. Its record should include source evidence, baseline, counterfactual, owner, dependencies, costs, timing, accounting treatment, cash effect, risks and approval state. A versioned record prevents an early management estimate from silently becoming an approved value assumption after several presentation cycles.
Claims should be classified before aggregation. Capacity synergies change the productive use of assets, people, systems or channels. Cost synergies remove, avoid or reduce expenditure. Revenue synergies change volume, price, mix, retention or customer access. Capital and tax effects may follow from each category but should remain separately visible. Dis-synergies, stranded cost and value leakage require their own claims rather than being buried in a probability haircut.
Artificial intelligence can extract candidate claims from presentations, models, diligence reports and integration plans. The output should point to the source, preserve qualifications and remain subject to review. A generated summary without traceable evidence has no greater decision weight than the document from which it was produced.
2. Build a claim-level synergy evidence graph
The evidence graph connects each synergy to the facts and actions needed for it to occur. Nodes can represent contracts, spend lines, facilities, roles, products, customers, systems, regulatory conditions, integration milestones and cash-flow effects. Edges record the asserted relationship: consolidation enables repricing; migration enables decommissioning; customer consent enables cross-sell; capacity release enables avoided capital expenditure.
Every edge needs an evidence state. Useful states include verified record, management representation, adviser analysis, buyer assumption, unresolved dependency and superseded item. Evidence quality is not a cosmetic score. It determines whether a claim may support price, only a sensitivity, an integration option or no value at all.
The graph should expose shared dependencies. Ten separate savings may depend on one enterprise-resource-planning migration. Several revenue claims may require the same scarce sales-engineering team. Procurement, footprint and headcount claims may each count the same activity reduction. Machine-assisted graph analysis can flag these overlaps for human resolution before aggregation.
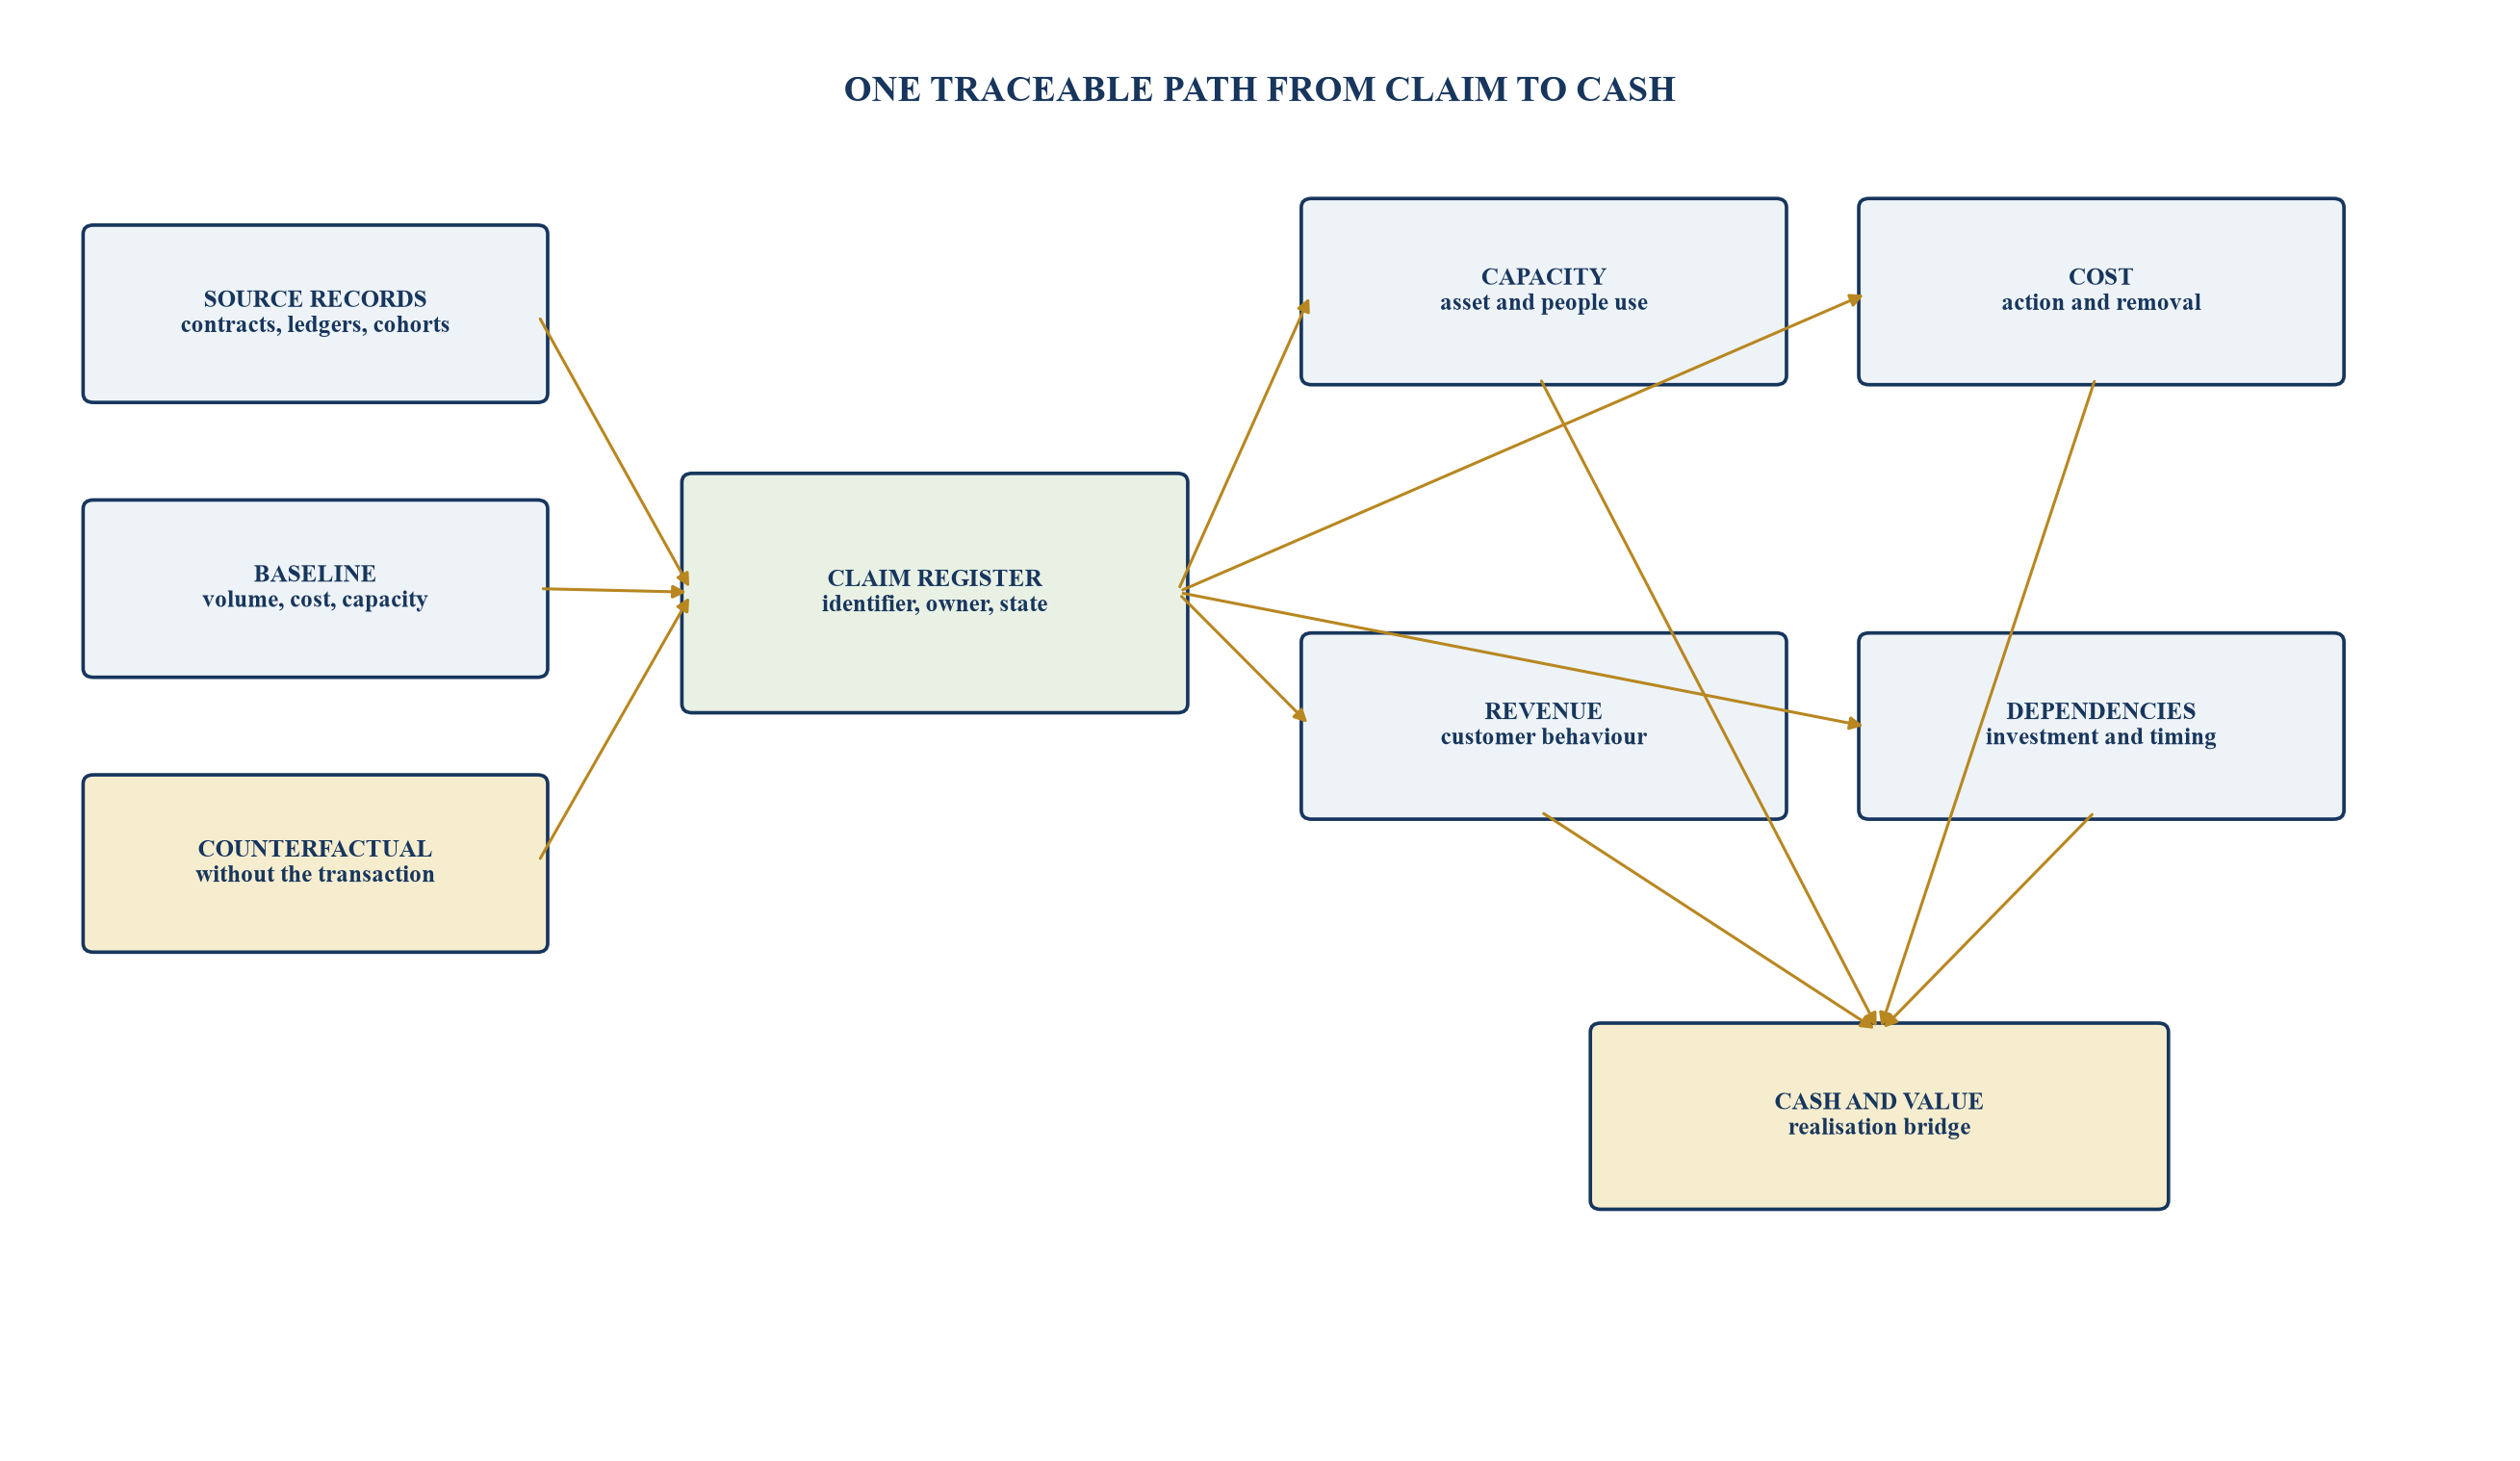
Each approved claim links evidence, operational mechanism, dependencies and cash effect.
Table 1. Minimum synergy-claim record
| Field | Required content | Control question | Accountable owner |
|---|---|---|---|
| claim | precise benefit and category | what changes because of the combination? | claim owner |
| baseline | current volume, rate, cost or capacity | is the starting point verified? | finance lead |
| counterfactual | credible outcome without the deal | is the benefit merger-specific? | strategy lead |
| mechanism | actions that create the benefit | can the causal path be executed? | operating lead |
| dependencies | systems, contracts, consent and resources | what can prevent or delay realisation? | integration lead |
| investment | one-time cost, capex and working capital | what must be funded first? | finance lead |
| timing | milestone, run-rate and cash dates | when does value become available? | programme lead |
| evidence state | source, date, owner and qualification | may the claim support the bid? | diligence chair |
A claim is decision-ready only when its evidence and operational path can be reconstructed.
3. Establish the baseline before estimating improvement
Synergy analysis is unreliable when the starting position is unstable. The buyer should reconcile actual revenue, cost, headcount, spend, capacity and cash measures to the financial and operating records used in diligence. Definitions should be consistent across both businesses. A role count, facility capacity or gross-margin measure can differ between management reports, statutory accounts and transaction models.
The baseline should distinguish current performance from a temporary condition. Vacancies, deferred maintenance, exceptional discounts, unusual inventory, capitalised development, supplier rebates and underused assets can distort the apparent opportunity. Normalisation needs evidence and should not convert an existing operational problem into merger value.
Seasonality and growth matter. A static annual figure may overstate spare capacity in a peak period or understate the resources required by the standalone plan. The baseline should therefore include volume drivers, service levels, utilisation, constraints and the investment already approved without the transaction.
4. Define a credible counterfactual and test merger specificity
The relevant comparison is the expected outcome without the acquisition. A saving that either company could achieve through normal procurement, restructuring, automation, outsourcing or commercial execution may still be valuable, but it is not created by the merger. Paying an acquisition premium for an available standalone action transfers value to the seller.
The counterfactual should include management plans, committed investments, current initiatives, market change and realistic strategic alternatives. It should identify which benefits require common ownership and which can be achieved through a contract, partnership, licence, joint venture or internal programme. The conclusion should be evidence-led rather than a general statement that integration will accelerate execution.
Competition authorities apply their own legal tests to efficiency claims. The June 2026 CMA guidance states that rivalry-enhancing efficiencies need to be timely, likely, sufficient, merger-specific and beneficial to UK customers. The European Commission's April 2026 draft guidance similarly emphasises verifiability and evidence. Transaction teams should keep regulatory efficiency analysis distinct from the buyer's valuation case while using a common source record where appropriate.
5. Separate capacity from cost reduction
Released capacity does not automatically reduce cost. Combining two distribution networks may create spare warehouse positions while leases, labour, systems and transport contracts remain fixed. Consolidating engineering teams may increase available hours while retention commitments and demand growth absorb the capacity. A capacity claim becomes a cost claim only when an executable action changes expenditure or avoids a funded future requirement.
Capacity analysis should measure the constrained resource and its usable output. Headcount is often an incomplete proxy. Productive hours, machine availability, throughput, queue time, sales coverage, compute consumption, occupancy and service-level capacity may better describe the operating mechanism. The analysis should locate bottlenecks because removing capacity outside the constraint can reduce resilience without creating value.
Avoided capital expenditure is a distinct pathway. A combined platform may defer a data-centre build, fleet purchase or software licence expansion. The model should state the approved standalone investment, timing, utilisation trigger, migration cost and residual capacity risk. A deferral has a different cash and value profile from permanent avoidance.
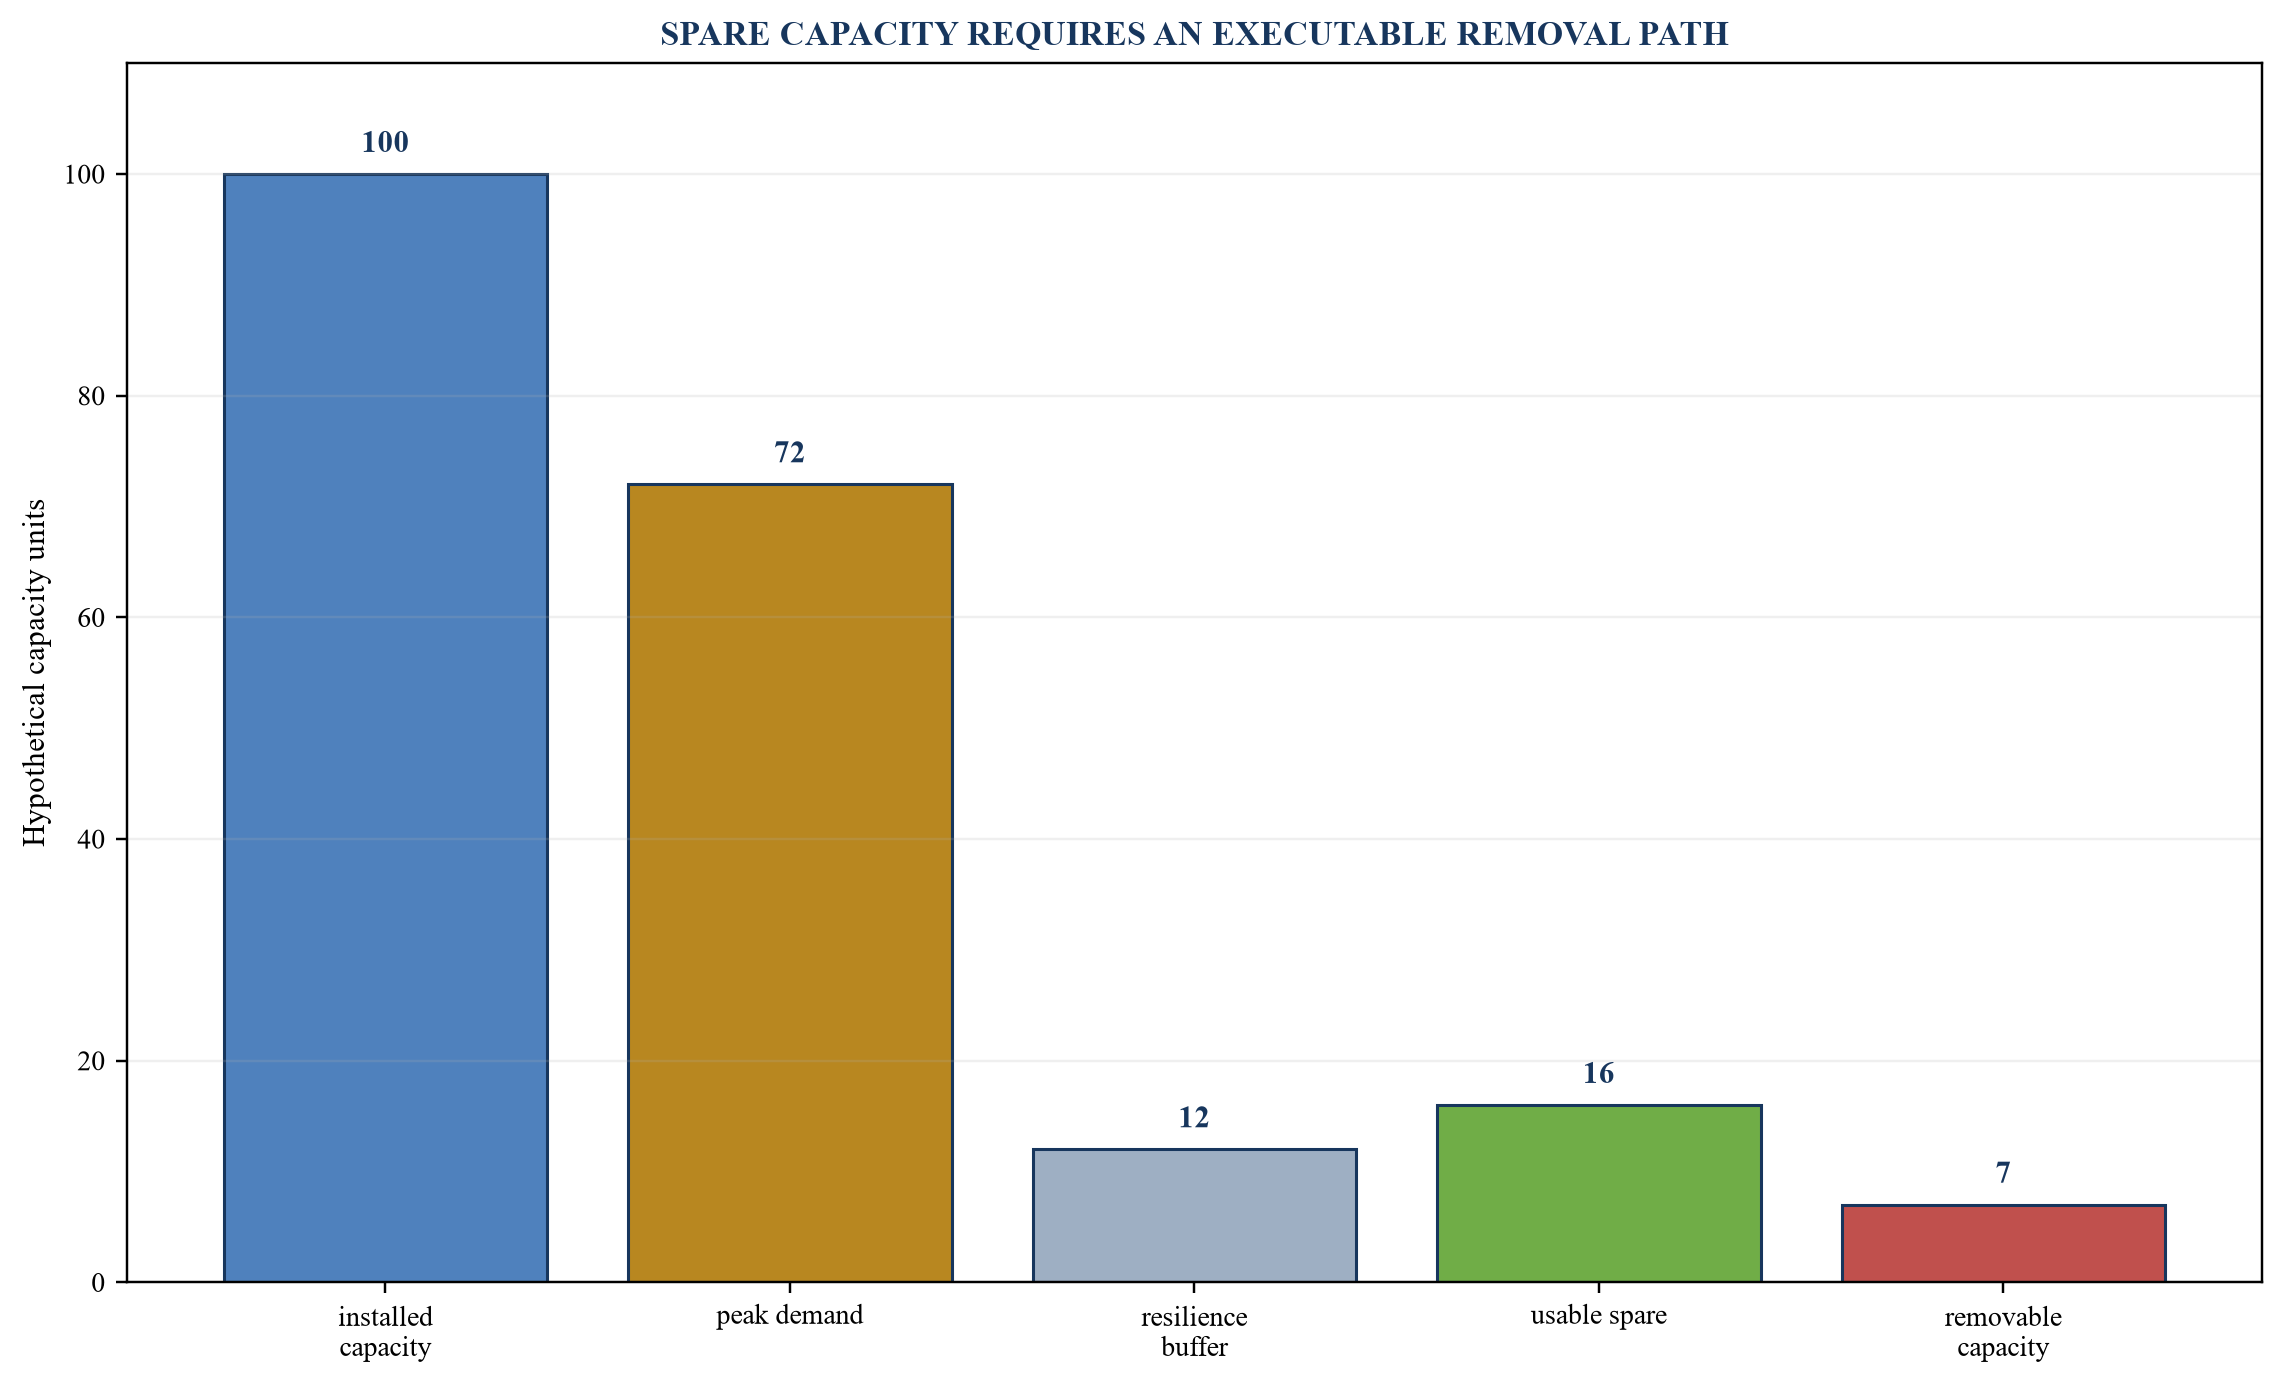
Hypothetical utilisation demonstrates why spare capacity and cash savings are different claims.
Table 2. Capacity-claim tests
| Capacity source | Evidence | Possible value path | Failure test |
|---|---|---|---|
| people | workload, skills, productive hours and service levels | redeployment or role removal | scarce skills or transition demand remain |
| facilities | throughput, occupancy, location and lease terms | consolidation or avoided expansion | bottleneck, exit cost or customer proximity |
| technology | consumption, licences, architecture and migration | decommissioning or unit-cost reduction | dual-running or contractual minimums |
| sales channel | account coverage, pipeline and conversion | cross-sell capacity or avoided hiring | incentives, conflicts or customer overlap |
| working capital | cycle time, inventory and supplier terms | cash release | service risk or volume growth absorbs release |
| resilience | redundancy, recovery requirement and incidents | protected value | removal breaches risk tolerance |
The same capacity opportunity can support cost removal, growth, resilience or avoided investment.
6. Underwrite cost synergies as actions, not percentages
Cost synergies should be constructed from executable actions at account, contract, role, site or process level. A top-down percentage of selling, general and administrative expense can be used as a reasonableness check, but it does not establish feasibility. The claim register should identify the owner, notice period, consultation requirement, severance, lease exit, supplier negotiation, system dependency and service risk for each action.
Gross and net savings should remain distinct. Gross savings are reduced or avoided expenditure before implementation cost and leakage. Net run-rate benefit subtracts recurring replacement cost. Cash benefit also subtracts one-time cost, capital expenditure, working capital and tax at the relevant dates. Integration resources should not be counted both as a temporary cost and a permanent role reduction.
Timing should follow the operational milestone rather than a presentation convention. A contract saving begins when revised terms become effective. A role saving begins when work has been transferred and cost exits. A site saving begins after operational transfer and lease resolution. Phasing should show ramp, delay risk and the point at which the action is sustainable.
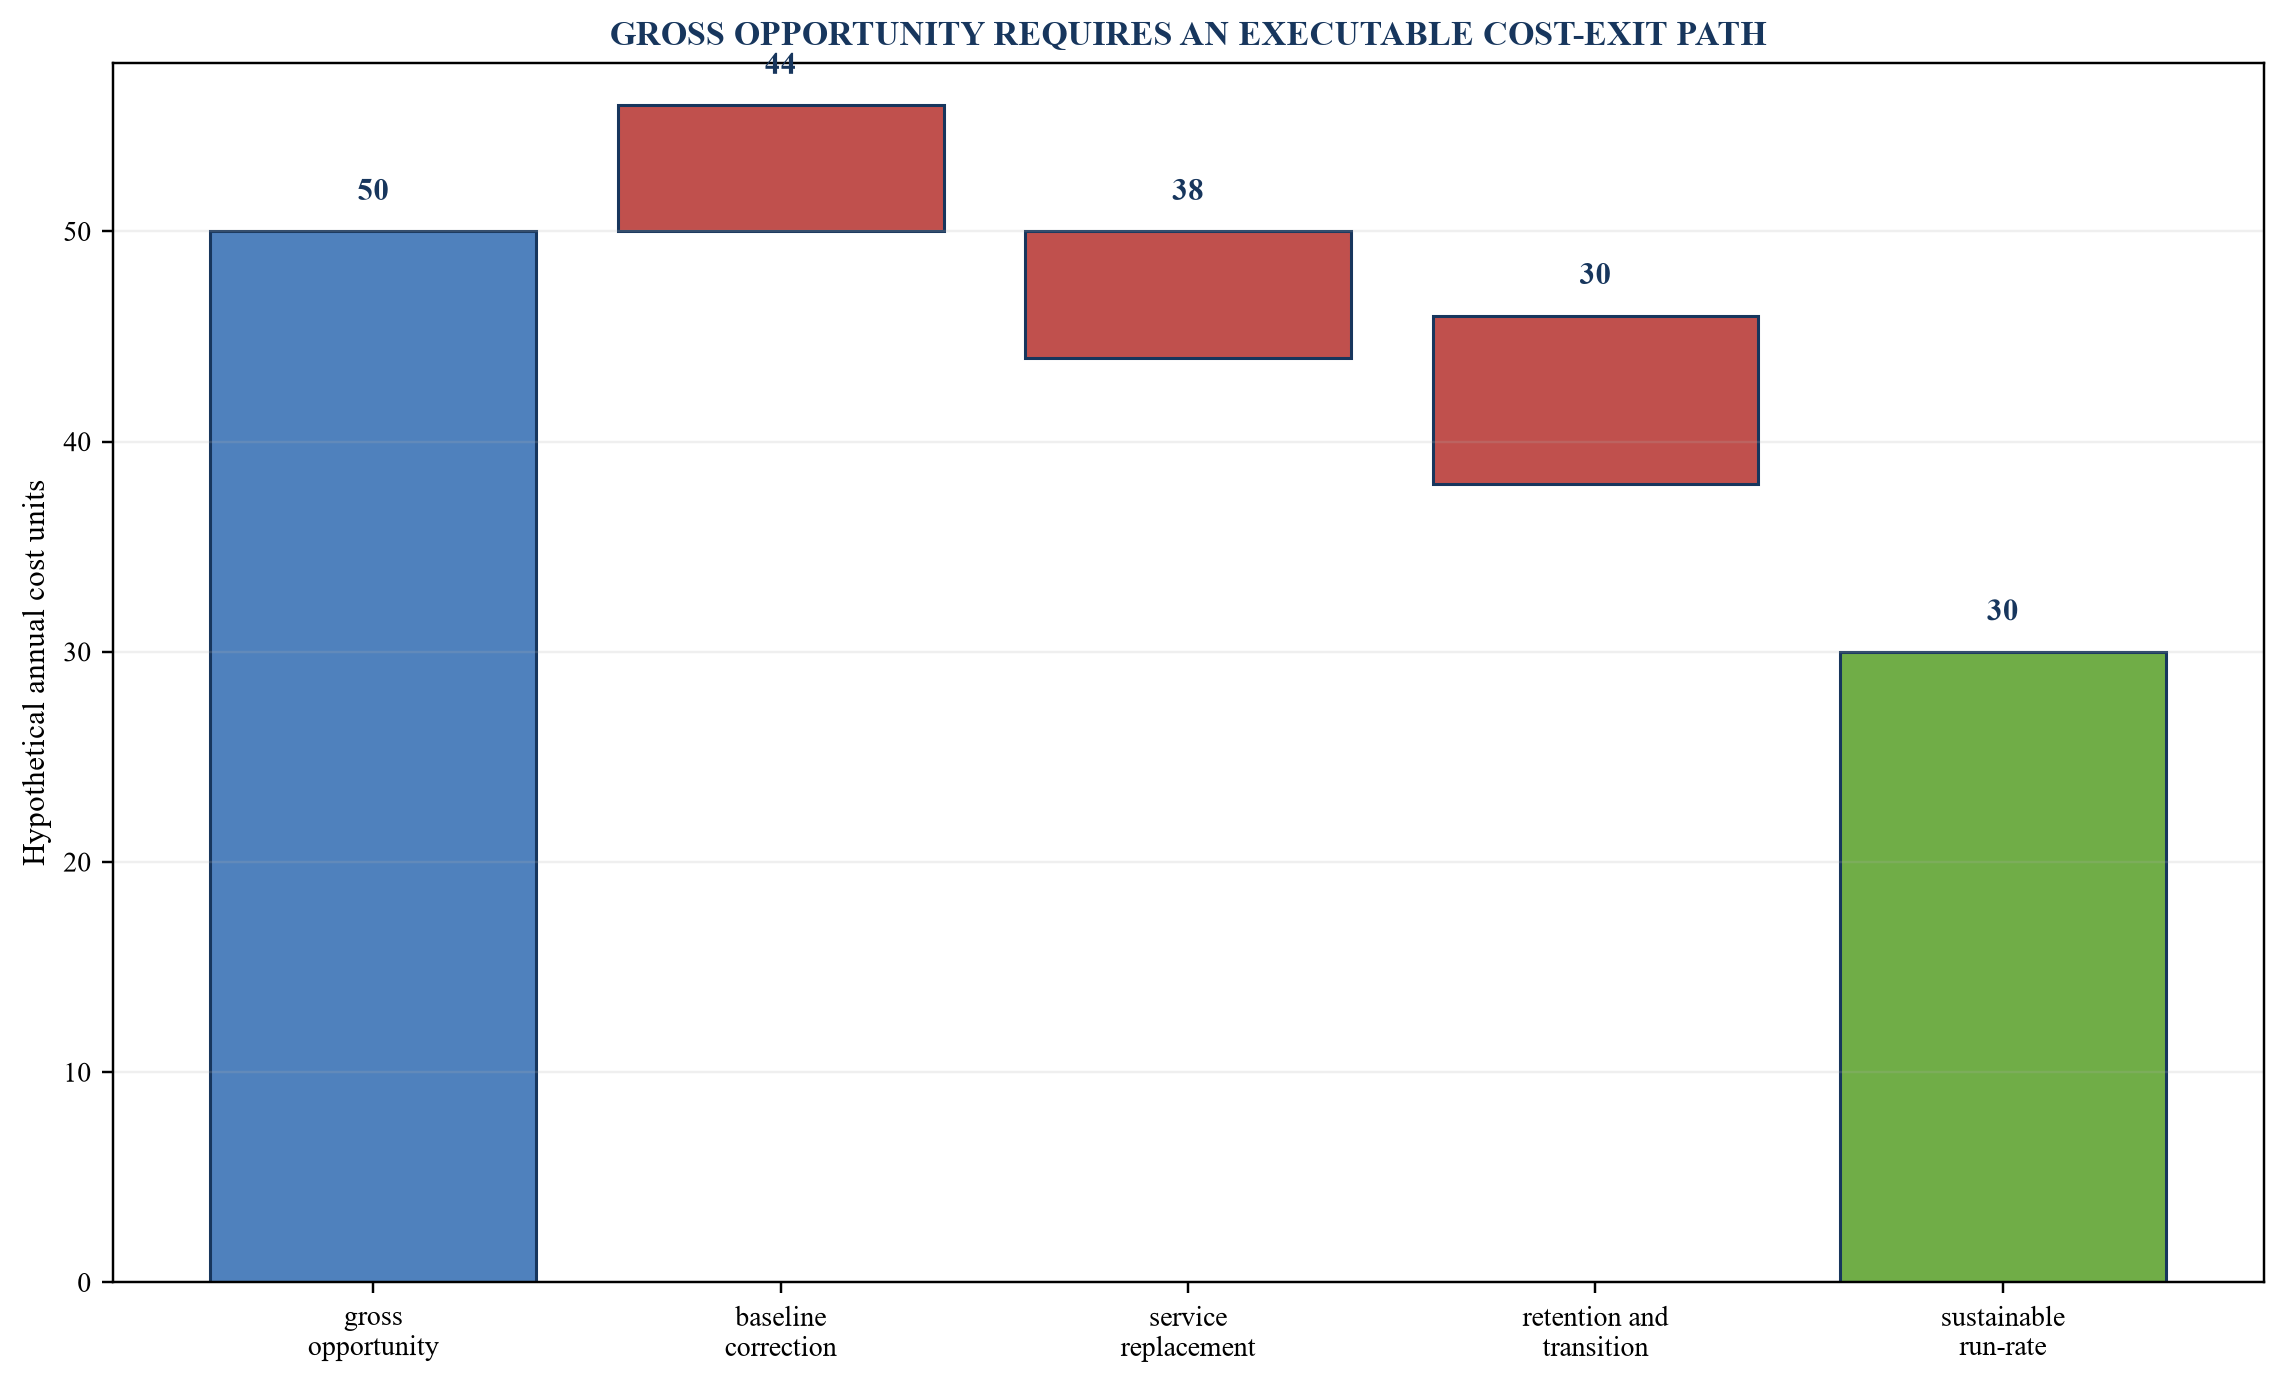
Hypothetical values show the deductions required before a cost claim becomes sustainable.
7. Detect double counting across workstreams
Synergy programmes often divide work by function while value drivers cross functional boundaries. Procurement may count lower external spend after insourcing. Operations may count the same insourcing as productivity. Technology may count system consolidation that enables the operating change. Finance may then apply a general overhead reduction to the remaining cost base. Without claim-level lineage, one mechanism can appear several times.
Machine-assisted matching can compare descriptions, source accounts, cost centres, suppliers, roles, facilities, timing and dependencies. Similarity is a review trigger rather than proof of duplication. Two claims may share a source and remain additive, while differently worded claims may be the same economic action.
The control process should assign an economic owner for every baseline amount and prohibit aggregation until overlaps are resolved. The model should also prevent a standalone plan improvement, purchase-price adjustment and synergy from claiming the same benefit. Every accepted reconciliation needs a recorded rationale.
8. Test procurement savings against contract and specification reality
Procurement synergy requires more than combined spend. The businesses may buy different specifications, service levels, geographies, currencies, volumes or risk allocations. Supplier agreements can include minimum commitments, change-of-control rights, rebates, exclusivity, indexation, termination cost and price reopeners. Addressable spend should therefore be built at category and contract level.
The analysis should separate price, specification, compliance, demand and process effects. Lower price from volume concentration differs from reduced consumption after operational redesign. Standardisation may require product qualification or customer approval. Changing a critical supplier may increase concentration and working-capital exposure. The synergy case should show these effects rather than assume the lowest observed unit price applies to all volume.
Supplier negotiation is uncertain before commitment. The buyer can model a range supported by benchmarks and prior outcomes, while avoiding statements that imply an unagreed concession. The realisation gate should require executed terms, measurable consumption and finance confirmation of invoice or accrual effects.
9. Rebuild labour claims around work and capability
Role overlap is not a complete labour-synergy mechanism. The buyer should map recurring work, regulatory duties, customer obligations, spans of control, scarce capability, location, employment terms and integration demand. Removing an organisational box before the work is transferred can create service failure, control weakness or expensive rehiring.
The capacity model should distinguish eliminated work, automated work, transferred work and deferred work. Automation requires process design, data, testing, controls, adoption and exception handling. A machine-generated productivity assumption has no value without workflow evidence and an accountable operating design.
Retention and severance can change both cost and timing. Key employees may hold customer, product, regulatory or system knowledge needed for integration. The model should show the period of overlap, retention cost, notice, consultation, transition service and the date at which recurring cost can exit safely.
10. Treat technology consolidation as a dependency network
Technology savings can include licences, cloud consumption, infrastructure, support, vendors and internal teams. They can also require data migration, cyber controls, regulatory approval, customer communication, dual running and decommissioning evidence. The economic case should connect each saving to its architecture decision and migration milestone.
Licence savings should be based on contractual units and commitments. Enterprise agreements may contain minimum spend, renewal dates, assignment limits and bundled products. Cloud savings depend on workload design, data movement, reserved capacity, egress, resilience and accepted performance. A lower headline unit cost can be offset by migration, observability, security and support.
AI can assist code, contract and configuration analysis, subject to access and verification. It should not declare systems equivalent or safe to retire. The accountable technical and business owners need evidence that required functions, data, controls and recovery arrangements have transferred before cost removal.
11. Underwrite revenue synergies by customer cohort
Revenue synergy is a customer-behaviour claim. The buyer should identify the eligible customer population, unmet need, product fit, commercial right, route to market, sales capacity, price, conversion, timing, retention and incremental delivery cost. A combined customer list does not demonstrate demand, and an addressable-market estimate does not demonstrate access.
Cohort analysis should separate existing customers of each party, shared customers, prospects and new segments. It should test contractual restrictions, channel conflict, brand, geography, product readiness and customer concentration. Historical conversion and retention can inform the range, while the merger may change behaviour in ways the historical data does not capture.
Revenue, gross profit, cash and value need separate bridges. Additional sales can require commissions, implementation, inventory, support, capex and working capital. Cannibalisation, discounting and churn can offset the headline uplift. The model should show contribution margin and cash conversion rather than apply an enterprise multiple to gross revenue.
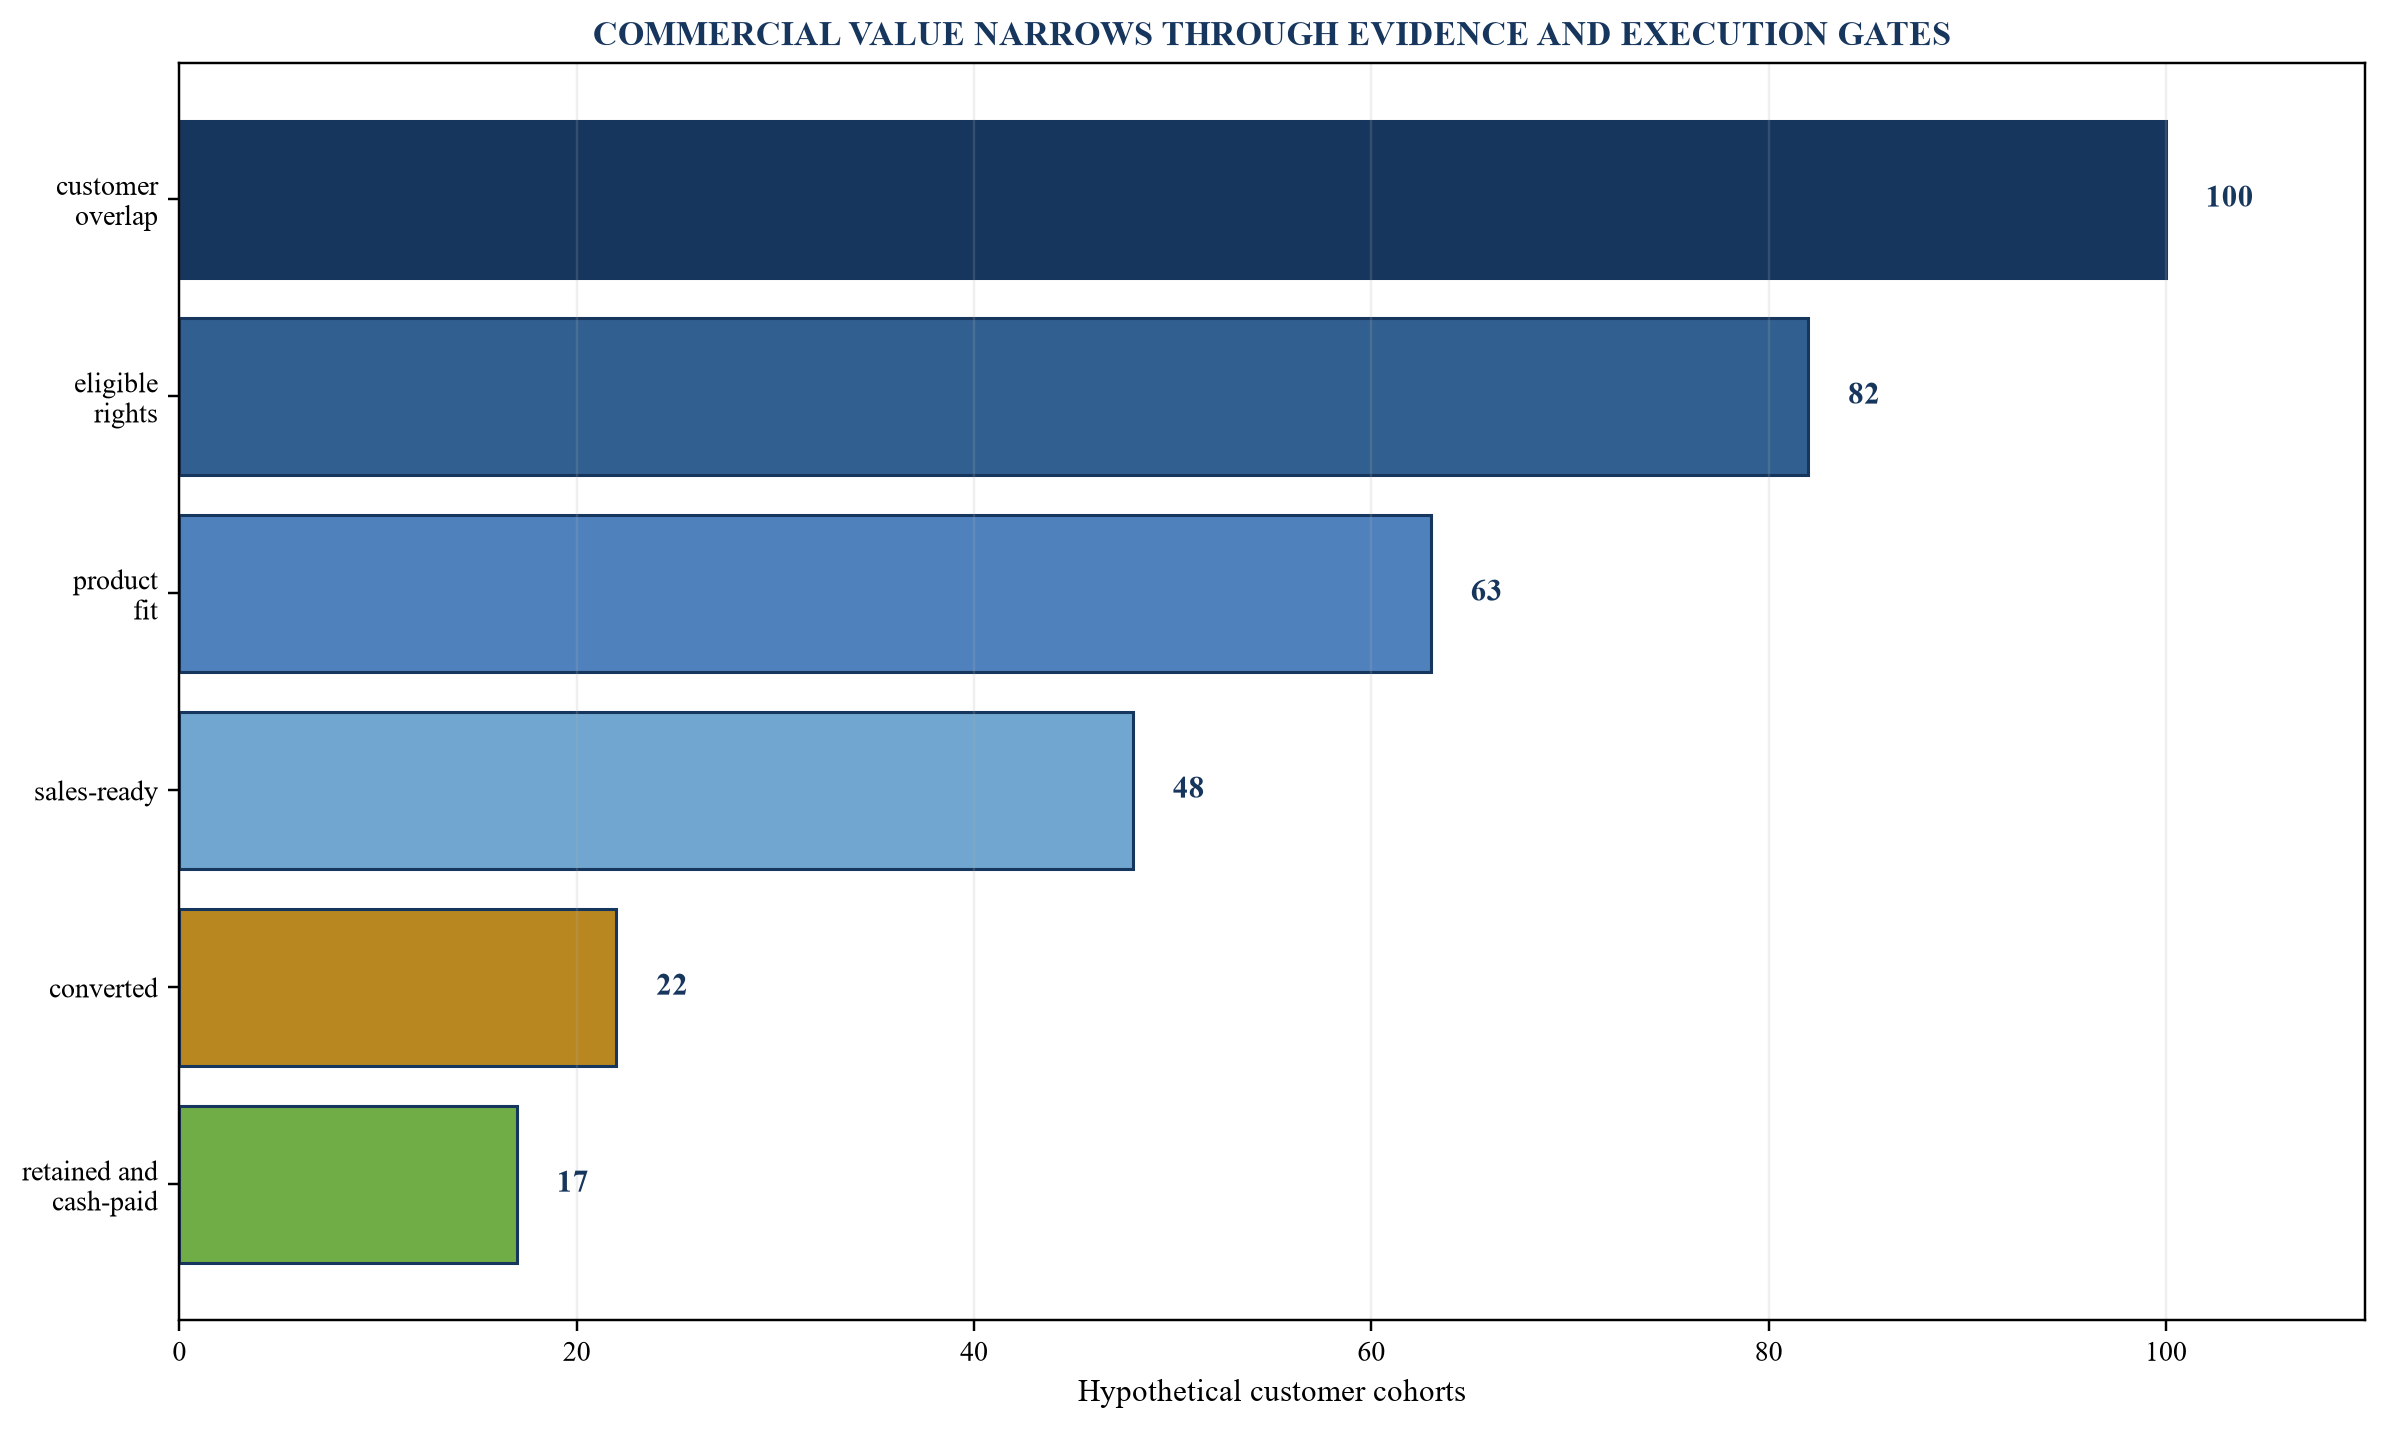
Hypothetical cohorts show the attrition from theoretical overlap to cash-converting customers.
Table 3. Revenue-synergy cohort test
| Test | Evidence | Model effect | Stop condition |
|---|---|---|---|
| customer access | contracts, consent, channels and account ownership | eligible cohort | prohibited or inaccessible accounts |
| product fit | use case, capability, roadmap and service capacity | conversion range | product or delivery gap |
| willingness to buy | interviews, pilots, pipeline and comparable outcomes | price and probability | no customer evidence |
| sales execution | coverage, incentives, training and cycle time | timing and cost | channel conflict or insufficient capacity |
| gross margin | price, delivery, support and variable cost | contribution profit | uneconomic service burden |
| retention | adoption, outcomes, renewal and churn | durable revenue | displacement or customer loss |
| cash conversion | billing, collection and working capital | realised cash | funding need exceeds value |
A revenue claim proceeds only when access, need, delivery and economics are evidenced together.
12. Link every claim to implementation investment
Synergies are frequently presented before the cost of realisation is fully designed. The claim register should include programme resources, severance, retention, advisers, migration, data remediation, contract exit, facility work, customer communication, capex, training, dual running and contingency. Costs should be dated and allocated to the claims they enable.
Shared investments need explicit allocation. One platform migration may enable several technology, labour and revenue benefits. Allocating all cost to one claim overstates the others; omitting it from each claim overstates the programme. The model can show both stand-alone claim economics and the portfolio decision around a shared dependency.
Funding and liquidity can become binding before benefits arrive. The acquisition model should connect implementation cash to debt capacity, covenants, minimum liquidity and equity requirement. A synergy case that improves an exit multiple but creates an unfunded integration period is incomplete.
13. Reconcile run-rate, accounting benefit, cash and value
Run-rate is the annualised effect at a selected operating state. It does not state when the benefit begins, how much cash has been received, whether the action is sustainable or how much was spent to create it. The diligence model should bridge gross run-rate to net recurring benefit, reported profit, cash and present value.
Accounting classification requires qualified analysis. Restructuring, acquisition, integration and ongoing operating costs can have different recognition and disclosure consequences. IFRS 3 governs acquisition accounting, while IAS 36 addresses impairment testing and the performance of cash-generating units. Transaction teams should avoid using an adjusted presentation as a substitute for the applicable reporting framework.
Value should reflect timing, tax, risk, reinvestment and sustainability. A late, volatile revenue synergy deserves a different treatment from a contracted cost saving. The valuation case should show ranges and avoid counting the same benefit in standalone cash flow, synergy, terminal assumptions and exit multiple.
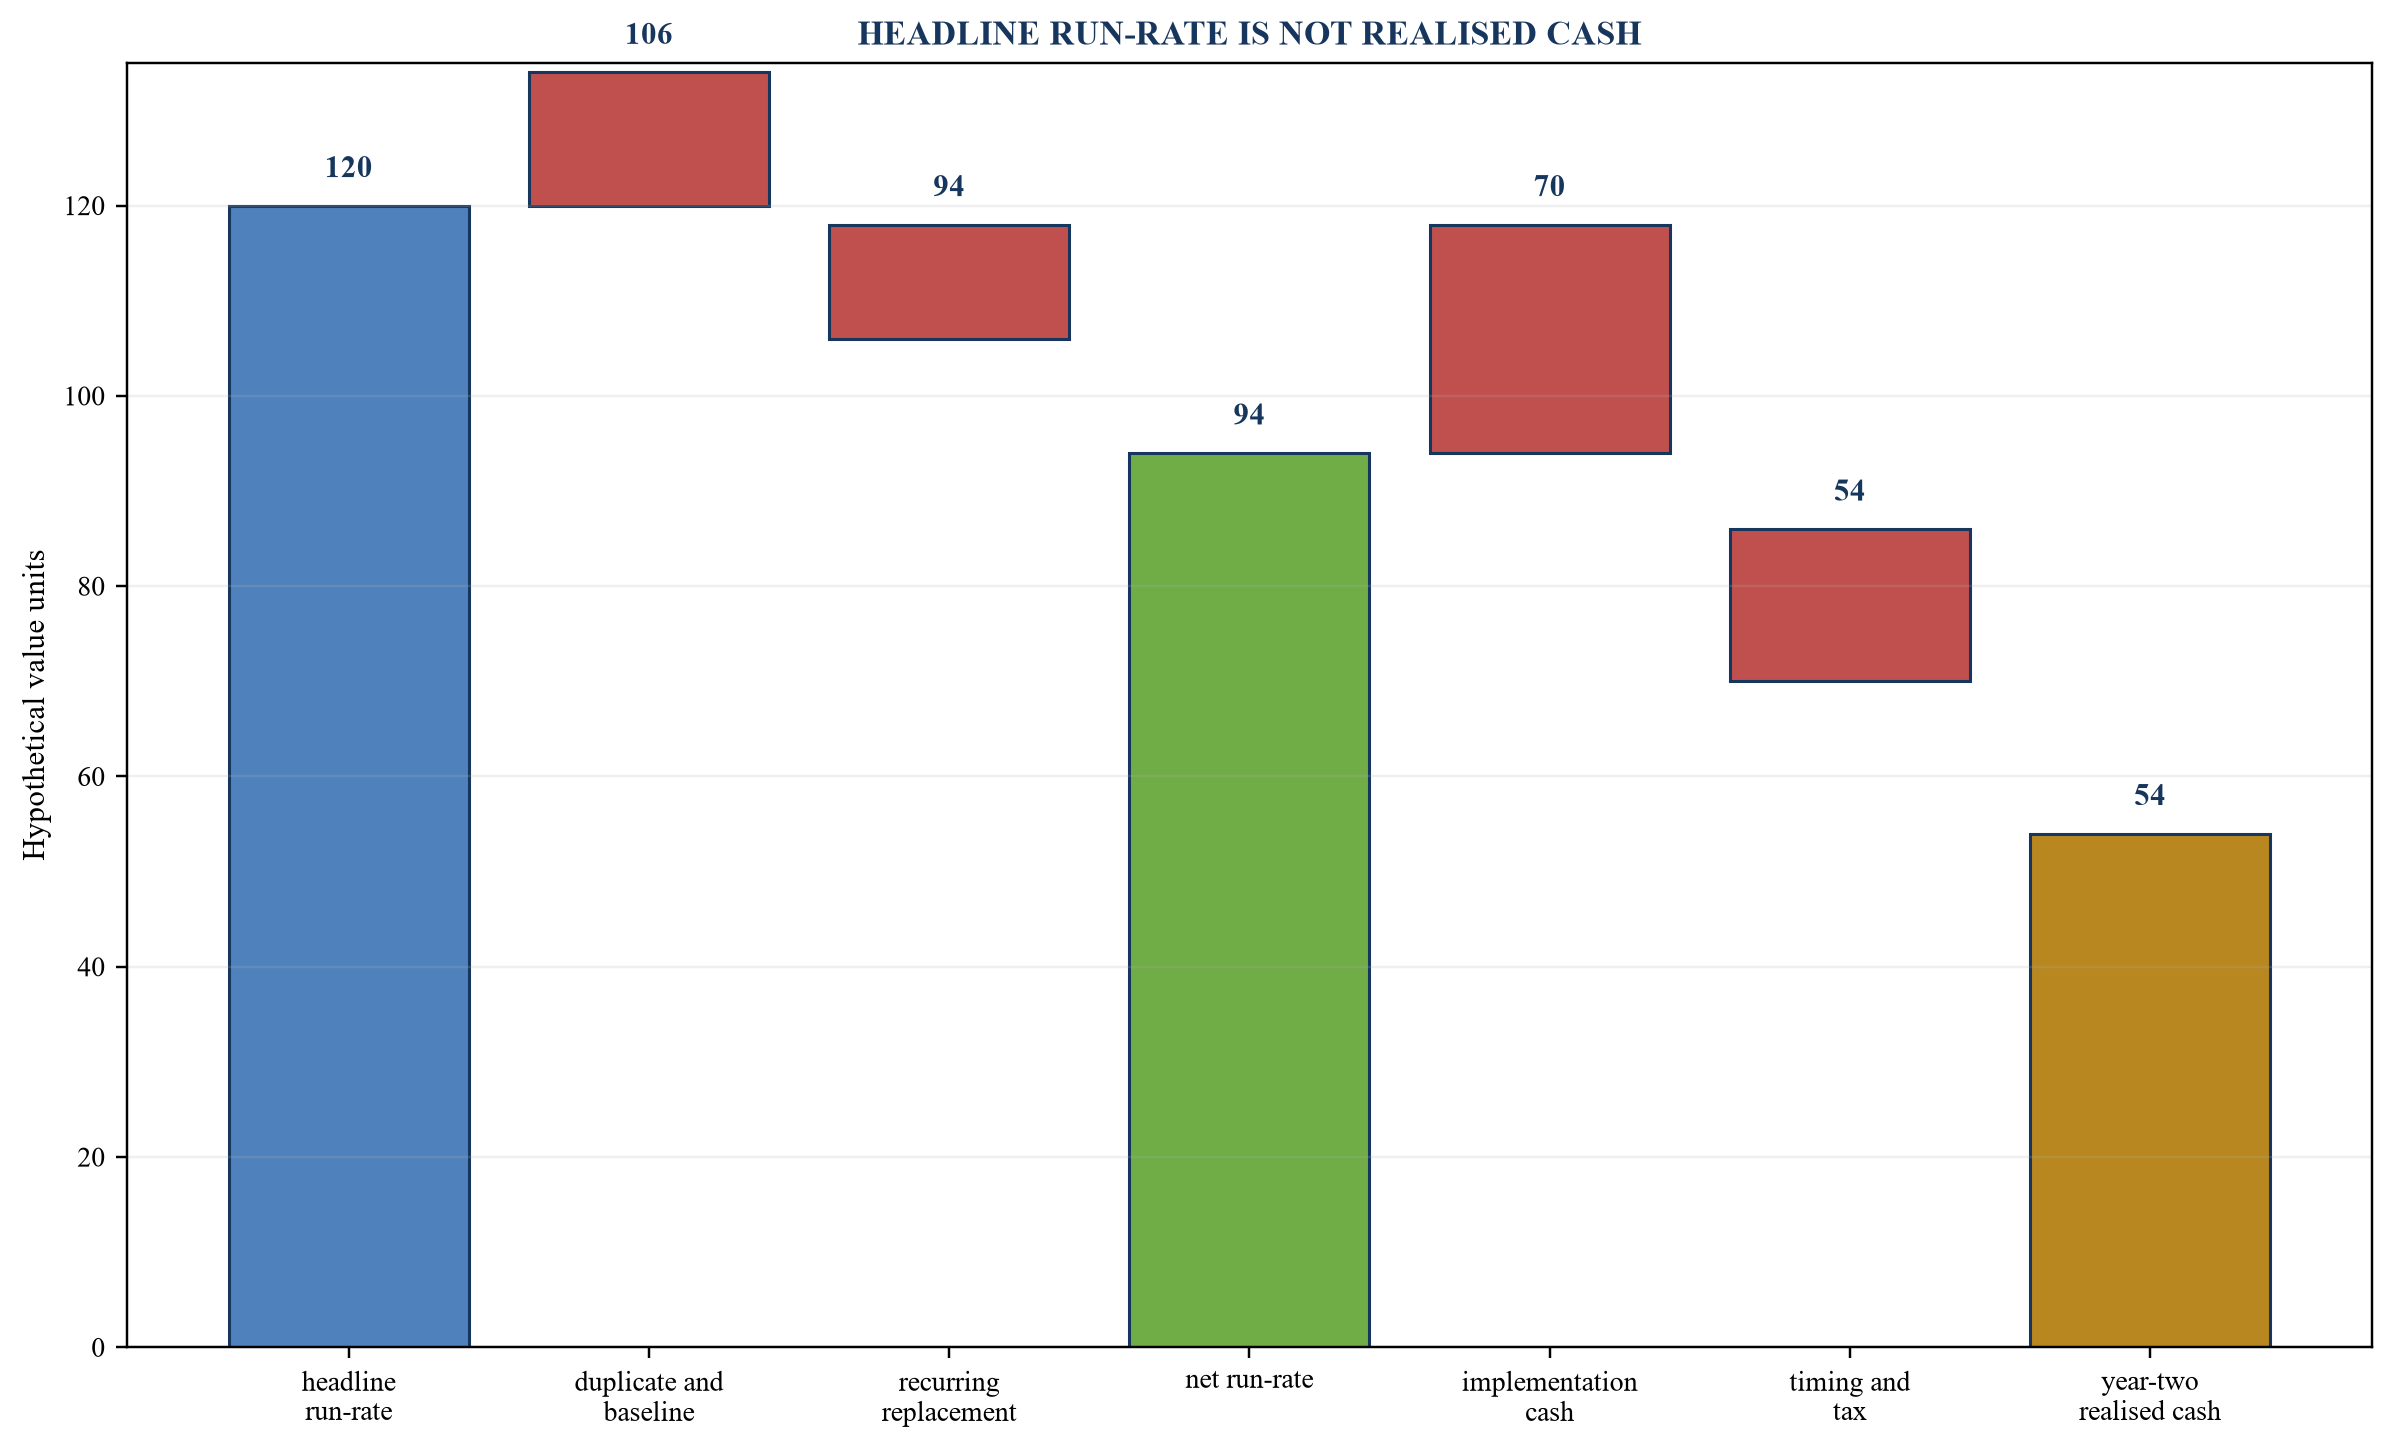
Hypothetical values distinguish gross claim, recurring benefit, implementation cash and realised value.
14. Make timing evidence-led
The timing model should begin with operational gates: contract effective date, role transition, system release, customer approval, site closure, product launch or collection. Percentage phasing by quarter may be useful after these gates are established, but it should not replace them.
Dependencies create correlated delay. A data migration can postpone licence retirement, process automation, headcount action and cross-selling at once. Independent probability haircuts across those claims understate concentration. Scenario analysis should therefore test coherent programme states rather than thousands of unrelated claim permutations.
The board should see value at risk by milestone and the funding required during delay. A postponement can add dual-running cost, interest, retention expense and customer leakage. The integration plan should state the decision available when a milestone fails: remediate, resequence, resize, renegotiate or retire the claim.
15. Distinguish risk reduction from probability multiplication
A blanket probability applied to a headline synergy pool can hide the reason a claim may fail. The diligence record should identify evidence risk, execution risk, dependency risk, customer risk, regulatory risk and sustainability risk. Each risk should have a proposed response and a residual exposure.
Some uncertainty is better handled through conditions and staged authority than a numerical haircut. The buyer may exclude a claim from price, fund a pilot, require customer evidence, preserve a contractual right or release investment after a milestone. A probability is useful only when its basis and affected cash flow are clear.
Portfolio aggregation should preserve tail risk. Several claims may fail together because they depend on the same platform, leader, regulator, supplier or customer response. The downside case should show these common causes and their effect on leverage, liquidity, returns and integration capacity.
16. Use machine assistance within a controlled evidence process
Machine assistance can extract claim language, locate sources, compare model versions, classify dependencies, match duplicates and prepare reconciliation packs. It can also search for internal contradictions, such as a headcount saving that conflicts with a capacity plan or a revenue claim that relies on a product marked for retirement.
The service should operate on approved data with access groups, logging, retention and source citation. Transaction information may contain personal data, competitively sensitive material, inside information, legal advice and lender terms. Clean-team and privilege protocols should govern the environment and the permitted outputs.
Every machine-produced finding should be reproducible. The record should contain the source location, extraction method, model or rule version, reviewer, correction and final disposition. A confidence score cannot replace review of a claim that changes price, funding or public disclosure.
NIST's AI Risk Management Framework and Generative AI Profile provide voluntary risk-management structures that can inform governance, mapping, measurement and management. Transaction-specific controls should reflect the buyer's systems, legal duties, risk tolerance and decision rights.
17. Test management incentives and adviser independence
Synergy estimates can be influenced by the desire to win an auction, obtain board approval, justify a premium or preserve a transaction rationale. Integration leaders may inherit targets they did not design. The diligence process should disclose claim sponsors, compensation links, prior forecasts and conflicts.
Challenge should be structured. Operating owners should confirm feasibility; finance should test baseline, cash and accounting; technology should confirm dependencies; human resources should assess employment and retention; legal and regulatory advisers should address applicable requirements. The transaction sponsor should retain responsibility for the aggregate case.
An independent expectation or range can expose unsupported assumptions. PCAOB AS 2501, which governs audits of accounting estimates, is not a transaction-synergy standard; its emphasis on methods, data, assumptions and evidence provides a useful analogy for disciplined estimate review. The paper's framework remains a commercial diligence tool rather than an audit opinion.
18. Connect synergy diligence to competition analysis without conflation
The buyer's valuation case and a regulator's efficiency analysis answer different questions. A private cost saving may improve returns without benefiting customers or changing competition. A regulatory efficiency claim may need to be merger-specific, verifiable, timely, likely, sufficient and connected to customer benefit under the applicable regime.
The CMA's June 2026 guidance states that many merger efficiency claims are not accepted because supporting evidence is difficult to verify and substantiate. The European Commission's April 2026 draft guidelines similarly call for a cogent and consistent evidence base and robust quantification where reasonably possible. US agency guidelines also emphasise reliable methodology and evidence beyond subjective predictions.
The synergy register can support regulatory work by preserving contemporaneous plans, operational mechanisms and evidence. Counsel should control the legal analysis and submission. Commercial teams should not label a value claim as a cognisable efficiency without transaction-specific advice.
19. Convert diligence into pricing and financing decisions
The approved transaction model should separate synergy excluded from price, synergy supporting price, synergy retained by the buyer and strategic option value. It should state which claims influence lender earnings, debt capacity or covenant calculations. Lender treatment may differ from the buyer's valuation treatment.
Financing sensitivity should include delays, implementation cash, minimum liquidity and the loss of correlated claims. A cost synergy may improve earnings after the period in which acquisition debt is most exposed. A revenue synergy may consume working capital. The sources-and-uses case should therefore remain viable before uncertain benefits.
Contractual protection rarely guarantees a synergy. Covenants, conditions, price mechanisms, earn-outs and transition arrangements can preserve specific rights or allocate risk. Their value depends on drafting, enforceability, timing and counterparty resources. Residual exposure should return to the approval body.
20. Apply a claim-readiness gate before final approval
Each claim should receive a decision state: evidenced and underwritten; accepted as a sensitivity; retained as an integration option; excluded pending evidence; or rejected. The gate should consider baseline, counterfactual, mechanism, dependencies, investment, timing, cash, risk and owner acceptance.
The approval pack should reconcile every change since the prior review. A headline synergy number can remain unchanged while its composition becomes materially riskier. The pack should show claims added, removed, delayed, resized or reclassified and their effect on price, financing, returns and liquidity.
Hard conditions should remain visible. The buyer may require minimum standalone value, funding headroom or customer evidence regardless of aggregate expected synergy. Walking away or reducing price is a valid output when the transaction relies on claims that cannot be reconstructed or funded.
Table 4. Synergy-claim readiness gates
| Gate | Pass evidence | Permitted treatment | Failure response |
|---|---|---|---|
| baseline | reconciled operating and financial source | quantify improvement | rebuild or exclude |
| counterfactual | approved standalone path | test merger specificity | classify as standalone action |
| mechanism | named actions and owners | underwrite execution | retain as option |
| dependency | systems, contracts, people and approvals mapped | phase benefit | scenario or condition |
| investment | funded one-time and recurring cost | calculate net cash | close funding gap |
| customer | access, need and economics evidenced | include revenue range | exclude from price |
| cash | dated bridge from action to collection | value the claim | sensitivity only |
| authority | decision fits approved mandate | aggregate into case | escalate or reject |
The gate determines how a claim may enter the transaction case.
21. Worked example: a hypothetical industrial-technology acquisition
Assume a buyer evaluates a target with a headline synergy estimate of 120 hypothetical currency units. The initial case includes 52 of cost savings, 28 of capacity and avoided investment, and 40 of revenue contribution. These figures are analytical assumptions and do not represent observed company data.
The claim-level review finds 14 of overlap and baseline inconsistency. A platform migration is a common dependency for technology, process and labour claims. Contract analysis delays part of procurement savings. Customer-cohort testing narrows the addressable revenue population and identifies working-capital and implementation needs.
The revised net run-rate becomes 94. Implementation cash and transition cost total 24, and timing and tax reduce year-two realised cash to 54. The downside case assumes the platform migration is delayed, lowering year-two cash to 39 and increasing minimum liquidity needs. The transaction committee retains some upside as an integration option rather than paying for it in the bid.
The example demonstrates that diligence does not merely reduce the number. It changes the composition, timing, funding and authority attached to each claim. The accepted case is easier to operate because it states the evidence, owner and milestone required for realisation.
Table 5. Hypothetical synergy-diligence decision bridge
| Category | Initial run-rate | Revised run-rate | Year-two cash | Decision treatment |
|---|---|---|---|---|
| procurement and external spend | 24 | 19 | 12 | include with contract milestones |
| labour and operating model | 28 | 22 | 13 | phase after work transfer |
| capacity and avoided investment | 28 | 24 | 16 | separate deferral from avoidance |
| revenue contribution | 40 | 29 | 13 | exclude uncertain cohorts from price |
| total | 120 | 94 | 54 | test funding and correlated downside |
Illustrative assumptions show the movement from headline claim to decision treatment.
22. Transfer the claim register into integration
Completion should not replace the diligence model with a new programme spreadsheet. The integration office should inherit the claim identifiers, baselines, evidence, dependencies, investment, timing and decision history. Operating owners can refine execution while preserving the approved value logic.
Realisation reporting should distinguish action completed, run-rate achieved, accounting effect, cash received and value sustained. The report should show gross benefit, recurring replacement cost, integration cash, tax, working capital and leakage. It should also record claims retired or created after close without rewriting the original decision record.
Post-close review should compare the evidence and assumptions available at approval with observed performance. Variances should distinguish diligence error, baseline error, execution failure, external change and deliberate strategic choice. This classification can improve future synergy underwriting without treating every later outcome as proof that the original decision was reasonable or unreasonable.
23. Limitations and research agenda
The framework cannot replace transaction-specific legal, regulatory, tax, accounting, valuation, financing or audit work. Synergy mechanisms vary across industries, jurisdictions, transaction structures and operating models. Data quality, access, seller cooperation and auction timing can constrain the available analysis.
Machine assistance can omit context, extract values incorrectly, confuse versions, disclose restricted information or generate unsupported relationships. Its outputs require source lineage, evaluation, access control and accountable review. The worked example and exhibits are hypothetical and should not be treated as forecasts or benchmarks.
Further research should compare claim-level evidence quality with post-close cash realisation across controlled samples, examine correlated dependency failure and test whether machine-assisted lineage reduces duplication or merely accelerates document handling. Useful outcome measures include forecast error, cash timing, protected value and collected transaction benefit.
24. Design clean-team and confidentiality controls around the claim graph
Synergy diligence can require competitively sensitive information before completion. Customer-level pricing, forward product plans, supplier terms, individual compensation and facility capacity may create legal, commercial and privacy risk if combined or shared too broadly. The information design should follow the transaction's clean-team, antitrust, data-protection and privilege protocols.
The claim graph should store access classification at source and derived-output level. An aggregated conclusion may be distributable even when the underlying record remains restricted. Machine services should inherit the same boundary, avoid training on transaction material unless expressly approved, and log retrieval, generation, export and correction. Combining restricted sources into an unrestricted prompt can defeat the purpose of the clean team.
The timetable should allow counsel and data owners to approve collection, analysis and release. When evidence cannot be shared with the deal team, the clean team can provide a bounded finding, range or exception. The transaction committee should know how the information constraint affects confidence without receiving prohibited detail.
25. Test operational resilience before removing redundancy
Duplicate resources can represent waste, resilience or both. Two data centres, suppliers, teams or distribution routes may protect service continuity, recovery, geographic access or regulatory compliance. A cost model that removes redundancy without valuing the protected outcome can create a saving on paper and a larger exposure in operation.
The capacity test should identify required recovery time, recovery point, peak demand, maintenance, supplier failure, cyber incidents and contingency obligations. It should distinguish redundant capacity that exceeds risk tolerance from capacity needed to meet an approved resilience standard. Insurance and contractual remedies may reduce exposure while rarely replacing operational continuity.
The claim owner should document the new control design, testing evidence and residual risk before cost exits. If the combination enables a stronger shared resilience architecture at lower cost, the model should show the investment and transition path. A temporary period of dual running can be an implementation requirement rather than a failed synergy.
26. Separate purchasing power from productive efficiency
A lower input price can arise from operational efficiency, volume consolidation or increased bargaining power. These mechanisms have different sustainability, supplier and competition effects. The buyer should identify whether the saving reflects reduced consumption, improved specification, process change, alternative sourcing or a transfer of margin from a constrained supplier.
The commercial model should test supplier concentration, financial health, quality, innovation, lead time and working-capital terms. A price reduction accompanied by longer payment terms may improve reported cost while transferring cash stress to the supply chain. A single-source award may lower unit price and increase disruption exposure. The claim should show the complete economic and risk effect.
Regulatory efficiency analysis may exclude savings derived from anticompetitive reductions in output, quality or purchasing conditions. Counsel should assess the applicable framework. The buyer's internal case should remain transparent about the mechanism so that price, integration and regulatory work do not rely on inconsistent descriptions.
27. Challenge revenue claims for cannibalisation and customer loss
The merged company may gain access to products and customers while losing neutrality, channel support or competitive tension. A distributor may resist selling a supplier-owned product. Customers may diversify spend after a combination. Bundling can improve convenience for one cohort and reduce choice for another. Revenue diligence should therefore model loss as well as uplift.
The cohort record should identify product overlap, migration, pricing, contract change, sales incentives and decision-makers. It should test whether the combined offer solves a customer problem and whether the customer has an incentive to accept. Customer research needs appropriate controls and should avoid disclosing the proposed transaction or competitively sensitive strategy without authority.
The model should reconcile cross-sell, churn, cannibalisation, discount and cost to serve at customer or segment level. A revenue claim can remain an integration option when evidence is insufficient for price. The integration team can then run controlled pilots and release investment after observed conversion rather than carrying a board target unsupported by demand.
28. Incorporate tax, working capital and currency into cash realisation
Synergy presentations often use pre-tax annual figures while transaction value depends on after-tax, dated cash. The model should identify the jurisdiction, legal entity, deductibility, withholding, losses, indirect tax and transfer-pricing effects relevant to each claim, using qualified advice. A cost reduction and its implementation expenditure may occur in different entities and periods.
Revenue and procurement claims can change receivables, inventory, payables, deposits and guarantees. Accelerated growth may consume cash even when it raises profit. Supplier consolidation may change payment terms or require volume commitments. Facility closure can release deposits while creating restoration obligations. These movements should enter the sources-and-uses and liquidity case.
Cross-border synergies also carry currency exposure. The baseline, implementation cost and benefit may be denominated differently. The model should state the exchange-rate basis and sensitivity rather than treating translation gains as operating synergy. Treasury actions, hedging cost and trapped cash can affect the value available to service acquisition financing.
29. Align synergy evidence with disclosure and market communications
Public transactions and listed buyers can create disclosure, forecast and market-conduct obligations. Synergy numbers may appear in announcements, investor materials, financing documents and fairness analysis. The evidence pack should preserve the basis, assumptions, ranges, approvals and later changes for each communicated measure.
The SEC's non-GAAP guidance addresses financial measures and includes transaction-related forecast considerations. The UK Takeover Code and market-abuse regime impose their own requirements in applicable situations. Qualified counsel and reporting advisers should control the treatment. A machine-generated reconciliation should remain a working aid until reviewed and authorised.
Internal and external versions must stay consistent. A public number can differ from the board's probability-weighted value case for legitimate reasons, but the bridge should be documented. The team should avoid presenting gross run-rate, net benefit, realised cash and present value as though they were interchangeable.
30. Build the board pack around decisions and evidence gaps
The board needs the transaction value thesis, the synergy composition and the conditions under which it changes. The pack should identify the largest claims, common dependencies, implementation cash, downside cases, funding effects and the proportion of purchase price supported by uncertain value. It should show evidence gaps and the decision available for each gap.
Useful questions include whether the baseline is reconciled, which benefits are merger-specific, who accepts operational ownership, what investment precedes value, which claims depend on customer behaviour, how much downside can occur together and whether the transaction remains financeable without uncertain revenue. The answers should link to claim records rather than presentation footnotes.
Approval should state the allowed treatment of each material claim and the trigger for reapproval. A late diligence finding, financing change or integration constraint can alter the case even when the headline total remains stable. The transaction chair should preserve a dated snapshot of the evidence and authority supporting the final decision.
31. Measure post-close performance without rewriting the original case
Integration reporting should compare observed performance with the approved baseline and counterfactual. The team should avoid rebasing away a missed target without preserving the original measure and explaining the change. A revised forecast is useful for management, while the decision record remains necessary for accountability and learning.
Realisation evidence can include executed contracts, payroll, invoices, capacity data, system retirement, customer orders, collections and capital approvals. Finance should reconcile reported benefit to the ledger and cash flow. Operating owners should confirm that the action is sustainable and has not shifted cost, risk or work elsewhere.
The review should also recognise benefits not included in price and value deliberately forgone to protect customers, employees, resilience or regulation. Decision quality is broader than maximising a synergy percentage. The purpose is to understand whether evidence, execution and capital allocation produced the outcome that the approval body authorised.
32. Create an institutional learning loop across transactions
A portfolio of completed claims can improve future baselines, timing ranges, implementation-cost estimates and evidence standards. The buyer should retain anonymised and appropriately governed data on forecast error, dependency failure, cash timing, customer conversion and duplicated claims. Sensitive transaction information should remain protected under applicable obligations.
Machine-assisted analysis can identify patterns across completed deals, subject to data quality and comparability. It can show which claim types have persistent optimism, which dependencies create correlated delay and which evidence states predict realisation. The result should inform challenge and scenario design rather than become an automatic haircut detached from the current transaction.
Governance should distinguish learning from target setting. A historical median cannot replace current source evidence, and a successful prior integration does not prove that a new claim is feasible. The strongest institutional advantage is a repeatable method that connects source, mechanism, decision and cash while preserving the judgement needed for each deal.
33. Adapt the framework to sector economics
The evidence standard remains consistent while the operating mechanism varies by sector. In software, claims may depend on product migration, cloud consumption, customer cohorts, support burden, data rights and renewal. In industrial and engineering businesses, backlog quality, labour skills, plant bottlenecks, warranties, retentions and supplier qualification may determine feasibility. In financial services, regulation, licences, customer consent, risk systems, capital and conduct obligations can dominate timing and cost.
Infrastructure and energy combinations may produce dispatch, maintenance, procurement, network and financing benefits. The model should preserve reliability, long-dated contracts, project covenants and public-service requirements. Real-estate combinations can involve leasing, property management, development pipeline, financing, tax and asset-level constraints. A general percentage of revenue or cost rarely captures these mechanisms.
Sector adaptation should begin with the value driver and constrained resource. It should identify the records that prove capacity, customer behaviour, cost exit and cash. Machine extraction can use a sector-specific taxonomy while keeping the same claim identifier, evidence state and approval rules. This supports comparison without forcing unlike businesses into one template.
34. Separate buyer opportunity from target deliverability
Some synergies depend mainly on the buyer's assets, relationships, capabilities or decisions. Seller management may have limited evidence about the buyer's channels, financing, systems or integration capacity. The diligence process should state which party controls each assumption and avoid treating a target management representation as proof of a buyer-specific benefit.
Buyer opportunity includes proprietary distribution, lower funding cost, shared infrastructure, tax position, purchasing scale, operating capability and strategic alternatives. These effects may create real value, but their evidence should come from the buyer's records and accountable owners. The seller should not receive credit for value that only the buyer can create unless auction dynamics and strategy justify sharing it.
Target deliverability concerns the transferability of customers, people, contracts, data, technology, licences and operations. Change-of-control clauses, consent, retention and separation can reduce what the buyer actually receives. The model should connect target deliverability and buyer execution because a strong capability cannot create synergy from an asset that does not transfer or remain stable.
35. Preserve a standalone financing case
Acquisition financing should remain supportable before uncertain synergy. Lenders may recognise limited cost savings subject to evidence, timing and caps, while excluding revenue claims or benefits beyond the relevant period. The buyer should reconcile lender-defined earnings and cash flow with the internal synergy register rather than assume the valuation case creates debt capacity.
The financing model should test delayed benefits, implementation cost, interest, fees, working capital, minimum cash, covenant definitions and refinancing. A transaction can show attractive long-term value and face a near-term liquidity shortfall. The claim register should identify which benefits affect covenant headroom and when they become available under the facility terms.
Management should also test the consequences of using synergy to support price. Additional debt or equity can transfer more execution risk to the buyer and reduce the value retained from successful integration. The board pack should show purchase-price allocation between standalone value, underwritten synergy and strategic option value, together with the return if uncertain claims do not materialise.
36. Operate a repeatable diligence protocol
The protocol can run in four linked passes. The first establishes the baseline, counterfactual and claim inventory. The second maps mechanisms, evidence, dependencies, investment and owners. The third reconciles duplication, timing, cash, tax, financing and downside. The fourth assigns decision treatment and transfers approved claims into integration.
Each pass should have an evidence cut-off and exception process. New information should update affected claims and preserve the prior view. Reviewers need controlled access to sources, calculations and assumptions. A decision pack can remain concise because it links to the underlying graph rather than reproducing every workpaper.
The protocol should measure its own performance: claim changes after approval, duplicate value removed, evidence gaps at signing, forecast error, implementation cash, time to first benefit and realised cash. These measures help management improve transaction discipline. They do not establish that a process caused a deal outcome without further analysis, and they should be interpreted alongside market and execution conditions.
Practical adoption can begin with the largest claims and the dependencies that affect several workstreams. A buyer does not need to digitise every workpaper before improving control. It can assign claim identifiers, reconcile baseline sources, record evidence states and require a cash bridge for the material value pool. Automation can expand after the taxonomy and review process produce reliable outcomes. This sequence keeps technology subordinate to the transaction method and allows the approval body to see whether additional tooling improves evidence quality, turnaround time and decision usefulness.
Conclusion
Synergy diligence should convert a headline promise into a portfolio of traceable operating claims. Capacity, cost and revenue follow different causal paths and should not be compressed into one run-rate number before their evidence, investment, timing and cash effects are reconciled.
Machine assistance can make the evidence chain faster and more complete through extraction, matching, version control and scenario preparation. The decision remains with accountable executives and advisers who can test the baseline, counterfactual, mechanism and funding requirement.
A claim-level register improves the bid and the first hundred days. It allows boards to see which value is underwritten, which remains optional and which should stay outside price. It also gives integration leaders an executable record of how the transaction is expected to create cash rather than a presentation target detached from operations.
That discipline improves transparency across price, funding, execution and accountability.
References
- Competition and Markets Authority. Merger assessment guidelines, updated June 2026. https://www.gov.uk/government/publications/merger-assessment-guidelines
- Competition and Markets Authority. Merger assessment guidelines, HTML version. https://www.gov.uk/government/publications/merger-assessment-guidelines/merger-assessment-guidelines-html-version
- Competition and Markets Authority. Mergers: guidance on jurisdiction and procedure. https://www.gov.uk/government/publications/mergers-guidance-on-the-cmas-jurisdiction-and-procedure
- US Department of Justice and Federal Trade Commission. 2023 Merger Guidelines. https://www.justice.gov/atr/2023-merger-guidelines
- US Department of Justice and Federal Trade Commission. 2023 Merger Guidelines PDF. https://www.justice.gov/d9/2023-12/2023%20Merger%20Guidelines.pdf
- European Commission. Review of the Merger Guidelines. https://competition-policy.ec.europa.eu/mergers/review-merger-guidelines_en
- European Commission. Draft Merger Guidelines for public consultation, April 2026. https://competition-policy.ec.europa.eu/document/download/46dde10f-85c1-4590-a3f4-2b71f85685ef_en?filename=Merger+Guidelines+-+final+for+public+consultation.pdf
- European Commission. Notices and guidelines for merger control. https://competition-policy.ec.europa.eu/mergers/legislation/notices-and-guidelines_en
- European Union. Council Regulation (EC) No 139/2004 on the control of concentrations between undertakings. https://eur-lex.europa.eu/legal-content/EN/TXT/?uri=CELEX:32004R0139
- IFRS Foundation. IFRS 3 Business Combinations. https://www.ifrs.org/issued-standards/list-of-standards/ifrs-3-business-combinations/
- IFRS Foundation. IAS 36 Impairment of Assets. https://www.ifrs.org/issued-standards/list-of-standards/ias-36-impairment-of-assets/
- IFRS Foundation. Expected synergies arising from a business combination. https://www.ifrs.org/content/dam/ifrs/meetings/2021/november/iasb/ap18a-goodwill-and-impairment-synergies.pdf
- IFRS Foundation. Business Combinations: Disclosures, Goodwill and Impairment technical update, June 2026. https://www.ifrs.org/content/dam/ifrs/meetings/2026/june/eeg/ap3-iasb-technical-update.pdf
- US Securities and Exchange Commission. Non-GAAP Financial Measures, Compliance and Disclosure Interpretations. https://www.sec.gov/rules-regulations/staff-guidance/corporation-finance-interpretations/non-gaap-financial-measures
- US Securities and Exchange Commission. EDGAR company filings. https://www.sec.gov/search-filings
- Public Company Accounting Oversight Board. AS 2501: Auditing Accounting Estimates, Including Fair Value Measurements. https://pcaobus.org/oversight/standards/auditing-standards/details/AS2501
- Public Company Accounting Oversight Board. Audit Focus: Auditing Accounting Estimates. https://pcaobus.org/resources/staff-publications/audit-focus/audit-focus--auditing-accounting-estimates
- National Institute of Standards and Technology. AI Risk Management Framework. https://www.nist.gov/itl/ai-risk-management-framework
- National Institute of Standards and Technology. Generative AI Profile, NIST AI 600-1. https://nvlpubs.nist.gov/nistpubs/ai/NIST.AI.600-1.pdf
- National Institute of Standards and Technology. AI RMF Playbook. https://www.nist.gov/itl/ai-risk-management-framework/nist-ai-rmf-playbook
- UK National Cyber Security Centre. Guidelines for secure AI system development. https://www.ncsc.gov.uk/collection/guidelines-secure-ai-system-development
- International Organization of Securities Commissions. Artificial intelligence in capital markets: use cases, risks and challenges. https://www.iosco.org/library/pubdocs/pdf/IOSCOPD684.pdf
- Federal Trade Commission. HSR Notification Forms, Instructions and Guidance. https://www.ftc.gov/enforcement/premerger-notification-program/hsr-notification-forms-instructions-guidance
- UK Takeover Panel. The Takeover Code. https://www.thetakeoverpanel.org.uk/the-code/download-code
- Financial Conduct Authority. UK Market Abuse Regulation. https://www.fca.org.uk/markets/market-abuse
