
Introduction
Private market returns are quoted gross, but the gross return is not what an investor keeps. Between the gross return that the underlying investments produce and the net return that reaches the limited partner lies the fee drag, the management fee, the carried interest, the fund expenses and the transaction fees that the manager takes, and that drag is large, compounding over the life of an investment to consume a quarter or a third of the gross return. Yet investors routinely focus on the gross headline number, under-examining the fee drag that determines what they actually keep.
This paper decomposes net-to-LP returns, making the true cost of alternatives visible and showing how to manage it. The premise is simple but consequential: the only return that matters is the net return the investor keeps, and a sophisticated investor must understand and manage the fee drag that separates it from the gross. A family office that decomposes the net return, understands the fee components, and uses the levers to manage them can keep materially more of the gross return than one that accepts the headline gross number and pays the standard fees without examination.
The central argument is that the fee drag is large, compounds over time, and varies materially across fund types and structures, and that a fee-aware investor can keep materially more of the gross return by decomposing the net, negotiating the terms, and using the levers, above all co-investment, examined in a companion paper. The fee drag is the most controllable part of the net-return equation, and managing it is one of the most effective ways an investor can improve what it keeps, which is why understanding net-to-LP returns is central to investing in alternatives well.
The Gross-to-Net Bridge
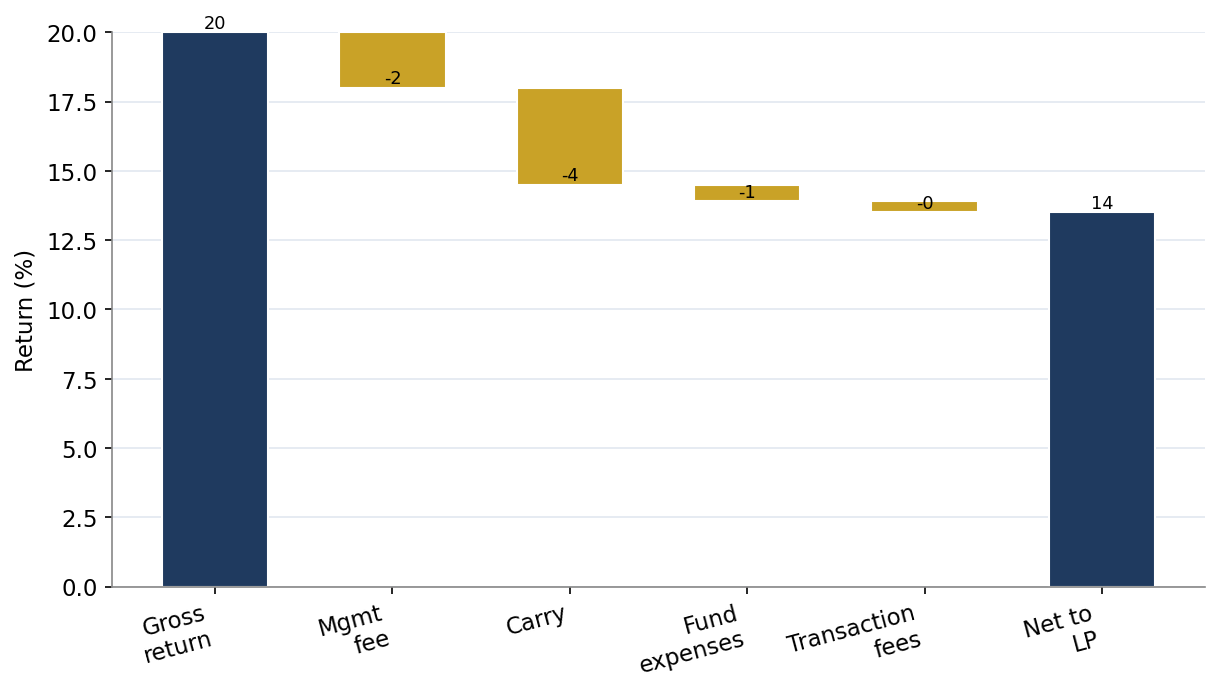
The gross-to-net bridge, illustrated in Figure 1, is the central tool for decomposing the net return, showing how each fee component reduces the gross return to the net the LP keeps. The bridge begins with the gross return, deducts the management fee, the carry, the fund expenses, and the transaction fees in turn, and arrives at the net return. It makes the fee drag visible component by component, showing the investor exactly how much each component takes and how they together reduce the gross to the net.
The bridge is valuable because it makes the fee drag concrete and decomposed, rather than an abstract reduction, allowing the investor to see which components most reduce its net return and which it can most influence. An investor that builds the gross-to-net bridge for its funds can see the drag clearly, identify the largest components, and target its negotiation and its levers at the components that most reduce its net. The bridge is therefore the analytical foundation of managing the fee drag, making it visible and decomposed so the investor can manage it.
The bridge also allows the investor to compare funds on their net returns, after their differing fees, rather than their gross returns, which is the comparison that matters. By building the bridge for each fund, the investor can compare the net returns the funds would deliver after their fees, selecting the fund that delivers the higher net rather than the higher gross. The bridge therefore supports the net-focused selection examined in Section 2, allowing the investor to compare and select funds on the net return that matters, after the full fee drag the bridge decomposes.
Building the bridge requires the investor to obtain the full fee information, the management fee, the carry mechanics, the expenses, and the transaction fees, which managers do not always present transparently, and an investor must request and scrutinise the full fee information to build an accurate bridge. The transparency of the fee information varies across managers, and an investor should favour managers that present their fees transparently and should scrutinise the full fee terms of those that do not, to build the accurate bridge that reveals the true net return. The bridge is only as accurate as the fee information it is built on, which is why obtaining the full information is part of decomposing the net return.
Fee Structures Compared
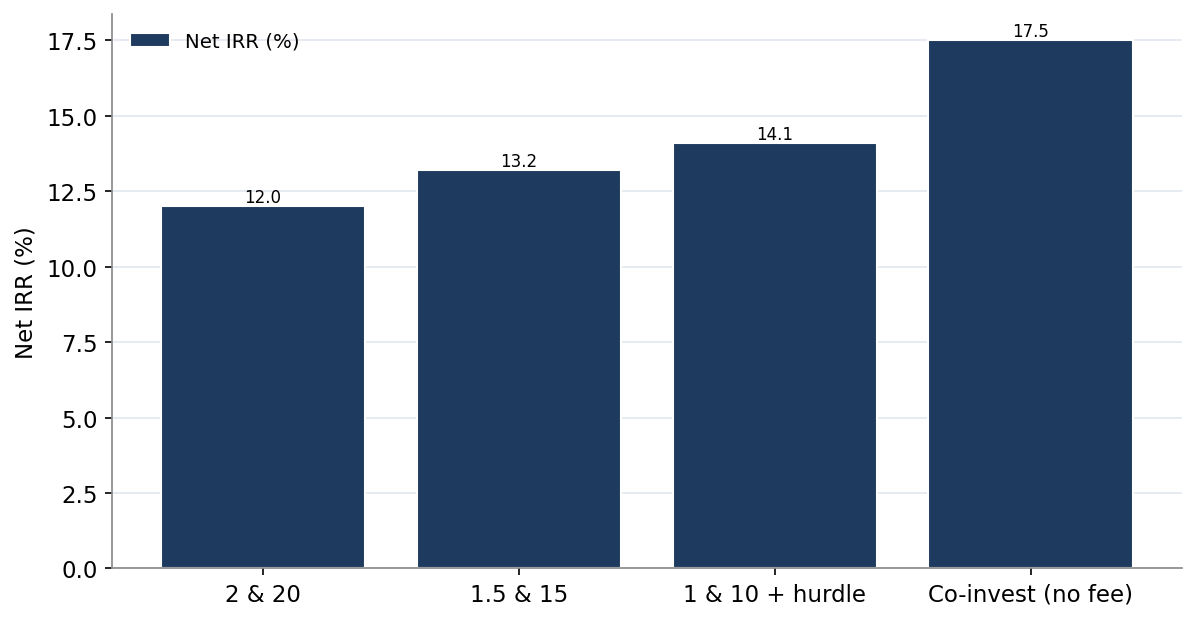
Fee structures vary, and the structure materially affects the net return, illustrated in Figure 4, which compares the net IRR under different fee structures for the same gross return. The traditional two-and-twenty, a two percent management fee and twenty percent carry, is the standard, but lower-fee structures, and structures with a meaningful hurdle, deliver a higher net return, and co-investment, with no fee, delivers the highest. The structure is a major determinant of the net return, and the investor should understand and, where possible, negotiate toward the more favourable structures.
Figure 4. Net IRR Under Different Fee Structures
The trend in fee structures has been away from the rigid two-and-twenty toward more varied and, for large investors, more favourable structures, as investors have pushed back on fees and as competition among managers has grown. Large investors can negotiate lower management fees, reduced carry, a meaningful hurdle, or fee offsets, and the structures have become more negotiable, particularly for the largest and most valued investors. The investor should understand the range of structures and negotiate toward the more favourable, recognising that the structure is negotiable, particularly for a valued investor.
The hurdle, the return the fund must exceed before the manager earns carry, is a particularly important structural feature, because a meaningful hurdle ensures the manager earns carry only on genuine outperformance, aligning it with the investor and reducing the carry drag on modest returns. A structure with a meaningful hurdle delivers a higher net return on modest gross returns than one without, because the manager earns no carry until the hurdle is exceeded, and the investor should favour structures with a meaningful hurdle. The hurdle is therefore a key structural feature, examined further in the carry mechanics, that the investor should seek.
Co-investment, examined in the companion paper, is the structure that delivers the highest net return, because it charges little or no fee, capturing almost the full gross return. The co-investment structure, with no management fee and no carry, delivers a net return close to the gross, materially above the fund net return, which is why co-investment is the most powerful lever on the net return, as the levers section discusses. The fee structure comparison therefore points to co-investment as the most favourable structure, and to the negotiation of lower fees and meaningful hurdles within the fund structures, as the ways to improve the net return.
The Hidden Costs
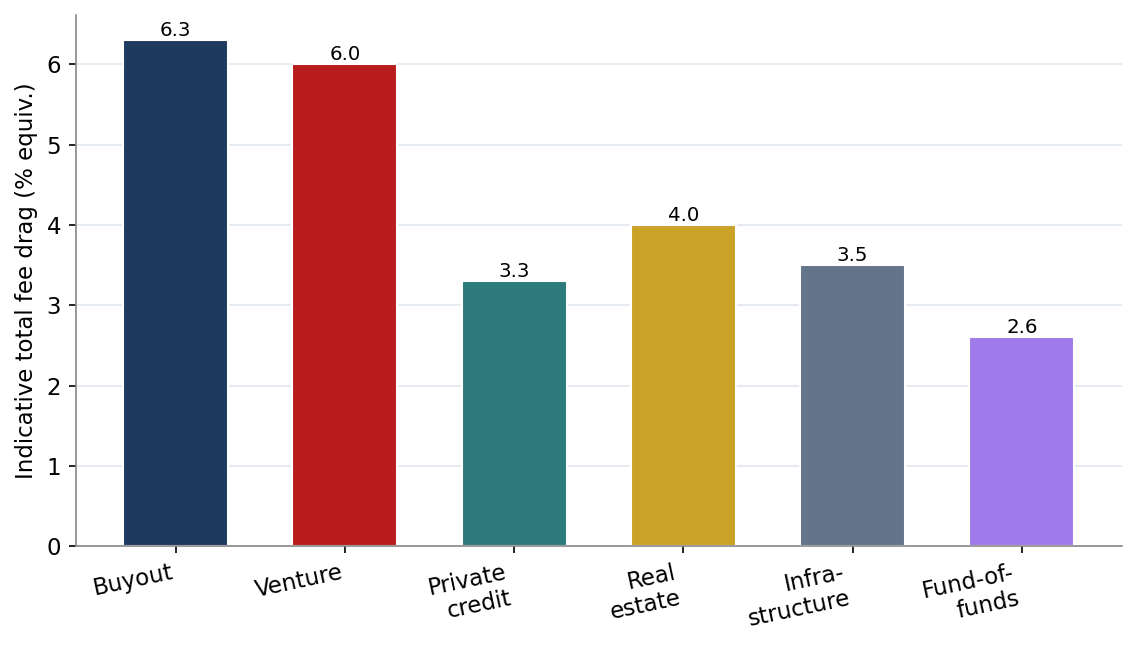
Beyond the headline management fee and carry lie the hidden costs, the fund expenses, the transaction fees, and the fees charged on committed rather than invested capital, that add materially to the drag and are often overlooked. The fund expenses, charged to the fund for its operations, legal, audit, administration, can be significant, and the transaction fees, charged on deals or to portfolio companies, can add further cost. These hidden costs are part of the true fee drag, and an investor that examines only the headline fees understates the true cost.
The fee charged on committed rather than invested capital is a particular hidden cost, because charging the management fee on the full committed capital, before it is invested, increases the effective fee on the invested capital. During the investment period, when much of the committed capital is not yet invested, charging the fee on the full commitment means the investor pays a fee on capital that is not yet working, which raises the effective fee. The investor should understand whether the fee is charged on committed or invested capital, and should favour funds that charge on invested capital, because charging on committed capital raises the effective drag.
The transaction and monitoring fees that managers charge to portfolio companies are another hidden cost, because these fees, charged to the companies the fund owns, ultimately come out of the value that would otherwise accrue to the investor, unless they are offset against the management fee. The fee offset, the provision that offsets the transaction and monitoring fees against the management fee, returns these fees to the investor, and the investor should seek a full fee offset, because without it the transaction and monitoring fees are an additional drag. The fee offset is therefore an important term, and the investor should understand and negotiate it.
The hidden costs, taken together, can add materially to the headline fee drag, and an investor that examines only the headline management fee and carry can significantly understate the true cost. The fund expenses, the transaction fees, the committed-versus-invested basis, and the fee offset can together add a meaningful drag on top of the headline fees, and the investor must examine the full fee terms, including these hidden costs, to understand the true net return. The hidden costs are therefore a key part of decomposing the net return, and surfacing and managing them, through transparency and negotiation, is part of managing the true fee drag.
Manager Alignment and the Economics of Fees
Fees are not only a cost; they are a signalling device. The way a manager structures its economics tells a limited partner a great deal about where the manager expects to make money and how confident it is in the strategy. A manager that derives most of its income from management fees is, in effect, running an asset-gathering business in which scale matters more than performance. A manager that accepts a thin management fee and concentrates its upside in carried interest is signalling that it expects to earn through results. Neither model is wrong, but the alignment they produce is very different, and an investor should read the fee structure as a statement of intent rather than a simple price tag.
The asset-gathering trap. As a fund family grows, management fee income on committed capital can become large enough to fund a comfortable business regardless of performance. At that point the marginal incentive to take risk in pursuit of carry weakens, and the manager may drift toward preserving the franchise rather than maximising the return on any single fund. Investors should watch for managers whose fee income has outgrown the discipline of performance, because the gap between gross talent and net delivery tends to widen precisely when a manager no longer needs the carry.
Alignment is strengthened by three features that an investor can check directly. The first is a meaningful general partner commitment, ideally funded in cash rather than waived fees, so that the manager loses real money when the fund underperforms. The second is a hurdle rate that forces the manager to clear a genuine cost of capital before carry begins, rather than a token threshold. The third is a whole-fund, or European, distribution waterfall that defers carry until investors have received their capital and preferred return across the entire portfolio, rather than allowing the manager to collect carry on early winners while later losses are still unrealised.
Three Worked Cases
The following cases trace the same gross outcome through three different fee architectures to show how the structure, rather than the underlying performance, shapes what the investor finally keeps. Each fund is assumed to deliver an identical gross multiple on a five-year hold; the only variable is how the economics are shared.
Figure 8. Net-to-LP Outcomes Under Three Fee Architectures
Same gross performance; outcomes differ only by fee structure.
Table 1. Case Comparison: Identical Gross, Different Net
MOIC is multiple on invested capital. Fee load is the cumulative drag expressed as a reduction in MOIC.
Reading the cases. The nineteen basis points of MOIC that separate Case A from Case C do not come from better investing. They come entirely from structure: a lower management fee, a whole-fund waterfall that defers carry until the investor is made whole, a genuine hurdle and the offset of transaction fees against the management fee. An investor who treats these terms as negotiable, rather than as fixed features of the market, can capture a material part of that difference without taking a single unit of additional risk.
Common Errors
Confusing gross with net. comparing gross returns across managers without netting fees, which flatters the most expensive structures.
Accepting terms as given. treating the headline two and twenty as fixed, when management fee, hurdle, waterfall and fee offsets are all negotiable for committed capital of reasonable size.
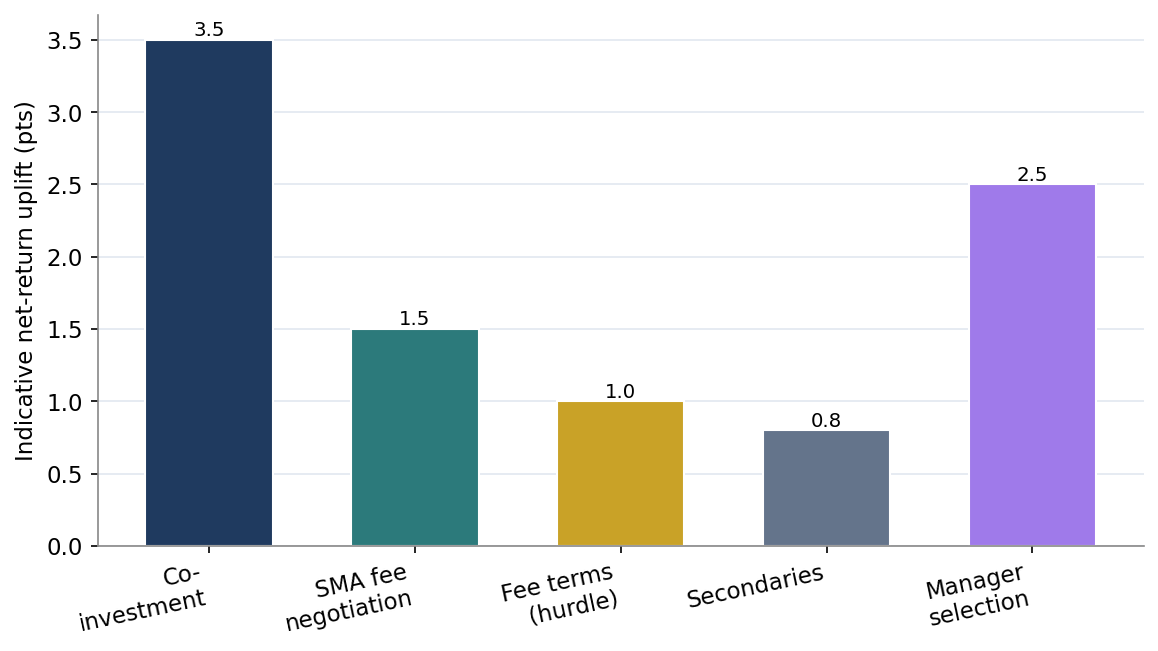
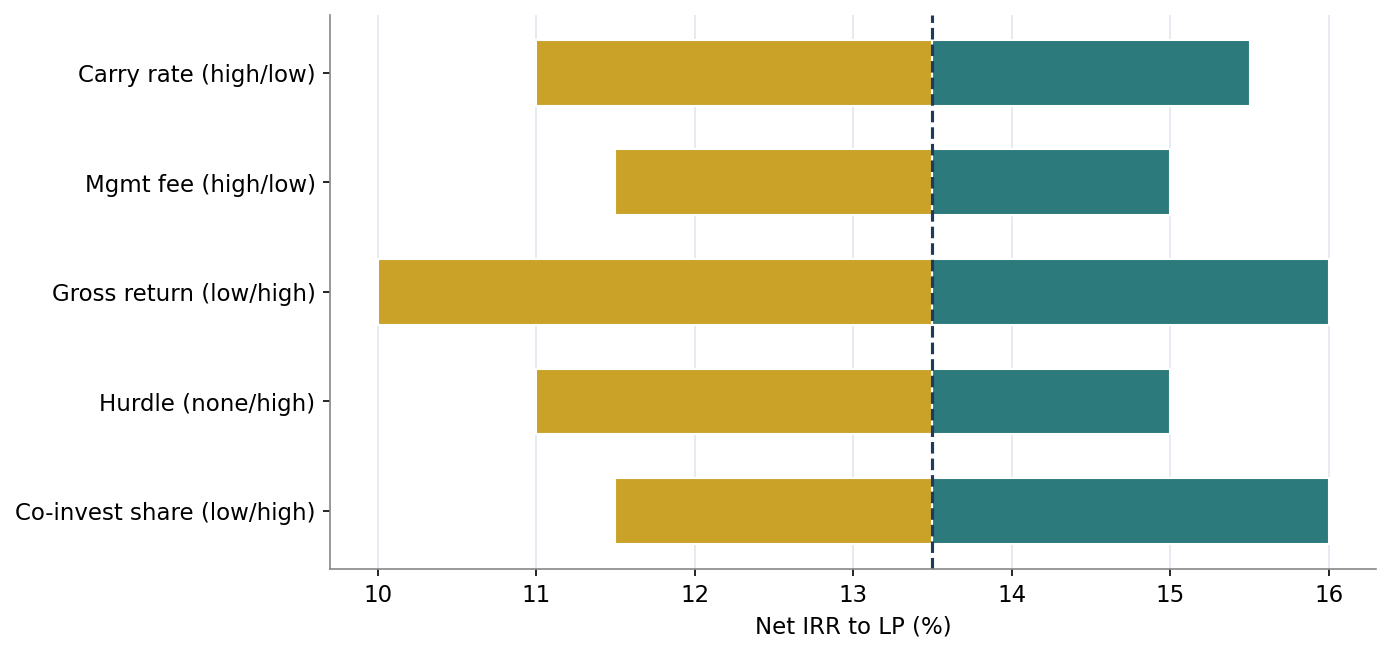
Negotiating the wrong lever. focusing on the carry rate while ignoring the management fee, even though the fee usually drives the larger share of total drag.
Ignoring hidden costs. overlooking transaction, monitoring and administrative charges that sit outside the headline and can add materially to the total load.
Weak clawback protection. permitting deal-by-deal carry without a robust clawback, which lets a manager keep carry on early winners while later losses erode the fund.
| Case | Structure | Gross MOIC | Total fee load | Net-to-LP MOIC |
|---|---|---|---|---|
| A | 2 and 20, deal-by-deal carry | 2.20x | ~0.42x | 1.78x |
| B | 1.5 and 15, whole-fund carry, 8% hurdle | 2.20x | ~0.31x | 1.89x |
| C | 1 and 10, whole-fund, 8% hurdle, fee offset | 2.20x | ~0.23x | 1.97x |
An Implementation Roadmap
A practical programme for improving net-to-LP outcomes can be sequenced over a single allocation cycle. The aim is to move from accepting headline terms toward a disciplined process that treats cost as a managed variable.
Build a net-return model for every prospective commitment that runs the full gross-to-net bridge, including management fee, carry, hurdle, fund expenses and expected tax leakage.
Benchmark each manager’s proposed terms against the relevant strategy norms in Table 2, and identify the two or three terms where the gap is widest.
Negotiate the high-impact levers first, led by management fee and waterfall structure, using the sensitivity ordering rather than instinct to set priorities.
Insist on a most-favoured-nation clause so that any better terms granted to other investors flow through, and require transparent reporting of all charges outside the headline fee.
Review net-of-fee performance annually against a net benchmark, and redeploy from persistently expensive managers into comparable cheaper structures.
Conclusion
Gross return is what a manager produces. Net-to-LP is what an investor keeps, and only the second pays for retirements, endowments and family obligations. The gap between the two is neither random nor immovable. It is the predictable result of fee structures that can be read, modelled and negotiated. An investor who internalises the gross-to-net bridge, who knows which terms move the result most and who is willing to press on them, will over a full cycle retain materially more of every dollar of gross performance than one who accepts the headline and hopes for the best. That retained margin, compounded across a portfolio and a career, is among the most durable advantages available in private markets.
Limitations
This paper uses modelled figures to illustrate mechanics and relationships rather than to forecast the outcome of any specific fund. Real funds vary in strategy, vintage, leverage and tax position, and the interaction of these factors with fees is more complex than any single model can capture. The fee norms cited are indicative of common institutional practice and should be checked against current market conditions and the specific terms on offer. Nothing here constitutes investment, tax or legal advice, and investors should obtain advice tailored to their own circumstances before acting.
| Strategy | Management fee | Carry | Hurdle | Typical waterfall |
|---|---|---|---|---|
| Large buyout | 1.5 to 2.0% | 20% | 8% | Whole-fund |
| Mid-market buyout | 1.5 to 2.0% | 20% | 8% | Whole-fund |
| Private credit | 1.0 to 1.5% | 10 to 15% | 5 to 7% | Whole-fund |
| Venture capital | 2.0 to 2.5% | 20 to 30% | None to 8% | Deal-by-deal common |
| Real estate | 1.0 to 1.5% | 15 to 20% | 8 to 9% | Whole-fund |
