
1. Treat power as the first development gate
A data-centre investment converts electrical capacity into reliable computing service. Land provides location and development rights. Buildings house the equipment. Fibre connects users. Servers perform work. None of those inputs creates operating revenue at scale until power is available with the required quality and reliability.
The International Energy Agency reports that data-centre electricity use increased by 17 percent in 2025 and that electricity use from AI-focused data centres rose faster.[1] Its 2025 base case projects global data-centre electricity consumption to rise from around 415 terawatt-hours in 2024 to around 945 terawatt-hours in 2030.[2]
The physical development cycles are mismatched. A data centre can be built more quickly than major grid infrastructure. The IEA states that transmission construction can take four to eight years in advanced economies and that waiting times for transformers and cables doubled over the preceding three years.[2] Its Electricity 2026 analysis describes grid planning and construction periods of five to fifteen years compared with one to three years for data centres.[3]
Investment screening should therefore establish power before committing to a land-led thesis. The first questions concern capacity, date, network location, firmness, tariff, infrastructure, permits, interface and expansion. Property value becomes part of the decision after a credible electrical path has been evidenced.
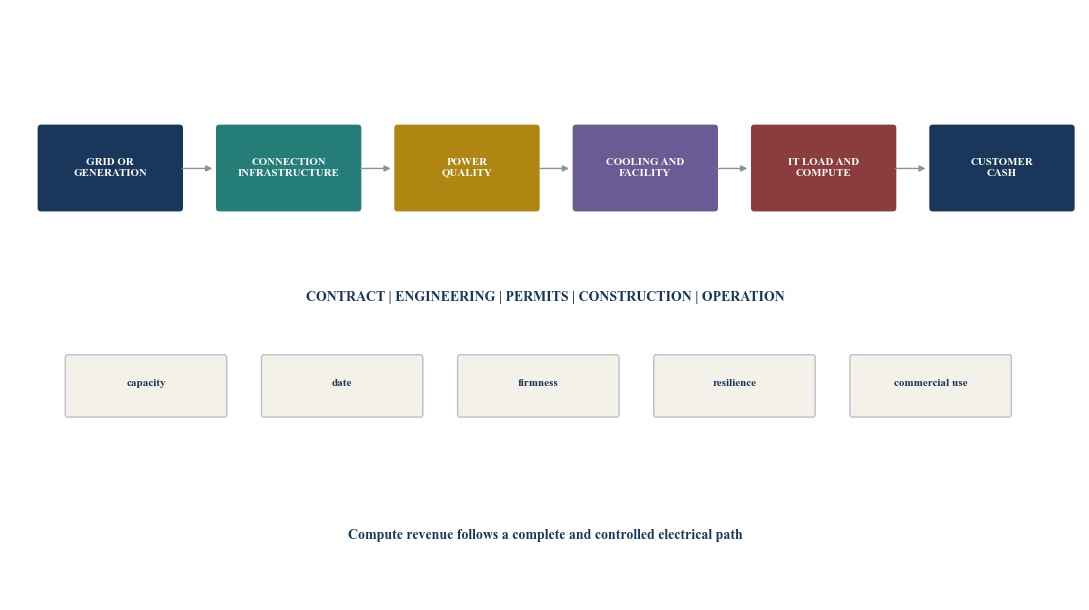
Author framework. Each stage requires evidence before capacity becomes dependable operating cash.
2. Define grid access as an investable bundle
Grid access is more than a megawatt number. The investment attribute combines the amount of contracted demand, voltage, connection point, network configuration, energisation date, service firmness, curtailment, ramp schedule, power quality, tariff, deposits, upgrade cost, security obligations, operating rules and expansion rights.
Each attribute can affect cash. A large capacity delivered in five years can be less valuable than smaller capacity delivered in two years if the early capacity supports customer contracts and phased expansion. Firm capacity can support different service commitments from interruptible or conditional supply. A low energy tariff can be offset by a large connection contribution or fixed demand charge.
The rights should be linked to the correct legal person and site. A utility letter addressed to a prior landowner may not transfer. Capacity allocated to a broader master development may not belong to a specific parcel. An indicative study can expire. A connection agreement can contain milestones, deposits and termination rights.
The investment committee should identify the exact bundle it is acquiring. The transaction perimeter can include land, project company, connection application, studies, permits, equipment orders, easements, deposits, customer arrangements and interface obligations. Transferability and change-of-control treatment require explicit evidence.
3. Use an evidence hierarchy for the connection claim
Connection evidence matures through several stages. A developer can begin with a load request or feasibility discussion. The utility or system operator can conduct initial screening, detailed impact studies and facility studies. It can issue a connection offer. The parties can execute agreements, provide security, procure upgrades, construct assets, test systems and energise service.
A project name in a queue does not prove capacity, date or deliverability. Queue position can change because earlier projects withdraw, studies are revised, network assumptions change or milestones are missed. The IEA notes that queue numbers can shift as projects progress, cancel or are reassessed.[3]
Evidence should be dated and reconciled. The project load, voltage, ramp and operating mode in the utility file should match the land plan, electrical design, equipment specification, customer offer and financial model. A change in rack density or phase plan can require a new network study.
The committee should assign a maturity grade to each connection claim and cap reliance accordingly. A probability should be supported by stated evidence, remaining actions and accountable professional review. A headline capacity claim should remain excluded from value until the rights and delivery path are sufficiently defined.
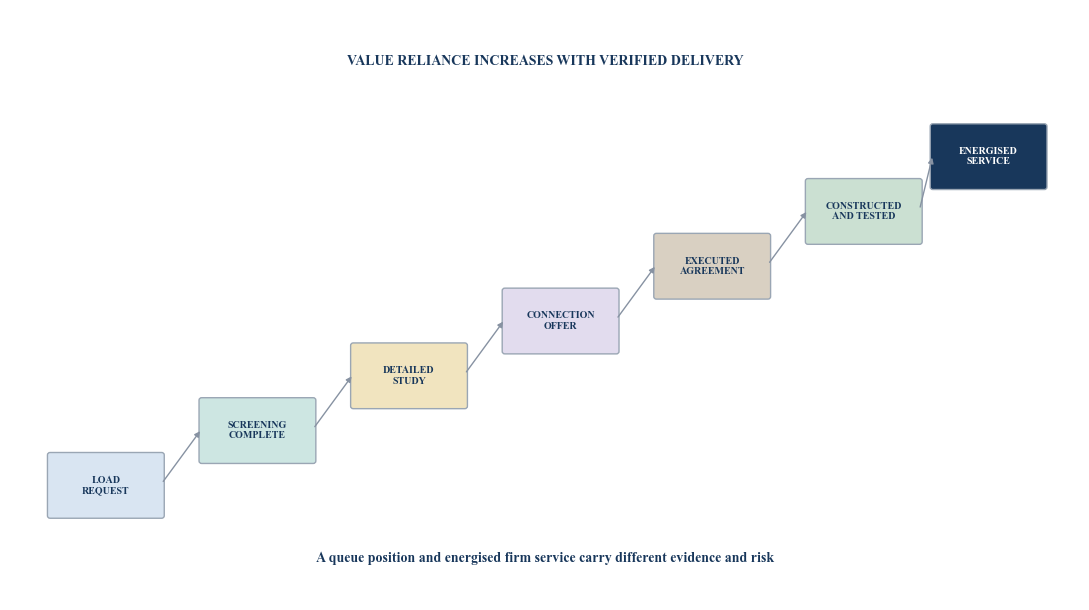
Author framework. Maturity rises through completed contractual, technical and construction evidence.
Table 1. Grid-access diligence file
| Diligence field | Primary evidence | Investment relevance | Decision test |
|---|---|---|---|
| Capacity and voltage | utility or system-operator record | defines electrical scale and interface | does the approved load match the project design? |
| Connection point | network diagram, coordinates and title | defines route and infrastructure | are land and easements controlled? |
| Energisation date | executed schedule and milestones | drives revenue start and carry cost | what actions can change the date? |
| Firmness and curtailment | tariff, agreement and operating protocol | affects customer service and revenue | which events permit interruption? |
| Upgrade scope | study, design, estimate and allocation | determines cost and execution | who builds, pays, owns and operates each asset? |
| Security and deposits | invoice, guarantee and payment record | creates cash and default exposure | are amounts, release and forfeiture clear? |
| Transfer and change control | agreement and legal review | affects transaction portability | do the rights survive the proposed deal? |
| Expansion | reserved capacity and future study path | creates development optionality | is future load committed, conditional or aspirational? |
| Tariff and charges | current approved schedule and offer | determines operating economics | which fixed, demand, energy and network charges apply? |
| Continuing obligations | milestones, reporting and compliance | protects the connection | can the project maintain every condition? |
Required evidence depends on the relevant utility, network, market, jurisdiction and project.
4. Separate queue presence from deliverability
A queue can contain serious projects, duplicate requests, alternative sites, speculative loads and projects without finance or land. A developer can submit more than one application to preserve options. The gross queue can therefore overstate committed demand and understate timing uncertainty.
NERC's 2025 Long-Term Reliability Assessment explains that reported data-centre forecasts are informed by interconnection processes and agreements and that projects counted in forecasts have progressed from exploratory stages into development commitments. It also describes adjustments where requested loads are reduced to reflect observed consumption or where projects lack transmission-service contracts.[9]
The investor should examine study stage, application date, requested service, site control, deposits, financial security, engineering progress, equipment orders, permits, customer commitments, completion milestones and withdrawal terms. The same review should be applied to upstream generation or transmission projects on which the load depends.
Queue quality is partly a system characteristic. Transparent milestones, readiness deposits and capacity reallocation can improve the relationship between queue position and deliverability. The IEA describes capacity auctions and stricter retention requirements as tools for allocating scarce grid capacity toward deliverable projects.[3]
Table 2. Connection maturity and valuation reliance
| Maturity stage | Typical evidence | Remaining uncertainty | Valuation treatment |
|---|---|---|---|
| Exploratory request | application and conceptual load | capacity, route, date, cost and authority | no attributed connection value |
| Screening result | initial network response | detailed impact, upgrades and timing | option value subject to high haircut |
| Detailed studies | technical impact and facility scope | final cost, agreement and construction | scenario value with explicit probability |
| Connection offer | stated capacity, cost and date | acceptance, security, milestones and conditions | conditional value after full term review |
| Executed agreement | binding rights and obligations | upgrades, permits, equipment and performance | risk-adjusted contractual value |
| Infrastructure built | completed assets and testing | commissioning and operating approval | high reliance subject to remaining tests |
| Energised service | operating connection and meter data | continuing compliance, tariff and reliability | operating value with ongoing risk |
The indicated reliance is a framework choice and requires transaction-specific evidence.
5. Reconcile load assumptions before valuing capacity
Requested megawatts can differ from commissioned, ramped and utilised load. The model should distinguish connection capacity, contracted demand, IT load, facility load, peak load, average load, standby demand and actual consumption.
Power usage effectiveness links total facility energy to IT equipment energy. Cooling design, climate, utilisation, redundancy, UPS losses and auxiliary systems affect the relationship. AI rack densities and accelerated computing can also create rapid changes in instantaneous demand and power quality.
The load ramp should be tied to construction phases, equipment delivery, customer contracts and commissioning. An agreement for 200 megawatts on a future date does not mean 200 megawatts of immediate billable compute. Capacity can ramp over several years.
The project should present base, delayed, lower-utilisation and accelerated cases. Each case should reconcile megawatts to critical IT load, rack count, installed equipment, customer capacity, energy consumption, tariff, cooling and revenue. The valuation should avoid applying a constant revenue multiple to an unverified headline load.
6. Model the complete time-to-power path
Time to power begins with more than the utility's target date. The project can require land and planning, environmental approvals, utility studies, easements, substation design, transformer and cable procurement, civil works, protection systems, metering, testing, generation permits, fuel arrangements and site commissioning.
The IEA's transmission supply-chain survey found procurement periods of two to three years for cables and up to four years for large power transformers, with average lead times almost doubling since 2021.[4] Long-lead items should be connected to approved specifications, supplier capacity, deposits, delivery, storage and warranty.
The integrated schedule should identify dependencies and float. Site construction can proceed before power infrastructure, although early completion can create idle buildings, equipment storage and warranty burn. IT equipment should be sequenced against credible energisation and cooling dates.
Every critical date should have an evidence source, owner, last update, confidence and next gate. A single target energisation date should be replaced by a range and scenario where the evidence remains conditional.
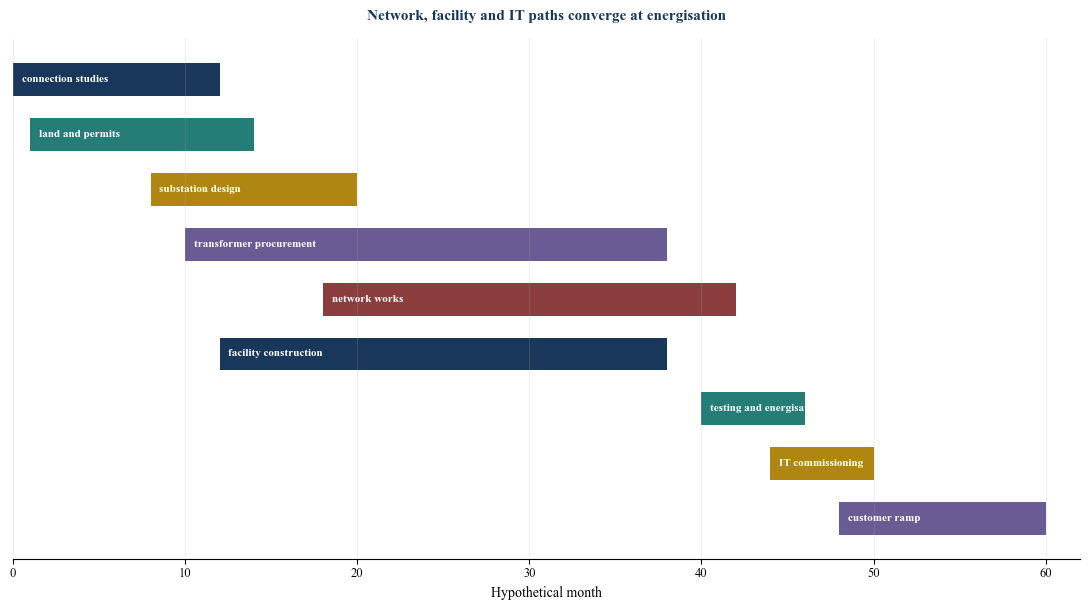
Durations are hypothetical management assumptions used solely to demonstrate dependency and overlap.
7. Value earlier and more dependable operating cash
Grid-access value is the difference between the present value of the project with the evidenced power path and the present value under a feasible alternative. The alternative can be a later connection, smaller load, different site, onsite generation, flexible service or no development.
The model should include connection contributions, network assets, deposits, security, onsite generation, storage, fuel, tariffs, demand charges, power losses, maintenance, curtailment, flexibility revenue, insurance, financing carry and tax. It should also include the effect of energisation on construction phasing, IT procurement and customer cash.
Value can arise from several sources: earlier revenue, greater contracted capacity, higher utilisation, lower development carry, reduced idle equipment, stronger customer commitments, lower contingency and future expansion. Costs and obligations reduce that value.
The analysis should avoid capitalising a probability-weighted upside as if it were contracted. Each scenario should state its evidence, probability or decision weight, date, cost, ramp and terminal treatment. IFRS 13 and applicable valuation standards have specific purposes and definitions; transaction decisions require an appropriately scoped valuation.[14][15]
8. Compare grid, onsite and hybrid supply routes
Grid service can provide scale, system diversity and established operating arrangements. It can carry connection delay, tariff, curtailment and upgrade risk. Onsite generation can shorten the path in some circumstances, although it requires land, permits, equipment, fuel, emissions treatment, maintenance, synchronisation and an operating model.
Hybrid supply can combine grid connection, generation, storage, demand response and workload flexibility. The IEA reports growing use of onsite generation in response to connection constraints and highlights battery storage as relevant to managing rapid load swings.[1]
The investment case should compare routes through the same service requirement. It should include dependable megawatts, first-power date, full-load date, outage behavior, ramp response, fuel security, black-start, emissions, cost, expansion, integration and residual value.
A route can change during the project. Temporary generation can bridge to a grid connection. A flexible grid service can precede firm service. Storage can support power quality and peak management. The contractual handoff and stranded-cost risk should be explicit.
Table 3. Power-supply route comparison
| Route | Potential advantage | Principal dependency | Valuation question |
|---|---|---|---|
| Firm grid service | established system and scale | connection delivery and tariff | when does firm usable capacity begin? |
| Flexible grid service | possible earlier connection | curtailment and workload response | what revenue survives interruption? |
| Onsite gas generation | dispatchable local supply | fuel, permits, emissions and equipment | what is the all-in dependable cost? |
| Renewable plus storage | lower-emissions supply and flexibility | resource profile and storage duration | which load can it serve continuously? |
| Grid plus onsite generation | diversity and staged capacity | interface, synchronisation and operating rules | how do sources perform under common stress? |
| Temporary bridge power | earlier commissioning or testing | high cost and limited duration | does earlier cash exceed bridge cost and risk? |
| Alternative site | different queue and infrastructure | land, fibre, customer latency and relocation | what is the complete value of switching? |
Performance, cost and permissions depend on the actual project, utility, network, technology and jurisdiction.
9. Underwrite tariff and cost allocation
Electricity cost includes more than energy. Depending on the jurisdiction and service, charges can include capacity, demand, network, connection, transmission, distribution, system services, metering, standby, reactive power, imbalance, minimum take, fuel adjustment and taxes.
The connection agreement can allocate network-upgrade cost between utility and customer. Some contributions can be refundable or offset over time. Others can become assets owned by the utility. Security can be released after milestones or forfeited after default.
Tariff assumptions should use the applicable published schedule, executed offer or qualified advice. A long-term customer price should be matched with credible power-cost protection. A power purchase agreement can address contractual energy supply while physical grid delivery remains a separate requirement.
The model should test demand growth, tariff escalation, fuel price, fixed charges, low utilisation, power factor, losses and curtailment. A low headline energy rate can produce weak economics if the project carries idle reserved capacity or expensive resilience systems.
10. Test capacity firmness and curtailment
Capacity can be firm, interruptible, conditional, phased or subject to emergency reduction. The project should identify the contractual and operational events that permit curtailment, the notice period, duration, frequency, compensation and restoration priority.
Customer contracts should be tested against the same events. If the utility can interrupt supply while the data-centre operator promises continuous service, the project needs backup and contractual alignment. Service credits, termination and lost customer confidence can exceed the direct energy cost.
Flexible computing can reduce the need for firm peak capacity in some workloads. Training tasks can be rescheduled or shifted where latency, data, model, customer and operational requirements permit. EPRI's DCFlex work develops common definitions and approaches for integrating flexible data-centre load with grid needs.[10]
Flexibility value should be evidenced through controllable load, response speed, duration, recovery, telemetry, customer permission and market or tariff compensation. A theoretical workload shift should not be credited without an executable operating design.
11. Design resilience as an architecture
Resilience connects the utility, connection, substation, switchgear, UPS, batteries, generators, fuel, cooling, network, controls, spares, people and recovery procedures. Redundancy labels alone do not establish end-to-end resilience.
The project should map common-mode failures. Two utility feeds can share a substation or corridor. Generators can depend on the same fuel supply. Cooling systems can depend on the same water source. Control systems can share cyber vulnerabilities. Maintenance can remove redundancy during a grid event.
The architecture should define design event, required ride-through, autonomy, restoration sequence, black-start capability, load shedding and tested performance. It should distinguish life safety, facility support, critical IT and deferrable workload.
Capital cost should be connected to customer and financing requirements. Excess resilience can reduce return through idle assets. Insufficient resilience can destroy contracted revenue and equipment. The decision should optimise service reliability under specified scenarios.
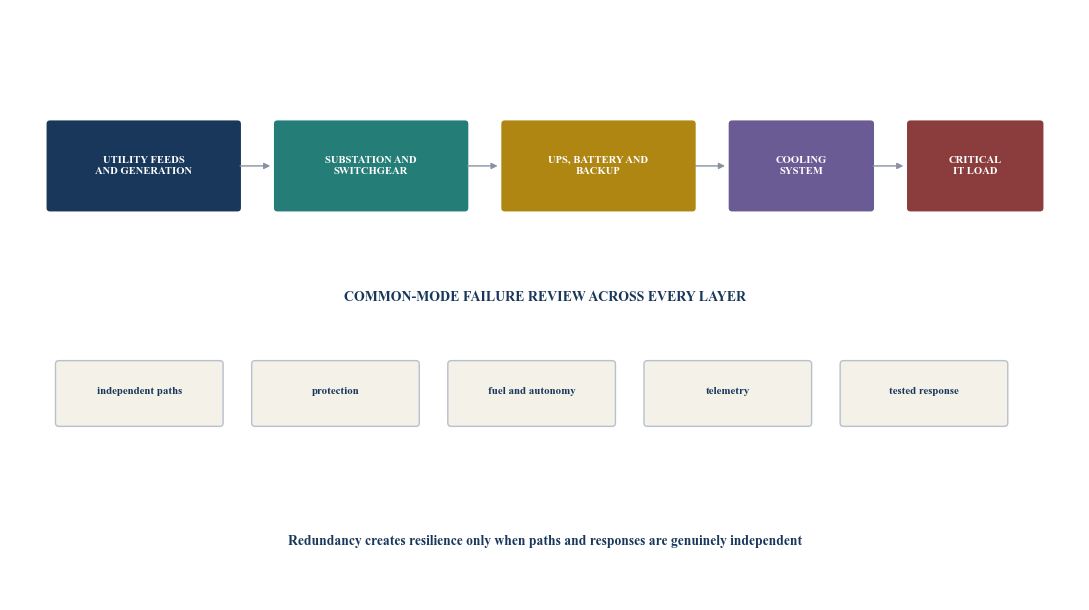
Author framework. Independence should be tested across sources, paths, equipment, controls and operating response.
12. Include power quality and dynamic load behavior
AI data centres can create concentrated and rapidly changing loads. Voltage, frequency, harmonics, flicker, reactive power and ramp behavior can affect both the facility and network. Protection and control settings require coordination.
NERC's large-load work identifies planning and operational challenges from computational loads and calls for modelling, studies, instrumentation, commissioning, operations, protection and control actions.[11] Those requirements apply within NERC's scope and provide useful evidence of the technical questions that large loads can create.
The connection study should use relevant load models, fault contribution, ramp rates, power electronics, UPS and generator behavior. Commissioning should validate the actual installed system. Material design changes should trigger model and study review.
The operating agreement should define data exchange, telemetry, dispatch or curtailment, event notification and change management. A valuation assumption that ignores required mitigation or operational limits can overstate usable capacity.
13. Connect water, cooling and power
Cooling design changes total facility load, water use, rack density and site suitability. Air cooling, liquid cooling, chilled water and hybrid systems have different electrical and water profiles. Ambient conditions influence performance.
The power model should include cooling at each IT-load and climate condition. It should also include pumps, heat rejection, water treatment, humidity, lighting, controls, security and other auxiliaries. Power usage effectiveness should remain a scenario variable rather than a constant marketing figure.
Water availability and discharge requirements can constrain the site. The investment file should identify source, quality, capacity, tariff, permits, backup and restrictions. Cooling equipment lead times should align with electrical and IT commissioning.
Waste-heat use or thermal storage can improve system economics in some locations. Their value depends on credible counterparties, infrastructure, temperature, duration and operating integration.
14. Allocate connection and construction risk
The project contracts should allocate design, procurement, interface, delay, cost overrun, performance, change and force-majeure risks. Utility works, customer works and third-party works should have clear boundaries.
Liquidated damages and warranties should be tested against actual loss and counterparty capacity. A transformer supplier's delay damages can be small compared with foregone compute revenue. The project may require schedule contingency and alternative equipment rather than relying on contractual compensation.
Financing conditions should follow the power path. Early land and development capital can fund studies and permits. Construction finance can require executed connection rights, fixed scope, procurement and customer evidence. IT-equipment financing can be released closer to energisation.
The funds-flow model should preserve enough liquidity to complete both network and facility work. Security deposits and utility contributions can consume cash before revenue. Contingent equity, completion support and cost-overrun facilities require credible sources.
15. Apply the relevant UAE power context
The UAE Energy Strategy 2050 aims to expand clean capacity, improve efficiency and maintain energy security as demand grows. The Ministry of Energy and Infrastructure stated that the country plans significant national investment to meet power demand and sustain economic growth.[5]
The Ministry reported in November 2025 that the UAE had surpassed 12 gigawatts of clean-energy capacity in 2024 and was investing in energy projects and infrastructure to maintain a reliable grid.[6] In January 2026 it described a target exceeding 23 gigawatts of renewable capacity by 2031 and a 35 percent clean-generation share by 2031.[7]
Those national figures provide context rather than a connection promise for a particular data-centre site. Electricity regulation, planning, procurement and service are organised through relevant federal and emirate-level institutions. A project requires evidence from the competent authority and utility for its location.
Published DEWA statistics and financial information can inform Dubai system context.[12] EWEC capacity statements can inform Abu Dhabi system planning context.[13] Neither substitutes for a site-specific connection process, technical study and executed arrangement.
16. Demonstrate a hypothetical site valuation
Consider two hypothetical sites for a 120-megawatt AI data-centre programme. Site A has lower land cost and an indicative 120-megawatt connection target in month 54. Site B has higher land cost, an executed 60-megawatt connection in month 30 and a studied expansion to 120 megawatts in month 42.
The hypothetical unpowered land and development cost is AED 240 million for Site A and AED 300 million for Site B. Site B requires AED 70 million more in near-term network and interface cost. Site A carries twelve additional months of facility and development cost before full operating ramp.
In the hypothetical base case, Site B creates AED 210 million of present value from earlier customer cash and AED 45 million from lower idle-equipment and financing carry. Its additional connection and property cost reduces value by AED 130 million. A risk reserve of AED 35 million is applied for the expansion stage. The hypothetical net grid-access advantage is AED 90 million.
Every amount, date, discount rate, probability, capacity, cost and result is a hypothetical management assumption. The example demonstrates the valuation method and does not claim a market price or transaction result.
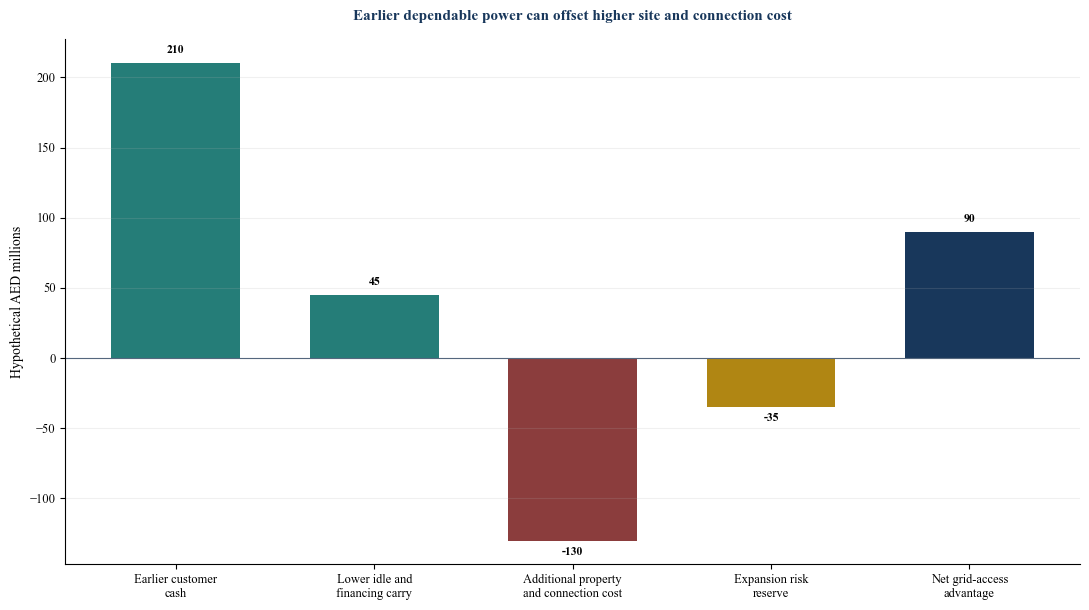
Every value is a hypothetical management assumption in AED millions created solely to demonstrate the method.
Table 4. Hypothetical site comparison
| Measure | Site A | Site B | Valuation relevance |
|---|---|---|---|
| Land and early development cost | AED 240m | AED 300m | initial property and development cash |
| Near-term connection and interface cost | AED 80m | AED 150m | funded electrical path |
| First usable power | month 48 | month 30 | first commissioning and customer cash |
| Full 120 MW target | month 54 | month 42 | full programme ramp |
| Connection evidence | indicative target | 60 MW executed; 60 MW studied | confidence and scenario weighting |
| Earlier customer cash PV | baseline | AED 210m advantage | dated operating cash difference |
| Idle equipment and carry PV | baseline | AED 45m advantage | avoided delay cost |
| Additional site and connection cost | baseline | AED 130m deduction | incremental capital requirement |
| Expansion risk reserve | baseline | AED 35m deduction | conditional second phase |
| Hypothetical net advantage | baseline | AED 90m | scenario result before transaction-specific review |
Every value and date is a hypothetical management assumption created solely to demonstrate the framework.
17. Stress the power and valuation system
The base case should be accompanied by connected downside scenarios. A connection-delay case changes interest, construction carry, IT delivery, customer commencement and facility cost. A capacity-reduction case changes racks, cooling, customer revenue and fixed-cost absorption.
A tariff case should change energy, demand and network charges. A curtailment case should change service levels, backup generation, fuel and customer credits. An equipment-delay case should change energisation and warranty. A low-utilisation case should retain fixed demand cost while customer cash ramps slowly.
The model should measure project liquidity, debt service, completion funding, customer cash, equity value and covenant headroom by date. It should identify the earliest funding shortfall and the decision available before that date.
Management actions can include rephasing construction, reducing IT orders, securing bridge power, accepting flexible service, adding storage, revising customer ramp, switching equipment, obtaining capital or moving a phase. Each action should have technical feasibility, permissions, cost, schedule and accountable ownership.
Table 5. Power and grid-access stress matrix
| Stress | Immediate effect | Valuation transmission | Required evidence and action |
|---|---|---|---|
| Connection delay | revenue and commissioning postponed | lower PV and higher carry | revised critical path and funded liquidity |
| Capacity reduction | fewer racks and lower customer service | lower revenue and fixed-cost absorption | reconfigured phase and customer plan |
| Transformer or cable delay | network completion slips | idle facility and equipment | supplier confirmation and alternative path |
| Tariff increase | operating cost rises | lower margin and customer pricing pressure | current tariff case and pass-through rights |
| Curtailment event | service interrupted or backup activated | service credits and fuel cost | operating protocol and tested response |
| Fuel constraint | onsite generation limited | reduced dependable capacity | contracted supply and autonomy test |
| Low customer ramp | capacity remains unused | demand charges and weak cash conversion | binding contracts and staged procurement |
| Common-mode failure | redundant paths fail together | outage loss and risk premium | architecture review and remediation |
| Expansion study changes | second phase cost or date worsens | option value falls | refreshed study and stop-investment gate |
Scenario magnitudes and actions require current project, utility, network and contractual evidence.
18. Operate through one power-control dashboard
The dashboard should connect utility evidence, schedule, procurement, construction, commissioning, operating performance, customer ramp, tariff, resilience and cash. Every metric should have a definition, source, date, owner and response threshold.
Core measures include contracted capacity, studied capacity, energised capacity, facility peak, IT load, power usage effectiveness, connection milestone, forecast first power, transformer and cable status, security deposited, connection cost, customer contracted capacity, actual utilisation, curtailment, outage, tariff, power cost and remaining project liquidity.
Forecast dates should retain the supporting evidence and movement history. Manual probability changes should be visible. The dashboard should distinguish utility commitment, contractor forecast and management estimate.
The committee should receive exceptions and decisions. It should know which milestone changed, what evidence changed, how value and liquidity moved, which customer or facility phase is affected, and what action is required.
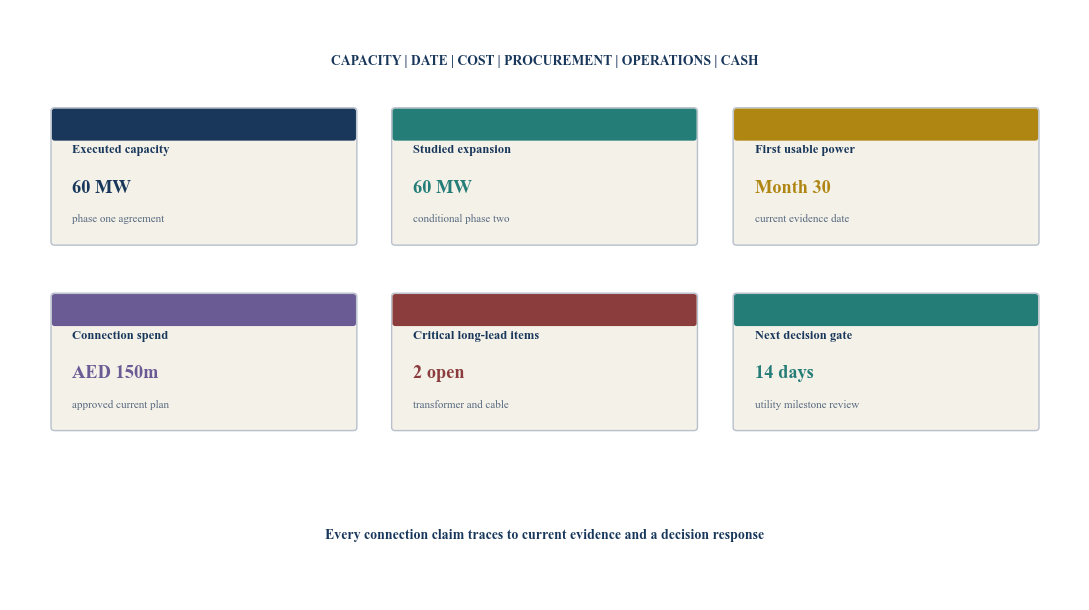
Every displayed value is a hypothetical management assumption created solely to demonstrate dashboard design.
19. Implement the decision framework in 120 days
Days one to twenty define the proposed load, development phases, customer service, site options, utility perimeter, professional roles and decision authority. The team preserves every connection and power document.
Days twenty-one to forty build the evidence hierarchy, legal-rights map, technical load model, queue assessment, connection scope, integrated schedule and initial cost plan. Utility and engineering evidence is reconciled to the site and customer case.
Days forty-one to sixty compare grid, onsite, hybrid and alternative-site routes. The team models usable capacity, date, cost, resilience, tariff, environmental requirements and customer cash for each feasible route.
Days sixty-one to eighty conduct technical, legal, environmental, commercial and valuation reviews. It tests transferability, milestones, long-lead procurement, power quality, resilience, expansion and connected downside scenarios.
Days eighty-one to one hundred negotiate the approved property, connection, construction, procurement, customer and financing conditions. A controlled funds-flow and completion-liquidity plan is established.
Days one hundred and one to one hundred and twenty close or decline the investment, activate the dashboard and set milestone gates. Subsequent capital remains conditional on current power evidence and verified progress.
Table 6. One-hundred-and-twenty-day power-before-property programme
| Days | Workstream | Controlled deliverable | Gate |
|---|---|---|---|
| 1 to 10 | mandate and load | phased power and service requirement | committee confirms decision scope |
| 11 to 20 | sites and authority | options, owners, utilities and advisers | each claim has accountable ownership |
| 21 to 30 | evidence hierarchy | connection documents and maturity grades | unverified capacity excluded from base case |
| 31 to 40 | engineering and schedule | load model, interface and critical path | technical team reconciles design |
| 41 to 50 | supply alternatives | grid, onsite, hybrid and relocation cases | feasible routes share one service basis |
| 51 to 60 | cost and cash | connection, tariff, resilience and customer model | finance team reproduces dated cash |
| 61 to 70 | rights and regulation | transfer, permits, milestones and obligations | qualified advisers confirm perimeter |
| 71 to 80 | stress and valuation | scenario PV, liquidity and cure actions | downside remains funded and actionable |
| 81 to 90 | transaction conditions | property, connection and procurement protections | conditions follow the power path |
| 91 to 100 | execution controls | funds flow, long-lead orders and dashboard | operating dry run passes |
| 101 to 110 | close or decline | authorised transaction decision | all stated evidence is current |
| 111 to 120 | adoption | first dashboard and next capital gate | committee accepts monitored execution |
Timing depends on utility process, project maturity, permissions, evidence and transaction scope.
20. Limitations and conclusion
Electricity systems, connection processes, tariffs, project queues, regulatory rules, equipment markets and AI loads can change during a development period. Site-level decisions require current evidence from the relevant authority, utility, contractors, engineers, customers and professional advisers.
IEA projections are scenarios for broader energy systems and do not establish the load, timing or cost of a particular project.[1][2][3] NERC, FERC and DOE materials apply within their stated United States purposes and jurisdictions.[8][9][11] UAE national policy and published utility information provide strategic and system context rather than site-specific connection rights.[5][6][7][12][13]
Every capacity, cost, value, discount rate, probability, date, tariff, utilisation, customer ramp and result in the worked example is a hypothetical management assumption. No site, utility commitment, customer contract, transaction, market price or realised outcome is claimed.
Grid access has investment value when it creates earlier, larger or more dependable operating cash after connection cost and risk. That value resides in a specific bundle of rights, technical scope, infrastructure, date, service conditions and continuing obligations.
Power-before-property discipline changes the investment sequence. The committee verifies the electrical path, values it through dated scenarios, designs resilience and connects further capital to evidence. Land and buildings then support a financeable compute platform.
References
- [1] International Energy Agency, Data centre electricity use surged in 2025, even with tightening bottlenecks driving a scramble for solutions, 16 April 2026. https://www.iea.org/news/data-centre-electricity-use-surged-in-2025-even-with-tightening-bottlenecks-driving-a-scramble-for-solutions
- [2] International Energy Agency, Energy and AI, Executive Summary, 10 April 2025. https://www.iea.org/reports/energy-and-ai/executive-summary
- [3] International Energy Agency, Electricity 2026, Grids, 2026. https://www.iea.org/reports/electricity-2026/grids
- [4] International Energy Agency, Building the Future Transmission Grid, Executive Summary, 25 February 2025. https://www.iea.org/reports/building-the-future-transmission-grid/executive-summary
- [5] UAE Ministry of Energy and Infrastructure, Updated UAE Energy Strategy 2050 and National Hydrogen Strategy, 4 July 2023. https://www.moei.gov.ae/en/media-center/news/4/7/2023/minister-of-energy-and-infrastructure-reveals-details-of-the-updated-uae-energy-strategy-2050-and
- [6] UAE Ministry of Energy and Infrastructure, Minister Highlights UAE Approach to Diversify Energy Mix at ADIPEC, 4 November 2025. https://www.moei.gov.ae/en/media-center/news/4/11/2025/minister-of-energy-and-infrastructure-highlights-uaes-approach-to-diversify-energy-mix-at-adipec
- [7] UAE Ministry of Energy and Infrastructure, UAE Clean-Energy Transition at Abu Dhabi Sustainability Week, 14 January 2026. https://www.moei.gov.ae/en/media-center/news/14/1/2026/ministry-of-energy-and-infrastructure-highlights-the-uaes-clean-energy-transition-at-abu-dhabi
- [8] United States Federal Energy Regulatory Commission, FERC Launches Aggressive Targeted Action to Speed Large Load Integration, 18 June 2026. https://www.ferc.gov/news-events/news/ferc-launches-aggressive-targeted-action-speed-large-load-integration
- [9] North American Electric Reliability Corporation, 2025 Long-Term Reliability Assessment, January 2026. https://www.nerc.com/globalassets/our-work/assessments/nerc_ltra_2025.pdf
- [10] Electric Power Research Institute, Grid Flexibility Needs and Data Center Characteristics, June 2025. https://restservice.epri.com/publicdownload/000000003002031504/0/Product
- [11] North American Electric Reliability Corporation, Large Loads Action Plan and Computational Load Essential Action Alert, current official materials accessed 13 August 2026. https://prod.nerc.com/initiatives/large-loads-action-plan
- [12] Dubai Electricity and Water Authority, Annual Statistics Booklet 2025. https://dewa.gov.ae/-/media/Files/About-DEWA/Annual-Statistics/DEWA_Annual_Statistics_Booklet_2025_EN.ashx
- [13] Emirates Water and Electricity Company, Statement of Future Capacity Requirements Summary Reports, official published materials. https://ewec.ae/media-kit/statement-of-future-capacity-requirements-summary-reports
- [14] IFRS Foundation, IFRS 13 Fair Value Measurement, official standard overview. https://www.ifrs.org/issued-standards/list-of-standards/ifrs-13-fair-value-measurement/
- [15] International Valuation Standards Council, International Valuation Standards, current official edition. https://www.ivsc.org/standards/
- [16] United States Department of Energy, Clean Energy Resources to Meet Data Center Electricity Demand, official resource. https://www.energy.gov/oe/clean-energy-resources-meet-data-center-electricity-demand
- [17] International Energy Agency, AI and Energy Security, Connecting Data Centres to Electricity Grids, 10 April 2025. https://www.iea.org/reports/energy-and-ai/ai-and-energy-security
About the Author
Chennakeshav Adya is an independent researcher and Managing Partner of Matchpoint Partners. His research focuses on investment strategy, capital formation, transaction execution, governance and operating-model design across the Gulf and international markets.
