

1. Treat the roll-up thesis as an operating system
A roll-up thesis should explain how repeated ownership changes produce a stronger business. The acquisition list is an input. The value mechanism is the operating system that converts separate companies into a platform with better customer economics, denser operations, stronger capabilities, improved purchasing, disciplined capital allocation and credible governance. Without that system, a sequence of acquisitions can create a larger collection of exceptions rather than a more valuable enterprise.
The board should require five connected proofs before authorising the first deal. The market proof establishes that enough attractive businesses exist in a defensible market. The density proof shows that geographic or customer proximity changes unit economics. The target proof defines which businesses fit the model and which should be excluded. The integration proof demonstrates that the platform can absorb change without degrading service, control or people. The capital proof shows that the sequence remains financeable through a downside and does not depend on immediate multiple expansion.
The thesis must work at acquisition one. Future scale cannot repair a weak first platform, a structurally poor market or an integration model that is still conceptual. The first deal sets accounting policies, systems, leadership behaviours, seller expectations, lender evidence and the template for every later transaction. It also consumes management attention before the organisation has learned how much integration effort the model actually requires.
A disciplined board therefore approves a sequence architecture rather than a headline target count. The architecture states what must remain common, what may remain local, which capabilities are built centrally, how acquisitions are paced, which evidence releases the next deal and which signals cause a pause. This converts ambition into a governed capital-allocation programme.
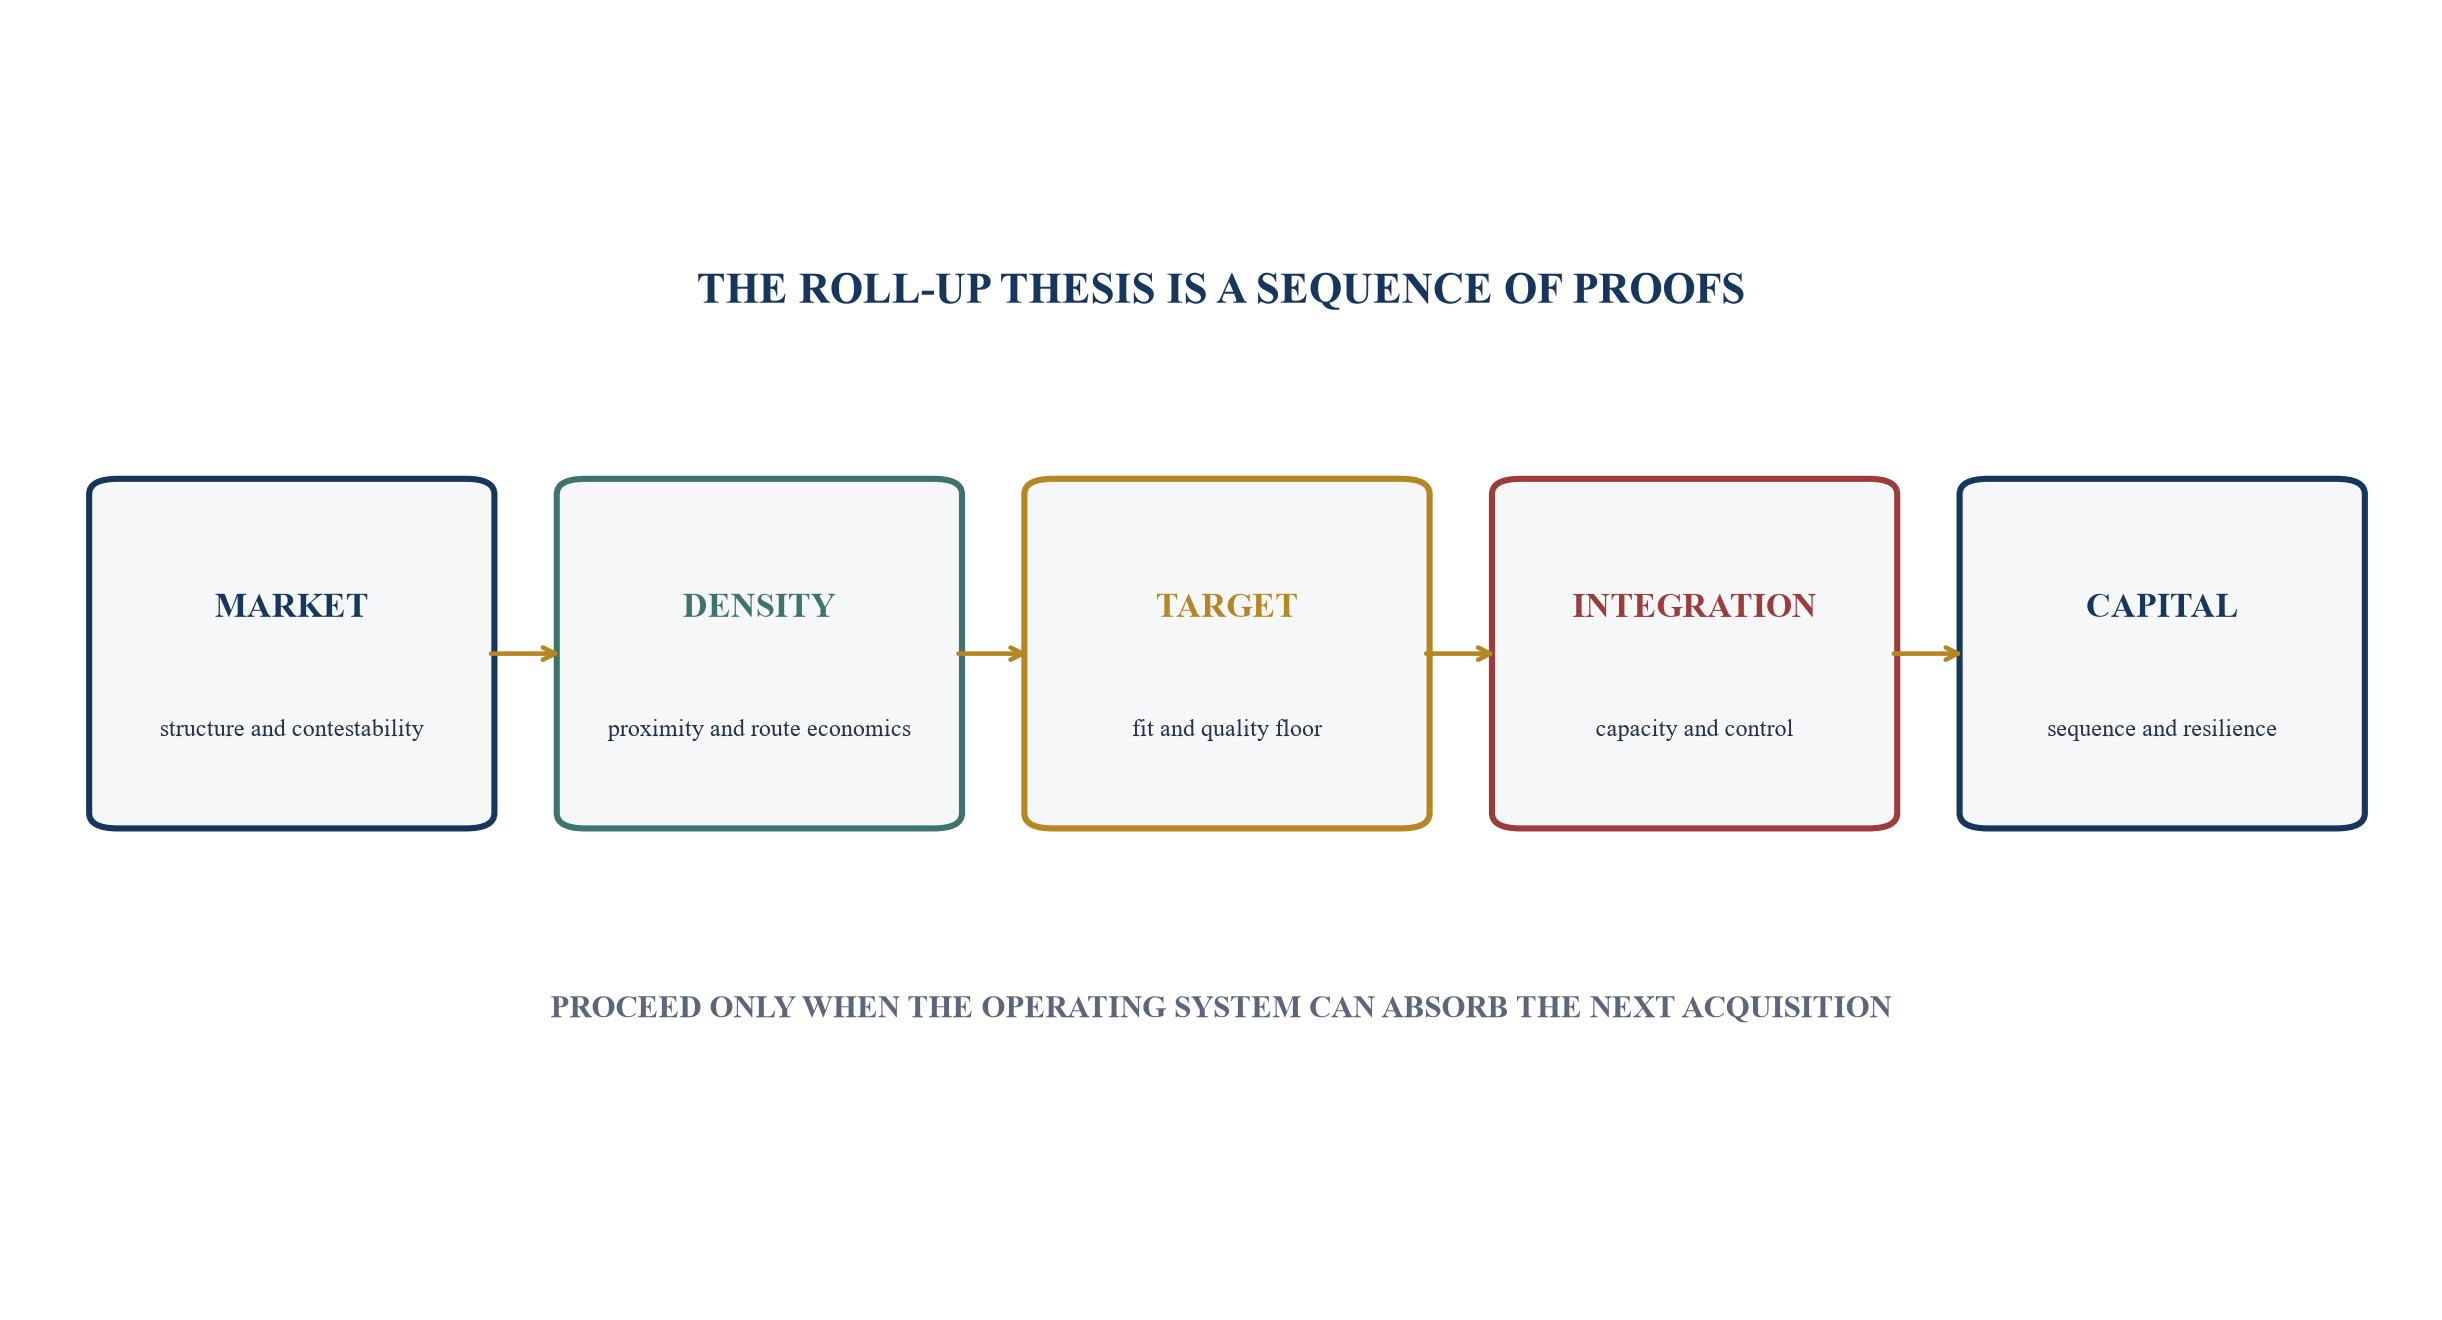
Each proof requires evidence before the first acquisition. Transaction-specific legal and regulatory analysis remains necessary.
2. Define the market economically and operationally
Industry labels are too broad for a roll-up decision. The relevant market should be defined through the customer problem, product or service, geography, channel, regulation and operational model. Two companies sharing an industry code may face different buyers, labour pools, service radii, procurement rules or licensing obligations. Conversely, businesses in adjacent codes may compete for the same customer outcome.
The team should build three market views. The commercial view identifies customers, use cases, switching behaviour, procurement criteria and alternatives. The operating view identifies delivery assets, labour, sites, routes, capacity constraints and service-level requirements. The competition view tests relevant product and geographic markets, participants, shares, concentration, entry and theories of harm. The United States agencies describe market definition as a way to identify the area of effective competition and to measure participants, shares and concentration [2]. The UK guidance similarly stresses case-specific evidence rather than mechanical application [8].
Market boundaries should be tested. A local service can be commercially national while operations remain constrained by technician travel time. A software-enabled business may appear geography-light while customer acquisition, regulation and implementation remain local. A distributor may have national warehouses but regional customer relationships. The roll-up model needs the narrowest operating boundary that governs cost and service, together with the broader market that governs demand and competition.
The evidence file should record each boundary, its supporting data, alternative definitions and the decision consequence. If density economics disappear under a reasonable alternative boundary, the thesis is fragile. If the target universe changes materially when a code, geography or customer segment is refined, the board should see that sensitivity before capital is committed.
Table 1. Market-definition questions and decision evidence
| Lens | Core question | Minimum evidence | Roll-up consequence |
|---|---|---|---|
| customer | what problem is bought and what substitutes constrain price or quality? | interviews, tenders, churn, win-loss, switching data | defines demand pool and cross-sell limits |
| product or service | which offerings are operationally and commercially comparable? | specifications, service levels, price architecture, delivery model | defines target comparability and standardisation |
| geography | how far can customers, labour, assets or routes move economically? | travel time, freight, site coverage, regulation, customer location | determines density cells and platform footprint |
| channel | do direct, distributor, marketplace and tender channels compete? | channel economics, customer overlap, supplier terms | shapes commercial integration and conflicts |
| regulation | which licences, ownership rules or approvals segment supply? | legal entities, licences, regulator map, transferability | constrains target pool and integration design |
| competition | who constrains the combined firm and how may a series be assessed? | shares, concentration, entry, buyer power, acquisition history | informs sequencing, filing and stop limits |
The table is a management framework. Qualified advisers determine transaction-specific competition and regulatory conclusions.
3. Build a verified target universe with data lineage
The target universe should be a reproducible dataset, not a broker list. It should start from official business registers, statistical classifications, licensing databases, trade associations, procurement records, property or site records and validated commercial sources. Eurostat business-demography data provide enterprise births, deaths, growth and regional breakdowns [18]. The United States County Business Patterns programme provides establishments, employment and payroll by detailed industry and geography [19]. The United Kingdom's business activity, size and location statistics provide enterprises and local units by industry, region, turnover and employment bands [20].
Every candidate needs a source record. The record should identify legal name, registration, ownership, trading names, sites, licences, estimated size, service lines, customer segments, geography, leadership, source date and confidence. Group structures and duplicate trading names must be resolved. Dormant entities, shell companies, branches, franchises, recently dissolved businesses and businesses outside the operational boundary should be separated rather than silently counted.
The universe should be tiered by evidence quality. Verified candidates have primary registration or licensing evidence and current commercial activity. Probable candidates have multiple consistent sources but incomplete primary confirmation. Leads have only one or indirect signals. Only the verified and probable tiers belong in addressable-market calculations, and the board should see the sensitivity when probable candidates are excluded.
Data lineage protects the thesis from false precision. Counts age quickly because businesses enter, exit, consolidate, relocate and change activities. The research process should timestamp sources, record inclusion rules and preserve a rejected-target log. A changing universe is expected. An unexplained change in the denominator can distort fragmentation, density, market share and the implied acquisition runway.
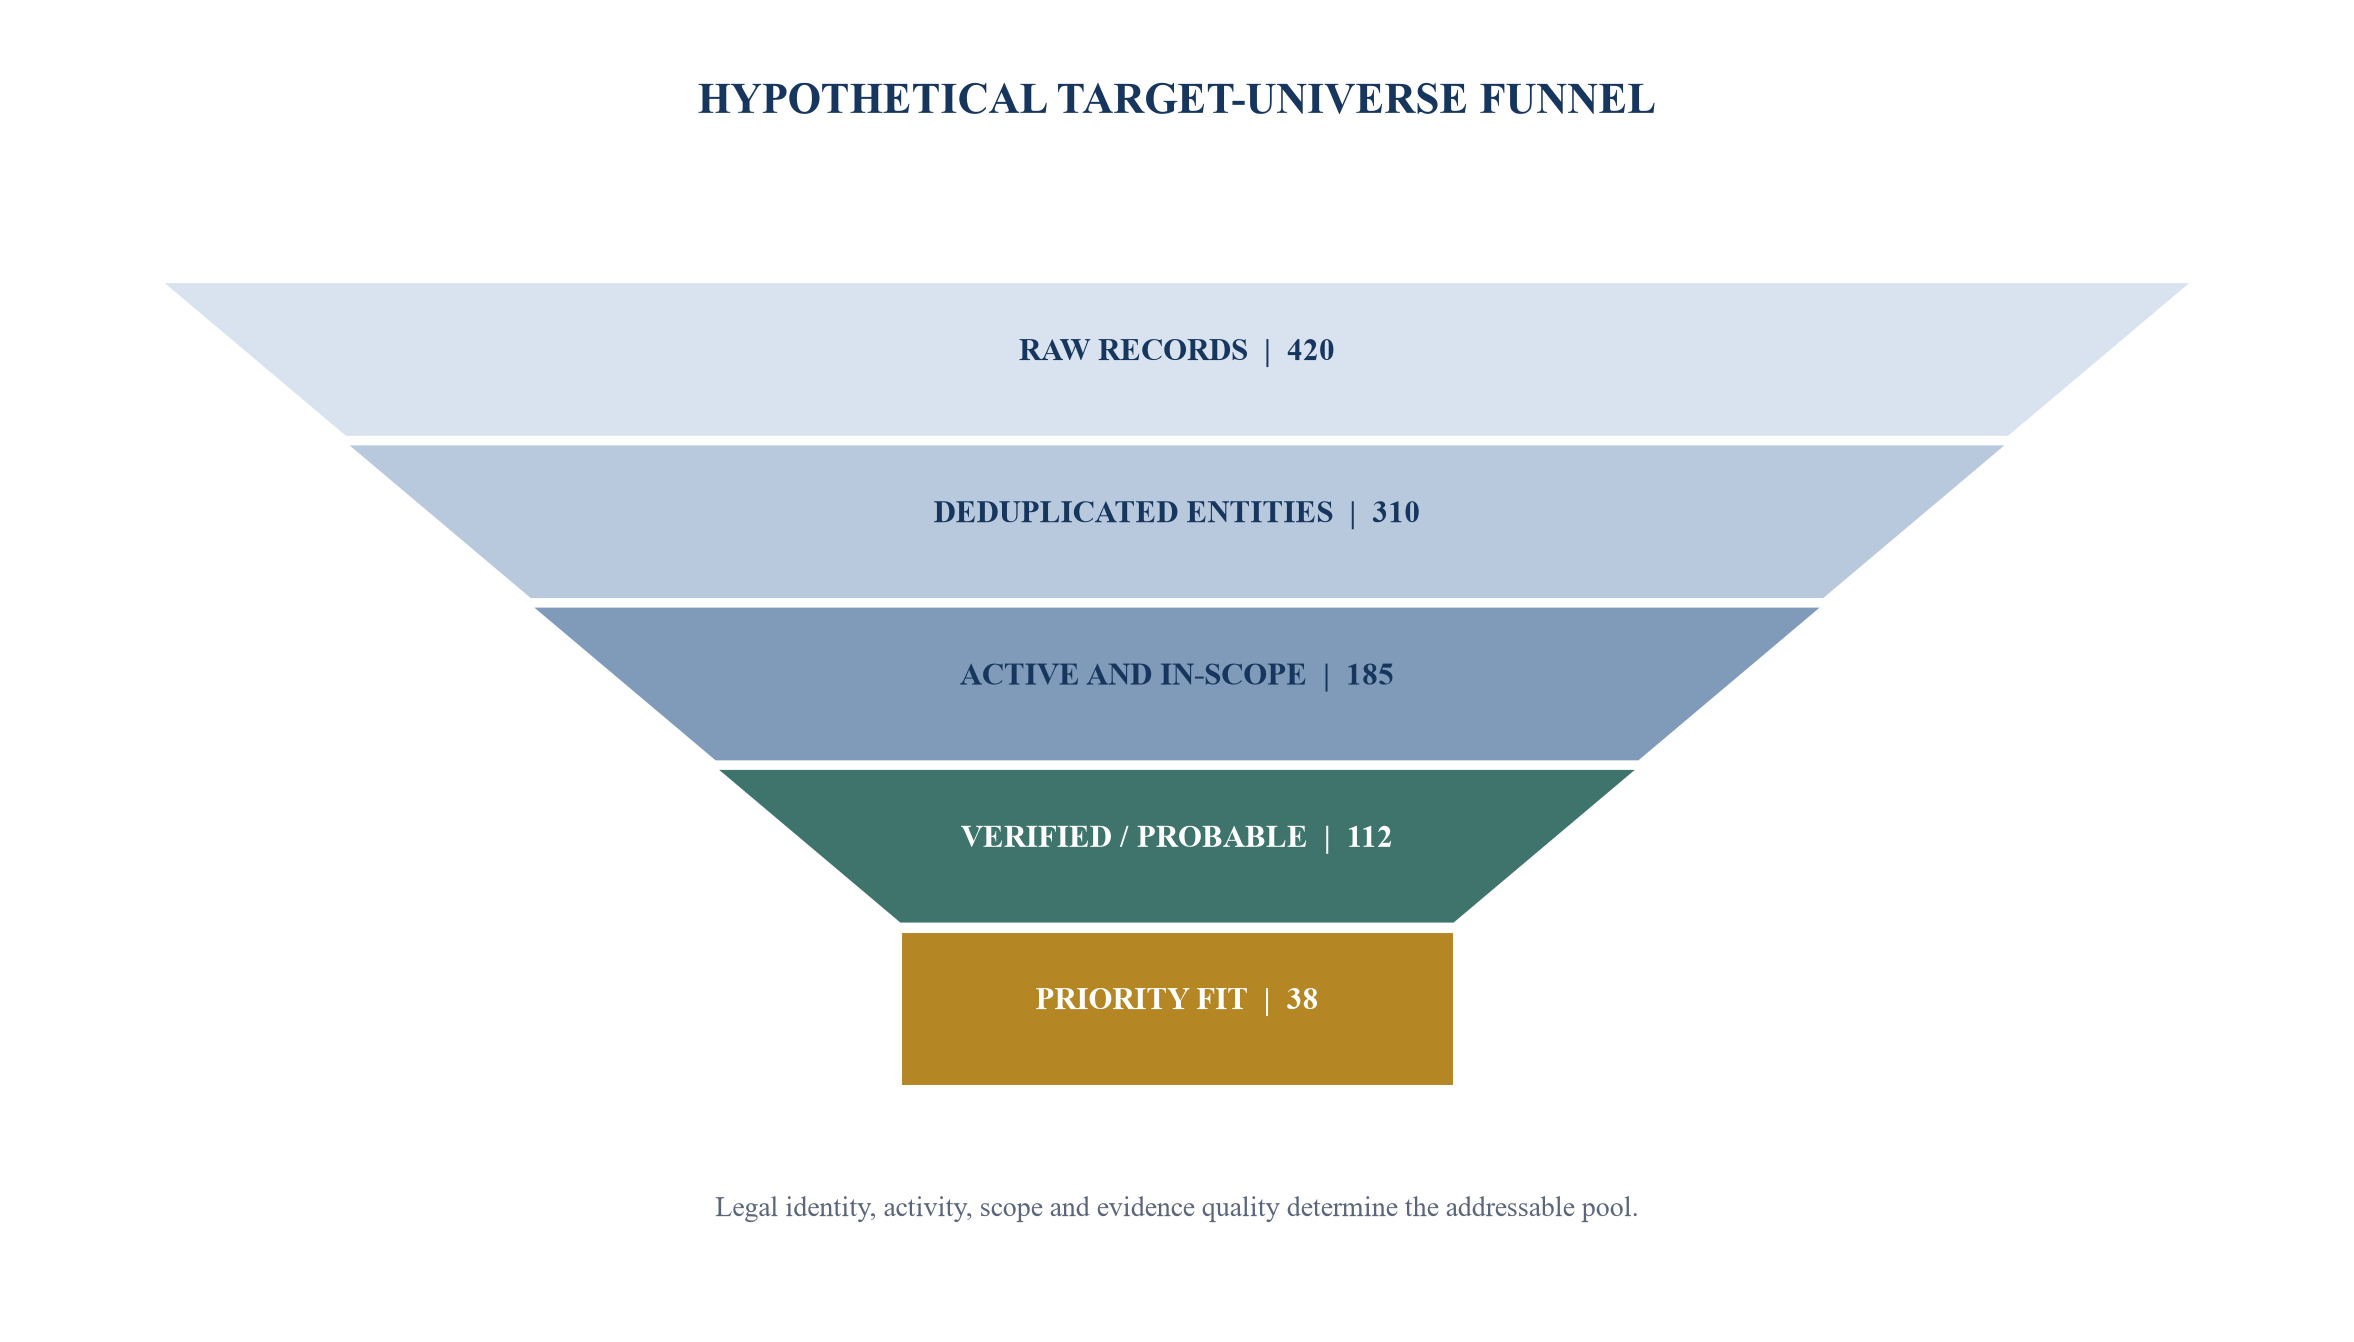
Counts are hypothetical and demonstrate the data-quality gate.
4. Measure fragmentation and contestability
Fragmentation is a distribution, not a slogan. The analysis should show the number of competitors, revenue or capacity shares, size bands, local shares, entry and exit, ownership type, customer concentration and recent acquisition history. A market with many legal entities may be economically concentrated if a few networks control demand, key licences, labour, procurement or technology. A market with several large providers can remain contestable when customers can sponsor entry or suppliers can expand quickly.
Concentration metrics should be calculated on supported market definitions. The United States guidelines describe the use of market shares and the Herfindahl-Hirschman Index while emphasising that the informative metric depends on market reality and data availability [3]. They also state that an industry's consolidation trend and a strategy involving multiple acquisitions can be relevant to review [4][5]. These principles matter for a roll-up because each transaction changes the market and the evidence available to regulators, customers and future sellers.
Contestability requires separate analysis. The team should test barriers to entry and expansion, customer switching, supplier constraints, labour scarcity, accreditation, capital intensity, reputation, digital distribution, exclusive contracts and access to essential inputs. It should identify maverick firms, local champions and businesses with distinctive quality, innovation or price behaviour. Acquiring a small but disruptive competitor can matter more than its current revenue share suggests.
The output should be a structure map with base and alternative market definitions. It should also show how the next three plausible acquisitions change shares, concentration, customer options and buyer power. Legal notification thresholds are only one gate. The strategic thesis should remain viable if a later acquisition faces delay, remedy, prohibition or a requirement to pursue a different geography.
5. Measure density through economic cells
Density creates value when proximity changes the cost, utilisation, speed or quality of delivery. The relevant unit may be a technician's drive time, a branch catchment, a warehouse radius, a hospital referral network, a route, a cluster of enterprise accounts, a procurement category or a data platform. Counting targets by country rarely proves density. The model should divide the market into economic cells that reflect how work is actually won and delivered.
Each cell should contain demand, existing sites, target sites, labour, capacity, travel or freight time, customer overlap, service levels, competition and regulatory constraints. The analyst should calculate current coverage, whitespace and the incremental effect of each target. A target that fills a route gap can improve utilisation without adding much revenue. Another can duplicate a site while bringing a scarce licence or customer relationship. Both may be valuable through different mechanisms.
Density benefits should be expressed in operational measures before they enter valuation. Examples include kilometres per job, technician jobs per day, warehouse turns, delivery time, same-day coverage, customer acquisition cost, sales calls per account, procurement volume per category, supervisor span and fixed cost per site. The operating owner should identify the action that produces the benefit and the time needed to change behaviour.
The density map should also show diseconomies. Congestion, wage competition, duplicated management, facility exits, customer conflicts, local regulation and integration workload can offset proximity. A cluster can be commercially dense and organisationally overloaded. The board needs both the economic opportunity and the capacity required to realise it.
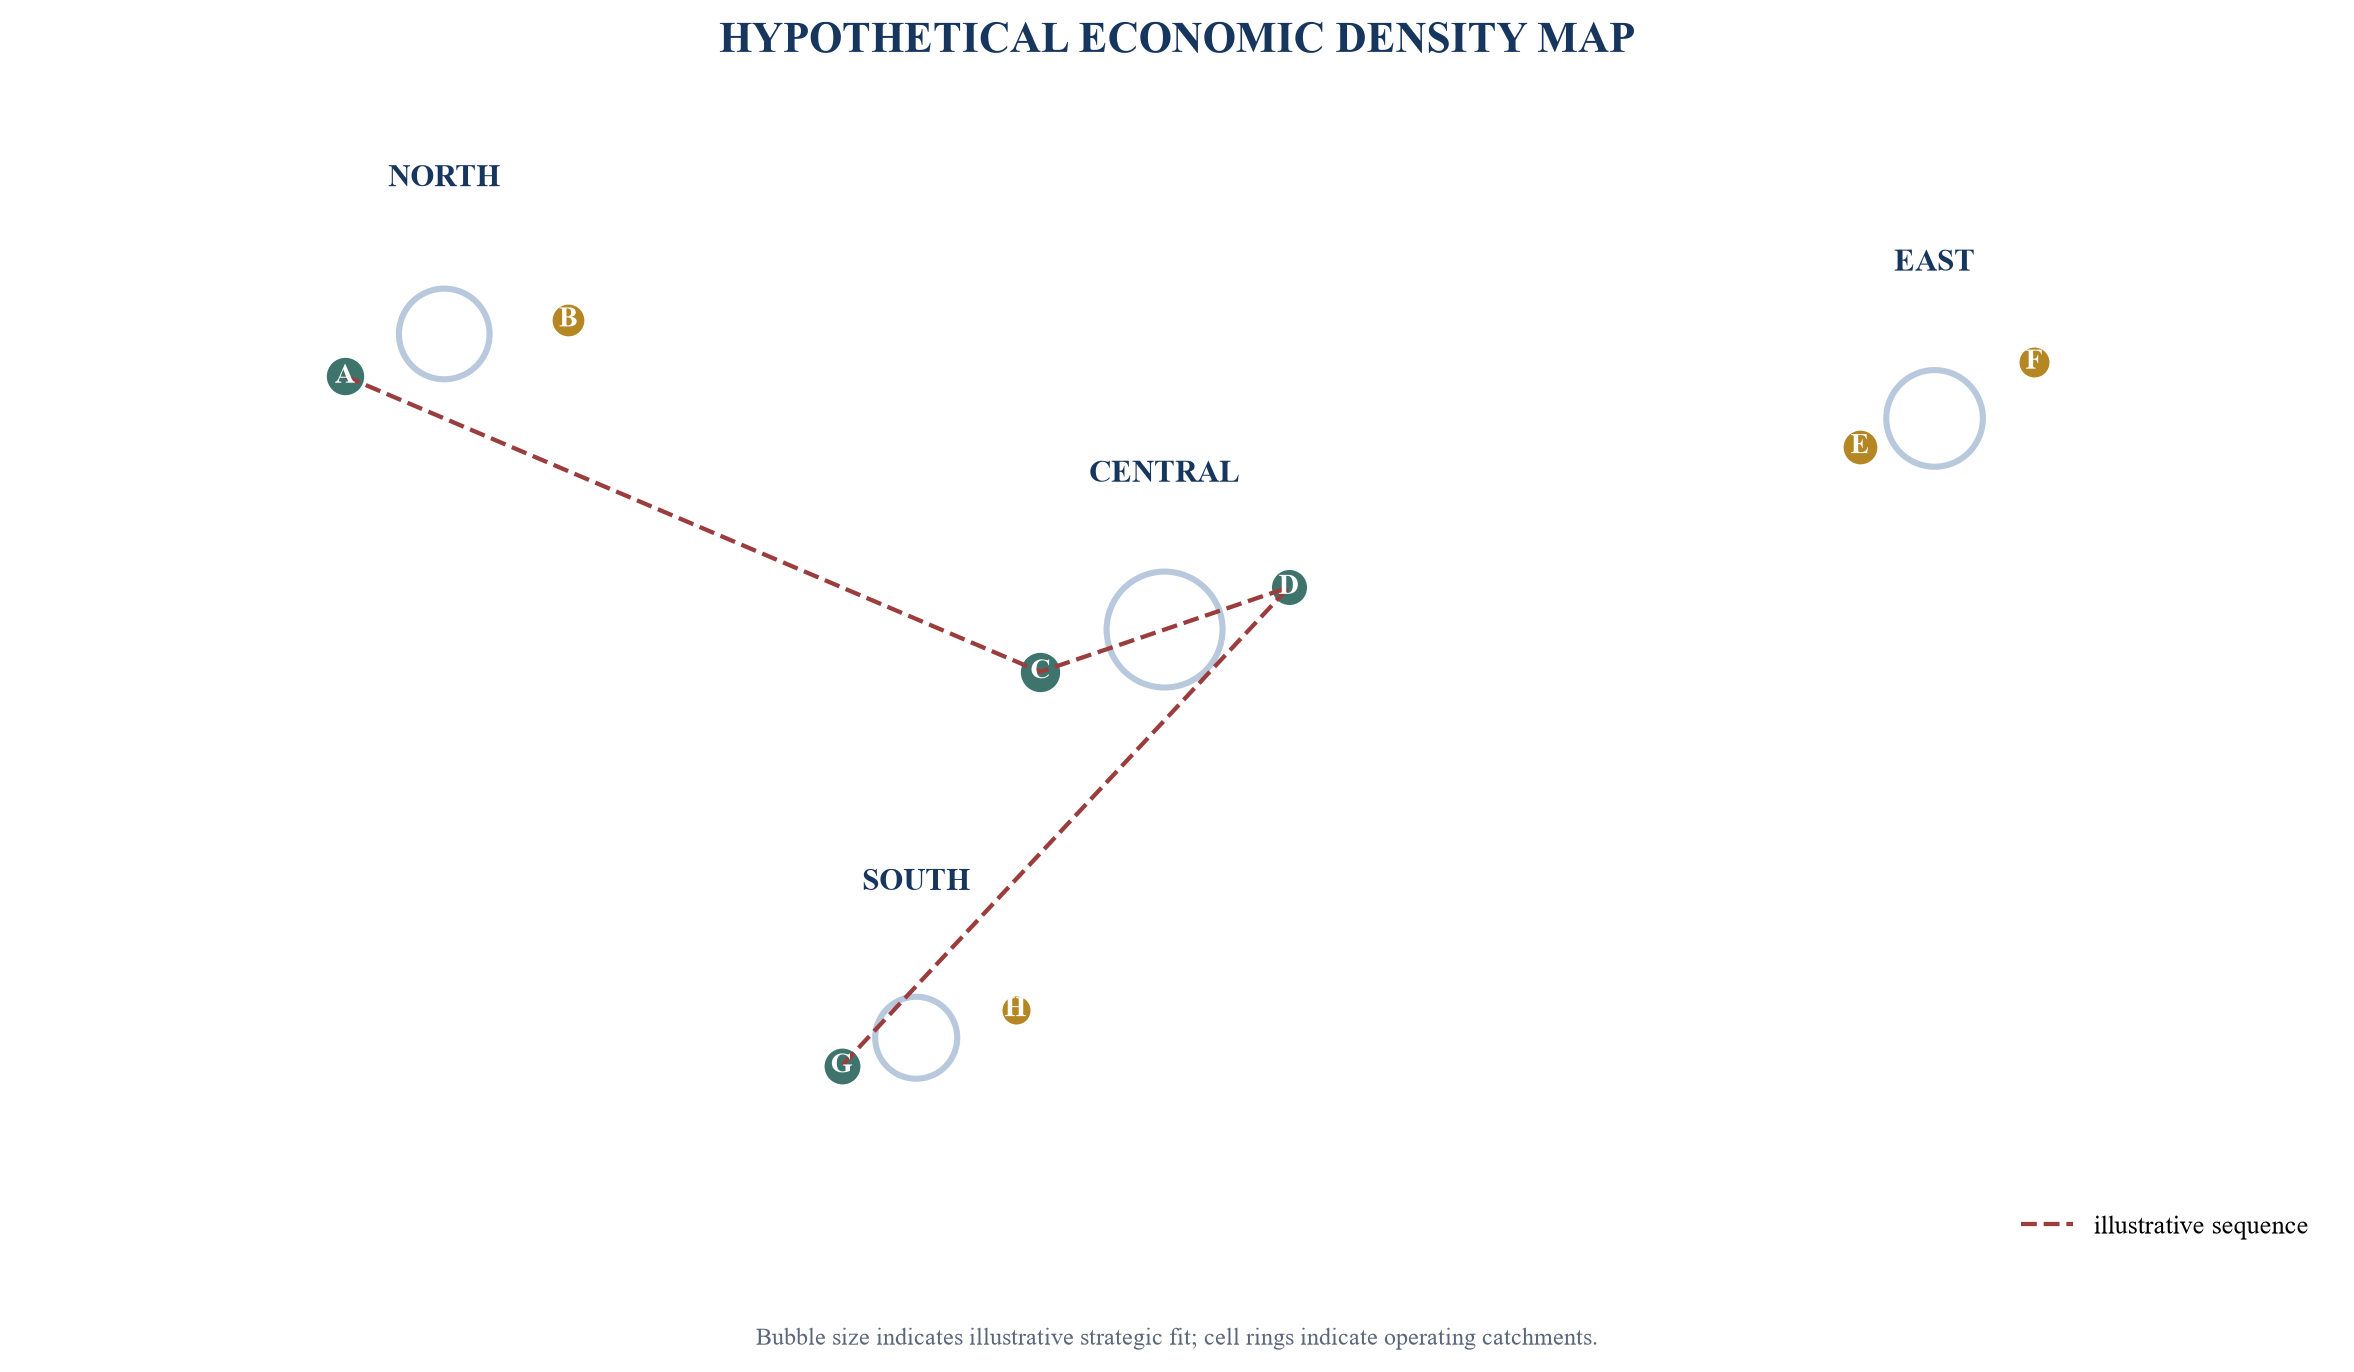
Locations and scores are illustrative management assumptions. They do not represent actual businesses or markets.
6. Separate density from adjacency
Adjacency means that a new business can use enough of the platform's existing commercial, operational or control system to create value without introducing disproportionate complexity. Shared customers alone are insufficient. The platform may lack the sales capability, technical accreditation, service model, inventory, data rights or leadership required to serve the adjacent need.
The analysis should score six forms of adjacency: customer, product, channel, geography, capability and regulation. It should identify shared assets and new requirements. A target can be commercially adjacent and operationally distant. Another can be operationally similar while serving a channel that conflicts with existing distributors. The score should therefore expose both reuse and exception.
The strongest adjacencies usually have a specific transfer mechanism. The platform can cross-sell a proven offer to an overlapping account base; consolidate procurement for the same input; use a shared route or site; deploy a common system; transfer a scarce capability; or satisfy a regulatory requirement that opens a defined market. Each mechanism needs an owner, baseline, action, timing, cost and metric.
Adjacency should influence sequence. The first add-on should test the core operating model with limited novelty. More distant adjacencies can follow after the integration system, data model and leadership bench have been proven. A programme that begins with several untested dimensions can obscure whether underperformance comes from the target, integration design or the thesis itself.
Table 2. Adjacency test for target selection
| Dimension | Evidence of true adjacency | Warning signal | Sequence implication |
|---|---|---|---|
| customer | identified account overlap and credible buying path | different buyer, tender or service expectation | delay until commercial playbook is proven |
| product | common inputs, quality system or delivery capability | new accreditation, liability or inventory model | require specialist capability before acquisition |
| channel | aligned incentives and pricing architecture | distributor conflict or channel cannibalisation | isolate or redesign route to market |
| geography | shared routes, sites, labour or supervision | nominal proximity without operating overlap | treat as new cluster rather than density add-on |
| capability | transferable process, talent or technology | dependence on individuals who may leave | make retention and knowledge transfer conditions |
| regulation | reusable licence framework and controls | non-transferable licence or new regulator | obtain advice and capacity before signing |
Scores should be supported by diligence evidence and operating-owner review.
7. Define target archetypes and a quality floor
A roll-up needs target archetypes because different acquisitions perform different jobs. A platform establishes leadership, systems and credibility. A density add-on fills a geographic or route gap. A capability target adds a service, accreditation or technology. A customer target provides access to a defined account pool. A turnaround may offer price upside while consuming unusual integration capacity. Mixing these roles without explicit classification creates inconsistent pricing and priorities.
Each archetype requires a quality floor. The floor should cover revenue evidence, earnings quality, cash conversion, customer concentration, recurring or repeat demand, labour, leadership dependency, systems, compliance, claims, tax, cyber, data, licences and integration effort. A low purchase multiple should not compensate automatically for missing records, weak controls or a business that cannot operate through transition.
The rejected-target log is strategically useful. It shows whether the market contains enough businesses that pass the floor, why candidates fail and whether the thesis is drifting to keep the pipeline alive. If most targets fail for the same reason, the board should revisit the market, price or operating model. Lowering the floor deal by deal transfers selection risk into integration.
Pricing rules should vary by archetype and value source. A platform can justify investment in systems and leadership. A density target may justify a premium only when route or site benefits are evidenced. A capability target may be valued through its scarce talent or market access. A turnaround needs explicit funding, leadership and control capacity. The board should see the price paid for standalone cash flows separately from the value expected from the platform.
Table 3. Target archetypes, value mechanisms and quality gates
| Archetype | Strategic job | Primary value mechanism | Non-negotiable gate |
|---|---|---|---|
| platform | establish leadership and operating backbone | systems, governance, brand and acquisition capability | scalable management, reliable records and control environment |
| density add-on | fill a route, site or coverage gap | utilisation, service speed and local fixed-cost absorption | verified proximity and compatible delivery model |
| capability | add a scarce service, licence or technology | cross-sell, differentiation and access | retainable capability and transferable rights |
| customer access | enter a defined account pool or channel | lower acquisition cost and broader wallet share | durable relationships and manageable concentration |
| consolidation | combine overlapping capacity | procurement, footprint and overhead efficiency | executable transition without service loss |
| turnaround | repair an underperforming asset | operational improvement and capital discipline | funded plan, leadership capacity and downside containment |
The quality floor applies before synergy or multiple expansion is credited.
8. Normalise unit economics before comparing targets
Comparable EBITDA can hide different economic engines. The roll-up model should therefore normalise each target at the unit level. The relevant unit may be a customer, contract, location, route, professional, technician, bed, vehicle, project, subscription or installed asset. Revenue, gross margin, direct labour, capacity, working capital, maintenance expenditure, leases and customer retention should be reconciled to that unit.
The bridge begins with audited or reliable reported results and removes owner-specific, related-party, one-off and accounting differences. It then separates maintenance from growth expenditure, normalises working capital and identifies the cost of operating at the platform's required service and control standard. A business with high reported margin may require additional compliance, technology, management or maintenance spending after acquisition. That cost belongs in the acquisition case.
IFRS 3 requires an acquirer to recognise and measure acquired assets, liabilities and goodwill through the acquisition method [23]. IAS 36 governs impairment testing, including cash-generating units containing goodwill [24]. These accounting requirements reinforce the need for a clear baseline, purchase-price allocation inputs and post-acquisition performance evidence. The operating model should be able to explain which cash flows support the acquired goodwill and how actual performance compares with the acquisition thesis.
Unit economics should be shown by cohort and location when possible. Average results can conceal underperforming sites, customer concentration or capacity constraints. The platform should know which units are suitable for replication, which require repair and which should be exited. A target that improves density in one cell while importing several weak units can still destroy value.
9. Build the acquisition sequence before naming the first target
Sequence determines risk. The first acquisition should validate the operating model and create evidence for the second. A platform with strong leadership and systems can support add-ons. A platform chosen mainly for size may consume the same capabilities needed to integrate later targets. The board should compare alternative sequences using explicit dependencies.
Each proposed acquisition should show what it teaches, what capability it requires and what gate it unlocks. The first deal may validate reporting, service continuity and seller transition. The second may test density benefits in an existing cell. The third may add a capability or enter a new cluster. The programme should avoid testing platform integration, geographic expansion, channel change and a turnaround simultaneously.
The sequence model should include regulatory accumulation. The United States guidelines state that agencies may examine a series of multiple acquisitions as part of a pattern or strategy [5]. Australia operates a mandatory notification regime from 1 January 2026 for acquisitions meeting its thresholds [11][12]. India, Singapore, Canada, the European Union, the United Kingdom and the UAE apply their own jurisdictional and substantive frameworks [7][8][9][10][13][14][15]. A global programme needs a living filing and competition map rather than a single threshold check.
The board should approve pause conditions. These include integration milestones missed, leadership vacancies, customer attrition, control failures, covenant headroom below the management floor, unresolved regulatory issues, excessive seller pricing or a target universe that no longer supports the original runway. A pause protects the programme's learning loop and prevents pipeline momentum from becoming the decision criterion.
10. Model synergy by mechanism and evidence class
Synergy should be a portfolio of operating changes. Each item needs a baseline, mechanism, owner, dependency, implementation cost, timing, probability and measurement source. Categories can include procurement, footprint, labour productivity, shared services, pricing, cross-sell, customer retention, working capital, technology and capital expenditure. A broad percentage of target cost or revenue provides little control.
The model should separate four evidence classes. Contracted items have executed terms or completed actions. Designed items have an approved plan and accountable owner. Benchmarked items rely on comparable internal or external evidence. Aspirational items express strategic possibility without a tested path. Only the first three should normally support the base case, and the treatment should reflect the quality of evidence.
Costs and dis-synergies belong in the same register. Retention, system migration, severance, facilities, rebranding, duplicated teams, customer concessions, professional fees, cyber remediation and working-capital disruption can precede benefits. Revenue synergies may have low gross margin, delayed sales cycles or channel conflicts. The cash profile should be visible by month around completion and by quarter through stabilisation.
The synergy register should reconcile with management accounts. Finance validates the baseline and benefit bridge. Operating owners confirm the intervention and operational metric. The integration office tracks delivery and dependencies. The board sees gross benefit, one-time cost, recurring cost, dis-synergy, net cash and evidence status. This prevents the same saving appearing in valuation, budget and restructuring plans without a single accountable record.
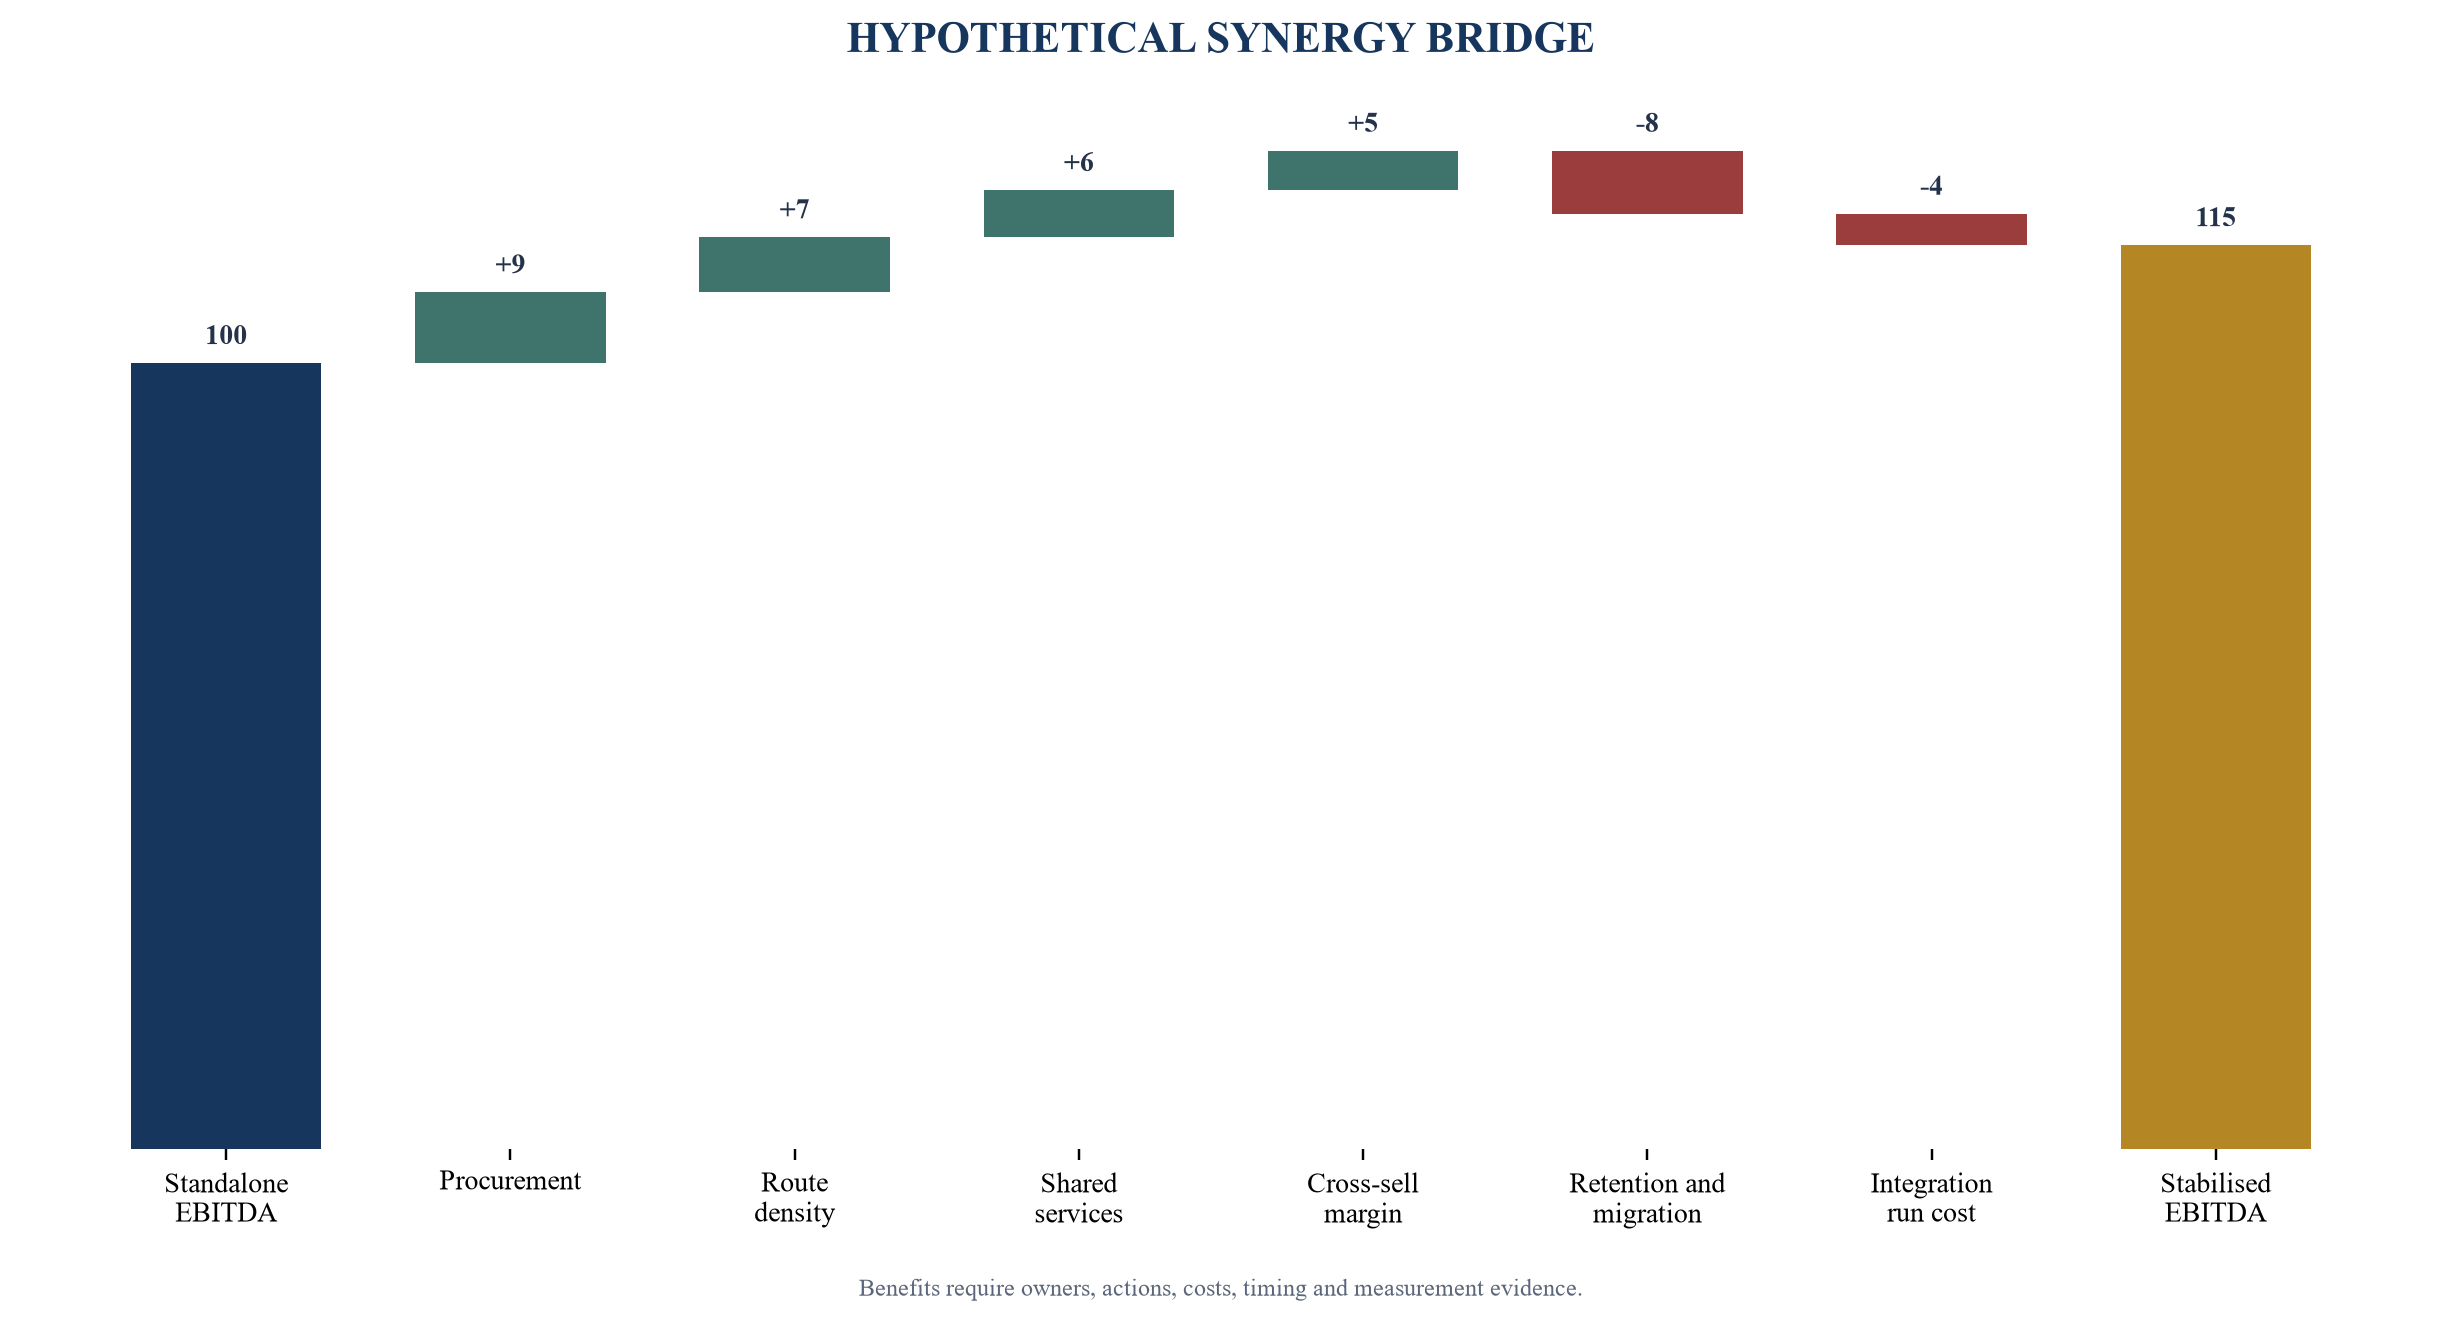
Values are illustrative management assumptions and do not represent a transaction or forecast.
11. Measure integration capacity as a constrained resource
Integration capacity is the organisation's ability to absorb change while protecting customers, employees, cash, compliance and control. It is finite and multidimensional. A finance team can be ready while technology, operations or leadership are overloaded. A single composite score can hide the bottleneck that determines whether the next deal is safe.
The capacity model should cover leadership, operations, customers, people, finance, technology, data, cyber, legal, tax, compliance, communications and change delivery. Each dimension needs available owners, allocated hours, critical dependencies, current initiatives, required skills and evidence of prior delivery. Capacity should be measured across the full sequence, including diligence, signing, Day One, migration and stabilisation.
The integration office should maintain a demand-and-capacity plan. Demand comes from work packages such as account mapping, payroll, banking, systems access, data migration, licences, supplier changes, reporting, customer communications and control remediation. Capacity comes from named internal owners and contracted external support. The plan should distinguish work that can be standardised from judgement-intensive work requiring scarce leaders.
The release gate for the next transaction should be based on stabilisation evidence. Completion of a task list is insufficient if customer service, data quality or controls remain weak. The board should require operating and control metrics to return within defined ranges, material exceptions to have owners and dates, and the leadership bench to have enough unallocated capacity for the next cycle.
Table 4. Integration-capacity dimensions and release evidence
| Dimension | Typical demand | Capacity evidence | Release signal |
|---|---|---|---|
| leadership | decisions, escalation, seller transition, operating cadence | named sponsor, business lead and succession coverage | decisions within cadence and no critical vacancy |
| customers | communications, contract review, account ownership, service recovery | tiered account plan and relationship coverage | retention and service metrics within tolerance |
| operations | sites, routes, quality, procurement, safety and capacity | standard work, process owners and exception log | stable service, quality and utilisation |
| people | payroll, benefits, consultation, retention and culture | reconciled workforce data and accountable HR plan | payroll accurate and critical roles retained |
| finance and control | close, cash, tax, reporting, authority and audit | chart of accounts, close plan, delegations and control map | timely close and no unresolved material control gap |
| technology and data | access, infrastructure, applications, migration and cyber | architecture, inventory, migration tests and rollback | stable access, reconciled data and controlled risk |
Capacity should be assessed by named owner, hours, dependencies and current workload.
12. Design the target operating model before integration begins
The target operating model defines what becomes common, what remains local and how decisions move. It should cover customer ownership, service delivery, procurement, pricing, brand, sites, people, technology, data, finance, risk and governance. A roll-up cannot integrate consistently when each transaction starts with a blank design exercise.
The model should distinguish mandatory standards from optional convergence. Mandatory standards usually include authority, cash, financial reporting, sanctions, anti-bribery, data protection, cyber, safety, tax, incident escalation and board reporting. Commercial, brand and operating processes may converge in stages when local continuity matters. The decision should reflect value and risk rather than a cultural preference for centralisation or autonomy.
Decision rights need named forums and thresholds. Local leaders should know which pricing, hiring, customer, supplier, capital, litigation and technology decisions they can make. Central functions should know when they advise, approve, execute or assure. The refreshed IIA Three Lines statement emphasises board accountability and the distinct contributions of management, risk and internal audit [29]. A serial-acquisition platform benefits from that clarity because the control environment changes repeatedly.
The model should be tested against target archetypes. A density add-on may enter the standard operating model quickly. A capability target may need protected technical autonomy. A regulated entity may require ring-fencing and local governance. These variations should be designed patterns, not improvised exceptions. The platform becomes scalable when it can explain and govern a limited number of integration modes.
13. Build the technology and data architecture for repetition
Technology integration should begin with a minimum architecture, not an automatic migration date. The platform needs an inventory of applications, infrastructure, identities, interfaces, data, vendors, licences, cyber controls, resilience and technical debt. It should define the systems of record for customer, employee, supplier, product, service, asset and finance data.
The architecture should specify Day One controls, coexistence rules, migration standards and decommission criteria. Immediate access and security issues may require action at completion. Core operational systems may remain temporarily because rushed migration can disrupt service. The platform should preserve a controlled data bridge so reporting, cash and customer management remain reliable during coexistence.
Data definitions are a strategic asset. Revenue, customer, job, location, churn, utilisation, backlog, margin and synergy must mean the same thing across the group. A controlled dictionary, ownership model and reconciliation process should precede consolidated dashboards. Otherwise, central reporting can create apparent precision from inconsistent records.
NIST's Cybersecurity Framework 2.0 provides outcomes for governing, identifying, protecting, detecting, responding and recovering from cyber risk across organisations [28]. The roll-up should use a common profile and exception process for each acquired entity. Cyber remediation, identity integration, third-party access and data movement should be sequenced with operating continuity and legal requirements.
14. Protect people, knowledge and leadership continuity
Many targets are valuable because of people who hold customer trust, technical knowledge, licences, process memory or local leadership. The thesis should map those roles before price is finalised. It should distinguish equity owners from critical employees, identify single points of failure and understand which relationships or permissions depend on named individuals.
Retention design should connect role, risk, performance and time. A payment tied only to staying can preserve presence without transferring knowledge or building the new organisation. The plan should include account handover, documentation, training, succession and measurable operating responsibilities. Seller transition should have a defined scope, decision authority and end state.
Culture should be translated into observable practices. Decision speed, customer escalation, safety, quality, expenses, pricing, hiring and performance management reveal how the business actually operates. The integration team should identify practices that protect value, practices that conflict with group standards and practices that require a deliberate transition. Broad culture labels provide little execution guidance.
Leadership capacity must be built ahead of the pipeline. The programme should have candidates for cluster leadership, finance, operations, technology and integration roles before multiple acquisitions close. Promoting every seller into a permanent senior role can create an oversized structure. Removing local leaders too quickly can damage customers and knowledge. The target operating model should define temporary and enduring roles.
15. Build a jurisdiction and competition sequence map
A roll-up changes its regulatory position with every acquisition. The programme should maintain a jurisdiction map covering merger control, sector approvals, foreign investment, ownership, licences, data, labour, tax, environmental obligations and customer consents. Each target should be screened early enough for timing, information and remedy risk to affect valuation and sequencing.
Competition analysis deserves programme-level governance. The United States agencies consider consolidation trends and may examine a pattern or strategy of multiple acquisitions [4][5]. The European Commission is reviewing its merger guidelines and published draft guidelines in April 2026 while the existing horizontal and non-horizontal guidelines remain relevant to current practice [6][7]. The United Kingdom, Canada, Australia, India, Singapore and the UAE each publish their own frameworks and processes [8][10][11][12][13][14][15]. The programme should obtain qualified local advice and avoid transferring a conclusion from one jurisdiction to another.
The competition map should show relevant-market hypotheses, participants, shares, concentration, local overlaps, vertical relationships, labour-market effects, customer dependence and the acquisition history. It should model the combined effect of the next plausible transactions under alternative boundaries. A small transaction can still matter when it removes a close competitor, strengthens an already important position or forms part of a broader consolidation pattern.
The sequence should preserve optionality. If one cluster approaches a competition or regulatory limit, the platform should be able to pursue another geography, capability or organic investment path. The thesis is stronger when value does not depend on acquiring every named target. The board should approve jurisdiction-specific filing, standstill, information-sharing and integration controls before signing.
16. Finance the sequence rather than one transaction
The capital plan should cover acquisition price, refinancing, fees, integration, restructuring, technology, retention, working capital, tax, minimum cash and contingency across the first three transactions. It should show base, downside and pause cases. Funding only the purchase price can leave the organisation unable to implement the operating model that justified the deal.
Debt capacity should be built from sustainable free cash flow and tested after integration cost, customer disruption, working-capital movement and delayed synergy. The programme should maintain minimum liquidity and covenant headroom at the portfolio level and by borrower. The first deal may be financeable while the sequence is not. The board should see when additional equity, seller consideration, delayed closing or a slower pace becomes necessary.
The valuation model should separate standalone value, control value, evidenced synergy and option value. Multiple arbitrage should be reported as a scenario rather than the operating thesis. Exit multiples can contract, financing costs can rise and buyers can discount a platform with inconsistent reporting or unfinished integration. The programme should create value through cash, capability and evidence before relying on re-rating.
Capital allocation should compare acquisition with organic investment, partnerships and returning capital. A target may be available while an organic site, technology implementation or leadership hire offers a better risk-adjusted use of capacity. The board should use a common decision frame that includes strategic fit, returns, cash profile, risk, integration demand and effect on the future option set.
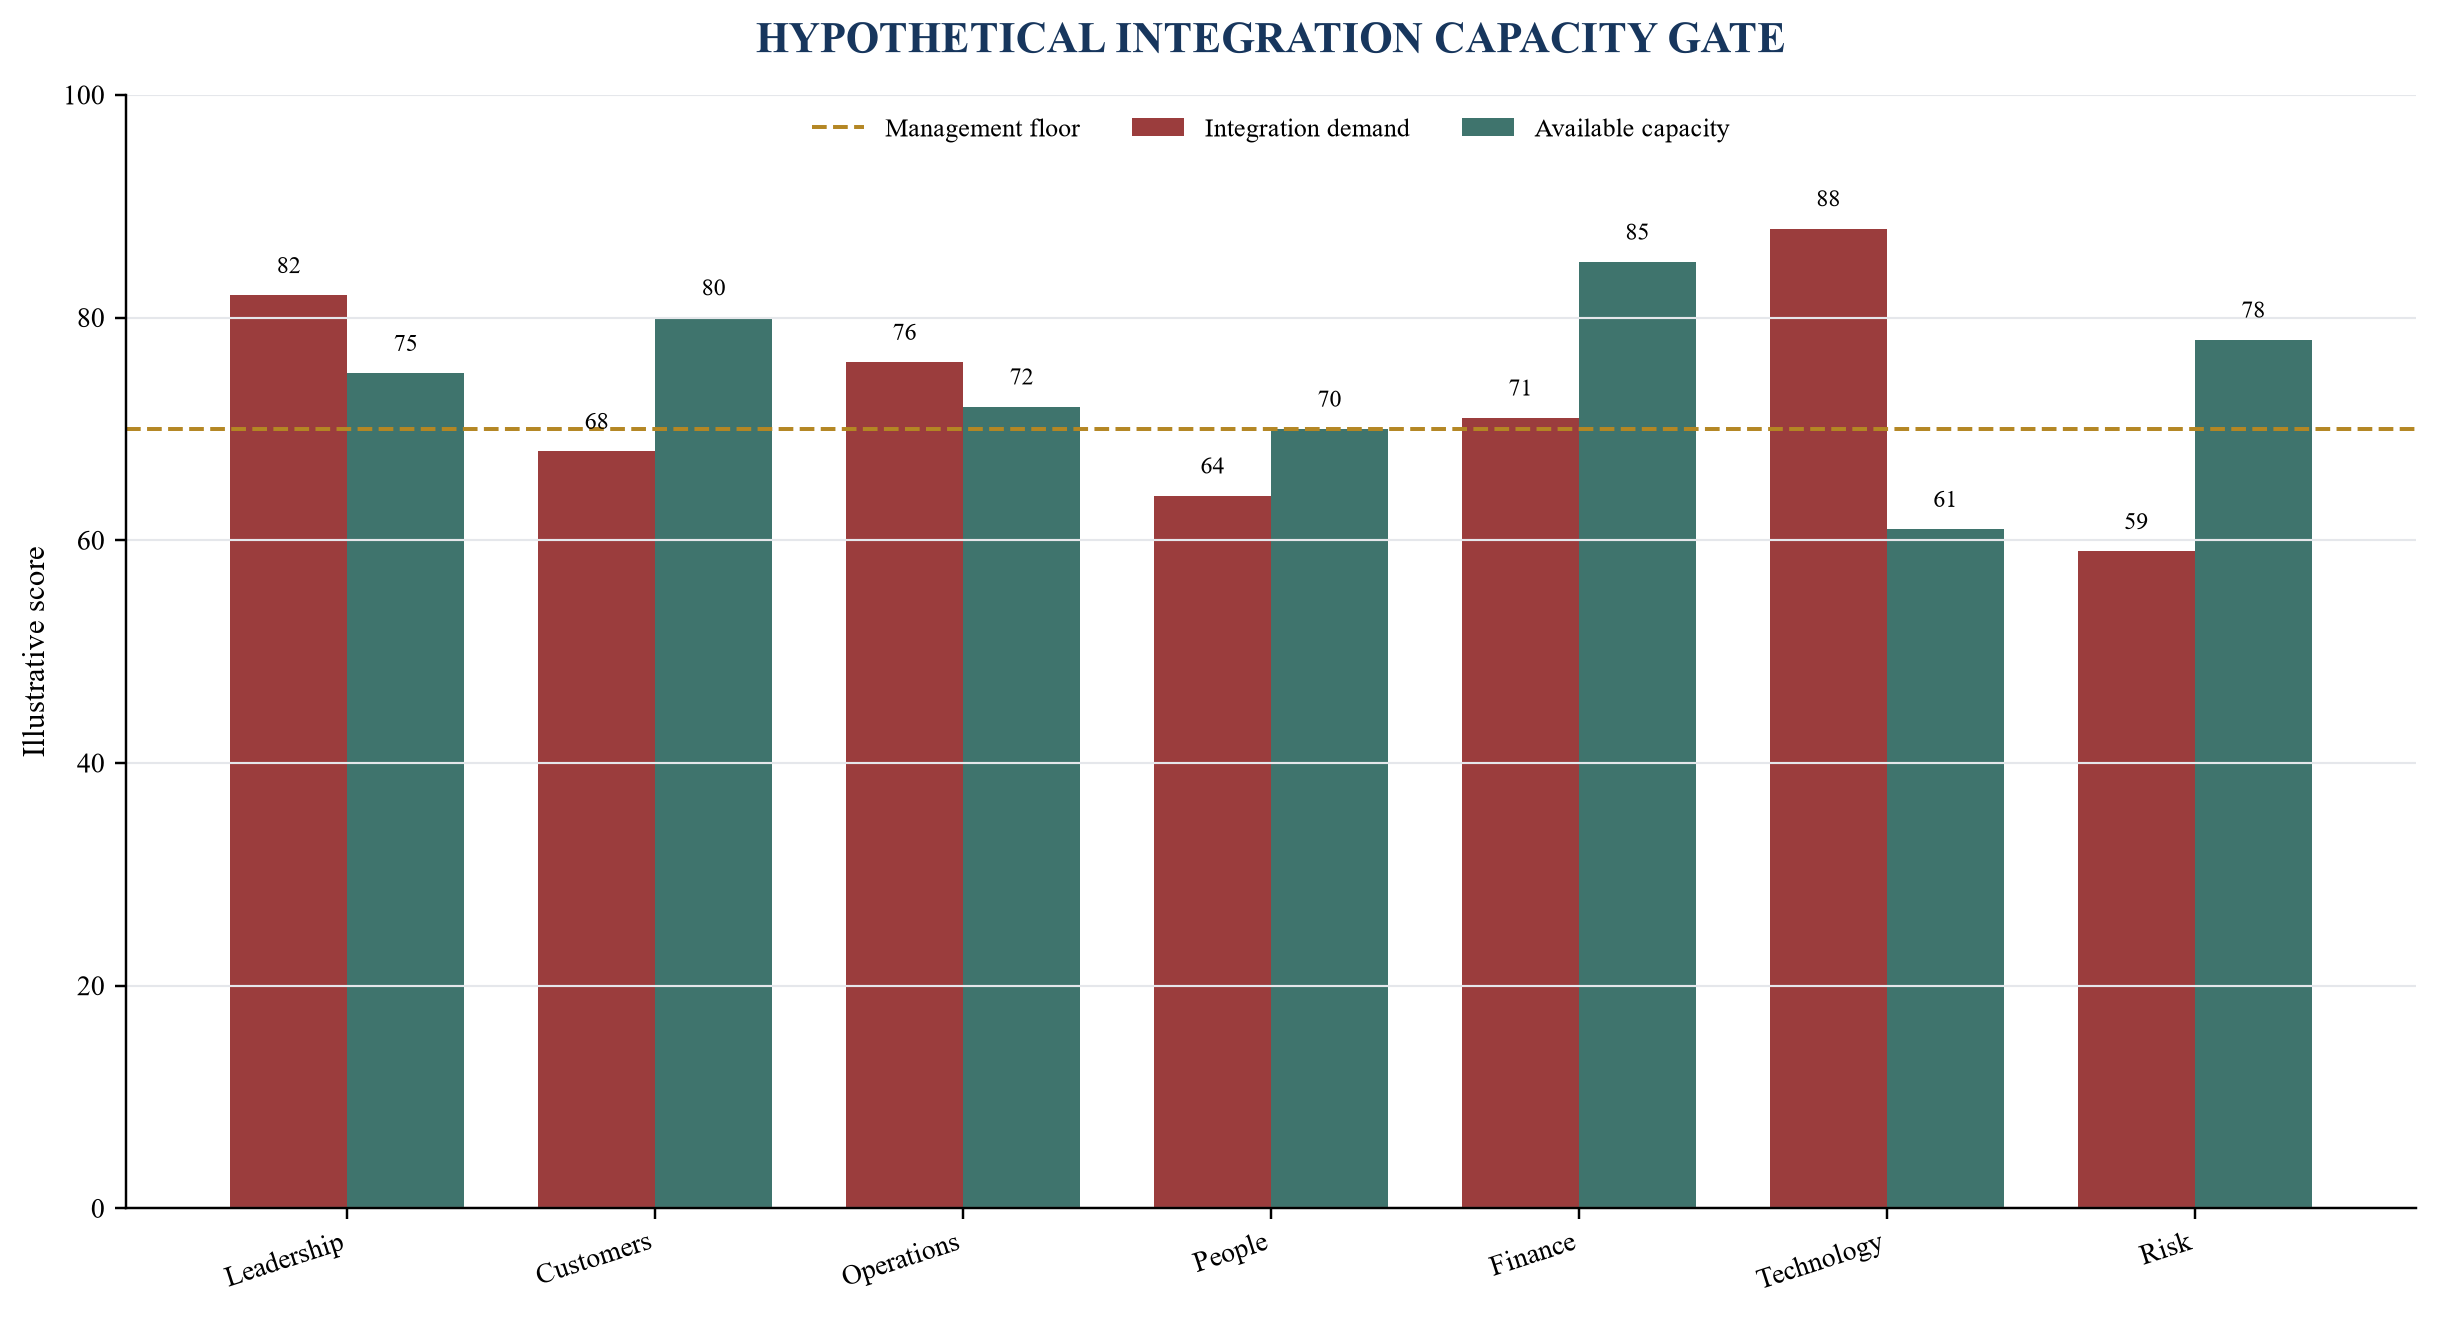
Scores are illustrative. The gate is determined by the most constrained critical dimension, not the average.
17. Establish controls and a single evidence spine
Serial acquisition increases the speed and frequency of changes to entities, accounts, systems, people, contracts and authority. The control environment should therefore be designed for repetition. The platform needs a standard close plan, chart-of-accounts mapping, delegated authorities, bank-control process, contract repository, tax calendar, licence register, risk register and integration evidence archive.
The evidence spine should connect the investment case to operating outcomes. The board-approved model, diligence findings, purchase agreement, integration plan, budget, synergy register and management accounts should use controlled definitions. Changes need an owner, rationale and date. If the baseline changes after closing, the original case should remain visible so performance cannot be improved through silent rebasing.
Reporting should distinguish transaction progress, integration progress and business performance. Transaction progress covers approvals, conditions and closing. Integration progress covers work packages, decisions, issues and capacity. Business performance covers customers, people, operations, cash, controls and value delivery. Combining all three into one percentage complete can conceal a deteriorating business behind completed tasks.
Assurance should be risk-based. Management owns delivery and controls. Risk and compliance functions provide challenge and monitoring. Internal audit preserves independent assurance in line with its mandate. External advisers support specialised conclusions. The board should receive evidence proportionate to the risk, with clear escalation for customer harm, safety, cyber, cash, regulatory breaches and material misstatement.
Table 5. Board dashboard for a roll-up programme
| Domain | Leading indicator | Outcome indicator | Board decision |
|---|---|---|---|
| market | verified target pool and seller engagement | acquisition runway by quality tier | continue, re-scope or stop sourcing |
| customers | account coverage, service incidents, at-risk contracts | retention, wallet share and complaint trend | protect, remediate or accelerate commercial integration |
| operations | migration readiness, backlog and capacity | service level, utilisation, quality and cost per unit | release, hold or redesign integration wave |
| people | critical-role coverage, consultation and training | retention, vacancies, payroll accuracy and productivity | fund, sequence or pause organisational change |
| finance | close readiness, liquidity forecast and synergy evidence | cash conversion, covenant headroom and net benefit | resize, reprice or defer next deal |
| control | open material issues and overdue remediation | incidents, audit findings and regulatory compliance | escalate, assure or pause programme |
Metrics should be defined once, sourced consistently and shown with trend, threshold and owner.
18. Stress the failure modes before the market does
The downside model should combine events rather than move one variable at a time. Seller pricing can rise as the strategy becomes visible. Competitors can respond. Customers can delay decisions. Key people can leave. Integration can consume cash while synergies arrive late. Lenders can tighten terms. Regulators can review the acquisition pattern. The model should show how these events affect liquidity, covenants, capacity and the ability to pursue the next deal.
Common failure modes include an overstated target universe, weak platform leadership, excessive autonomy, premature centralisation, inconsistent data, customer disruption, underfunded integration, technology fragmentation, unverified synergy, seller dependence and deal pace exceeding capacity. Each failure mode needs an early indicator, preventive control, contingency and decision owner.
The board should define a kill zone for the thesis. Examples include fewer qualified targets than the minimum runway, acquisition prices above the return ceiling, density benefits that cannot be operationally evidenced, customer concentration beyond appetite, a critical capability without a build or buy path, technology remediation exceeding budget, or a regulatory path incompatible with the sequence. A kill zone turns adverse research into a useful capital-allocation outcome.
The programme should also test recovery. It should know how to pause acquisitions, stabilise operations, replace leadership, inject liquidity, divest a non-core unit, separate systems or reset the operating model. Resilience depends on credible options and decision time. A model that works only while every transaction closes on schedule is not a robust roll-up thesis.
19. Apply the framework to a hypothetical sequence
Consider a hypothetical regional technical-services market. The verified universe contains 112 active and probable businesses across four economic cells. Thirty-eight pass the initial strategic-fit screen. Twelve meet the quality floor after ownership, customer, labour, cash, systems and compliance review. These counts are illustrative management assumptions and do not describe an actual market.
The proposed platform has 100 units of EBITDA, six operating sites and reliable leadership, finance and customer data. The first add-on contributes 18 units of EBITDA and fills a route gap in the largest cell. The second contributes 12 units and adds a scarce accreditation. The third contributes 15 units in a new cell. The platform models procurement, route, shared-service and cross-sell benefits alongside retention, migration and recurring integration costs.
The sequence gate identifies technology as the binding capacity constraint after the first acquisition. Integration demand is scored at 88 against available capacity of 61. The board therefore funds identity, data and application work before authorising the second closing. Customer and finance capacity remain above their management floors. The delay reduces headline deal pace while protecting the evidence spine and the operating model.
Under the base case, stabilised EBITDA reaches 115 units after benefits and recurring costs. Under the downside, customer attrition, delayed migration and higher retention cost reduce it to 102. Minimum liquidity remains positive, though the third acquisition moves outside the approved covenant-headroom floor. The board approves the first acquisition, conditionally prepares the second and retains the third as an option subject to capacity and competition review.
Table 6. Hypothetical first-three-deal sequence gate
| Measure | Platform | Add-on 1 | Add-on 2 | Add-on 3 | Board interpretation |
|---|---|---|---|---|---|
| standalone EBITDA units | 100 | 18 | 12 | 15 | size alone does not determine sequence |
| strategic-fit score | 84 | 91 | 78 | 70 | first add-on best validates core model |
| density or capability benefit | base | route gap | accreditation | new cell | benefits arise through different mechanisms |
| integration-demand score | 46 | 72 | 81 | 88 | technology capacity binds after first closing |
| stabilisation months | base | 5 | 8 | 11 | pace should follow evidence, not pipeline |
| decision | operate | approve | prepare conditionally | retain as option | release next deal only after capacity gate |
All values are illustrative management assumptions and do not represent actual targets, offers or forecasts.
20. Use a board gate before the first deal
The board memorandum should state the market definition, verified target universe, fragmentation and contestability, density cells, target archetypes, quality floor, operating model, integration capacity, regulatory map, financing plan, downside and stop conditions. It should show alternative theses and explain why the chosen sequence is superior.
Approval should be staged. The board can approve market development and capability investment before approving a specific acquisition. It can authorise a transaction within price, risk and capacity limits while requiring further approval for exceptions. It can approve a first closing while making the second contingent on customer, people, finance, technology and control evidence.
The decision record should distinguish fact, management assumption, adviser conclusion and board judgement. Market counts and target attributes need source dates. Synergy and capacity inputs need owners. Legal, tax and regulatory conclusions need qualified advice. Hypothetical models should remain clearly identified. This structure allows the board to update the thesis without rewriting history.
The final gate should answer four questions. Is the market still attractive under reasonable alternative definitions? Can the first target operate and integrate without relying on unproven benefits? Does the platform have the people, systems, cash and control capacity to stabilise it? Does completing the first deal preserve enough options to improve or stop the sequence? A weak answer to any question requires redesign, additional evidence or a pause.
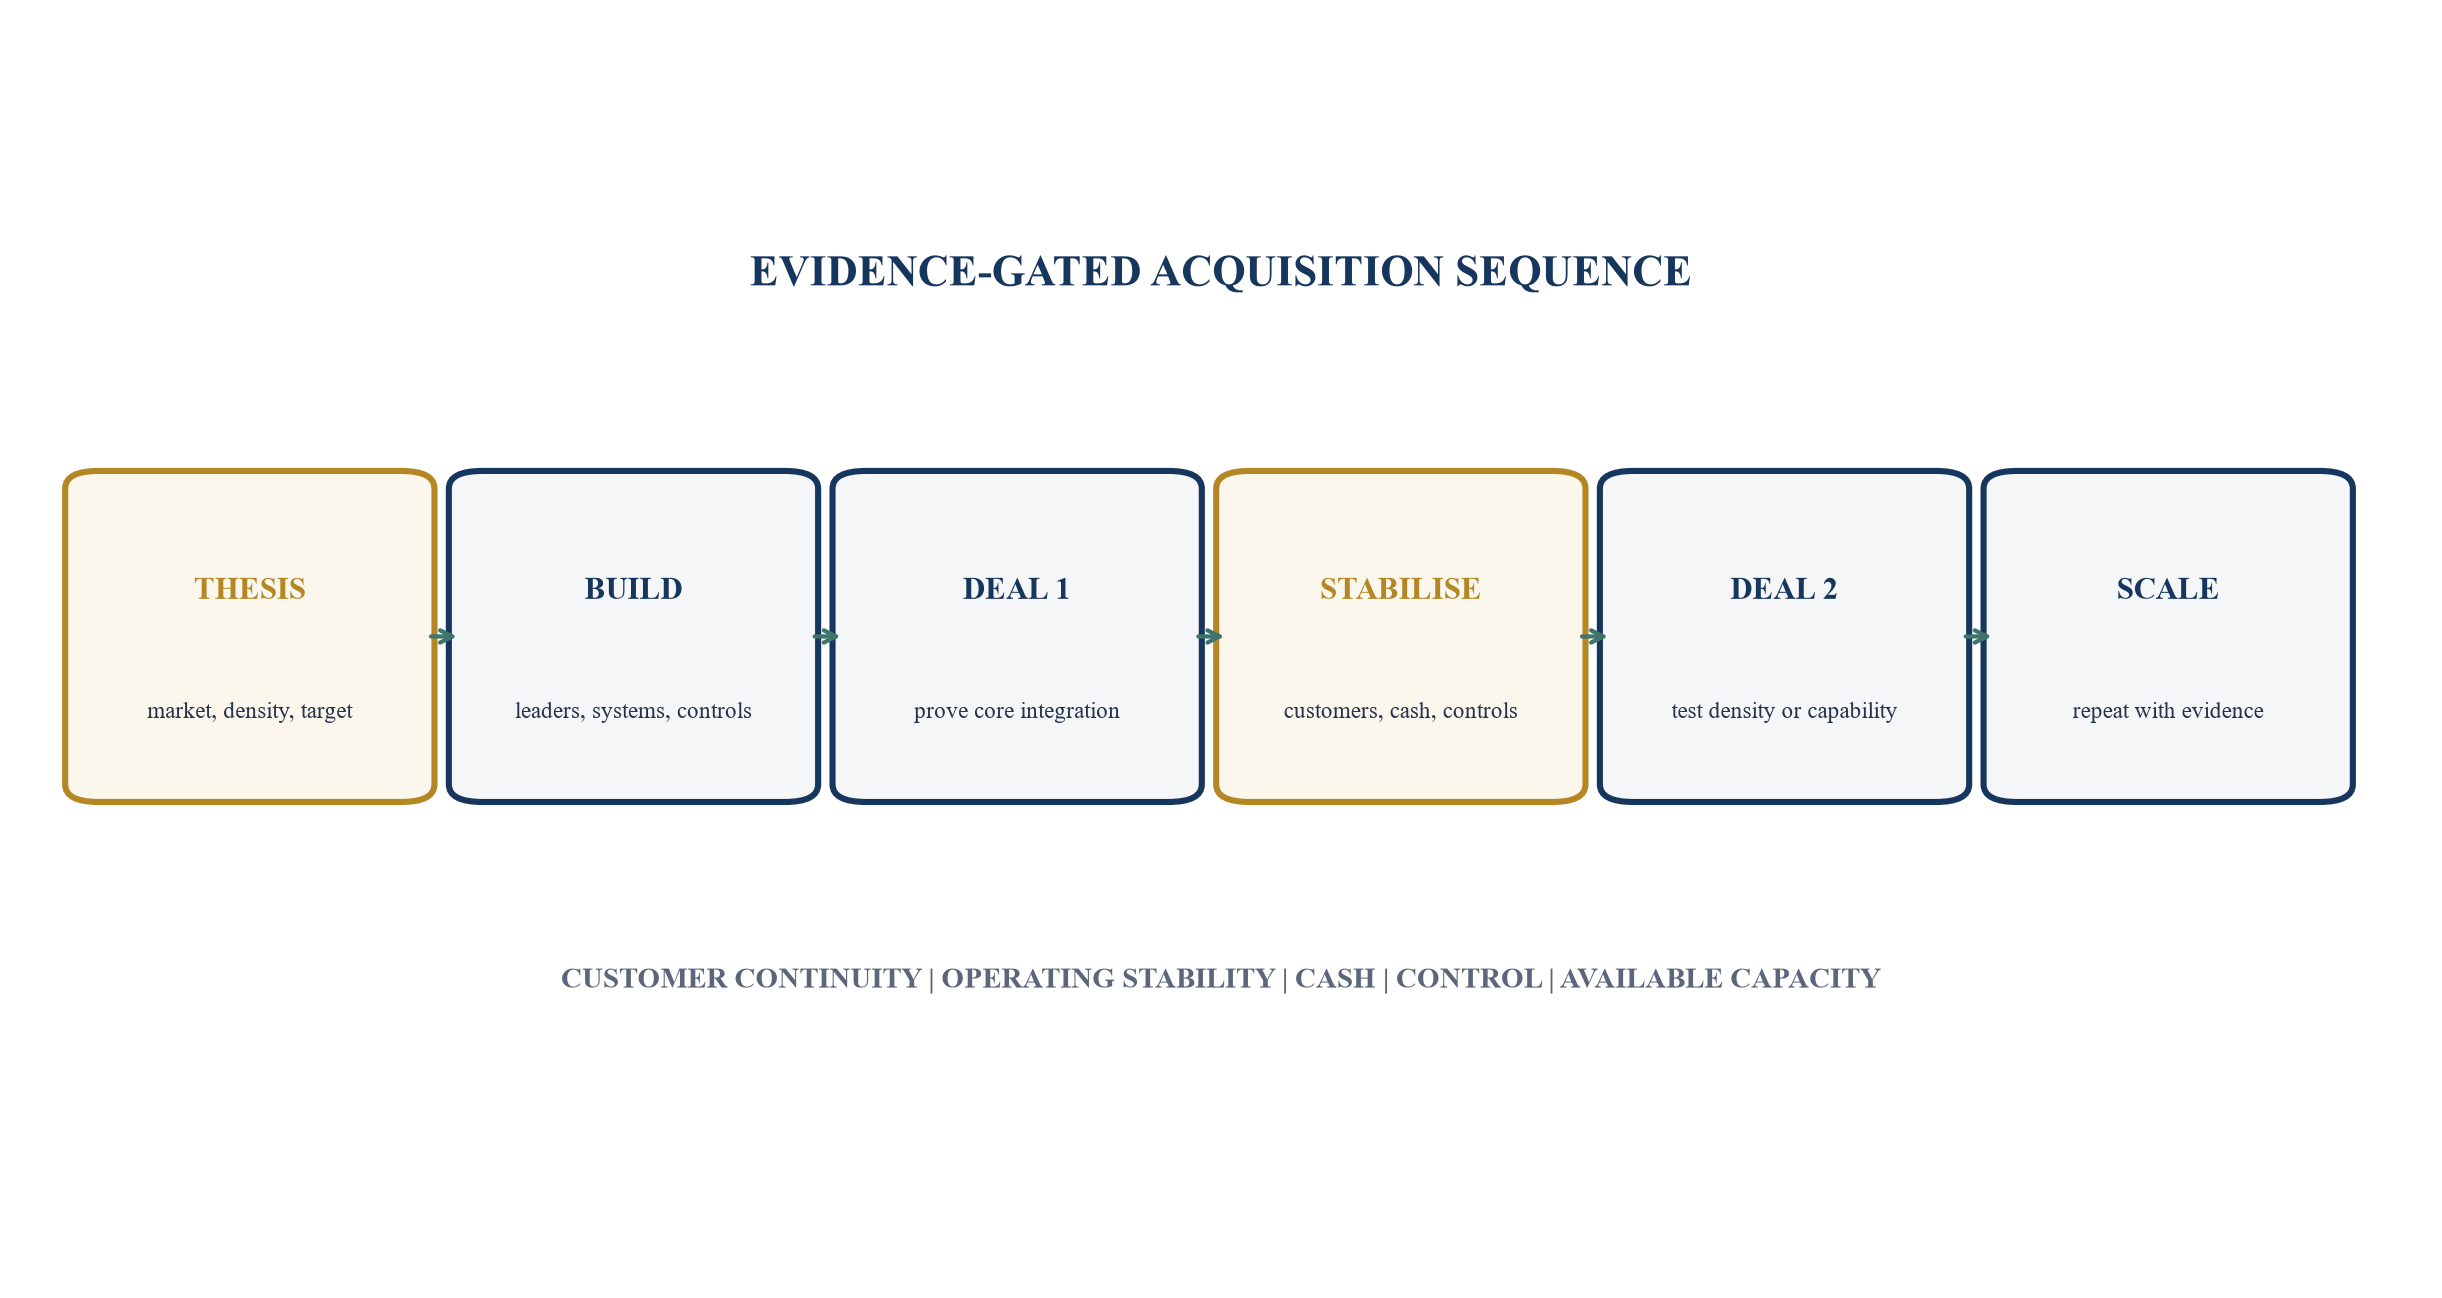
The next acquisition is released by stabilisation evidence and available capacity.
21. Build a permanent buy-and-build capability
A durable roll-up platform retains the learning from every transaction. It maintains a market map, target universe, relationship history, valuation model, diligence library, synergy taxonomy, integration playbook, technology architecture, control framework, talent bench and post-investment review. These assets improve selection and execution only when they are updated from observed outcomes.
The corporate-development function should be paired with operating and integration leadership. Origination, valuation and transaction execution cannot substitute for ownership of customers, people, systems and cash. The platform should allocate responsibilities from thesis through stabilisation and ensure that incentives reward durable value rather than completed transactions alone.
Post-acquisition reviews should compare the approved case with actual results. The review should preserve original baselines, explain variances, assess whether the target fit and integration capacity were correctly judged, and update the next decision. Good outcomes should be tested as carefully as poor ones because favourable markets can hide weak methods.
The objective is disciplined repetition. A platform has earned the right to accelerate when the market remains attractive, the target pool remains deep, integration outcomes are reliable, controls are effective, capital is resilient and the next acquisition fits the proven model. The board should prefer a slower sequence that compounds evidence over a faster sequence that compounds unresolved exceptions.
Capability should be measured through cycle time and decision quality as well as completed deals. Useful measures include time from first contact to qualified decision, percentage of targets rejected before intensive diligence, forecast accuracy, Day One readiness, time to stable close, customer retention, critical-role retention, recurring control exceptions and realised cash benefit. The measures should support learning rather than encourage speed at the expense of quality.
The platform should also maintain a clear external narrative. Lenders, investors, sellers, customers and employees need to understand the strategic logic, operating standards and boundaries of the programme. Consistent evidence increases credibility. Overstated promises create future negotiation and trust costs. A roll-up earns strategic value when stakeholders can see a coherent enterprise, reliable governance and repeatable execution behind the transaction sequence.
Sources and further reading
- United States Department of Justice and Federal Trade Commission, 2023 Merger Guidelines Official source
- United States Department of Justice, Market Definition Official source
- United States Department of Justice, Calculating Market Shares and Concentration Official source
- United States Department of Justice, Guideline 7 on Trends toward Consolidation Official source
- United States Department of Justice, Guideline 8 on a Series of Multiple Acquisitions Official source
- European Commission, Review of the Merger Guidelines Official source
- European Commission, Guidelines on the Assessment of Horizontal Mergers Official source
- UK Competition and Markets Authority, Merger Assessment Guidelines Official source
- UAE Legislation, Federal Decree-Law No. 36 of 2023 Regarding Regulating Competition Official source
- UAE Ministry of Economy and Tourism, Economic Concentration Official source
- Australian Competition and Consumer Commission, Mergers and Acquisitions Official source
- Australian Competition and Consumer Commission, Thresholds for Notifying Acquisitions Official source
- Competition Commission of India, Regulation of Combinations Official source
- Competition and Consumer Commission of Singapore, Merger Assessment Process Official source
- Competition Bureau Canada, Merger Enforcement Guidelines Official source
- Organisation for Economic Co-operation and Development, Recommendation on Merger Review Official source
- International Competition Network, Recommended Practices for Merger Notification and Review Procedures Official source
- Eurostat, Business Demography Official source
- United States Census Bureau, County Business Patterns Official source
- UK Office for National Statistics, UK Business Activity Size and Location 2025 Official source
- World Bank, Enterprise Surveys Official source
- United Nations Statistics Division, International Standard Industrial Classification Revision 4 Official source
- IFRS Foundation, IFRS 3 Business Combinations Official source
- IFRS Foundation, IAS 36 Impairment of Assets Official source
- IFRS Foundation, IFRS 8 Operating Segments Official source
- IFRS Foundation, IFRS 15 Revenue from Contracts with Customers Official source
- IFRS Foundation, IFRS 16 Leases Official source
- National Institute of Standards and Technology, Cybersecurity Framework 2.0 Official source
- Institute of Internal Auditors, Statements of Position Official source
- Committee of Sponsoring Organizations of the Treadway Commission, Enterprise Risk Management Official source
