

1. Define the regional problem before the fund
A regional compute programme can address fragmented demand, duplicated procurement, limited bargaining power, uneven access and poor workload portability. The investment thesis must state which failure requires regional action and which issues remain national responsibilities. The analysis should identify the legal owner, service operator, payer, beneficiary, regulator and party bearing remediation or transition cost. [1][2][3][4]
The evidence file should begin with national AI strategies, public-service demand, research needs, private adoption, provider capacity, power constraints, data rules and cross-border service barriers. Each record should state scope, effective date, expiry or refresh point, accountable owner and relationship to usable capacity, user outcomes and cash. Regional and national policy documents establish context. Financing conclusions require executed obligations, accepted service and observed payment performance.
The principal failure is that regional scale is treated as an objective without identifying the measurable cost or access problem that pooled action solves. The practical response is to approve a regional function only where aggregation produces a documented price, access, resilience or capability benefit. Central assumptions should reflect enforceable arrangements and measured operations. Downside cases should combine related demand, price, technology, power, network, provider, currency, cybersecurity, policy and liquidity risks. Management estimates should be identified in the model and refreshed when source evidence changes.
2. Separate coordination from ownership
ASEAN frameworks support cooperation and interoperability, but they do not by themselves establish a regional asset owner, borrower or guarantor. The legal structure should distinguish policy coordination, procurement agency, user programme, investment vehicle and national project companies. The analysis should identify the legal owner, service operator, payer, beneficiary, regulator and party bearing remediation or transition cost. [1][2][5][6]
The evidence file should begin with treaties, ministerial declarations, programme mandates, constitutive documents, shareholder agreements, procurement authority and national approvals. Each record should state scope, effective date, expiry or refresh point, accountable owner and relationship to usable capacity, user outcomes and cash. Regional and national policy documents establish context. Financing conclusions require executed obligations, accepted service and observed payment performance.
The principal failure is that an ASEAN label is assumed to create common ownership, consolidated security or a regional guarantee. The practical response is to map each mandate, asset, contract, cash flow and liability to an identified legal entity and governing law. Central assumptions should reflect enforceable arrangements and measured operations. Downside cases should combine related demand, price, technology, power, network, provider, currency, cybersecurity, policy and liquidity risks. Management estimates should be identified in the model and refreshed when source evidence changes.
3. Build a country evidence map
Member States differ in data-centre capacity, grid readiness, renewable access, fibre routes, cloud adoption, procurement practice, data protection and AI demand. Capacity disclosures often measure different things and require an evidence ladder before comparison. The analysis should identify the legal owner, service operator, payer, beneficiary, regulator and party bearing remediation or transition cost. [7][8][9][10]
The evidence file should begin with official capacity statements, signed power demand, actual load, project pipeline, network routes, service inventories, utilisation and user demand. Each record should state scope, effective date, expiry or refresh point, accountable owner and relationship to usable capacity, user outcomes and cash. Regional and national policy documents establish context. Financing conclusions require executed obligations, accepted service and observed payment performance.
The principal failure is that reported megawatts, investment approvals and announced campuses are added together as if they represented operational comparable service. The practical response is to classify every market measure by definition, date, ownership, delivery status, availability and actual use. Central assumptions should reflect enforceable arrangements and measured operations. Downside cases should combine related demand, price, technology, power, network, provider, currency, cybersecurity, policy and liquidity risks. Management estimates should be identified in the model and refreshed when source evidence changes.
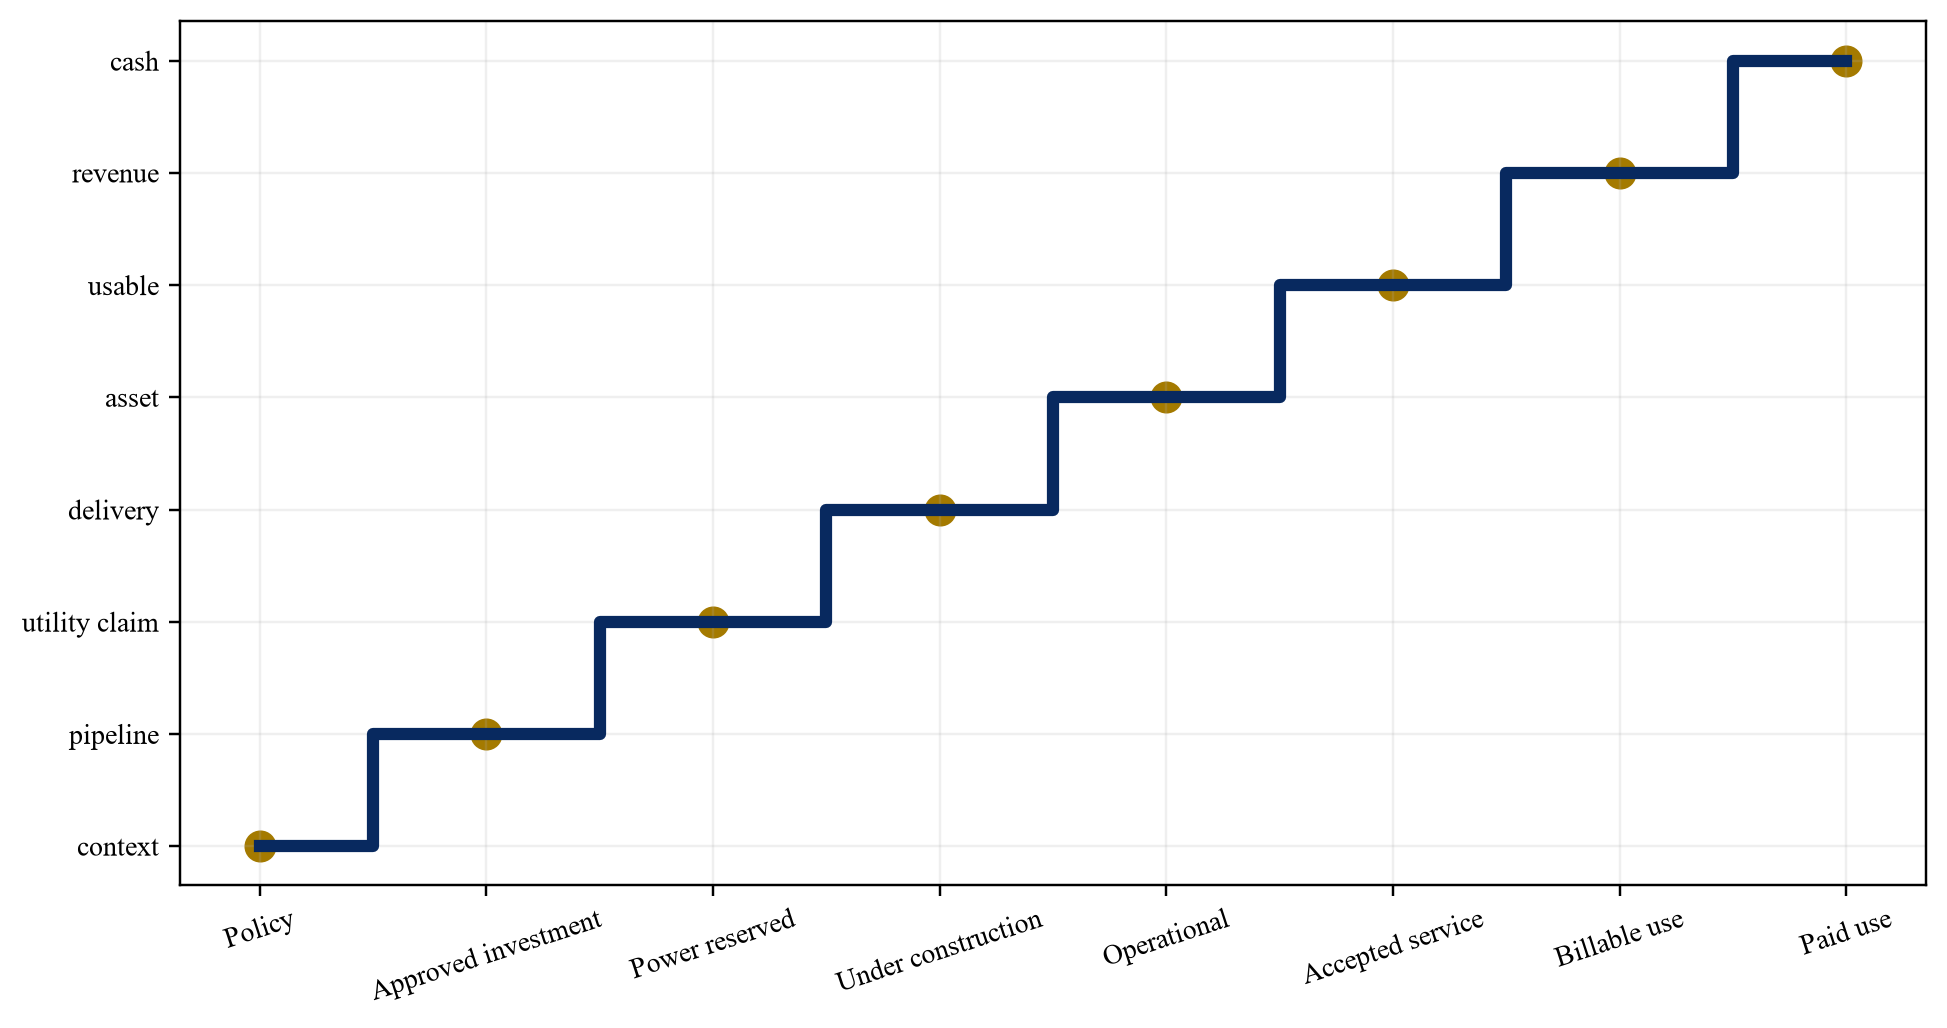
Proposed framework; measures must remain separate until definitions and delivery status are reconciled.
| Measure | Required definition | Permitted use |
|---|---|---|
| policy target | authority, scope and date | strategic context |
| approved investment | sponsor, amount and conditions | pipeline context |
| signed power demand | utility agreement and phasing | delivery dependency |
| operational IT load | energised and accepted capacity | asset capacity |
| available service | tested product and SLA | usable capacity |
| billable and paid use | invoice and cash receipt | financing evidence |
Proposed framework; official definitions and direct records govern treatment.
4. Aggregate demand through binding service needs
Government agencies, universities, start-ups, regulated industries and enterprises can create a regional demand portfolio. Expressions of interest and policy ambitions remain weak credit evidence until workloads, budgets, configurations and service periods are defined. The analysis should identify the legal owner, service operator, payer, beneficiary, regulator and party bearing remediation or transition cost. [4][11][12][13]
The evidence file should begin with workload inventory, data class, technical configuration, duration, location tolerance, budget, approval, reservation, acceptance, invoice and payment. Each record should state scope, effective date, expiry or refresh point, accountable owner and relationship to usable capacity, user outcomes and cash. Regional and national policy documents establish context. Financing conclusions require executed obligations, accepted service and observed payment performance.
The principal failure is that large regional user counts are translated into guaranteed utilisation without product-level commitments. The practical response is to create a demand ladder from identified workload to paid service and size each capacity tranche to the lower of contracted and tested demand. Central assumptions should reflect enforceable arrangements and measured operations. Downside cases should combine related demand, price, technology, power, network, provider, currency, cybersecurity, policy and liquidity risks. Management estimates should be identified in the model and refreshed when source evidence changes.
5. Classify workloads by sovereignty need
Sovereignty is not one binary attribute. Public, personal, defence, health, financial, research and commercial workloads can require different combinations of location, jurisdiction, control, staff access, encryption, model custody and operational independence. The analysis should identify the legal owner, service operator, payer, beneficiary, regulator and party bearing remediation or transition cost. [3][5][14][15]
The evidence file should begin with workload classification, applicable law, regulator guidance, threat model, access design, key control, supplier jurisdiction and continuity requirement. Each record should state scope, effective date, expiry or refresh point, accountable owner and relationship to usable capacity, user outcomes and cash. Regional and national policy documents establish context. Financing conclusions require executed obligations, accepted service and observed payment performance.
The principal failure is that all workloads receive the most restrictive and expensive control tier or sensitive workloads are placed on services that cannot evidence required control. The practical response is to define graduated sovereignty tiers and restrict each workload to an accepted service tier. Central assumptions should reflect enforceable arrangements and measured operations. Downside cases should combine related demand, price, technology, power, network, provider, currency, cybersecurity, policy and liquidity risks. Management estimates should be identified in the model and refreshed when source evidence changes.
| Tier | Core controls | Portability condition |
|---|---|---|
| commercial portable | standard security and export | approved provider and format |
| regulated controlled | location, access and audit | equivalent regulatory controls |
| national restricted | domestic operation and keys | domestic alternate node only |
| strategic isolated | dedicated staff, network and assets | pre-approved strategic reserve |
Proposed classification; applicable law, regulator and contract determine requirements.
6. Make trusted data movement operational
ASEAN frameworks encourage trusted cross-border data flows while national laws and sector rules continue to apply. A regional compute design needs transfer mechanisms, purpose limits, auditability and routes for workloads that cannot move. The analysis should identify the legal owner, service operator, payer, beneficiary, regulator and party bearing remediation or transition cost. [2][5][14][16]
The evidence file should begin with data inventories, controller and processor roles, transfer basis, model contractual clauses, consent or legal authority, encryption, retention and deletion. Each record should state scope, effective date, expiry or refresh point, accountable owner and relationship to usable capacity, user outcomes and cash. Regional and national policy documents establish context. Financing conclusions require executed obligations, accepted service and observed payment performance.
The principal failure is that regional integration language is treated as permission to move data without country and sector analysis. The practical response is to design a data-routing matrix that permits processing only when the legal, contractual and technical conditions are met. Central assumptions should reflect enforceable arrangements and measured operations. Downside cases should combine related demand, price, technology, power, network, provider, currency, cybersecurity, policy and liquidity risks. Management estimates should be identified in the model and refreshed when source evidence changes.
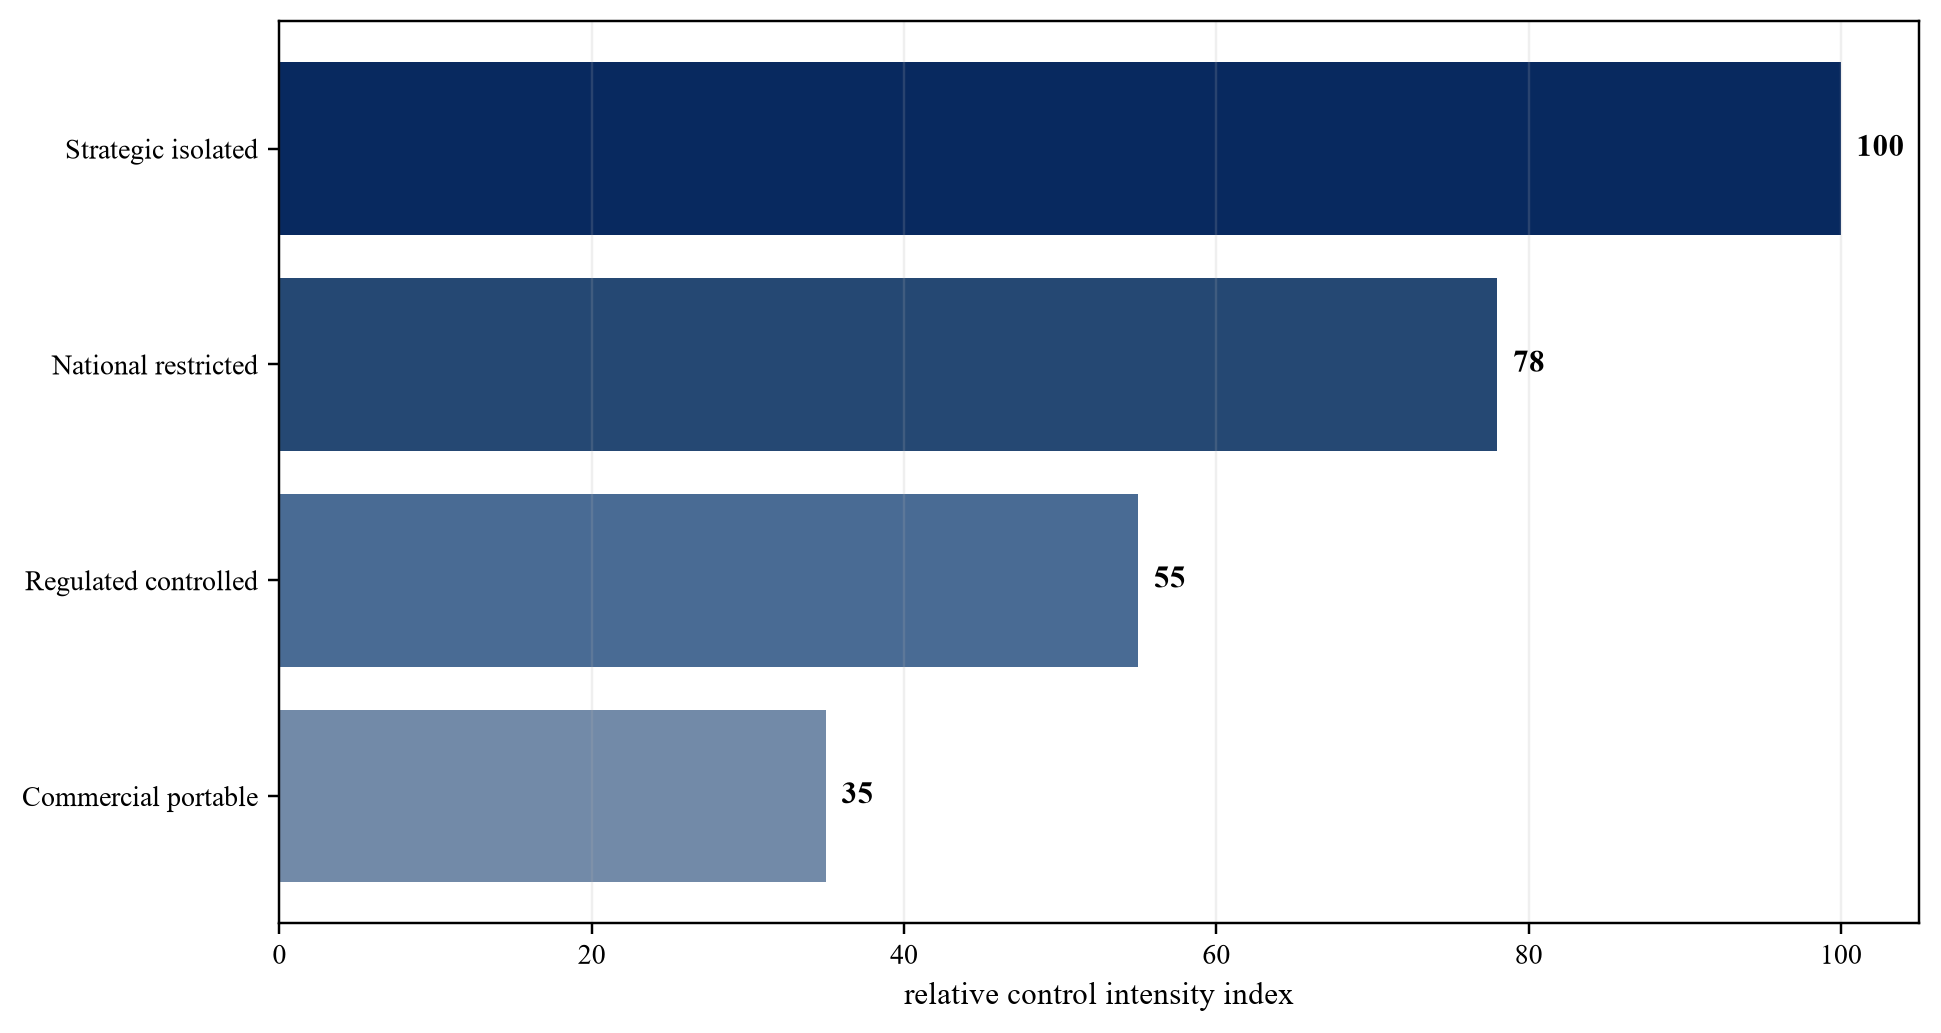
Proposed framework; applicable national and sector law determines the required tier.
7. Choose a federated architecture
A single regional mega-site can create concentration, latency, power and jurisdiction risks. Fully duplicated national stacks can waste capital and fragment service. A federated design can combine national nodes, common products, shared scheduling and controlled workload portability. The analysis should identify the legal owner, service operator, payer, beneficiary, regulator and party bearing remediation or transition cost. [7][9][10][17]
The evidence file should begin with latency, network routes, data class, power, cooling, capacity, failure domains, service levels, portability tests and recovery objectives. Each record should state scope, effective date, expiry or refresh point, accountable owner and relationship to usable capacity, user outcomes and cash. Regional and national policy documents establish context. Financing conclusions require executed obligations, accepted service and observed payment performance.
The principal failure is that architecture follows political allocation or announced sites rather than workload and resilience requirements. The practical response is to allocate workloads and reserve capacity across nodes using explicit cost, control, latency and continuity rules. Central assumptions should reflect enforceable arrangements and measured operations. Downside cases should combine related demand, price, technology, power, network, provider, currency, cybersecurity, policy and liquidity risks. Management estimates should be identified in the model and refreshed when source evidence changes.
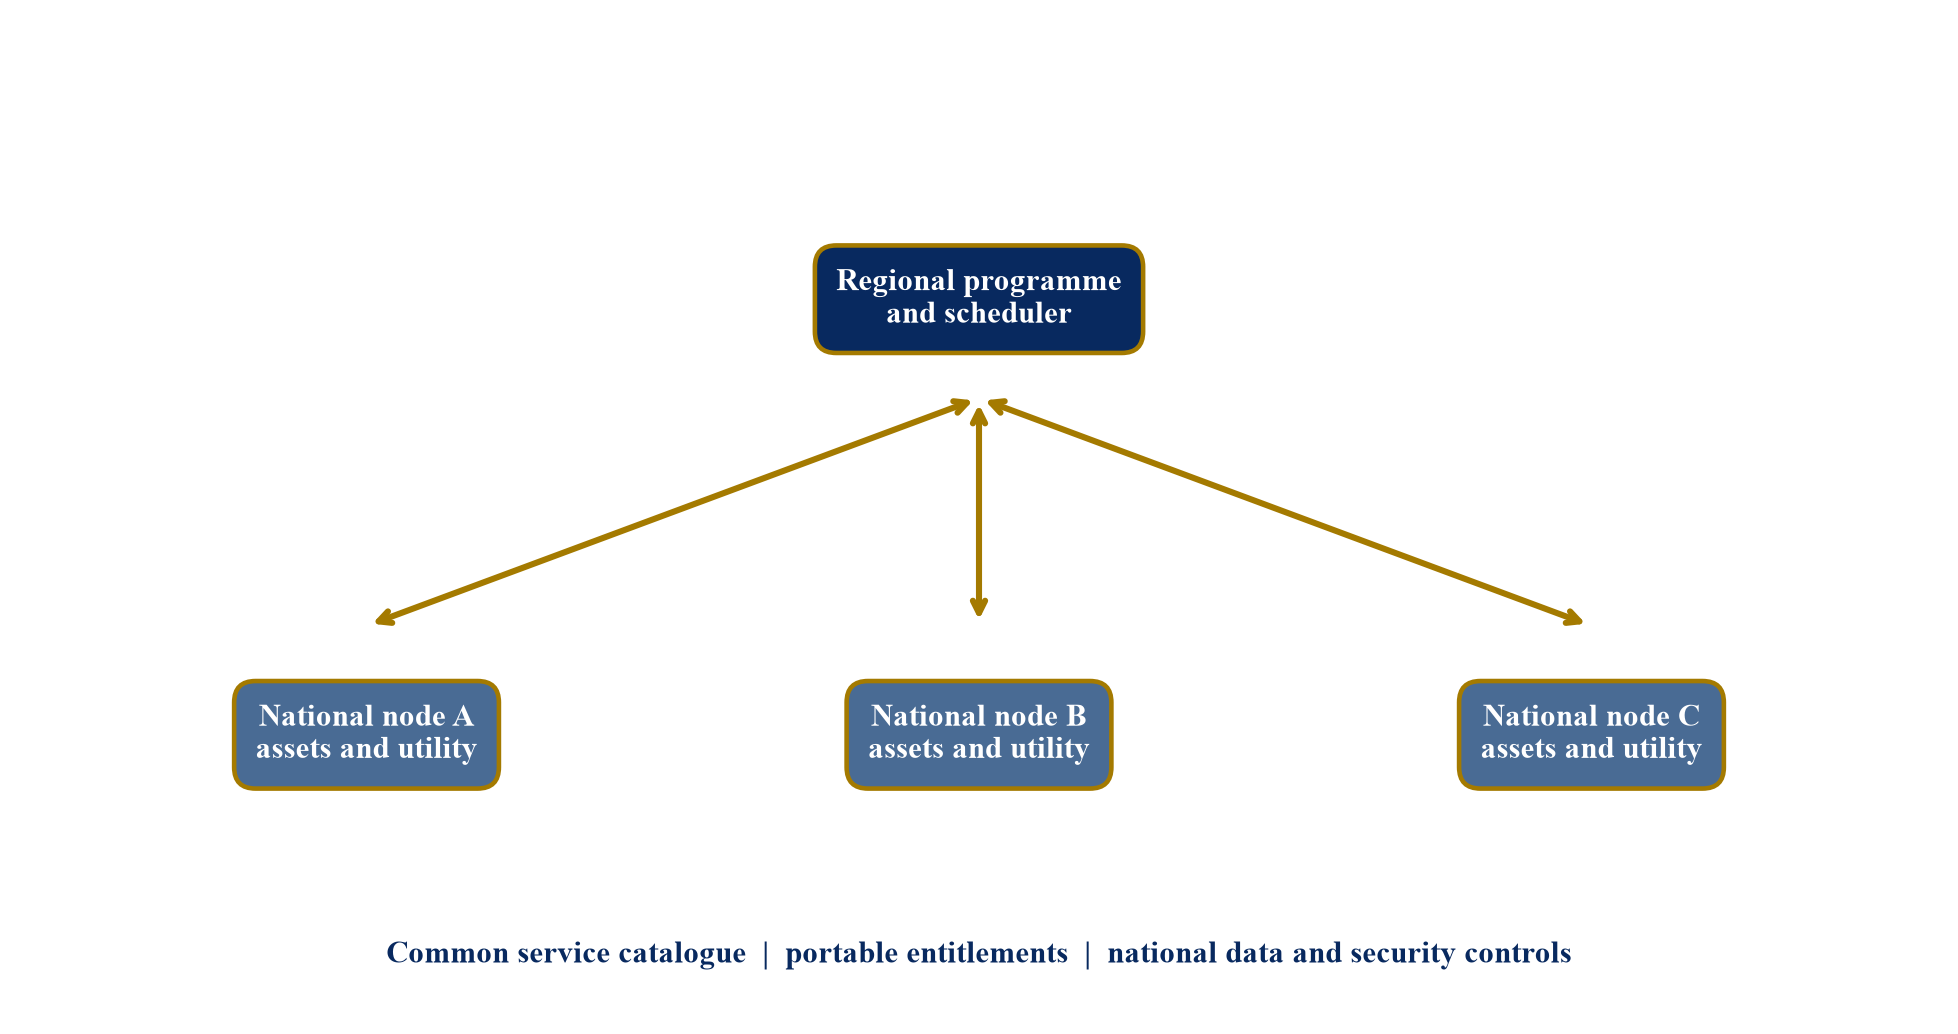
Proposed operating model; national nodes retain local control while common products support portability.
8. Standardise the service product
Regional procurement needs comparable compute products covering accelerator type, memory, interconnect, storage, network, software, security, support and performance. Nominal chip counts and hourly prices cannot establish equivalence. The analysis should identify the legal owner, service operator, payer, beneficiary, regulator and party bearing remediation or transition cost. [3][11][18][19]
The evidence file should begin with hardware configuration, benchmark suite, software versions, topology, availability, support, job completion, energy use and total workload cost. Each record should state scope, effective date, expiry or refresh point, accountable owner and relationship to usable capacity, user outcomes and cash. Regional and national policy documents establish context. Financing conclusions require executed obligations, accepted service and observed payment performance.
The principal failure is that providers quote non-equivalent units that prevent price discovery and portability. The practical response is to procure workload-normalised service units and certify each provider product before it enters the shared catalogue. Central assumptions should reflect enforceable arrangements and measured operations. Downside cases should combine related demand, price, technology, power, network, provider, currency, cybersecurity, policy and liquidity risks. Management estimates should be identified in the model and refreshed when source evidence changes.
| Dimension | Minimum record | Comparison unit |
|---|---|---|
| accelerator | model, memory and quantity | workload benchmark |
| interconnect | topology and bandwidth | scaling result |
| storage and network | throughput, location and route | total workload cost |
| software | version, licence and portability | permitted portable stack |
| service | availability, support and credits | accepted completion |
| control | data, identity, keys and audit | sovereignty tier |
Proposed specification; each provider product requires technical acceptance.
9. Treat connectivity as part of capacity
Cross-border AI service depends on terrestrial fibre, submarine cables, internet exchanges, cloud interconnects and resilient routes. Compute that cannot receive data or return results within the required time is not usable regional capacity. The analysis should identify the legal owner, service operator, payer, beneficiary, regulator and party bearing remediation or transition cost. [1][17][20][21]
The evidence file should begin with route diversity, bandwidth, latency, landing stations, cable ownership, outage history, peering, transit cost, encryption and recovery arrangements. Each record should state scope, effective date, expiry or refresh point, accountable owner and relationship to usable capacity, user outcomes and cash. Regional and national policy documents establish context. Financing conclusions require executed obligations, accepted service and observed payment performance.
The principal failure is that site capacity is financed without testing network bottlenecks, cross-border routes and common-mode failures. The practical response is to include connectivity acceptance, diversity and restoration obligations in capacity commissioning and lender reporting. Central assumptions should reflect enforceable arrangements and measured operations. Downside cases should combine related demand, price, technology, power, network, provider, currency, cybersecurity, policy and liquidity risks. Management estimates should be identified in the model and refreshed when source evidence changes.
10. Gate expansion by power and water
AI data centres impose substantial and location-specific power, cooling and water requirements. Singapore and Malaysia have responded with capacity, efficiency and resource policies, while ASEAN guidance frames sustainable development regionally. The analysis should identify the legal owner, service operator, payer, beneficiary, regulator and party bearing remediation or transition cost. [7][8][9][22]
The evidence file should begin with grid connection, firm supply, renewable arrangements, tariffs, backup, power usage effectiveness, water usage effectiveness, cooling design and expansion rights. Each record should state scope, effective date, expiry or refresh point, accountable owner and relationship to usable capacity, user outcomes and cash. Regional and national policy documents establish context. Financing conclusions require executed obligations, accepted service and observed payment performance.
The principal failure is that announced IT load is assumed to be deliverable without secured utility capacity and environmental permissions. The practical response is to make utility readiness and resource performance conditions precedent to construction and service expansion. Central assumptions should reflect enforceable arrangements and measured operations. Downside cases should combine related demand, price, technology, power, network, provider, currency, cybersecurity, policy and liquidity risks. Management estimates should be identified in the model and refreshed when source evidence changes.
11. Use procurement to preserve competition
A regional catalogue can improve bargaining power and access, yet a long exclusive award can create lock-in. Procurement should permit multiple providers, transparent comparison, capacity release, substitution and periodic competition. The analysis should identify the legal owner, service operator, payer, beneficiary, regulator and party bearing remediation or transition cost. [2][3][11][18]
The evidence file should begin with tender rules, technical acceptance, price cards, discounts, allocation logic, conflict controls, performance records and rebid rights. Each record should state scope, effective date, expiry or refresh point, accountable owner and relationship to usable capacity, user outcomes and cash. Regional and national policy documents establish context. Financing conclusions require executed obligations, accepted service and observed payment performance.
The principal failure is that a strategic provider designation replaces price discovery and concentrates technology and continuity risk. The practical response is to use multi-provider lots, interoperable specifications, performance-based allocation and scheduled rebids. Central assumptions should reflect enforceable arrangements and measured operations. Downside cases should combine related demand, price, technology, power, network, provider, currency, cybersecurity, policy and liquidity risks. Management estimates should be identified in the model and refreshed when source evidence changes.
12. Protect provider neutrality
The programme vehicle may allocate demand, subsidies and strategic workloads. Its governance should prevent a shareholder, host country or incumbent provider from directing demand to itself without transparent rules. The analysis should identify the legal owner, service operator, payer, beneficiary, regulator and party bearing remediation or transition cost. [2][4][6][11]
The evidence file should begin with ownership, board rights, related-party policy, allocation algorithm, committee minutes, conflicts register, appeals and independent audit. Each record should state scope, effective date, expiry or refresh point, accountable owner and relationship to usable capacity, user outcomes and cash. Regional and national policy documents establish context. Financing conclusions require executed obligations, accepted service and observed payment performance.
The principal failure is that capital and demand are allocated through political or sponsor influence rather than published service and public-value tests. The practical response is to separate ownership from procurement decisions and require auditable conflict management and allocation records. Central assumptions should reflect enforceable arrangements and measured operations. Downside cases should combine related demand, price, technology, power, network, provider, currency, cybersecurity, policy and liquidity risks. Management estimates should be identified in the model and refreshed when source evidence changes.
13. Contract anchors without excluding smaller users
Government and large-enterprise reservations can underpin capacity, while research institutions and start-ups may need smaller flexible access. Pool design should stop anchor users from consuming the entire subsidised estate. The analysis should identify the legal owner, service operator, payer, beneficiary, regulator and party bearing remediation or transition cost. [4][11][12][13]
The evidence file should begin with reservation contracts, minimum payments, release rights, user class, access windows, pricing, credit support and unused-capacity rules. Each record should state scope, effective date, expiry or refresh point, accountable owner and relationship to usable capacity, user outcomes and cash. Regional and national policy documents establish context. Financing conclusions require executed obligations, accepted service and observed payment performance.
The principal failure is that non-binding anchors size debt or binding anchors crowd out the beneficiaries used to justify public support. The practical response is to use paid reservations, release unused blocks and maintain transparent access pools for smaller eligible users. Central assumptions should reflect enforceable arrangements and measured operations. Downside cases should combine related demand, price, technology, power, network, provider, currency, cybersecurity, policy and liquidity risks. Management estimates should be identified in the model and refreshed when source evidence changes.
14. Match each capital source to its risk
Buildings, power and cooling may support long-term infrastructure debt. Accelerators have shorter technology lives. Cross-border programme functions, public access and interoperability may need equity, grants, guarantees or subordinated capital. The analysis should identify the legal owner, service operator, payer, beneficiary, regulator and party bearing remediation or transition cost. [23][24][25][26]
The evidence file should begin with asset cohorts, useful lives, residual evidence, revenue contracts, public instruments, security, currency and cash-flow waterfalls. Each record should state scope, effective date, expiry or refresh point, accountable owner and relationship to usable capacity, user outcomes and cash. Regional and national policy documents establish context. Financing conclusions require executed obligations, accepted service and observed payment performance.
The principal failure is that one blended pool uses long-term leverage against short-lived hardware and policy-dependent revenue. The practical response is to finance sites, equipment and regional programme functions with instruments matched to their distinct cash flows and control. Central assumptions should reflect enforceable arrangements and measured operations. Downside cases should combine related demand, price, technology, power, network, provider, currency, cybersecurity, policy and liquidity risks. Management estimates should be identified in the model and refreshed when source evidence changes.
| Instrument | Suitable use | Core repayment or release evidence |
|---|---|---|
| site project debt | long-life facility and utility assets | contracted site cash |
| equipment finance | identified hardware cohorts | cohort service cash and residual |
| sponsor equity | construction, demand and refresh risk | residual value creation |
| public or DFI support | access, integration and additionality | verified milestone or outcome |
| capacity reservation | defined user service | paid and releasable commitment |
Proposed framework; final legal and financial terms govern.
15. Bound public support to additional outcomes
Public support can pay for affordable access, resilience, regional integration, local capability, research spillovers or early demand risk. Each purpose requires its own cap, duration, performance test and termination rule. The analysis should identify the legal owner, service operator, payer, beneficiary, regulator and party bearing remediation or transition cost. [12][23][24][27]
The evidence file should begin with market-failure evidence, beneficiary definition, counterfactual price, instrument authority, milestones, audit, clawback and expiry. Each record should state scope, effective date, expiry or refresh point, accountable owner and relationship to usable capacity, user outcomes and cash. Regional and national policy documents establish context. Financing conclusions require executed obligations, accepted service and observed payment performance.
The principal failure is that public money becomes a permanent margin subsidy or covers capacity that commercial users would fund without support. The practical response is to pay only the verified gap or outcome and publish the access, capability and service results achieved. Central assumptions should reflect enforceable arrangements and measured operations. Downside cases should combine related demand, price, technology, power, network, provider, currency, cybersecurity, policy and liquidity risks. Management estimates should be identified in the model and refreshed when source evidence changes.
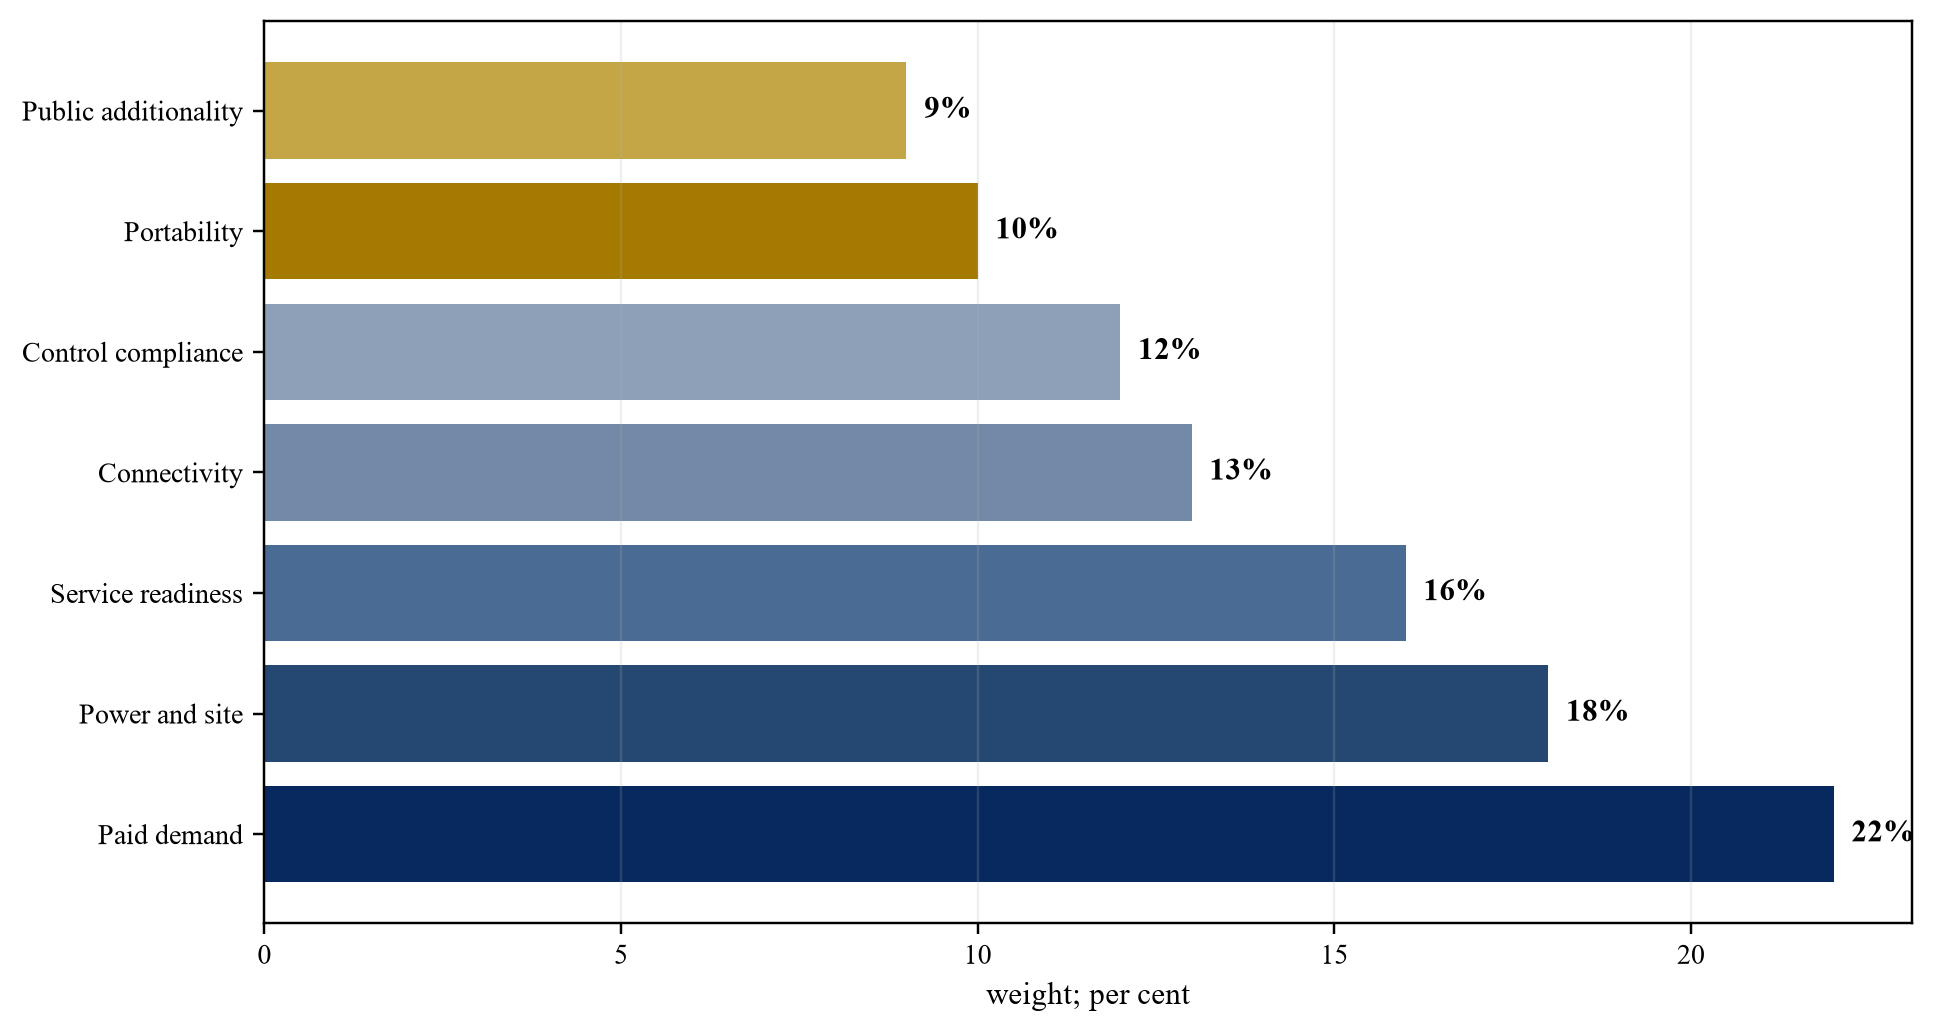
Proposed analytical weights; programme authorities should approve final weights.
16. Use development finance for mobilisation
Multilateral and regional platforms can support project preparation, policy reform, concessional capital, guarantees, B loans and cofinancing. Their role should mobilise viable private capital and address specified risks. The analysis should identify the legal owner, service operator, payer, beneficiary, regulator and party bearing remediation or transition cost. [23][24][25][28]
The evidence file should begin with project eligibility, additionality, environmental and social requirements, guarantee terms, cofinancing commitments, mobilisation and pricing. Each record should state scope, effective date, expiry or refresh point, accountable owner and relationship to usable capacity, user outcomes and cash. Regional and national policy documents establish context. Financing conclusions require executed obligations, accepted service and observed payment performance.
The principal failure is that development-finance participation is treated as proof that the underlying demand, technology and cash flow are financeable. The practical response is to connect each instrument to a defined risk and test whether private financing remains viable when support expires. Central assumptions should reflect enforceable arrangements and measured operations. Downside cases should combine related demand, price, technology, power, network, provider, currency, cybersecurity, policy and liquidity risks. Management estimates should be identified in the model and refreshed when source evidence changes.
17. Design the regional and national SPVs
A regional vehicle can own common contracts, standards, software and user entitlements. National project companies can own sites, hold licences, contract utilities and grant local security. Intercompany arrangements should be explicit. The analysis should identify the legal owner, service operator, payer, beneficiary, regulator and party bearing remediation or transition cost. [2][6][24][26]
The evidence file should begin with corporate structure, licences, shareholder agreements, service agreements, transfer pricing, cash waterfalls, security, tax and insolvency advice. Each record should state scope, effective date, expiry or refresh point, accountable owner and relationship to usable capacity, user outcomes and cash. Regional and national policy documents establish context. Financing conclusions require executed obligations, accepted service and observed payment performance.
The principal failure is that the fund consolidates cash across borders without enforceable upstreaming, security or creditor priority. The practical response is to document each SPV purpose and restrict debt to cash and collateral that the borrower can legally control. Central assumptions should reflect enforceable arrangements and measured operations. Downside cases should combine related demand, price, technology, power, network, provider, currency, cybersecurity, policy and liquidity risks. Management estimates should be identified in the model and refreshed when source evidence changes.
18. Control currency and convertibility risk
Capital expenditure may be priced in US dollars while service revenue and public budgets are denominated in local currencies. Currency volatility, convertibility and transfer restrictions can weaken debt capacity. The analysis should identify the legal owner, service operator, payer, beneficiary, regulator and party bearing remediation or transition cost. [24][25][26][29]
The evidence file should begin with currency by contract, indexation, hedges, reserve policy, convertibility rules, transfer mechanics, central-bank requirements and stress cases. Each record should state scope, effective date, expiry or refresh point, accountable owner and relationship to usable capacity, user outcomes and cash. Regional and national policy documents establish context. Financing conclusions require executed obligations, accepted service and observed payment performance.
The principal failure is that stable exchange rates are assumed across long equipment and debt tenors. The practical response is to match currency where possible, hedge committed exposures and size reserves and debt to combined currency and demand stress. Central assumptions should reflect enforceable arrangements and measured operations. Downside cases should combine related demand, price, technology, power, network, provider, currency, cybersecurity, policy and liquidity risks. Management estimates should be identified in the model and refreshed when source evidence changes.
19. Measure utilisation without double counting
Installed, available, reserved, scheduled, active, billable and paid hours describe different states. Regional scheduling adds transfers, failed jobs, network constraints and cross-node reservations that can create further double counting. The analysis should identify the legal owner, service operator, payer, beneficiary, regulator and party bearing remediation or transition cost. [4][8][11][12]
The evidence file should begin with capacity calendar, topology, maintenance, reservations, job logs, migrations, acceptance, invoices, credits and cash receipts. Each record should state scope, effective date, expiry or refresh point, accountable owner and relationship to usable capacity, user outcomes and cash. Regional and national policy documents establish context. Financing conclusions require executed obligations, accepted service and observed payment performance.
The principal failure is that the programme reports the most favourable utilisation measure or counts the same reservation at several nodes. The practical response is to publish a reconciled capacity-to-cash waterfall by node, product and user class. Central assumptions should reflect enforceable arrangements and measured operations. Downside cases should combine related demand, price, technology, power, network, provider, currency, cybersecurity, policy and liquidity risks. Management estimates should be identified in the model and refreshed when source evidence changes.
20. Build unit economics by node and workload
Power, land, cooling, network, software, support, tax and financing differ by location. Training, fine-tuning, inference and public-service workloads consume different resources and carry different service obligations. The analysis should identify the legal owner, service operator, payer, beneficiary, regulator and party bearing remediation or transition cost. [7][8][9][22]
The evidence file should begin with product price, discounts, subsidy, energy, network, licence, staffing, maintenance, failure, refresh, tax and allocation records. Each record should state scope, effective date, expiry or refresh point, accountable owner and relationship to usable capacity, user outcomes and cash. Regional and national policy documents establish context. Financing conclusions require executed obligations, accepted service and observed payment performance.
The principal failure is that a regional average hides loss-making nodes, cross-subsidies and workloads that cannot cover refresh. The practical response is to calculate contribution by node, workload and user class before consolidation and report public cost separately. Central assumptions should reflect enforceable arrangements and measured operations. Downside cases should combine related demand, price, technology, power, network, provider, currency, cybersecurity, policy and liquidity risks. Management estimates should be identified in the model and refreshed when source evidence changes.
21. Apply a hypothetical federated portfolio
The case tests a 120-megawatt IT-load portfolio across three markets with common products, regional scheduling and national asset companies. It is a decision model rather than a forecast or description of an announced fund. The analysis should identify the legal owner, service operator, payer, beneficiary, regulator and party bearing remediation or transition cost. [23][24][25][26]
The evidence file should begin with the stated hypothetical capital cost, sources, utilisation, reservations, support, power, refresh and downside assumptions. Each record should state scope, effective date, expiry or refresh point, accountable owner and relationship to usable capacity, user outcomes and cash. Regional and national policy documents establish context. Financing conclusions require executed obligations, accepted service and observed payment performance.
The principal failure is that headline regional demand is used to fill a financing model without binding site and workload evidence. The practical response is to show site sources and uses, consolidated liquidity, intercompany cash, utilisation, debt service and public outcomes separately. Central assumptions should reflect enforceable arrangements and measured operations. Downside cases should combine related demand, price, technology, power, network, provider, currency, cybersecurity, policy and liquidity risks. Management estimates should be identified in the model and refreshed when source evidence changes.
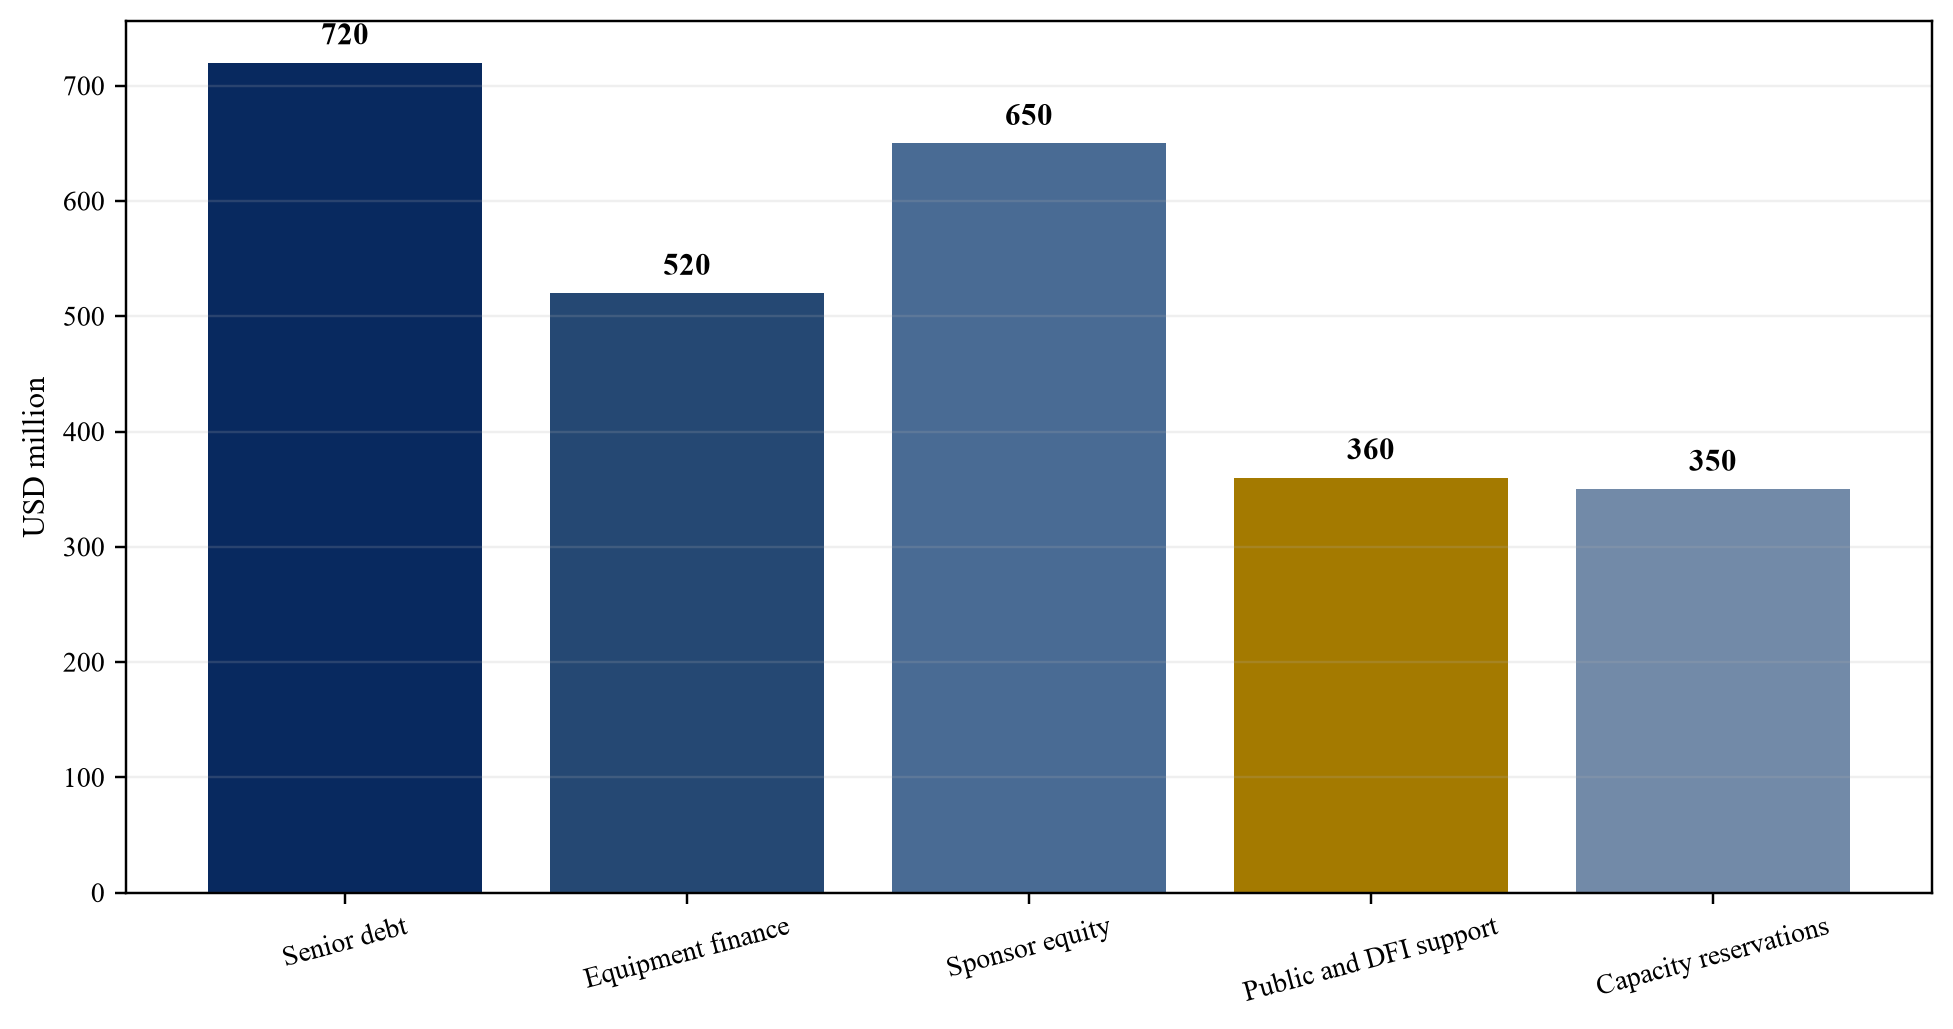
Wholly hypothetical; USD million.
| Metric | Central case | Downside or gate |
|---|---|---|
| initial IT load | 120 MW across three markets | staged 40 MW modules |
| initial uses | USD 2,600 million | USD 2,850 million cap |
| senior project debt | USD 720 million | site cash-flow cap |
| equipment finance | USD 520 million | eligible cohorts only |
| sponsor equity | USD 650 million | committed before debt draw |
| public and DFI support | USD 360 million | milestone and outcome based |
| paid capacity reservations | USD 350 million | releasable against service |
| year-four billable utilisation | 68% | 48% combined downside |
Wholly hypothetical; figures do not describe an announced fund or transaction.
22. Allocate risk to the party with control
Construction, hardware delivery, power, network, service, demand, price, currency, cybersecurity, policy and portability risks should follow operational and contractual control. Regional political support should not become an uncapped guarantee. The analysis should identify the legal owner, service operator, payer, beneficiary, regulator and party bearing remediation or transition cost. [15][16][23][24]
The evidence file should begin with risk matrix, caps, insurance, guarantees, direct agreements, relief events, termination, compensation and step-in rights. Each record should state scope, effective date, expiry or refresh point, accountable owner and relationship to usable capacity, user outcomes and cash. Regional and national policy documents establish context. Financing conclusions require executed obligations, accepted service and observed payment performance.
The principal failure is that risks sit in the pooled vehicle even when it cannot control national delivery or provider performance. The practical response is to retain risk at the controlling node and pool only risks the regional vehicle can diversify or manage. Central assumptions should reflect enforceable arrangements and measured operations. Downside cases should combine related demand, price, technology, power, network, provider, currency, cybersecurity, policy and liquidity risks. Management estimates should be identified in the model and refreshed when source evidence changes.
| Risk | Primary controller | Core protection |
|---|---|---|
| site construction and utility | national project company | completion tests and support |
| hardware and service | provider | acceptance, credits and substitution |
| regional demand allocation | programme vehicle | paid reservations and release rules |
| currency | contracting entity | matching, hedge and reserve |
| data and cybersecurity | controller and operator | tiered controls and audit |
| portability and transition | programme and providers | tested migration and reserve capacity |
Proposed framework; final contracts and public authority determine allocation.
23. Size debt to stressed eligible cash
Lenders need enforceable revenue, controlled accounts, security, reserves and cure rights. Reservations, public payments and intercompany transfers require legal and appropriation analysis before they enter debt capacity. The analysis should identify the legal owner, service operator, payer, beneficiary, regulator and party bearing remediation or transition cost. [24][25][26][29]
The evidence file should begin with contracts, credit, payment authority, assignment, security, escrow, direct agreements, reserves, covenants and downside cases. Each record should state scope, effective date, expiry or refresh point, accountable owner and relationship to usable capacity, user outcomes and cash. Regional and national policy documents establish context. Financing conclusions require executed obligations, accepted service and observed payment performance.
The principal failure is that regional strategic importance substitutes for repayment evidence or national cash is assumed to move freely to the borrower. The practical response is to size debt to stressed cash within each security perimeter and test consolidated liquidity without double counting. Central assumptions should reflect enforceable arrangements and measured operations. Downside cases should combine related demand, price, technology, power, network, provider, currency, cybersecurity, policy and liquidity risks. Management estimates should be identified in the model and refreshed when source evidence changes.
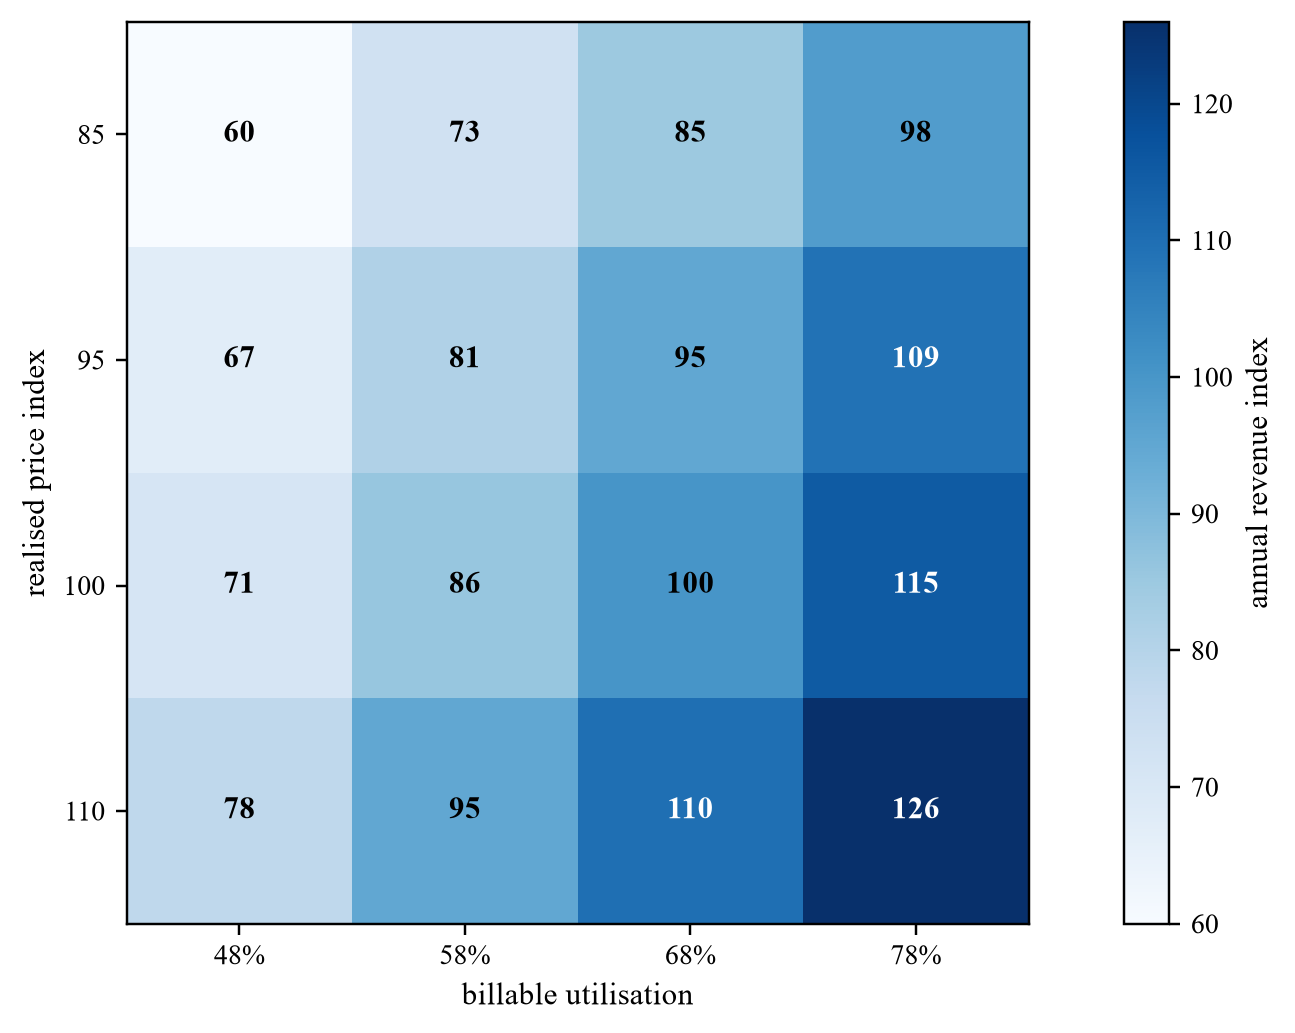
Wholly hypothetical; annual service-revenue index where central case equals 100.
24. Make interoperability an exit route
Interoperability should allow workloads, data and service rights to move when a node is unavailable, uneconomic, non-compliant or obsolete. It requires technical standards, licence portability and contractual migration rights. The analysis should identify the legal owner, service operator, payer, beneficiary, regulator and party bearing remediation or transition cost. [1][2][3][18]
The evidence file should begin with container and model formats, APIs, identity, network, data export, software licences, benchmark equivalence, migration tests and exit assistance. Each record should state scope, effective date, expiry or refresh point, accountable owner and relationship to usable capacity, user outcomes and cash. Regional and national policy documents establish context. Financing conclusions require executed obligations, accepted service and observed payment performance.
The principal failure is that common policy language is labelled interoperable while proprietary services, data gravity and licences prevent movement. The practical response is to test portability before award and fund periodic migration exercises and transition capacity. Central assumptions should reflect enforceable arrangements and measured operations. Downside cases should combine related demand, price, technology, power, network, provider, currency, cybersecurity, policy and liquidity risks. Management estimates should be identified in the model and refreshed when source evidence changes.
25. Govern capital allocation transparently
The programme needs rules for country, node, provider and user allocation. Decisions should follow verified demand, readiness, public value, diversification and affordability rather than fixed political quotas. The analysis should identify the legal owner, service operator, payer, beneficiary, regulator and party bearing remediation or transition cost. [1][2][4][6]
The evidence file should begin with scorecard, evidence pack, committee mandate, voting, conflicts, minutes, appeals, exceptions and outcome reports. Each record should state scope, effective date, expiry or refresh point, accountable owner and relationship to usable capacity, user outcomes and cash. Regional and national policy documents establish context. Financing conclusions require executed obligations, accepted service and observed payment performance.
The principal failure is that capital is pre-allocated equally or through bargaining even when projects differ materially in readiness and additionality. The practical response is to use a published score, independent diligence and milestone-based commitments with reallocation rights. Central assumptions should reflect enforceable arrangements and measured operations. Downside cases should combine related demand, price, technology, power, network, provider, currency, cybersecurity, policy and liquidity risks. Management estimates should be identified in the model and refreshed when source evidence changes.
26. Monitor comparable source data
Regional oversight requires stable definitions and direct feeds for capacity, availability, queues, jobs, billable use, payment, energy, water, incidents, user outcomes and public support. National systems can retain data while reporting agreed aggregates. The analysis should identify the legal owner, service operator, payer, beneficiary, regulator and party bearing remediation or transition cost. [3][7][9][11]
The evidence file should begin with data dictionary, provider feeds, site telemetry, invoice reconciliation, audit trail, access control, exceptions and certifications. Each record should state scope, effective date, expiry or refresh point, accountable owner and relationship to usable capacity, user outcomes and cash. Regional and national policy documents establish context. Financing conclusions require executed obligations, accepted service and observed payment performance.
The principal failure is that dashboards aggregate incompatible measures that cannot be traced to service logs, utilities, invoices and cash. The practical response is to establish common definitions, automated reconciliation and independent sample testing across every node. Central assumptions should reflect enforceable arrangements and measured operations. Downside cases should combine related demand, price, technology, power, network, provider, currency, cybersecurity, policy and liquidity risks. Management estimates should be identified in the model and refreshed when source evidence changes.
27. Separate accounting and public value
Customer revenue, grants, leases, financial instruments, consolidation and impairment require instrument-specific analysis. Regional spillovers and strategic resilience can support policy decisions but do not automatically create transferable enterprise value. The analysis should identify the legal owner, service operator, payer, beneficiary, regulator and party bearing remediation or transition cost. [30][31][32][33]
The evidence file should begin with contracts, control assessment, grant conditions, leases, debt terms, expected credit loss, impairment indicators, market evidence and accounting opinions. Each record should state scope, effective date, expiry or refresh point, accountable owner and relationship to usable capacity, user outcomes and cash. Regional and national policy documents establish context. Financing conclusions require executed obligations, accepted service and observed payment performance.
The principal failure is that public benefit is capitalised into enterprise value or all support is treated as recurring commercial EBITDA. The practical response is to account for each instrument separately and present commercial value, provider-specific value and public outcomes in distinct records. Central assumptions should reflect enforceable arrangements and measured operations. Downside cases should combine related demand, price, technology, power, network, provider, currency, cybersecurity, policy and liquidity risks. Management estimates should be identified in the model and refreshed when source evidence changes.
28. Reach the regional investment decision
Approval should rest on verified demand, accepted service, site readiness, interoperable products, bounded support, matched capital, secure operations and credible transition. The first tranche should preserve the option to expand, reallocate or stop. The analysis should identify the legal owner, service operator, payer, beneficiary, regulator and party bearing remediation or transition cost. [1][3][23][25]
The evidence file should begin with country evidence map, demand ladder, product specification, site gates, capital plan, risk allocation, controls, scenarios and approvals. Each record should state scope, effective date, expiry or refresh point, accountable owner and relationship to usable capacity, user outcomes and cash. Regional and national policy documents establish context. Financing conclusions require executed obligations, accepted service and observed payment performance.
The principal failure is that regional urgency becomes a reason to commit the full programme before contracts and operating evidence exist. The practical response is to approve staged capital against measurable conditions and expand only after paid utilisation and public outcomes are reconciled. Central assumptions should reflect enforceable arrangements and measured operations. Downside cases should combine related demand, price, technology, power, network, provider, currency, cybersecurity, policy and liquidity risks. Management estimates should be identified in the model and refreshed when source evidence changes.
| Decision | Minimum evidence | Possible action |
|---|---|---|
| country and site | demand, power, network and permits | approve, resize or defer |
| product catalogue | benchmark, price and controls | accept, condition or reject |
| public support | market failure and additionality | grant, target or decline |
| debt | stressed eligible site cash | lend, condition or reduce |
| allocation | readiness and public-value score | commit or reallocate |
| portability | successful migration test | expand, remediate or reserve |
| next tranche | paid use and outcomes | scale, rebid or stop |
Proposed governance; each approval retains its legal authority.
Sources
- ASEAN, *ASEAN Digital Masterplan 2030* (2026). Read the primary source
- ASEAN, *ASEAN Digital Economy Framework Agreement Public Summary* (2023). Read the primary source
- ASEAN, *ASEAN Guide on AI Governance and Ethics*. Read the primary source
- ASEAN, *Declaration on the Establishment of an ASEAN AI Safety Network* (2025). Read the primary source
- ASEAN, *Framework on Digital Data Governance* (2018). Read the primary source
- ASEAN, *e-ASEAN Framework Agreement*. Read the primary source
- IMDA Singapore, *Green Data Centre Roadmap* (2024). Read the primary source
- Malaysian Investment Development Authority, *Malaysia's Digital Backbone* (2026). Read the primary source
- ASEAN, *Guide for Sustainable Data Centre Development* (2025). Read the primary source
- World Bank, *Thailand Digital Data Infrastructure Roadmap* (2026). Read the primary source
- World Bank, *Digital Progress and Trends Report 2025: Strengthening AI Foundations*. Read the primary source
- World Bank, *Building Data Infrastructure for AI Readiness* (2026). Read the primary source
- IMDA Singapore, *Enterprise Compute Initiative* (2025). Read the primary source
- ASEAN, *Model Contractual Clauses for Cross Border Data Flows* (2021). Read the primary source
- ASEAN, *Expanded ASEAN Guide on AI Governance and Ethics: Generative AI*. Read the primary source
- ASEAN, *Implementing Guidelines for ASEAN Data Management Framework and Cross Border Data Flows* (2021). Read the primary source
- ASEAN, *Guidelines for Strengthening Resilience and Repair of Submarine Cables* (2019). Read the primary source
- National Institute of Standards and Technology, *AI Risk Management Framework*. Read the primary source
- International Telecommunication Union, *AI infrastructure and compute resources*. Read the primary source
- ASEAN, *ASEAN Guidelines on 5G Ecosystem Development*. Read the primary source
- ASEAN, *ASEAN Information Infrastructure and regional connectivity*. Read the primary source
- International Energy Agency, *Energy and AI* (2025). Read the primary source
- Asian Development Bank, *ASEAN Infrastructure Fund*. Read the primary source
- Asian Development Bank, *Southeast Asia Cofinancing*. Read the primary source
- Asian Development Bank, *Southeast Asia operations and digital infrastructure*. Read the primary source
- World Bank Group, *Infrastructure Foundations: From Current Assets to Future Growth* (2026). Read the primary source
- Malaysia Ministry of Digital, *National Cloud Computing Policy* (2025). Read the primary source
- Asian Development Bank, *Seraya Partners Fund II Southeast Asia* (2026). Read the primary source
- International Monetary Fund, *Guidance on public-private partnerships, fiscal risk and capital flows*. Read the primary source
- IFRS Foundation, *IFRS 10 Consolidated Financial Statements*. Read the primary source
- IFRS Foundation, *IFRS 15 Revenue from Contracts with Customers*. Read the primary source
- IFRS Foundation, *IFRS 9 Financial Instruments*. Read the primary source
- IFRS Foundation, *IAS 36 Impairment of Assets*. Read the primary source
