

1. Define the cost-base decision
A board approving a demerger needs to know whether both resulting companies can operate, fund their strategies and satisfy their obligations after shared infrastructure is divided. The cost-base decision is therefore an operating-model and capital-allocation decision. It determines sustainable earnings, working capital, liquidity, leverage, valuation and the credibility of public disclosure.
Historical segment profit is only a starting point. A business embedded in a group may receive finance, treasury, tax, legal, risk, audit, procurement, cyber security, data, human resources, insurance, property and executive services from the parent. The segment may be charged through revenue, headcount or another allocation key. The charge can differ materially from the cost of buying or building the service independently.
The parent also faces a new cost base. Revenue and directly transferred costs leave, while leases, licences, teams and systems may remain. These stranded costs reduce the value retained by the parent unless management has a funded removal plan. Some shared-scale benefits disappear for both companies. Insurance, procurement, technology and funding can become more expensive after the group divides.
The board should approve one integrated cost taxonomy, one perimeter and one baseline date. Every adjustment should reconcile to source records and an accountable owner. The model should distinguish observed historical amounts from future assumptions and should show the timing and cash consequences of each action.
2. Why corporate allocations mislead
Corporate allocations answer an internal reporting question: how should group expenditure be distributed among business units? A standalone cost model answers a different question: what resources must the business control or procure to operate independently at the required service and control level? The two amounts can coincide by chance, but their construction is different.
An allocation based on revenue can charge a fast-growing, operationally simple division more than the services it consumes. A headcount allocation can undercharge a data-intensive business with complex cyber, regulatory or intellectual-property requirements. A flat percentage can obscure step costs, minimum contract commitments and regional complexity.
Allocations also mix cost categories. They may include shareholder activities that the separated company will not replicate, such as parent investor relations or group portfolio management. They may omit capabilities embedded in another function, such as compliance staff inside a business line. They can include temporary transformation expenditure, central restructuring or acquisition costs that do not recur.
The solution is not to remove all allocations. Historical allocations provide useful clues about service consumption and reconcile the model to audited records. They should be decomposed into activities, drivers and contractual commitments before being retained, replaced or excluded.
3. Establish the operating perimeter
The legal entity perimeter does not necessarily match the operating perimeter. People, contracts, technology, intellectual property, data, facilities and permits can serve multiple businesses. A demerger requires an explicit decision about which resources transfer, which remain, which are replicated and which are supplied temporarily.
The cost model should begin with products, customers and operating locations. It should then trace the capabilities needed to sell, deliver, collect cash, comply, protect assets and make decisions. Each capability should have a day-one owner and an end-state owner. A missing capability can create an operational or control failure; an unnecessary capability can burden the separated company with avoidable fixed cost.
The perimeter ledger should record current owner, proposed owner, location, legal employer or contracting party, annual cash cost, asset or liability, transfer mechanism, consent, data dependency and target date. The ledger should reconcile with the separation agreement, carve-out financial statements, technology plan, people plan and transition-service schedule.
Perimeter discipline prevents cost from moving independently of capability. Transferring a team without its software licences, data rights or premises creates hidden replacement expenditure. Leaving a contract with the parent while transferring its users creates a transition dependency and possible stranded commitment.
| Cost category | Definition | Typical evidence | Financial treatment | Decision question |
|---|---|---|---|---|
| Transferred direct cost | Existing resource moves with the business | Payroll, supplier contract, asset register | Historical base adjusted for perimeter | Does the cost and capability transfer together? |
| Incremental standalone cost | Recurring capability required outside the group | Organisation design, vendor quote, control requirement | Added to sustainable run-rate | What must be built or bought for independent operation? |
| One-time separation cost | Non-recurring expenditure to create independence | Project plan, migration quote, retention plan | Cash and transaction adjustment | Is the action funded and tied to a gate? |
| Transition-service cost | Temporary service supplied after completion | TSA catalogue, volume, unit price and duration | Temporary operating or separation cash cost | Is there a funded exit and accountable recipient? |
| Parent stranded cost | Cost remains after revenue and capability leave | Contract, lease, retained team and notice period | Parent earnings and cash impact | Can it be removed, redeployed or recovered? |
| Dis-synergy | Scale or purchasing benefit lost by one or both companies | Renewal quote, insurance indication, funding analysis | Recurring end-state adjustment | Is the loss avoidable through redesign or sourcing? |
Original framework. Classification should follow the transaction perimeter, accounting policies and end-state operating model.
4. Build a service catalogue
A service catalogue converts an organisational chart into measurable activities. It should cover front-office support, operations, control functions, corporate functions and infrastructure. Each service should state recipient, scope, service level, volume driver, current provider, current cost, end-state provider and control owner.
Finance should be decomposed into record-to-report, order-to-cash, procure-to-pay, tax, treasury, planning, consolidation and statutory reporting. Technology should distinguish applications, infrastructure, service desk, cyber operations, identity, data, architecture and vendor management. Human resources should distinguish payroll, benefits, talent, learning, employee relations and reward.
The catalogue should capture demand. A separated business may require fewer group reports but more statutory reporting. It may need its own treasury, audit committee support and investor relations. It may reduce enterprise architecture but require a new identity platform and security operations. Service volumes and control standards drive cost more reliably than broad organisational labels.
Every service should be tagged as transfer, build, buy, TSA, discontinue or redesign. This forces an end-state choice and exposes unresolved dependencies. It also provides the foundation for vendor requests, headcount design and transition milestones.
5. Reconstruct the historical baseline
The historical baseline should reconcile to audited or controlled management records. It should include direct payroll, contractors, third-party spend, depreciation, leases, intercompany charges and allocated corporate expenditure. The purpose is to preserve traceability before future adjustments are applied.
Management should select a representative period and explain anomalies. Acquisitions, disposals, inflation, restructuring, vacancies, capitalised labour and temporary projects can distort the run rate. Where twelve months are not representative, the model should show both reported and normalised amounts.
Cost-centre data should be mapped to services and legal entities. Purchase orders and invoices help identify contract owner, renewal date and minimum commitment. Payroll data identifies role, location, grade and employer. Asset registers and licence inventories identify technology and property obligations that may not follow users automatically.
The baseline should retain a bridge from general ledger to segment reporting and from segment reporting to the standalone model. Each bridge item should state whether it is observed, contractual, quoted or assumed. This evidence hierarchy helps the board and auditors distinguish established cost from management estimates.
6. Test the allocation basis
Each corporate allocation should be tested against service consumption and causation. The team should identify the underlying pool, allocation driver, business share, historical amount and service received. It should then decide whether the service continues, changes or ends.
A useful test asks four questions. Does the business consume the service? Is the service required after separation? Does the historical driver approximate future demand? Can the future service be delivered at the historical cost? A negative answer to any question requires a replacement estimate or exclusion.
Allocations for group debt, shareholder reporting or parent strategy may not represent standalone operating capability. Allocations for payroll processing, cyber monitoring or accounts payable may represent genuine demand, but their future cost depends on scale, provider and control requirements. Management should document the reason for every material decision.
The SEC Financial Reporting Manual recognises carve-out statements where a discrete activity has identifiable assets and liabilities and a reasonable basis exists for allocating items that are not specifically identifiable. It also expects reasonable allocations of expenses incurred on behalf of a business in relevant abbreviated reporting. [1] The reporting allocation and the forward standalone forecast should remain visibly distinct.
7. Design the standalone organisation
The organisation design should follow required decisions and controls. It should identify accountable executives, statutory officers, control owners and operational teams. Titles alone are insufficient; spans, layers, location, skill, availability and cost matter.
Some roles transfer directly. Others are fractional within the group and must become full-time, outsourced or shared temporarily. A business using fifteen per cent of a group tax specialist cannot hire fifteen per cent of a person. The standalone model must recognise indivisibility and minimum viable teams.
Vacancies need careful treatment. A historical vacancy can flatter earnings if the work was deferred or absorbed by the parent. The model should include roles required for sustainable operation, even if recruitment occurs after completion. Conversely, a proposed role should not be added merely because it exists at group level.
Compensation should reflect the labour market, location, benefits, incentive design and public-company requirements. Retention payments, relocation and recruitment fees are generally one-time separation costs. Permanent changes in salary, benefits and board remuneration belong in the recurring run rate.
8. Cost the technology estate
Technology is a common source of hidden standalone cost. The business may use group licences, shared infrastructure, integrated data platforms and central security. Contracts can restrict assignment, and unit prices can rise when purchasing volume falls.
The team should inventory applications, infrastructure, interfaces, identities, data stores, licences, support teams and service providers. Each item should have an owner, user population, criticality, contractual right, separation action, target architecture and cost. Shared applications require a decision to clone, migrate, replace or retain temporarily.
Recurring end-state cost includes licences, cloud consumption, networks, support, cyber operations, data platforms, disaster recovery and technology staff. One-time cost includes extraction, build, migration, testing, remediation, parallel running and decommissioning. TSA charges should not be used as the end-state estimate unless the service, volume and price remain sustainable.
The model should include volume and price sensitivities. Cloud and software costs can change with users, transactions, storage, environments and support levels. Minimum commitments create step costs. Cyber and resilience requirements can increase after separation because the business loses group monitoring and recovery capabilities.
9. Price control functions
Control functions protect the licence to operate and the integrity of reporting. Legal, compliance, risk, internal audit, data protection, health and safety, tax, treasury and company secretariat should be designed from obligations and risk, not copied mechanically from the parent.
The separated company's geography, regulated activities, customer contracts, financing and listing venue determine its control burden. A smaller company can still require a complete control architecture. Minimum viable capability can produce a higher cost as a percentage of revenue than in the former group.
The design should distinguish first-line ownership, second-line challenge and third-line assurance. Combining roles may be efficient but must preserve independence where required. Outsourcing can provide specialist capacity, but accountability remains with management and the board.
The cost base should include external audit, tax compliance, legal retainers, insurance, board evaluation, regulatory fees and specialist assurance. It should also include systems used for controls, reporting and evidence retention.
10. Model procurement and scale dis-synergies
The demerged companies may lose group discounts, rebates, credit terms and purchasing leverage. Suppliers can require new contracts, security deposits or shorter payment terms. Insurance premiums, banking fees and professional-service rates can rise at smaller scale.
Procurement should identify contracts by spend, criticality, assignability, minimum commitment, renewal date and volume tier. The cost model should compare current effective unit price with credible quotes or contractual terms for each end state. A blanket percentage dis-synergy is useful only as an early placeholder.
Some scale loss can be mitigated. The companies may participate in a buying consortium, retain joint procurement for a limited period, redesign specifications or consolidate vendors. Mitigation should enter the model only when there is an owner, action, cost, timing and evidence.
Working-capital effects belong beside operating cost. Reduced payment terms, deposits and inventory buffers consume cash even when they do not reduce EBITDA. The standalone plan should connect cost, working capital and liquidity.
11. Separate recurring and one-time expenditure
Recurring cost supports the enduring operating model. One-time expenditure creates the separation or removes stranded cost. Mixing them can overstate sustainable cost or understate cash funding.
One-time categories include programme management, legal-entity restructuring, audit, tax advice, data extraction, system build, migration, rebranding, contract novation, employee consultation, recruitment, retention, relocation, property works and TSA exit. Each item should have a work package, milestone, supplier or internal resource, contingency and approval owner.
Internal labour requires consistent treatment. If employees perform separation work instead of normal duties, the programme consumes capacity even when no new invoice arises. Capitalisation depends on applicable accounting requirements and facts; the cash and resource view should remain visible irrespective of presentation.
Contingency should be linked to identified uncertainty. A single percentage can conceal risk. Technology discovery, data remediation, contract consent and property exit may need separate ranges. The board should see committed, forecast and at-risk expenditure.
12. Design transition services to end
Transition services can protect continuity while the separated company builds its own capabilities. They also create dependency, information-security risk and delayed stranded-cost removal. Every TSA should therefore be designed with an exit path.
The service schedule should define scope, users, volume, service level, controls, data access, price, tax, change process, incident management and termination. Pricing may use cost, cost-plus or market terms, subject to applicable tax and governance considerations. The recipient should understand which activities are excluded.
The cost model should show TSA charge and recipient exit cost separately. A low temporary charge can create a misleading earnings bridge if replacement cost is higher. The parent should model delivery cost and the date on which underlying resources can be removed or redeployed.
Exit readiness should be evidenced through contracts, configured systems, migrated data, trained people, reconciled opening balances, controls and cutover tests. Automatic extensions should require senior approval because they defer independence and can crystallise additional cost.
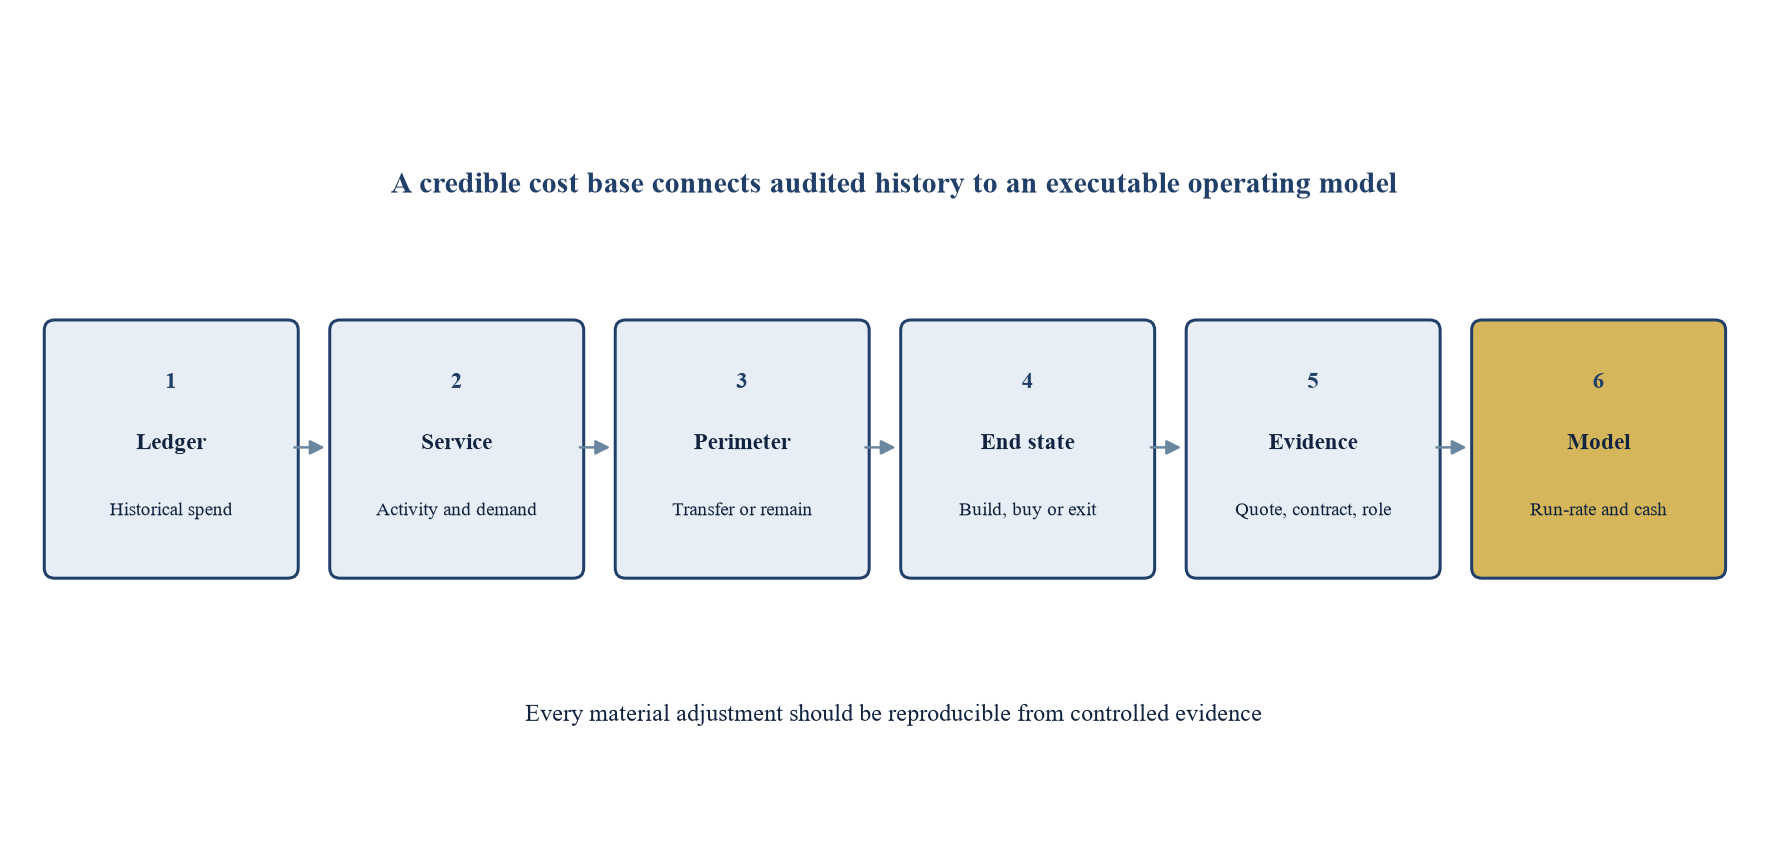
Original framework. Each adjustment should retain source, owner, timing and confidence.
13. Identify parent stranded cost
Stranded cost is expenditure that remains after the associated business, revenue or service demand leaves. It can arise from people, property, software, infrastructure, contracts, insurance, professional services and management layers. It is a parent problem, although transaction design can affect its size and timing.
The parent should build a resource-level stranded-cost register. Each item should show current cost, transferred demand, remaining demand, contractual commitment, removal action, one-time exit cost, earliest removal date, owner and confidence. A broad overhead-reduction target is insufficient.
Some resources can be removed. Others can be redeployed, resized at renewal, recovered through TSA pricing or absorbed by growth. Redeployment should be supported by a funded vacancy or identified demand. Recovery through TSA ends when the service ends. Growth absorption is a forecast and should not be presented as achieved savings.
Timing is crucial. A cost may be removable after a lease break, software renewal, consultation process or system retirement. The earnings benefit and cash benefit can occur at different dates. The model should show monthly or quarterly movement until the parent reaches its target run rate.
14. Govern dis-synergies across both companies
Dis-synergies can affect the separated company, the parent or both. They include higher purchasing prices, duplicated management, reduced risk pooling, weaker financing terms, lower asset utilisation and lost cross-selling. They should be recorded independently from standalone capability cost.
The team should identify the mechanism and affected party. A loss of volume rebate can be supported by a supplier tier. A rise in insurance can be supported by broker indications. A reduction in funding capacity requires treasury and lender analysis. A loss of cross-selling needs customer and pipeline evidence.
Mitigation actions should not be netted automatically. Gross exposure and mitigation should remain visible. This allows the board to see which value depends on future execution and prevents an assumed action from hiding the underlying structural loss.
The separation agreement may allocate temporary benefits or burdens, but it cannot eliminate the underlying economics. Joint purchasing, brand licences or shared facilities can preserve scale for a period while maintaining dependencies that require governance and exit provisions.
15. Connect cost to carve-out reporting
Carve-out financial statements provide a historical view of the separated business. Their allocation principles, perimeter and accounting policies should reconcile with the standalone model, but the two serve different purposes. Historical reporting should not be rewritten to equal a management forecast.
SEC guidance states that Article 11 pro forma information includes transaction accounting adjustments and autonomous entity adjustments needed to show operations and financial position as an autonomous entity. Management adjustments may be presented under specified conditions. [2] This architecture reinforces the need to distinguish historical, transaction-specific and forward-looking information.
IFRS 5 requires separate presentation for qualifying disposal groups and discontinued operations and sets classification and measurement requirements for assets held for sale. [3] A demerger can also require analysis of the disposal method and presentation. Accounting conclusions depend on the legal steps, control and facts.
The model should maintain an adjustment register with description, amount, period, source, accounting treatment, cash effect and confidence. Finance, audit, legal and transaction teams should use the same definitions. Differences should be explained rather than concealed.
16. Test related-party and governance arrangements
Before separation, shared services and financing occur within a controlled group. After separation, continuing arrangements may become related-party or arm's-length transactions, depending on ownership and applicable rules. Their pricing, approval and disclosure require explicit governance.
IAS 24 identifies services, leases, licence arrangements, finance, guarantees and other transfers as examples of related-party transactions requiring disclosure when relevant conditions are met. [4] The OECD reports extensive use of board approval, abstention and independent review safeguards for significant related-party transactions across jurisdictions. [5]
The board should approve material TSAs, shared contracts, property arrangements, licences and financing through a conflict-aware process. Terms should state scope, price, duration, liability, data rights, change and exit. Independent challenge can test whether arrangements protect each company and its shareholders.
Governance cost should be included in the standalone model. Separate boards, committees, secretariat, reporting, assurance and policies create recurring expenditure. The parent may also need to redesign its own governance after the business leaves.
17. Build the cost model
The model should combine three views. The income-statement view shows reported cost, sustainable standalone run rate and parent retained run rate. The cash view shows separation expenditure, working capital, deposits, TSA cash flows and cost-removal expenditure. The timetable shows when capabilities start, services end and costs leave.
The recurring bridge should begin with reported divisional EBITDA, reverse historical corporate allocations where appropriate and add the end-state cost of required capabilities. Direct transferred cost should remain unless the perimeter changes. Dis-synergies and permanent savings should be shown separately.
The parent bridge should begin with the corporate cost pool, remove resources that transfer, identify resources consumed solely by the separated business, allocate genuinely shared resources to remaining demand and show removal actions. The target should be a resource-level run rate rather than a percentage reduction.
Each assumption should have a base, downside and management case where uncertainty is material. The downside should test delayed exits, higher technology cost, slower recruitment, weaker purchasing terms and extended TSAs. The board should see liquidity and covenant effects, not only EBITDA.
Model architecture matters because different users need different levels of detail. The resource schedule should retain employee, contract, asset and service-level records. The management model should aggregate those records into functions, cost categories and periods. The board view should show the principal bridges, uncertainties, cash requirements and decision triggers. All three views should reconcile without manual overrides.
The model should separate price, volume, scope and timing. A software increase caused by fewer users is a scale effect; a new security module is a scope effect; delayed migration is a timing effect. This decomposition allows management to challenge the right driver and avoids treating every increase as unavoidable standalone cost.
Foreign exchange and inflation need explicit assumptions where functions or suppliers span currencies. The reported baseline may use average historical rates, while separation expenditure and future contracts use different dates. The model should show constant-currency and cash views where currency movement can affect decisions.
Intercompany balances, guarantees and shared funding should be modelled separately from operating services. The separated company may need replacement guarantees, bank facilities, cash management, hedging and collateral. Fees and liquidity effects can change the cost of independence even when they are presented outside operating EBITDA.
Sensitivity analysis should be concentrated on variables capable of changing the decision. These may include technology migration duration, licence repricing, public-company capability, procurement tiers, recruitment lead times, TSA extensions and property exits. Large tables of immaterial sensitivities can obscure the few assumptions that determine value and liquidity.
Model control should include version ownership, change logs, approved inputs and automated checks. The opening balance sheet, standalone income statement, cash flow, financing model and parent cost-removal plan should use consistent perimeter and timing. A change in one workstream should flow through the relevant statements and decision outputs.
The board should receive reconciliation evidence at each gate. The sum of transferred resources, retained resources, new capabilities and discontinued activities should explain the movement from historical group cost to the two end-state cost bases. Unexplained residuals should remain open issues rather than disappear into an adjustment line.
18. Apply an evidence-confidence score
Cost estimates vary in maturity. An executed contract provides stronger evidence than a benchmark; a named organisation with approved roles is stronger than a broad headcount ratio. The model should display confidence so that decision-makers can focus diligence on the largest uncertain items.
A practical hierarchy can classify evidence as executed, quoted, designed, benchmarked or placeholder. Executed evidence includes signed contracts and payroll. Quoted evidence includes binding or recent supplier proposals. Designed evidence includes approved roles and specifications. Benchmarks and placeholders require further validation.
Confidence should affect contingency and decision gates. A material low-confidence cost should not be hidden inside a precise total. The board can require a quote, contract, role design or control assessment before committing to the transaction.
The score should not substitute for judgement. A signed contract can still be unsuitable, and a carefully developed internal estimate can be decision-useful. The purpose is to make evidence quality visible and actionable.
| Evidence class | Example | Confidence | Permitted use | Required next step |
|---|---|---|---|---|
| Executed | Signed contract, payroll or lease | High | Baseline and committed cash | Confirm perimeter and effective date |
| Quoted | Current supplier proposal or broker indication | Medium-high | Base case with validity period | Negotiate and approve terms |
| Designed | Approved organisation, control or architecture | Medium | Planning case | Recruit, procure or test capability |
| Benchmarked | Comparable unit cost adjusted for scope | Medium-low | Range and sensitivity | Obtain company-specific evidence |
| Placeholder | Percentage or management judgement | Low | Early discovery only | Replace before final approval |
Original framework. Thresholds should reflect materiality, transaction timetable and disclosure requirements.
19. Build the hypothetical case
The hypothetical group contains an industrial-services division proposed for demerger. The division reports USD 920 million of revenue and USD 132 million of EBITDA after a USD 28 million corporate allocation. Direct operating costs and divisional functions are already included in the reported result.
The service catalogue identifies recurring standalone capabilities costing USD 41 million. Finance and treasury require USD 8 million, technology and cyber USD 12 million, people and property USD 6 million, legal, risk and compliance USD 7 million, and board, investor, insurance and other corporate services USD 8 million. Reversing the USD 28 million allocation and adding USD 41 million reduces sustainable standalone EBITDA to USD 119 million.
One-time separation expenditure is assumed at USD 66 million, including USD 31 million for technology and data, USD 12 million for people and programme delivery, USD 9 million for legal, audit and tax, USD 8 million for facilities and branding, and USD 6 million of contingency tied to identified work packages. These values are analytical assumptions.
The parent corporate cost pool is USD 118 million. USD 28 million was allocated to the division, but only USD 10 million of resources transfer with it. The immediate parent run rate therefore contains USD 18 million related to departed demand plus USD 36 million of additional shared cost that management identifies as reducible or redeployable. This creates USD 54 million of gross stranded-cost exposure before mitigation.
The assumed mitigation programme removes or redeploys USD 34 million over twenty-four months at a one-time cash cost of USD 22 million. USD 20 million remains in the parent's end-state cost base. Every value, period and outcome in this case is hypothetical and should be replaced with company evidence in a live mandate.
20. Reconcile the hypothetical standalone bridge
The reported corporate allocation understates the assumed standalone capability cost by USD 13 million. The difference is not an automatic loss of value; it represents the net price of independent governance, systems, controls and scale under the stated design. Management can challenge scope and sourcing, but it should not remove required capability merely to preserve a headline margin.
The sustainable EBITDA margin falls from 14.3 per cent on the reported divisional basis to 12.9 per cent on the standalone basis. A valuation using the reported EBITDA without adjustment would overstate recurring earnings by USD 13 million. At an illustrative enterprise-value multiple of 9.0 times, that difference equates to USD 117 million before considering cash, debt, tax or execution risk.
The calculation shows why small allocation errors can become large valuation errors. The multiple is hypothetical and is not a market observation or valuation conclusion. A live analysis should use scenario ranges, current evidence and the appropriate valuation methods.
The board should also test the downside. If technology cost is USD 4 million higher and procurement dis-synergies are USD 3 million higher, sustainable EBITDA falls to USD 112 million. If cost is delivered USD 5 million below the base case after control validation, EBITDA rises to USD 124 million. These cases create an explicit diligence agenda.
| Bridge item | Separated company | Parent | Timing | Evidence status |
|---|---|---|---|---|
| Reported divisional EBITDA | 132 | Not applicable | Historical | Assumed controlled record |
| Reverse corporate allocation | 28 | Not applicable | Historical bridge | Assumed allocation record |
| Add recurring standalone capability | (41) | Not applicable | End state | Designed and quoted mix |
| Sustainable standalone EBITDA | 119 | Not applicable | End state | Analytical output |
| Gross stranded cost | Not applicable | (54) | Immediate exposure | Resource assessment |
| Removed or redeployed cost | Not applicable | 34 | Over 24 months | Management action case |
| Residual parent cost | Not applicable | (20) | End state | Analytical output |
| One-time cash cost | (66) | (22) | Programme period | Work-package estimate |
Original scenario. All values are assumed USD millions and are not forecasts or valuation advice.
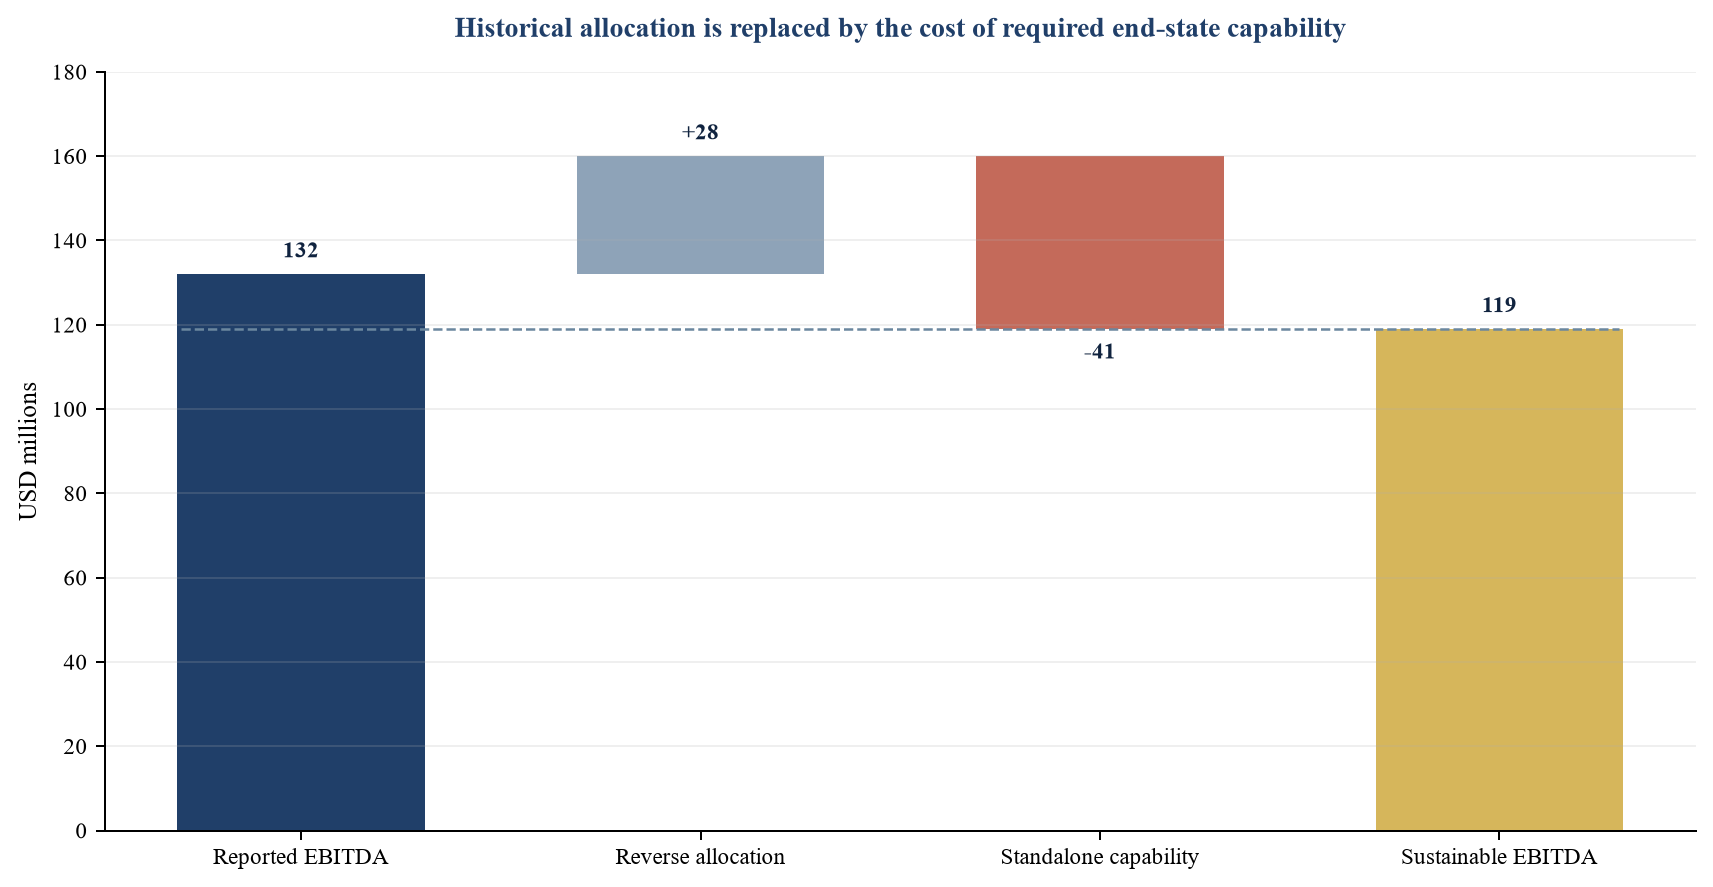
Original scenario. All amounts are assumed USD millions.
21. Test stranded-cost timing and value
The hypothetical parent cannot remove USD 34 million immediately. The programme assumes USD 8 million of annualised cost removed by month six, USD 18 million by month twelve, USD 27 million by month eighteen and USD 34 million by month twenty-four. The delay creates earnings and cash leakage after completion.
The removal plan should specify actions. Property may require consolidation and a lease event. Technology may require contract renewal and system retirement. People actions may require consultation, redeployment or natural attrition. Management layers can be redesigned after the operating perimeter stabilises.
At completion, the parent should report gross stranded exposure, actions completed, annualised run-rate removed, cash spent and residual exposure. Claiming the full target before resources leave can mislead decision-makers. A verified run-rate requires payroll, contract, lease or other evidence.
The model should compare accelerated removal with its cash and operational risk. Spending more to exit early may create value where the present value of savings exceeds the cost and service continuity is protected. Some costs should remain because they support the parent's future strategy and control environment.
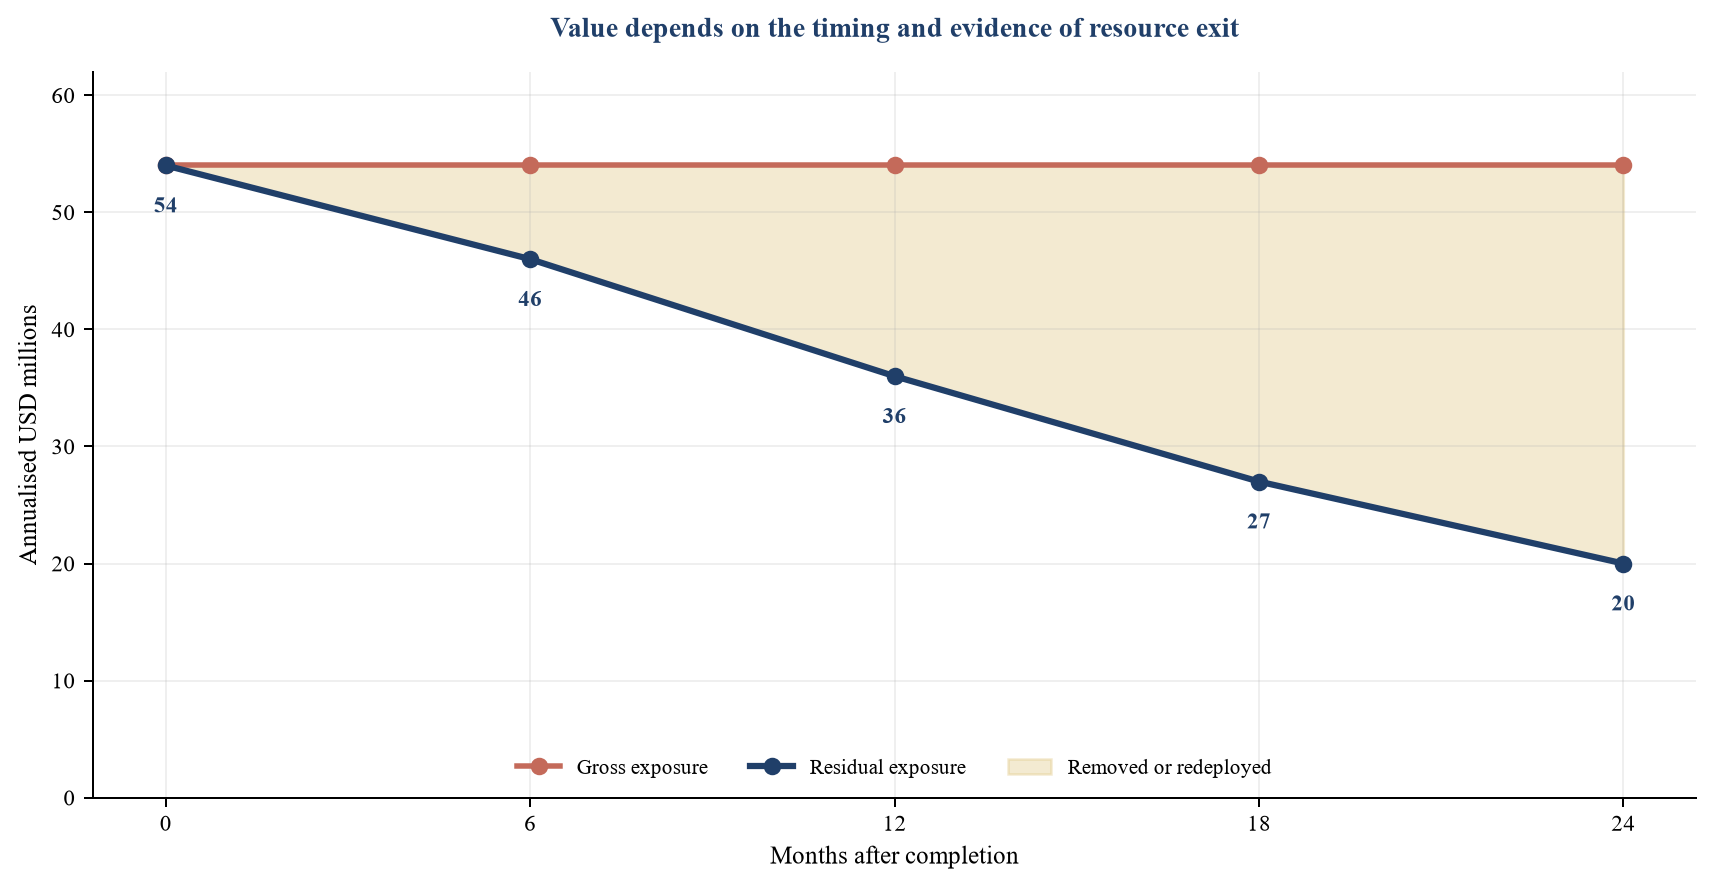
Original scenario. Values are annualised USD millions and reflect assumed management actions.
22. Use decision gates and a risk heat map
The board should require evidence gates before announcement, legal completion and TSA exit. The first gate confirms perimeter, cost taxonomy and material unknowns. The second confirms audited or controlled historical information, organisation design, technology architecture, supplier evidence and a funded separation budget. The third confirms operational readiness and opening liquidity.
Risk should be assessed by value consequence and evidence confidence. A material estimate with low confidence demands immediate diligence. A lower-value item can remain in contingency if it cannot threaten control, liquidity or disclosure. The heat map should direct effort rather than create a decorative risk score.
The decision record should include sustainable standalone EBITDA, parent residual cost, one-time cash, TSA profile, working capital, financing and downside headroom. It should show assumptions that depend on counterparties, markets, regulators or future management action.
Route-switch or delay triggers can include an unresolved material cost gap, inability to fund the downside, missing statutory capability, a critical technology dependency without tested exit, or parent stranded cost beyond the approved threshold. Trigger breaches should return to the board.
| Gate | Required evidence | Principal decision | Failure signal | Board response |
|---|---|---|---|---|
| Perimeter freeze | Service catalogue, resource ledger and ownership map | Scope the financial and operating model | Material capability has no owner | Reopen perimeter and timetable |
| Cost-base approval | Reconciled baseline, end-state design, quotes and assumptions | Approve sustainable earnings range | Material low-confidence cost remains | Commission evidence and defer commitment |
| Funding approval | Separation cash, working capital, liquidity and downside | Approve capital and contingency | Downside breaches minimum headroom | Resize, refinance or delay |
| Day-one readiness | People, systems, controls, contracts and opening balances | Authorise operational cutover | Critical service or control untested | Extend controlled transition |
| TSA exit | Replacement capability, migration and reconciliations | End temporary service | Recipient cannot operate safely | Approve bounded extension and remediation |
| Benefits closure | Verified resource exits and run-rate evidence | Close stranded-cost programme | Savings exist only in forecast | Maintain ownership and reporting |
Original framework. Evidence and thresholds should be adapted to the company, listing venue and jurisdictions.
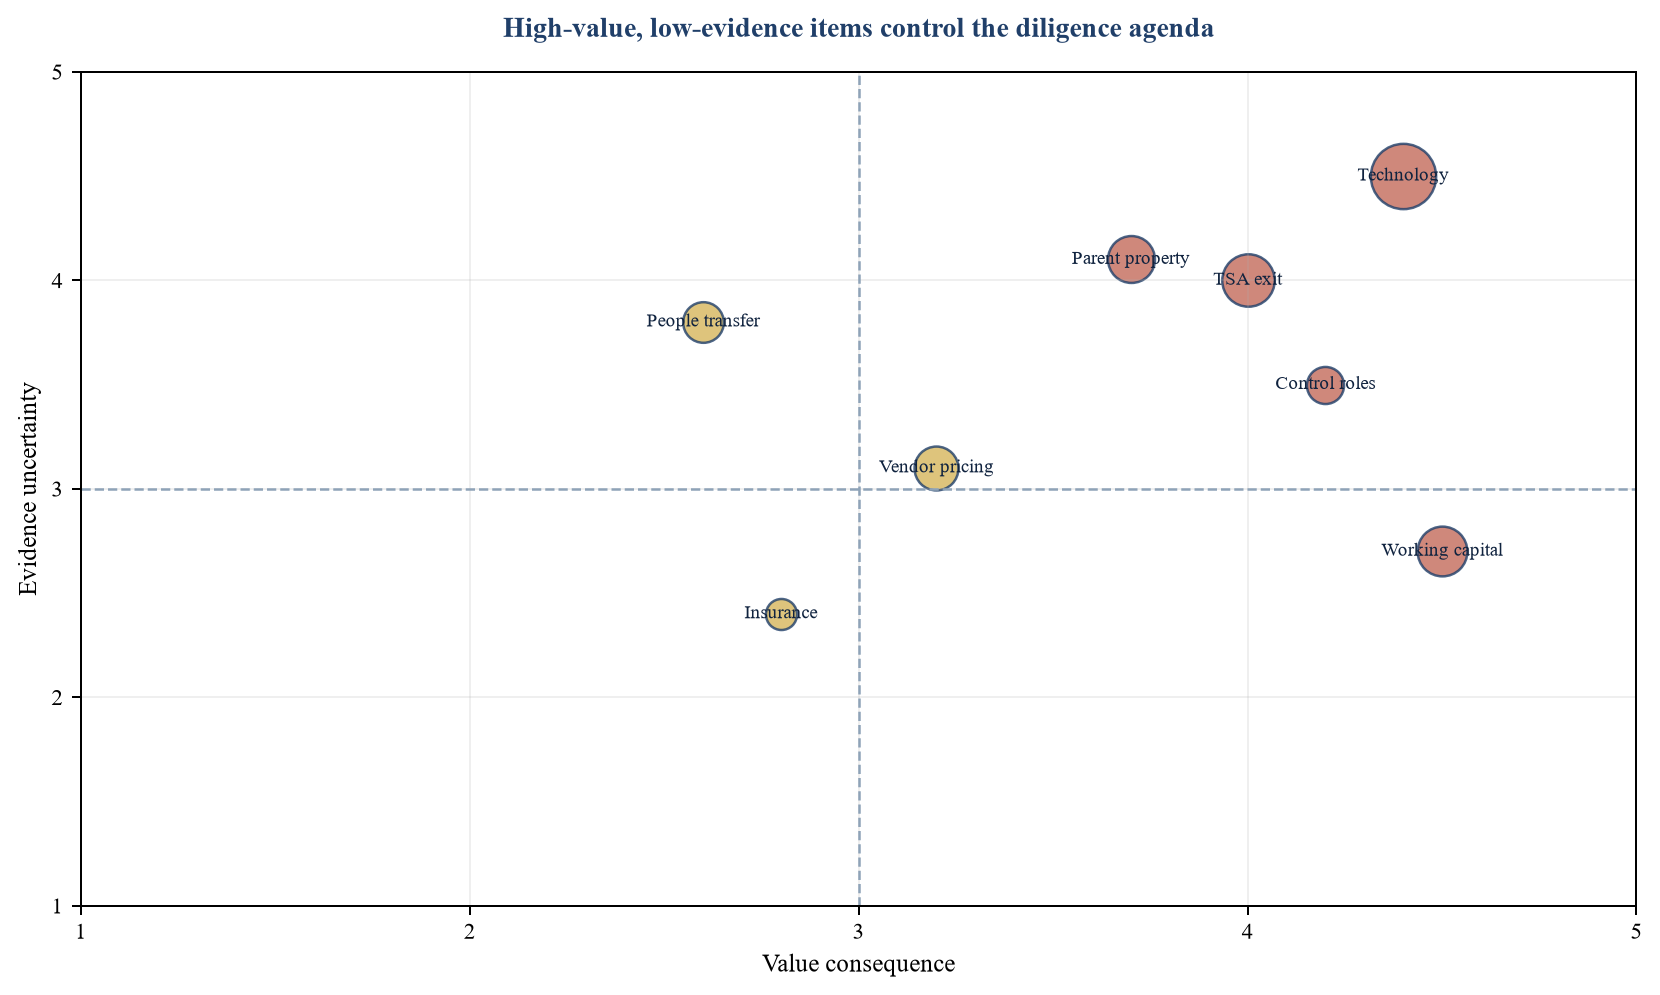
Original framework. Bubble size represents hypothetical value exposure; position and confidence should use company evidence.
23. Implement the cost-base programme
The first phase establishes governance, materiality, perimeter and evidence standards. Finance reconciles the ledger while operating teams build the service catalogue. The programme identifies immediate data gaps, contract deadlines and resources at risk.
The second phase designs the end state. Function leaders define services, controls, people, technology and sourcing. Procurement obtains quotes. Treasury tests liquidity and financing. The parent builds a separate stranded-cost register with resource-level actions.
The third phase validates the model through audit, legal, tax, technology and operational challenge. Management converts placeholders into evidence, runs downside cases and aligns the financial model with transaction documents and disclosure. The board approves ranges and trigger thresholds.
The fourth phase builds and tests capability. Recruitment, procurement, migration, control documentation, opening balances and cutover rehearsals should be tied to readiness gates. TSA services begin only where independent capability is incomplete and continuity requires temporary support.
The fifth phase stabilises operations and exits TSAs. Both companies track service incidents, cost run rate, cash, working capital and action delivery. The parent verifies resource exits. The separated company compares actual service cost and performance with the approved standalone design.
24. Conclusion
A credible demerger cost base begins with activities and resources rather than inherited allocation percentages. Historical allocations remain useful for reconciliation, but they cannot establish the future operating model on their own. Each company needs a cost base connected to its perimeter, obligations, service demand and control environment.
The model should keep six categories separate: transferred direct cost, incremental standalone cost, one-time separation expenditure, TSA cost, parent stranded cost and dis-synergy. Each category has different owners, timing, accounting, cash and valuation consequences. Combining them hides the source of value and weakens accountability.
The hypothetical case shows that a USD 13 million gap between allocation and standalone capability can translate into a much larger valuation difference when a multiple is applied. It also shows that parent value depends on the speed and evidence of stranded-cost removal. These outcomes are assumptions, not forecasts.
Board confidence comes from traceability. A defensible plan reconciles to controlled records, specifies the service and owner behind each cost, distinguishes evidence from assumption, funds the cash path and uses gates for unresolved risks. That discipline turns standalone cost from a transaction adjustment into an executable operating model.
Sources
- US Securities and Exchange Commission, Financial Reporting Manual, Topic 2, carve-out and abbreviated financial statements, last reviewed 29 June 2026, accessed 16 September 2026. Read the primary source
- US Securities and Exchange Commission, Financial Disclosures about Acquired and Disposed Businesses, Article 11 pro forma adjustments, accessed 16 September 2026. Read the primary source
- IFRS Foundation, IFRS 5 Non-current Assets Held for Sale and Discontinued Operations, accessed 16 September 2026. Read the primary source
- IFRS Foundation, IAS 24 Related Party Disclosures, issued standards compilation, accessed 16 September 2026. Read the primary source
- OECD, Corporate Governance Factbook 2025, related-party transaction approval and disclosure, accessed 16 September 2026. Read the primary source
- OECD, Duties and Responsibilities of Boards in Company Groups, published 2020, accessed 16 September 2026. Read the primary source
- Financial Conduct Authority, UK Listing Rules 7, significant transactions and financial information, accessed 16 September 2026. Read the primary source
- Financial Conduct Authority, Primary Market Bulletin 64, board responsibility and investor information for significant transactions, published July 2026, accessed 16 September 2026. Read the primary source
- HM Revenue & Customs, Apply for statutory clearance for a transaction, statutory demergers and reconstructions, published 29 October 2024, accessed 16 September 2026. Read the primary source
- IFRS Foundation, IAS 36 Impairment of Assets, accessed 16 September 2026. Read the primary source
