

1. Define an activist-grade dashboard
An activist-grade board dashboard is a decision system, not a collection of attractive charts. It allows directors to trace each material strategic and capital choice from the original thesis through approved cash, operating milestones, realised outcomes and the next board decision. It gives the board a coherent answer to six questions: where capital went, why it went there, what had to be true, what has happened, what has changed and what management recommends now.
The standard is demanding because a public challenge rarely respects internal reporting boundaries. An activist may connect weak returns from an acquisition, rising capital expenditure, an underperforming division, a repurchase at an unattractive price and poor disclosure into one claim about board judgement. A dashboard built around departmental budgets cannot answer that claim. It must show the portfolio as a whole and the trade-offs among reinvestment, transactions, distributions, debt and resilience.
The dashboard should help the board govern before a campaign emerges. The board determines the strategic objectives, risk appetite, capital priorities and review thresholds. Management supplies the evidence, recommendations and accountable owners. Finance controls definitions and reconciliations. Strategy tests portfolio logic and alternatives. Risk and internal audit assess critical assumptions and controls. The company secretary preserves the decision record. Investor relations identifies recurring external questions without converting market opinion into internal fact.
The result should fit into a short board view supported by drill-down schedules. Compression must preserve decision relevance. A red indicator without the original thesis, cash consequence and proposed action is decoration. A detailed schedule without a clear decision is an archive. The dashboard sits between those failures.
2. Start with the decisions the board must make
Dashboard design should begin with reserved decisions rather than available data. Typical decisions include approving or changing the annual capital envelope, committing to a major project, authorising an acquisition, retaining or selling a business, changing leverage objectives, returning capital, funding remediation and stopping an initiative. Each decision needs a defined cadence, evidence standard and accountable recommendation.
The board should distinguish approval, monitoring and intervention. Approval establishes the thesis, baseline, expected return, downside capacity, milestones and authority. Monitoring tests whether the approved case remains valid. Intervention changes scope, timing, leadership, funding or ownership. A single traffic light cannot serve all three purposes.
Materiality should reflect value and strategic consequence. A project below the normal financial threshold may still warrant board attention when it affects safety, licence, cyber resilience, customer concentration or a critical technology option. Several individually small initiatives may need portfolio treatment when they draw on the same scarce talent or depend on the same platform.
The decision inventory should also reveal omissions. Maintenance, working capital, restructuring and integration are capital choices even when they sit outside the labelled investment budget. Guarantees, leases, vendor finance and contingent consideration can create future claims on cash. The dashboard should capture committed and reasonably foreseeable uses, not only current-period cash expenditure.
| Decision class | Board question | Minimum evidence | Decision output |
|---|---|---|---|
| Portfolio ownership | Are we the best owner and is the business earning its cost of capital? | Strategic contribution, cash return, alternatives, separation reality and buyer evidence | Compound, improve, partner, separate, sell or close |
| Organic investment | Does the project create value under executable demand and delivery assumptions? | Baseline, demand evidence, cash curve, return range, dependencies and stop gates | Approve, stage, rephase or reject |
| Acquisition | Does control create value after price, integration, financing and downside risk? | Standalone case, synergies, funding, integration, sensitivities and alternatives | Bid authority and walk-away conditions |
| Capital return | Is distribution superior to reinvestment, debt reduction and retained flexibility? | Valuation range, liquidity, leverage, pipeline and downside capacity | Dividend or repurchase authority |
| Balance sheet | Does the structure preserve strategy through the downside? | Cash forecast, covenant and rating sensitivities, maturities and contingent claims | Funding, hedging or deleveraging action |
| Remediation | Is value or licence at risk without urgent controlled expenditure? | Exposure, control failure, cash need, operating impact and assurance route | Fund, contain, redesign or exit |
Thresholds are company-specific. The board should define financial and strategic materiality with current legal and financial advice.
3. Establish one capital taxonomy
Companies often describe capital differently across budgets, financial statements, investor presentations and transaction papers. The dashboard needs a single taxonomy that reconciles these views. It should classify cash by economic purpose and decision route, while retaining the accounting treatment needed for external reporting.
A practical taxonomy has seven categories: sustain, comply, improve, grow, transform, transact and distribute. Sustain keeps the current operation reliable. Comply meets legal, safety, environmental or licence requirements. Improve raises productivity or cash conversion. Grow expands proven products, customers or capacity. Transform changes the business model or technology base. Transact covers acquisitions, disposals and integration. Distribute covers dividends and repurchases. Debt reduction and liquidity reserves should be shown beside these categories because they compete for the same cash.
The categories need consistent boundaries. A replacement system may contain maintenance, compliance and transformation components. Management should split material projects into economic work packages where possible. Relabelling maintenance as growth inflates discretionary investment and obscures the cost of sustaining the business. Treating integration as exceptional after every acquisition hides the true transaction return.
Each allocation should carry a persistent identifier from approval through closure. Changes in scope, owner, timing or baseline should not create a new history. The identifier links board papers, contracts, ledger accounts, milestones, forecasts, risks and post-investment reviews. This lineage is the foundation for credible aggregation.
4. Build metric lineage before selecting indicators
The dashboard should include only measures that can be defined, sourced, reconciled and owned. The SEC's guidance on key performance indicators in MD&A emphasises clear definitions, calculation methods, reasons for usefulness and disclosure of material changes. [1] The revised IFRS Management Commentary Practice Statement treats metrics as measures used to monitor quantitative or qualitative aspects of performance or position and focuses on information material to investors' assessment of value creation and cash generation. [2] These principles also improve internal board reporting.
Every dashboard metric needs a metric card. The card records the definition, purpose, owner, source system, population, formula, unit, frequency, baseline, target, tolerances, adjustments, control, assurance status and external-use restrictions. It also explains how the measure connects to cash, risk or strategic value.
The lineage should reach the underlying transaction or operating record. A reported project return may depend on allocated revenue, avoided cost, implementation spend and working capital. Each component requires a source and a counterfactual. A margin improvement that results from product mix differs from one caused by price or cost action. A revenue increase acquired through a transaction differs from organic growth. The dashboard should show those distinctions when they affect the decision.
Changes require governance. A legitimate definition refinement should be recorded with the effective date, reason and comparable history where practicable. Silent changes destroy trend integrity. Finance should maintain the dictionary, while operating owners remain responsible for source data and explanations.
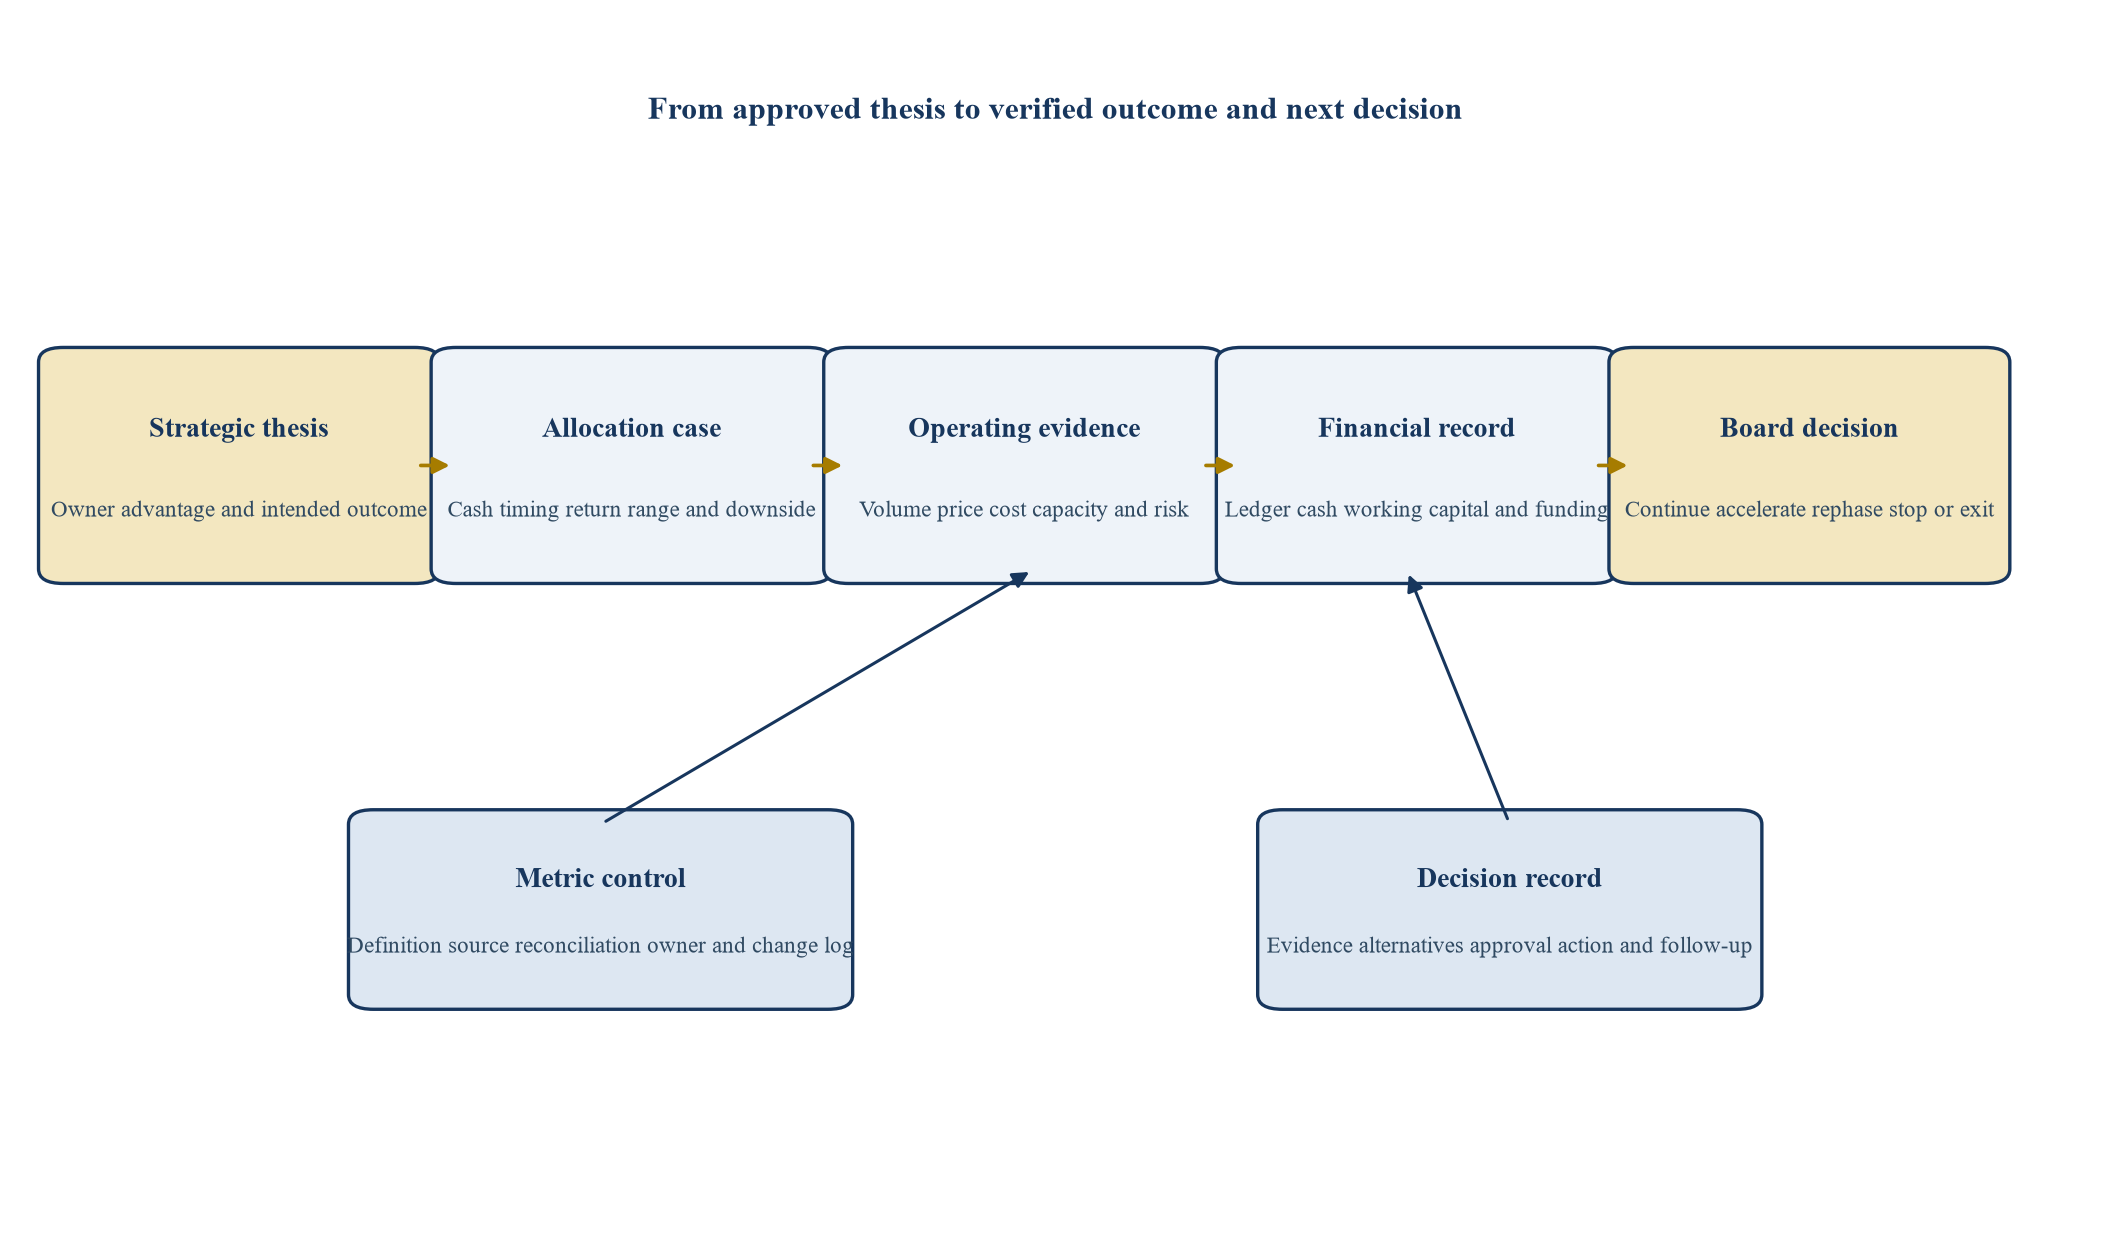
The architecture connects strategic intent to cash and board decisions. Each company should adapt systems, controls and assurance responsibilities.
5. Preserve the original thesis and counterfactual
Post-investment review is unreliable when the original thesis is reconstructed after results are known. The dashboard should preserve the approved case, including assumptions, alternatives and reasons. Subsequent forecasts sit beside that case. They do not replace it.
Every material allocation needs a counterfactual. For organic investment, the comparison may be no action, a smaller staged programme, outsourcing or an alternative project. For an acquisition, it may be organic development, a commercial partnership, a minority investment or no transaction. For a repurchase, it includes debt reduction, investment and retained liquidity. The counterfactual should use the same horizon and risk treatment as the recommended case.
The original thesis should separate management-controllable drivers from external conditions. Management may control implementation cost, staffing, pricing execution and milestone discipline. It cannot control market interest rates, commodity prices or competitor action, although it can prepare for them. Performance review should distinguish delivery variance from environmental variance without excusing weak preparation.
The dashboard should record what would invalidate the thesis. Examples include demand below a stated floor, implementation cost above a cap, inability to secure a permit, loss of a key customer or failure to achieve a technical milestone. An invalidated thesis triggers a decision. It should not merely change the colour of a chart.
6. Reconcile strategy to cash
Strategic narratives become credible when they reconcile to cash. The dashboard should bridge revenue and operating milestones to EBITDA, working capital, capital expenditure, tax, financing and distributable cash. It should show when cash leaves, when benefits begin and how much liquidity remains through the downside.
Run-rate benefits should not be treated as realised cash. A programme can claim an annualised saving while cash remains negative because implementation costs precede benefits, working capital absorbs growth or the benefit arrives late. Acquisitions require purchase price, fees, financing, integration, restructuring and retained liabilities. Divestitures require tax, separation, stranded cost, debt repayment and transition expenditure.
The bridge should use the board's capital taxonomy. This makes trade-offs visible. A USD 100 million repurchase may reduce cash available for a high-return expansion or for covenant protection. A growth project may have an attractive steady-state return and still create an unacceptable liquidity trough. Capital discipline concerns both value and survivability.
The board should see cash at project, business and group levels. Project cash tests the investment thesis. Business cash shows portfolio contribution. Group cash incorporates debt, tax, central costs, distributions and shared investment. All three are needed for capital allocation.
7. Use returns that reflect the decision
No single return measure is adequate for every decision. The dashboard can use net present value, internal rate of return, return on invested capital, cash payback, economic profit and value at risk where appropriate. The measure should match the cash pattern and decision purpose.
Return on invested capital is useful for portfolio monitoring when the numerator and capital base are consistently defined. It can mislead during construction, after large impairments or when intangible investment is expensed. Internal rate of return can overstate attractiveness where scale differs or interim cash is assumed to be reinvested. Payback ignores value after the cutoff. Net present value depends on the discount rate, terminal assumptions and scenario weights.
The dashboard should therefore show a compact return set and the primary value drivers. For a capacity project, these may be utilisation, unit contribution, build cost and ramp time. For an acquisition, they may be standalone growth, synergies, integration cost, retention and exit multiple. For a repurchase, they include purchase price, funding, alternative uses and future cash needs.
Targets should be ranges linked to uncertainty. A precise 14.2 per cent return built on uncertain demand creates false confidence. The board benefits more from a central range, a downside and the variables that move the result. Confidence in evidence should sit beside the return, not be buried in an appendix.
8. Analyse allocations by cohort and vintage
Portfolio averages can conceal weak decisions. Cohort analysis groups allocations by decision date, strategy, business, type or sponsor and follows them through a common maturity curve. It reveals whether recent acquisitions integrate faster, whether transformation programmes reach adoption or whether a business repeatedly misses original cases.
Vintage analysis should respect maturity. A project approved six months ago should not be judged against the steady-state return expected in year four. It should be assessed against current milestones, cash and leading indicators. Mature projects can be assessed against realised returns, durability and the original counterfactual.
The board should inspect selection and survivorship effects. Closed projects must remain in the history. Removing failed initiatives improves the reported average while destroying learning. Acquired businesses that are reorganised should retain enough lineage to test the transaction case. Benefits transferred to another division should be reconciled rather than counted twice.
Cohorts also support resource decisions. If a sponsor has five simultaneous programmes drawing on the same finance, technology and change teams, each project may appear feasible while the portfolio is not. The dashboard should show constrained capabilities and aggregate dependencies.
9. Design leading and lagging indicators
Lagging indicators confirm economic outcomes. Leading indicators show whether the mechanism is working early enough to act. A credible dashboard combines them. Revenue, margin, cash and return are lagging outcomes. Pipeline conversion, customer adoption, production yield, milestone completion, staff readiness and permit progress may lead them.
Each leading indicator should have a causal connection to the outcome. Activity measures such as meetings held or tasks completed can create volume without evidence. The board should ask whether a change in the indicator reasonably predicts value, risk or cash. Where that relationship is untested, the dashboard should say so.
Milestones should represent achieved states, not elapsed dates. A technology platform is not complete because the implementation period ended. Completion may require tested functionality, migrated users, accepted controls, stable performance and retired legacy cost. An acquisition is not integrated because a programme office closed. It should have customer, people, process, system, control and synergy evidence.
The dashboard should distinguish threshold breaches from trend concerns. A covenant forecast below a floor requires immediate escalation. A declining conversion rate may require investigation before a formal breach. Both need an owner and action, while their urgency differs.
| Value question | Leading evidence | Lagging evidence | Board trigger |
|---|---|---|---|
| Is demand materialising? | Qualified pipeline, contracted volume, adoption and retention | Revenue, contribution and cash receipts | Rephase capacity or change commercial route |
| Is delivery controlled? | Design maturity, permits, procurement, staffing and tested releases | Cost, schedule, defects and cash variance | Reset scope, leadership or funding |
| Are acquisitions creating value? | Retention, integration gates, cross-sell and system migration | Synergy cash, acquired margin, return and impairment | Accelerate integration, repair or exit |
| Is the portfolio earning its place? | Strategic contribution and improvement milestones | Cash return, economic profit and valuation evidence | Compound, partner, separate or sell |
| Is the balance sheet resilient? | Liquidity forecast, maturities and covenant headroom | Net debt, interest cover and realised funding cost | Preserve cash, refinance or deleverage |
| Is disclosure supportable? | Metric controls, reconciliations and evidence confidence | Corrections, control findings and investor comprehension | Remediate, assure or change disclosure |
The table shows measure classes rather than mandatory indicators. Definitions and thresholds require company-specific approval.
10. Connect the dashboard to portfolio ownership
Portfolio reporting should test whether the company creates more value as owner than credible alternatives. The dashboard should show strategic contribution, economic contribution, ownership advantage, improvement potential and separation feasibility for each material business.
Strategic contribution may include customer access, technology, data, licences, supply security or shared capabilities. These benefits need evidence and allocation discipline. A claimed synergy that cannot be observed, owned or tested should not automatically justify retention. Economic contribution includes sustainable cash return, growth, risk and capital intensity. Separation feasibility includes tax, debt, pensions, contracts, people, systems, stranded cost, permits and timing.
The board should avoid forcing every business into an immediate sell-or-keep answer. Some require an improvement period with defined milestones. Others may suit a joint venture or minority capital. The dashboard can use five routes: compound, improve, partner, separate and exit. Each route has a thesis, milestone window and decision date.
External valuation is relevant and incomplete. Trading multiples and transaction evidence need normalisation for growth, margin, capital intensity, geography, control, liquidity and cycle. The board should compare value under current ownership with net distributable value after separation, tax, debt and execution risk.
11. Govern acquisitions through the full lifecycle
Acquisition discipline often weakens after signing. The dashboard should begin with the pre-deal thesis and continue through diligence, approval, signing, closing, integration and post-investment review. The same value drivers should survive each stage.
The approval case should separate standalone value, control value, cost synergies, revenue synergies, tax, financing, integration and optionality. It should show price and value independently. A strategically attractive target can still be a poor acquisition at the proposed price. A transaction with modest headline synergies can create value through cash improvement, asset quality or strategic access.
At closing, the dashboard should update only facts that have changed. The original case remains visible. Integration milestones should be linked to benefit owners and cash. Revenue synergy requires customer-level evidence and should not be recognised merely because sales teams were combined. Cost synergy requires removal of cash cost and treatment of implementation expense.
Post-investment review should occur at defined maturities, such as twelve, twenty-four and thirty-six months, adapted to the business. It should compare actual and forecast outcomes to the approved case, isolate price and market effects, examine missed diligence signals and record lessons for future transactions.
12. Govern organic growth and transformation
Organic investment can escape transaction-level scrutiny because expenditure is distributed across departments and periods. The dashboard should aggregate related work into an economic programme. Product development, commercial launch, systems, hiring, working capital and capacity may form one value case even when accounting treatment differs.
Stage gates reduce irreversible commitment before evidence improves. Discovery tests the problem and customer. Validation tests technical and commercial feasibility. Scale commits larger capital after demand, delivery and unit economics are credible. Each gate should specify evidence, maximum cumulative spend and the next decision.
Transformation programmes need a baseline that reflects the operation before intervention. Benefits should be net of disbenefits, revenue leakage, duplicated cost, change capacity and ongoing run cost. Technology delivery should be linked to adoption, process change, control and retired legacy cost. A completed system with low use is an output, not a realised benefit.
The dashboard should identify option value. Early-stage investment may purchase information or preserve a route rather than generate immediate return. The board should define the cost of the option, the evidence it seeks and the point at which further commitment requires a new case.
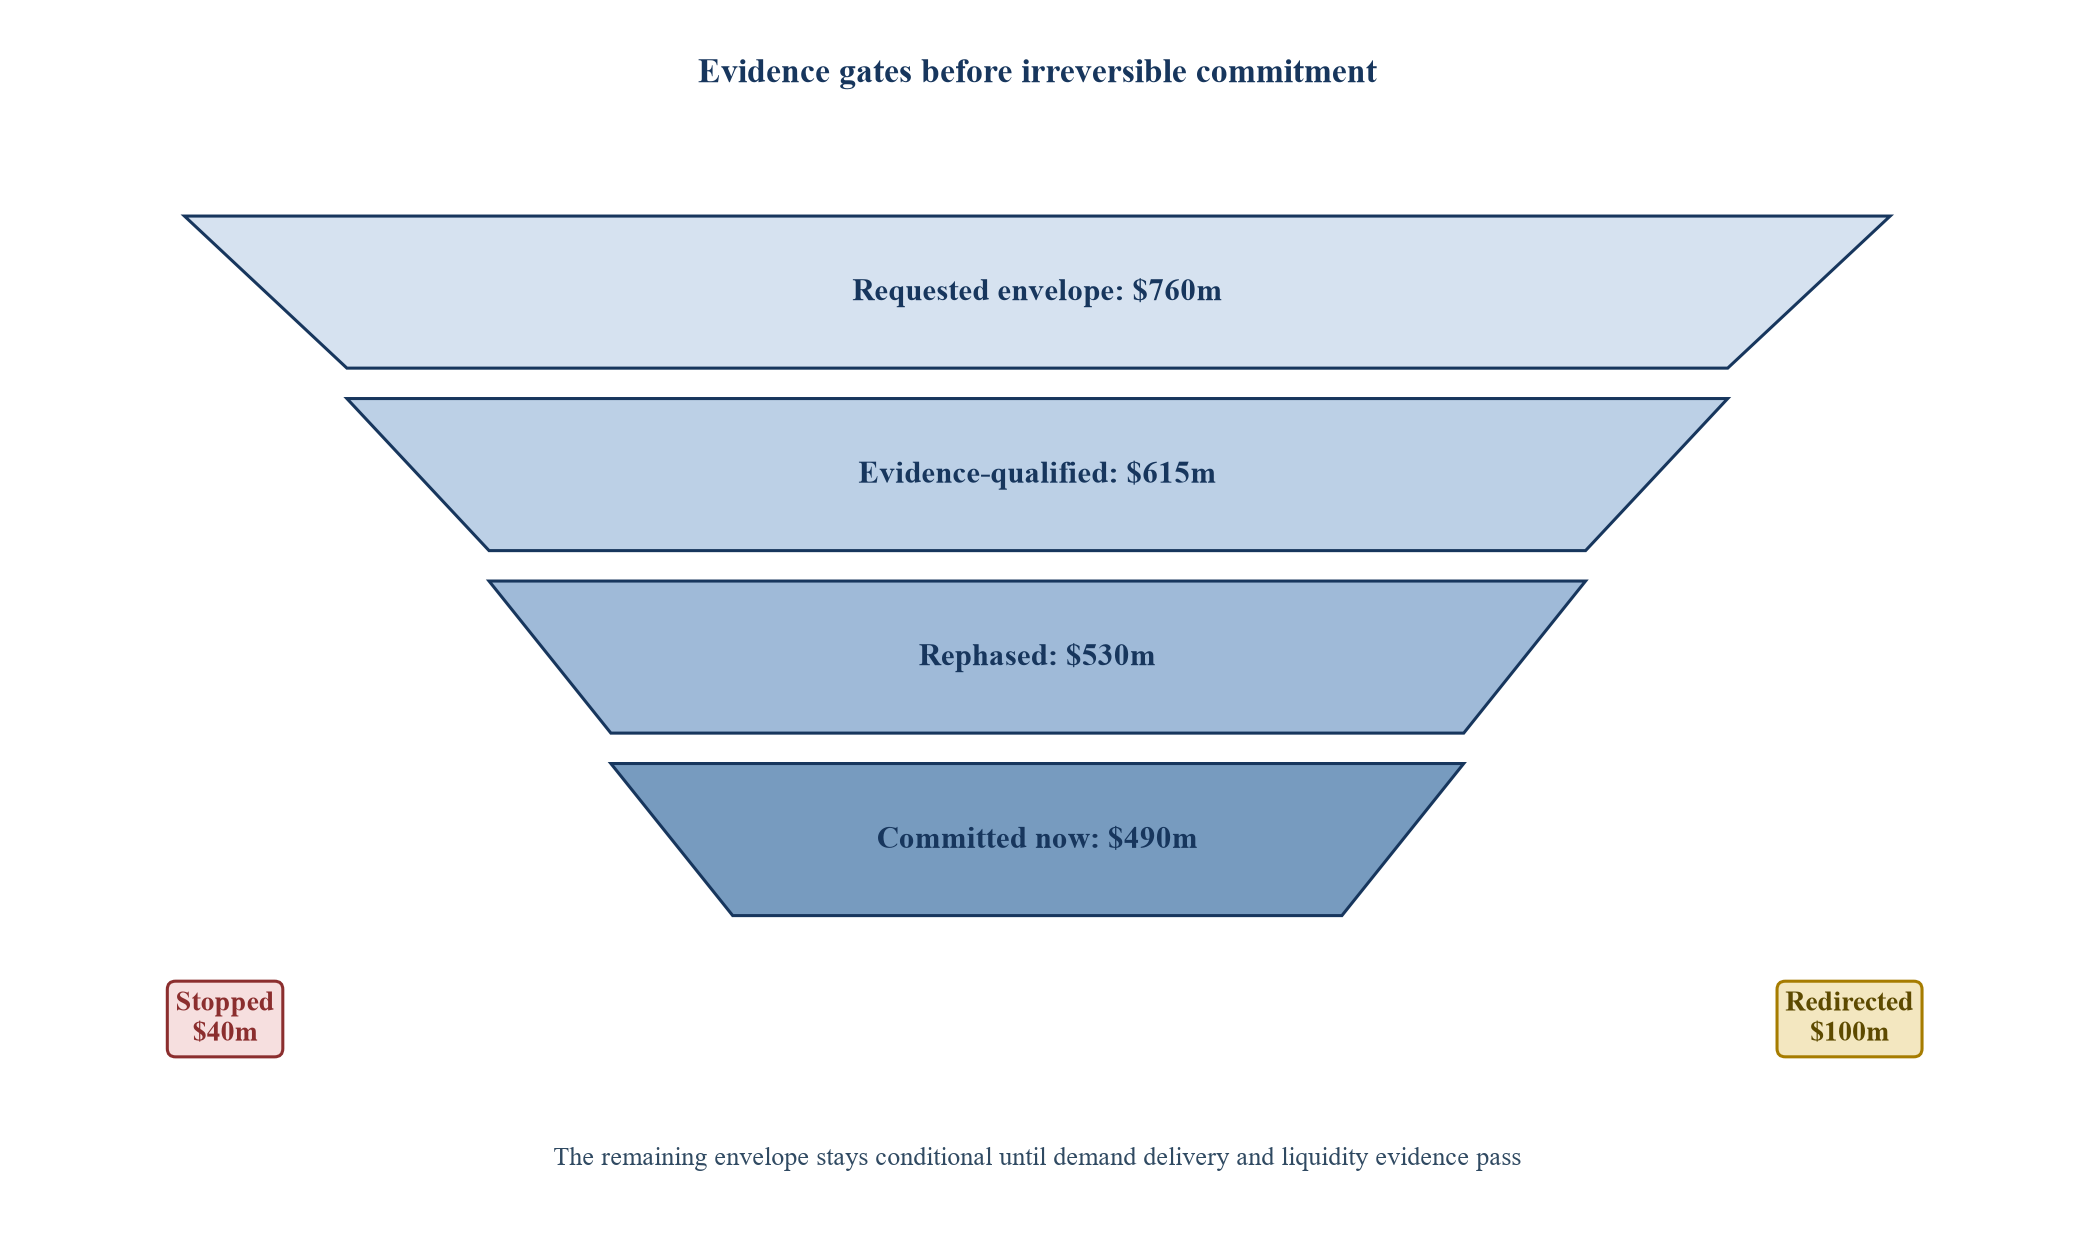
The funnel is a management framework. Amounts in the worked case are scenario assumptions in USD millions.
13. Test distributions against opportunity and resilience
Dividends and repurchases should be assessed within the complete capital hierarchy. The board needs to compare them with organic investment, acquisitions, debt reduction, pensions, working capital, resilience and retained optionality. The comparison should use current valuation and downside liquidity.
A repurchase can create value when shares are purchased below a supportable intrinsic-value range and the company retains strategic and financial capacity. It can destroy value when executed at an inflated price, funded imprudently or used to offset weak operating performance. The dashboard should show average purchase price, shares retired, cash used, alternative uses, leverage effect and current value range.
Dividend policy should distinguish base distribution from variable surplus. A progressive commitment may support shareholder expectations and constrain flexibility. The board should understand cash coverage through the cycle, not only in the current year. A distribution should not depend on optimistic working-capital release or an uncommitted disposal.
The SEC's reporting regime and public-company filings show that issuers commonly describe repurchase authorisations, execution and other uses of capital. [3] The dashboard provides the internal evidence needed for accurate disclosure and disciplined decisions. Current securities, solvency and market-abuse advice remains essential.
14. Integrate risk, resilience and material controls
Return without resilience is an incomplete decision. The dashboard should connect each material allocation to principal risks, risk appetite, controls and liquidity. It should show both risk reduction achieved by an investment and risk created by execution.
The UK Corporate Governance Code 2024 asks boards within scope to monitor and review risk management and internal control, including material financial, operational, reporting and compliance controls. Provision 29 applies for financial years beginning on or after 1 January 2026. [4] The accompanying FRC guidance focuses on evidence, monitoring, failings, near misses and the quality of information reaching the board. [5] These ideas are relevant to dashboard design beyond the Code's formal scope.
Each critical dashboard measure should have proportionate control. High-risk metrics may need independent reconciliation or internal audit review. Management judgement should be visible. The board should know where evidence is provisional, where systems cannot produce the measure reliably and where a control failure affects the decision.
Resilience scenarios should combine risks. Demand weakness, cost inflation, delay and refinancing pressure may occur together. The dashboard should show liquidity troughs, covenant headroom, operational minimums and actions available. The purpose is preparation and decision quality, not prediction.
15. Build an explicit downside and response ladder
A downside case should be plausible, specific and connected to action. Percentage reductions applied uniformly across a model can miss the operating mechanism. The team should identify how demand, price, cost, working capital, delivery, financing and portfolio actions interact.
The response ladder defines actions before the downside arrives. Early measures may include hiring restraint, discretionary-spend control and staged capital. Stronger measures may include asset sales, covenant engagement, equity, dividend change or a strategic transaction. Each action should show lead time, cash effect, dependencies, reversibility and stakeholder consequence.
The board should identify protected expenditure. Safety, legal compliance, critical maintenance, cyber resilience and licence conditions may remain necessary under stress. Treating every budget line as equally reducible overstates flexibility. Contractual commitments, severance and cancellation costs also limit rapid action.
Scenario probabilities should be used carefully. The dashboard can present discrete cases without asserting a statistical probability where evidence is weak. The board should understand sensitivity to the variables that matter and the point at which action becomes necessary.
| Capital use | Initial envelope | Evidence-qualified now | Rephased or stopped | Redirected allocation | Revised current commitment |
|---|---|---|---|---|---|
| Maintenance and compliance | 145 | 140 | 5 | 15 | 155 |
| Organic growth | 180 | 145 | 35 | 30 | 175 |
| Transformation | 135 | 90 | 45 | 10 | 100 |
| Acquisitions and integration | 120 | 75 | 45 | 0 | 75 |
| Debt reduction | 70 | 70 | 0 | 35 | 105 |
| Dividends | 70 | 70 | 0 | 0 | 70 |
| Repurchases | 40 | 25 | 15 | 10 | 35 |
| Total | 760 | 615 | 145 | 100 | 715 |
All amounts are scenario assumptions in USD millions. The reset demonstrates method and is not a recommendation for any company.
16. Create decision gates and escalation rules
Every material dashboard item should lead to a defined decision. The core choices are continue, accelerate, rephase, repair, stop, partner, sell and close. Management should recommend one route and explain why. The board should see the alternative routes and the cost of delay.
Thresholds should be agreed at approval. A cost overrun, milestone delay, demand shortfall, control failure or liquidity reduction can trigger escalation. Thresholds may be absolute, relative or qualitative. A safety failure may require immediate action regardless of financial amount. A small variance may matter when it invalidates the mechanism behind the case.
Escalation should include timing and authority. Management may correct a variance within delegated tolerance. A thesis breach returns to the board. The company secretary or programme office maintains the decision calendar. Repeated waivers should prompt a case reset rather than endless tolerance changes.
The dashboard should show open decisions and ageing. An unresolved choice can destroy value even when reported as amber. The cost of delay may include lost market access, duplicated spend, employee attrition, financing cost or reduced transaction certainty.
17. Use a controlled board scorecard
The top-level dashboard should be concise enough for focused discussion and complete enough to support judgement. A useful structure has four lenses: portfolio value, capital delivery, resilience and evidence quality. Each lens contains a limited set of measures connected to decisions.
Portfolio value can include sustainable cash return, ownership route, strategic contribution and external valuation evidence. Capital delivery can include committed cash, forecast outturn, milestone status and realised return. Resilience can include liquidity, leverage, operational minimums and risk exposure. Evidence quality can include metric control, confidence, assurance and unresolved reconciliation.
Colour should be generated by approved rules and accompanied by direction. A green metric can deteriorate. An amber metric can improve. The board needs current status, trend, threshold, forecast and action. Narrative should explain the few changes that matter.
The scorecard should retain exceptions. Aggregation can hide a material weak item. Directors should be able to drill into any major programme, business or transaction. The dashboard pack should include a change log, open decisions and evidence limitations.
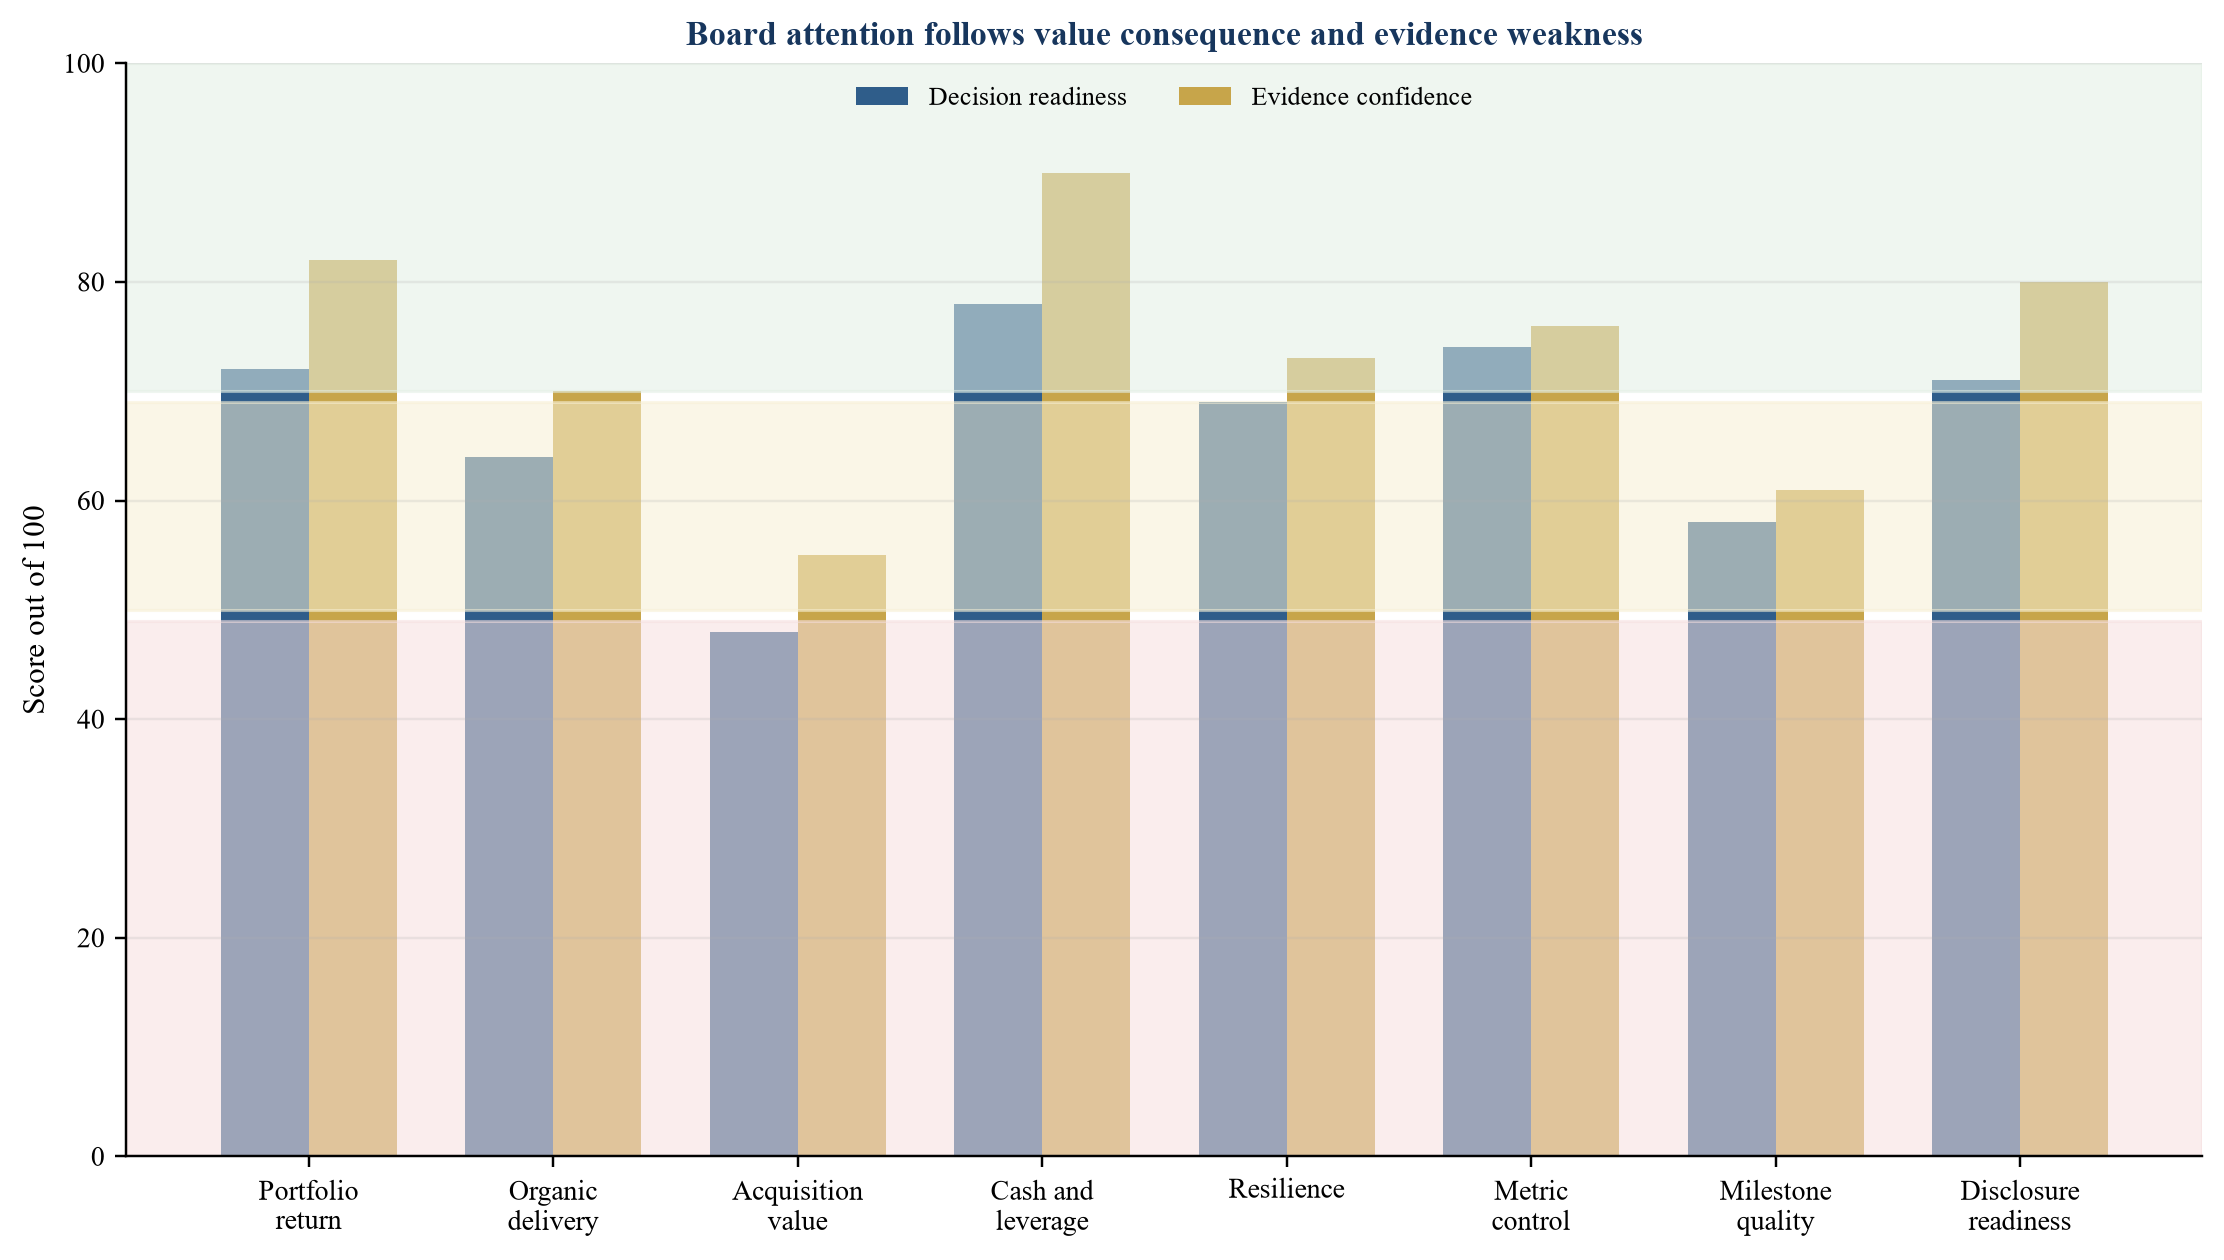
Scores and exposures are scenario assumptions. Evidence confidence is a management assessment requiring documented support.
18. Calibrate external disclosure and engagement
The internal dashboard will usually contain more detail than external reporting. The company should define which metrics support public disclosure, which remain commercially sensitive and which require additional control or assurance. Internal use does not remove securities-law obligations where information becomes material.
The G20/OECD Principles emphasise timely, reliable and comparable information that enables investors to assess performance, management and securities. [6] SEC MD&A guidance seeks material analysis through management's perspective and addresses definitions and changes in key metrics. [1] The revised IFRS Management Commentary framework focuses on connected information about business model, strategy, resources, risks, external environment and financial performance. [2] Together, these sources support a dashboard whose internal logic can withstand external scrutiny.
Investor engagement should test comprehension and evidence gaps. It should not become selective guidance or a negotiation of operational targets. The company should record questions, themes and commitments, then decide through its disclosure controls whether broader communication is required.
Public targets need the same lineage as internal targets. The board should understand baseline, perimeter, timing, dependencies and downside. Changes should be explained. Repeated target resets without a clear bridge undermine accountability.
Primary proxy materials illustrate the intensity of external claims. Trian's 2024 Disney materials addressed board oversight, succession, profitability, free cash flow and return expectations for major investment. [7] Southwest and Elliott filings connected governance, operating performance and leadership, followed by a cooperation agreement and board changes. [8] [9] Norfolk Southern's 2024 contest materials connected operations, service, safety and strategy. [10] These filings represent the parties' stated positions. They demonstrate why boards need source-controlled evidence and a balanced decision record.
19. Allocate governance and assurance responsibilities
The full board owns strategy and capital allocation. Committees can deepen review within their mandates. The audit committee may oversee metric controls, reporting and assurance. The risk committee may review risk appetite, resilience and material control. The remuneration committee may connect incentives to controllable long-term outcomes. The nomination committee may assess whether board capabilities match the portfolio and strategic agenda.
Management responsibilities should remain clear. The chief executive sponsors the strategic portfolio. The chief financial officer controls the capital model, definitions and reconciliations. Business leaders own delivery and source evidence. Strategy tests alternatives and portfolio logic. Risk challenges downside and control. Internal audit provides independent assurance where prioritised. Investor relations provides external context and controls engagement records with legal and company secretariat.
Assurance should be risk based. A high-value acquisition synergy measure may justify transaction-level testing. A new non-financial metric intended for public disclosure may require design and operating-effectiveness review. A mature low-risk measure may rely on established controls. The dashboard should state the assurance status rather than imply uniform certainty.
The board should periodically review the dashboard itself. Measures can outlive their usefulness, incentives can distort behaviour and new risks can emerge. The test is whether the dashboard improves decisions, supports accountability and reveals adverse developments early enough to act.
20. Apply the framework to the hypothetical group
The hypothetical group has USD 5.40 billion of revenue, USD 620 million of EBITDA, USD 1.35 billion of net debt and an assumed enterprise value of USD 6.75 billion. The annual capital envelope is USD 760 million. Management initially presents the envelope by accounting category. The board rebuilds it by economic purpose, persistent allocation identifier and decision route.
The evidence review identifies USD 145 million requiring action. A transformation programme includes USD 30 million without a tested adoption route and USD 15 million dependent on an unapproved data migration. An acquisition pipeline contains USD 45 million of reserved integration and advisory capacity without a board-approved target. Organic growth includes USD 35 million whose demand evidence has weakened. Repurchases include USD 15 million that would reduce downside liquidity below the board's preferred floor. Maintenance contains USD 5 million that can be rephased without increasing operational exposure.
The board stops USD 40 million, rephases USD 85 million and holds USD 20 million pending evidence. It redirects USD 100 million: USD 35 million to debt reduction, USD 30 million to customer-backed growth, USD 15 million to critical maintenance, USD 10 million to transformation controls and USD 10 million to opportunistic repurchases within a valuation and liquidity gate. The revised current commitment is USD 715 million, with the difference retained as conditional capacity.
The dashboard also changes the decision cadence. Four high-consequence programmes move to monthly evidence gates. Portfolio businesses receive compound, improve, partner, separate or exit routes with six-month milestones. Acquisitions retain their original approval cases and begin cohort reporting. Repurchases require a current value range, alternative-use comparison and post-execution review.
The scenario model tests revenue, margin, working capital, investment and financing together. The central case generates USD 410 million of post-investment free cash flow before distributions. The adverse case generates USD 165 million. The severe case produces a USD 35 million cash deficit before the response ladder. The rephased capital plan and debt reduction improve the severe case by USD 120 million, producing USD 85 million of positive cash before distributions. These amounts are assumptions.
| Allocation | Approved cash | Forecast cash | Evidence confidence | Current finding | Recommended decision |
|---|---|---|---|---|---|
| Customer-backed capacity | 95 | 88 | 82 | Contracted demand supports staged build | Continue with utilisation gate |
| Digital transformation | 120 | 138 | 48 | Adoption and migration evidence incomplete | Rephase and repair controls |
| Prior acquisition integration | 70 | 84 | 61 | Cost synergy on track; revenue synergy weak | Continue cost route and reset revenue case |
| New acquisition reserve | 45 | 45 | 25 | No approved target or executable case | Stop reserve; return to central capacity |
| Repurchase programme | 40 | 25 | 76 | Attractive only within valuation and liquidity bands | Continue conditionally |
| Debt reduction | 70 | 105 | 94 | Improves severe-case capacity and refinancing options | Accelerate |
| Legacy product line | 35 | 42 | 57 | Negative cash return and low strategic contribution | Prepare partner or exit decision |
| Critical maintenance | 145 | 155 | 88 | Reliability risk supports selected acceleration | Accelerate priority packages |
Amounts and scores are scenario assumptions. Evidence confidence is scored from zero to one hundred for demonstration.
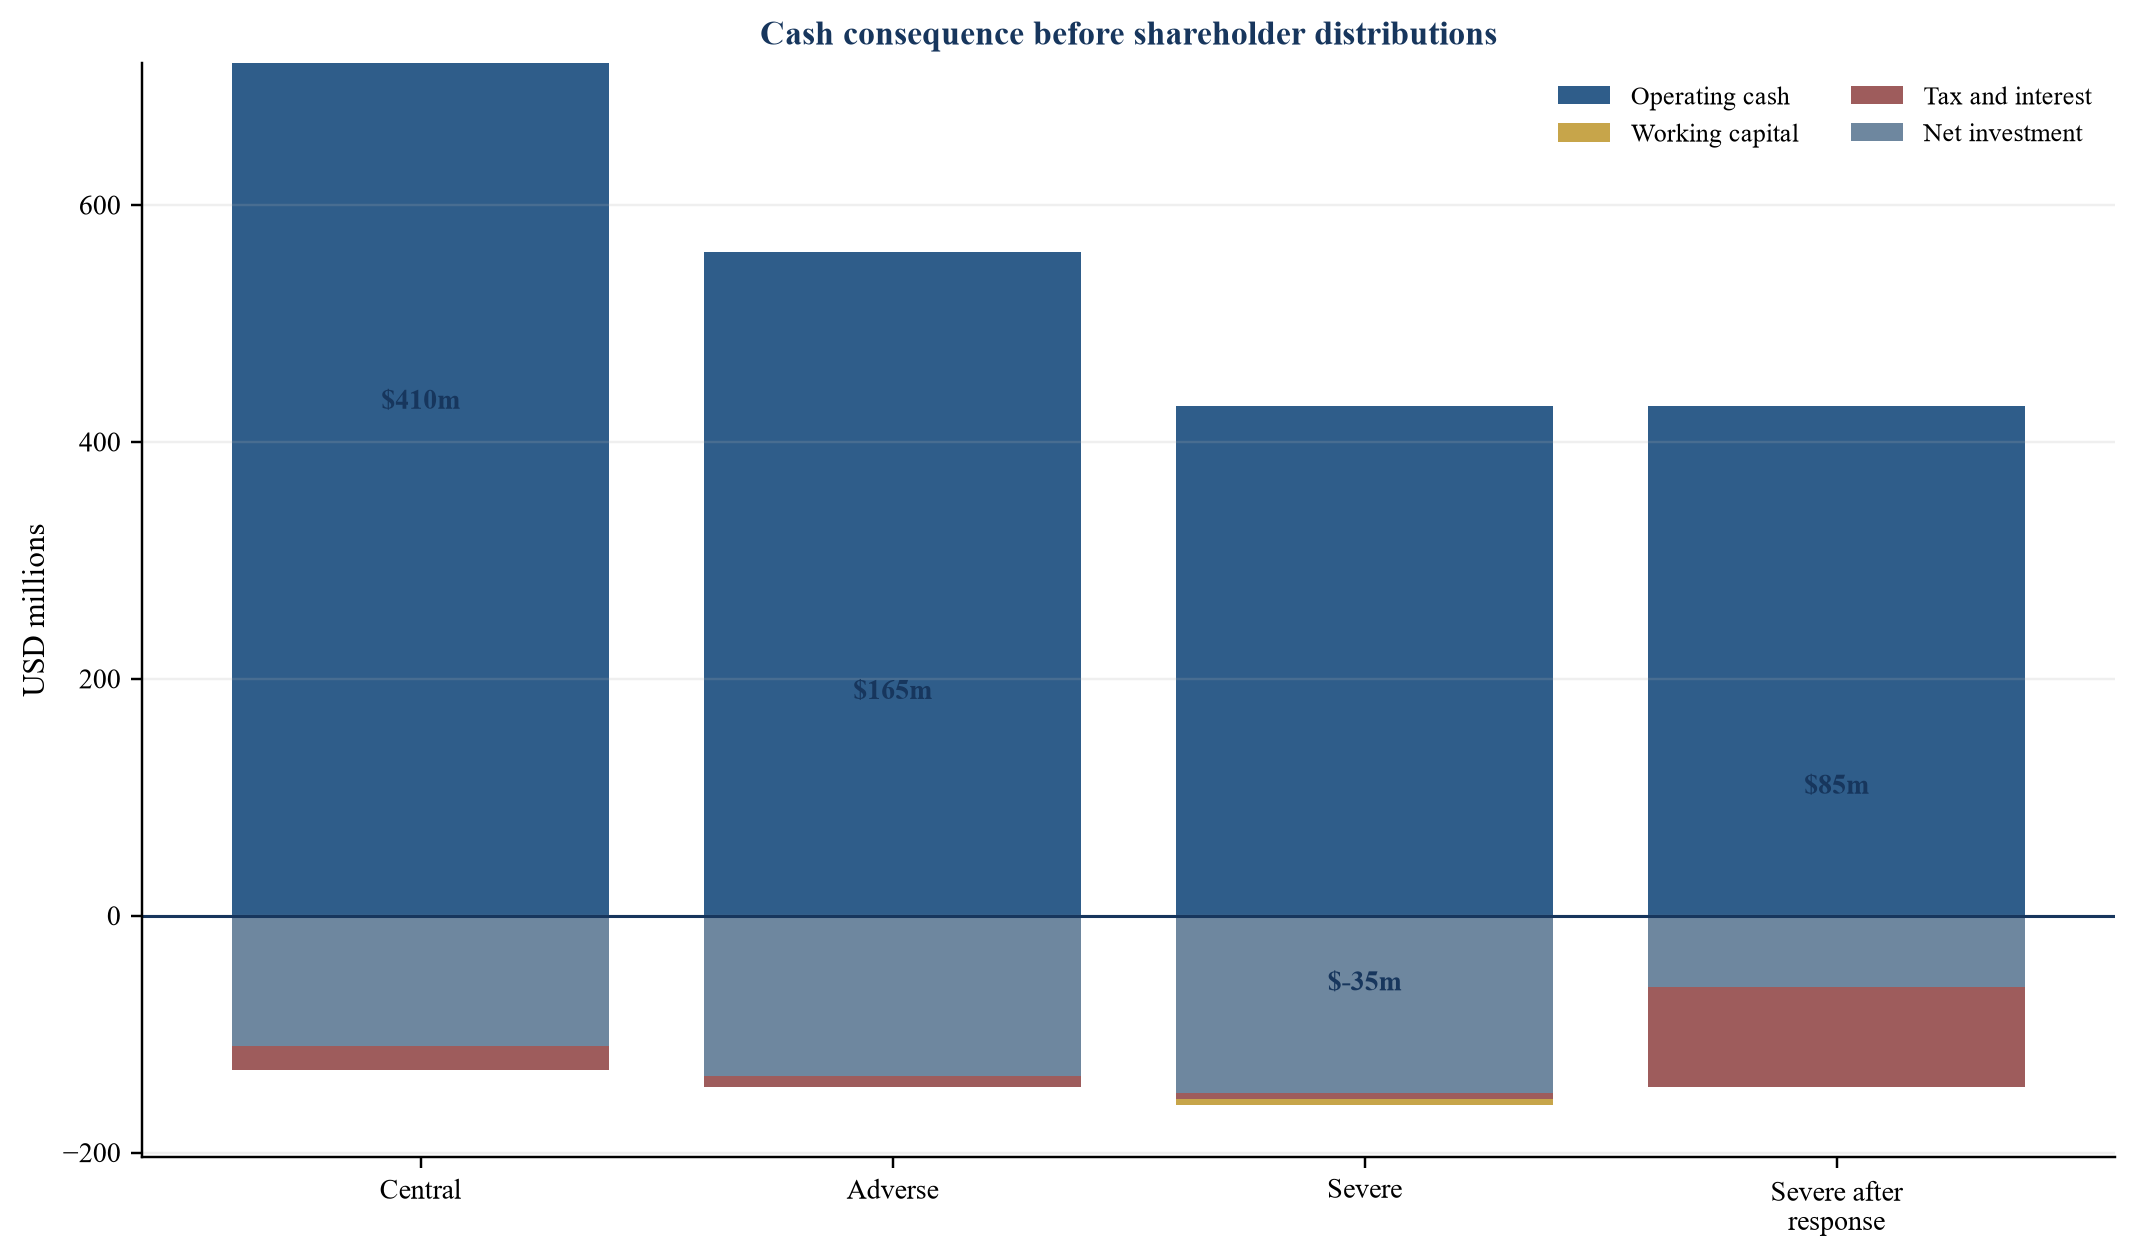
All amounts are scenario assumptions in USD millions. The revised plan reflects rephasing, stopping and redirection before distributions.
21. Implement in ninety days
The first thirty days should define decisions, owners and evidence. The board approves scope, materiality and reserved matters. Finance creates the capital taxonomy and metric dictionary. Strategy maps the portfolio and major allocation cases. Risk identifies critical assumptions and controls. The programme team preserves original approval papers and reconciles current commitments.
Days thirty-one to sixty build the controlled dashboard. The team creates metric cards, links source systems, constructs cash bridges, defines cohorts and sets escalation thresholds. It selects a small number of high-consequence allocations for a pilot. Internal audit or another independent function tests priority lineage and controls.
Days sixty-one to ninety embed governance. The board uses the dashboard in a live decision cycle. Committees align their reviews, management closes evidence gaps and investor relations tests whether external reporting explains the same value drivers. The company records decisions, actions and unresolved limitations.
Implementation should avoid a large technology programme at the outset. A controlled data model, disciplined definitions and clear ownership matter more than visual sophistication. Automation can follow once the decision architecture is stable. Technology should reduce reconciliation effort and improve traceability; it should not conceal weak definitions.
The first formal review should ask whether the dashboard changed a decision, revealed an exposure, accelerated action or stopped poor capital. If it did none of these, the design likely reports activity without governing value.
22. Recognise limitations
The framework cannot determine the correct strategy or replace directors' judgement. Metrics simplify reality and can create incentives to optimise the measure rather than the underlying outcome. Forecasts remain uncertain. Valuation ranges depend on assumptions and market conditions. Evidence confidence is a governed assessment, not an objective probability.
Company circumstances differ by sector, ownership, jurisdiction, maturity and capital intensity. Regulated utilities, banks, technology platforms, resource companies and early-stage businesses require different measures and thresholds. Current legal, accounting, tax, regulatory, valuation and industry advice remains necessary.
Public disclosure creates additional obligations and constraints. The board must consider materiality, selective disclosure, market abuse, forward-looking information, non-GAAP measures and local reporting requirements. An internal dashboard should support accurate disclosure without becoming a promise that the company cannot substantiate.
Activist materials and company responses are advocacy documents. They can identify relevant questions and public evidence while presenting contested interpretations. The dashboard should test propositions independently and record contradictory evidence.
The worked case is hypothetical. It demonstrates mechanics and does not provide a benchmark for spending, return, leverage, scoring or board action. Each amount, threshold and outcome requires company-specific evidence.
23. Conclusion
An activist-grade board dashboard turns capital allocation from a sequence of approvals into a controlled system of value decisions. It preserves the original thesis, connects operating evidence to cash, compares alternatives, exposes downside, defines intervention gates and records the board's reasons. It allows directors to assess the portfolio, organic investment, acquisitions, distributions and balance sheet through one coherent lens.
The strongest dashboard is selective. It concentrates on decisions with material value or strategic consequence. Every metric has a definition, source, owner and control. Every allocation has a counterfactual, cash curve and review gate. Every exception leads to an accountable action.
This discipline improves governance before activism emerges. It also equips the board to engage credibly when challenged. The objective is not to win a presentation contest. It is to demonstrate that capital choices are grounded in evidence, tested against alternatives and adjusted when facts change.
Sources
- U.S. Securities and Exchange Commission, Commission Guidance on Management's Discussion and Analysis of Financial Condition and Results of Operations, Release Nos. 33-10751 and 34-88094, 30 January 2020, Read the primary source
- IFRS Foundation, IFRS Practice Statement 1 Management Commentary supporting material, revised June 2025, Read the primary source
- U.S. Securities and Exchange Commission, Item 703 of Regulation S-K, Purchases of Equity Securities by the Issuer and Affiliated Purchasers, Read the primary source
- Financial Reporting Council, UK Corporate Governance Code 2024, Read the primary source
- Financial Reporting Council, Corporate Governance Code Guidance, 2024, Read the primary source
- OECD, G20/OECD Principles of Corporate Governance 2023, Read the primary source
- Trian Fund Management, Schedule 14A filing and Disney white paper announcement, 4 March 2024, Read the primary source
- Southwest Airlines, announcement of appointments and cooperation agreements with Elliott Investment Management, 24 October 2024, Read the primary source
- Southwest Airlines, Form 8-K concerning Cooperation Agreement, 24 October 2024, Read the primary source
- Norfolk Southern, additional definitive proxy materials, 6 May 2024, Read the primary source
- U.S. Securities and Exchange Commission, Financial Reporting Manual, Section 9230 Key Performance Indicators and Metrics, updated through 2025, Read the primary source
- U.S. Securities and Exchange Commission, Commission Guidance Regarding Management's Discussion and Analysis of Financial Condition and Results of Operations, Release No. 33-8350, 19 December 2003, Read the primary source
- IFRS Foundation, Management Commentary Project Summary and Feedback Statement, June 2025, Read the primary source
- OECD, Disclosure and transparency, G20/OECD Principles of Corporate Governance 2023, Read the primary source
- OECD, The responsibilities of the board, G20/OECD Principles of Corporate Governance 2023, Read the primary source
- Financial Reporting Council, Review of Corporate Governance Reporting 2024, Read the primary source
- Australian Securities Exchange, Corporate Governance Principles and Recommendations, Fourth Edition, Read the primary source
- European Commission, Corporate sustainability reporting, Read the primary source
