

1. Define the investment decision
Decide whether a staged portfolio of satellite-backed edge nodes can earn an acceptable return after network, power, equipment, operating, refresh and financing costs. [1][2][3][6] The analysis should identify the asset owner, operator, customer, payer, financier and party responsible for performance failure or remediation. A regional statistic can prioritise diligence. It cannot replace a contract, licence, technical test or bank receipt.
The evidence file should begin with asset perimeter, country and catchment rationale, workload, customer, payer, technical architecture, licence path, service contract, capital plan and downside liquidity. Each item should state its country and service scope, definition, effective date, expiry or refresh point, accountable owner and relationship to accepted service and collected cash. Public statistics, standards and policy documents provide context. Portfolio value requires node-level rights, lawful operation, utility and network evidence, executed customer obligations, measured performance and financial reconciliation.
The principal failure is that continental connectivity growth or satellite coverage is treated as node-level demand. The practical response is to approve only nodes supported by customer, service, regulatory, infrastructure and cash evidence. Management estimates belong in a clearly identified model input register and should be replaced when observed evidence becomes available. Forecast changes should preserve the original case, the revised assumption, the source and the effect on utilisation, liquidity and debt coverage.
2. Define the portfolio perimeter
The portfolio must identify the countries, legal entities, assets, contracts, currencies, cash accounts and shared services included in the financing. [6][7][27][29] The analysis should identify the asset owner, operator, customer, payer, financier and party responsible for performance failure or remediation. A regional statistic can prioritise diligence. It cannot replace a contract, licence, technical test or bank receipt.
The evidence file should begin with country scope, ownership, permits, asset register, contracts, currencies, tax, cash waterfall, security, shared dependencies and excluded activities. Each item should state its country and service scope, definition, effective date, expiry or refresh point, accountable owner and relationship to accepted service and collected cash. Public statistics, standards and policy documents provide context. Portfolio value requires node-level rights, lawful operation, utility and network evidence, executed customer obligations, measured performance and financial reconciliation.
The principal failure is that a regional brand or holding company is assumed to create a single financeable asset pool. The practical response is to define each borrowing entity and the enforceable route from customer payment to debt service. Management estimates belong in a clearly identified model input register and should be replaced when observed evidence becomes available. Forecast changes should preserve the original case, the revised assumption, the source and the effect on utilisation, liquidity and debt coverage.
3. Screen markets with comparable evidence
National and regional indicators can identify candidate markets, but each node needs evidence for its actual service catchment. [1][2][3][4] The analysis should identify the asset owner, operator, customer, payer, financier and party responsible for performance failure or remediation. A regional statistic can prioritise diligence. It cannot replace a contract, licence, technical test or bank receipt.
The evidence file should begin with coverage and usage gaps, affordability, enterprise and public-service activity, fibre availability, power, satellite licensing, security and competition. Each item should state its country and service scope, definition, effective date, expiry or refresh point, accountable owner and relationship to accepted service and collected cash. Public statistics, standards and policy documents provide context. Portfolio value requires node-level rights, lawful operation, utility and network evidence, executed customer obligations, measured performance and financial reconciliation.
The principal failure is that population or an offline-user count is multiplied by a tariff to create revenue. The practical response is to use indicators to rank diligence and require named workloads and payers before forecasting cash. Management estimates belong in a clearly identified model input register and should be replaced when observed evidence becomes available. Forecast changes should preserve the original case, the revised assumption, the source and the effect on utilisation, liquidity and debt coverage.
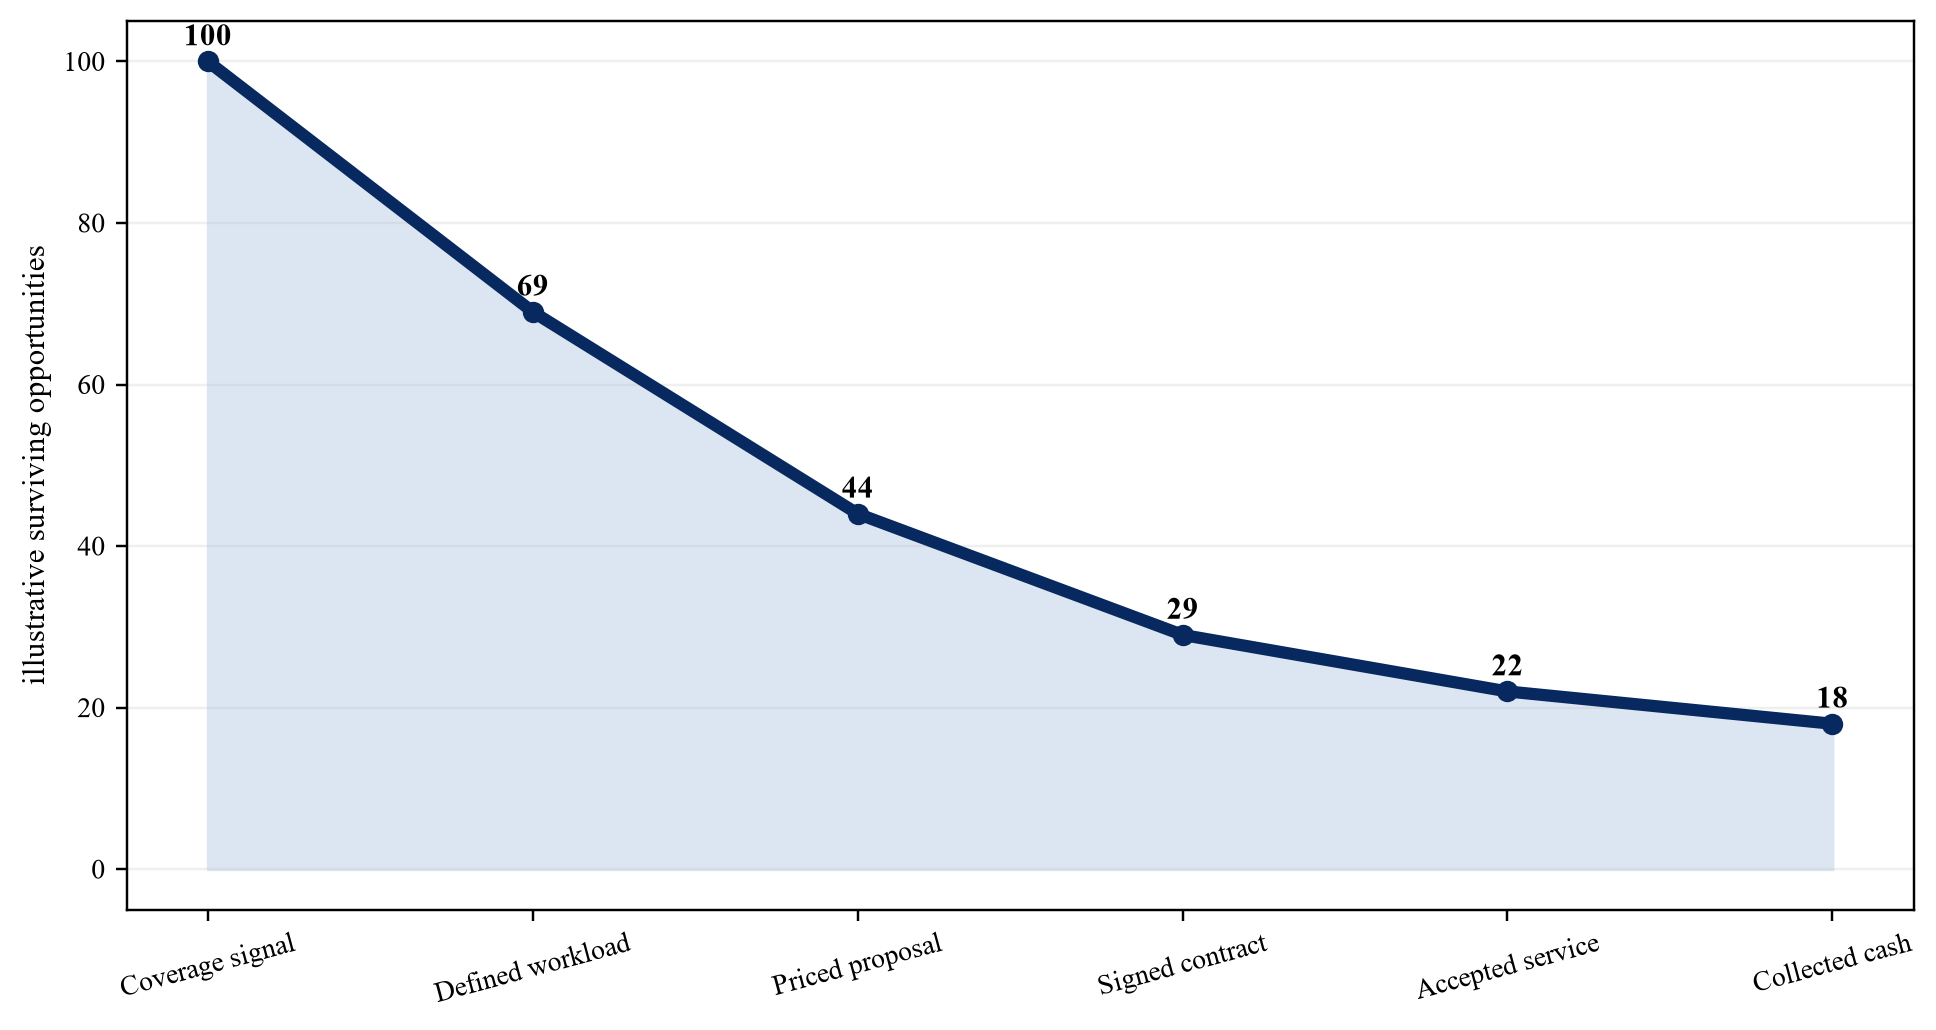
Proposed evidence funnel; activity indicators do not establish financeable revenue.
| Signal | Useful question | Required conversion evidence |
|---|---|---|
| coverage and usage gap | where may unmet connectivity remain | defined service and payer |
| enterprise and public activity | which workloads may need local processing | application path and budget |
| fibre and satellite availability | which network options are feasible | contracted capacity and SLA |
| power and site readiness | where can a node operate reliably | commissioned infrastructure |
| affordability and collections | who can sustain payment | tariff, support and receipts |
Proposed framework; screening evidence prioritises diligence and does not prove revenue.
4. Separate workload classes
Content delivery, telecom backhaul, enterprise continuity, public services, industrial applications and AI inference have different performance and payment characteristics. [3][4][12][13] The analysis should identify the asset owner, operator, customer, payer, financier and party responsible for performance failure or remediation. A regional statistic can prioritise diligence. It cannot replace a contract, licence, technical test or bank receipt.
The evidence file should begin with application path, data volume, latency tolerance, throughput, continuity, data control, customer, payer, service window and price. Each item should state its country and service scope, definition, effective date, expiry or refresh point, accountable owner and relationship to accepted service and collected cash. Public statistics, standards and policy documents provide context. Portfolio value requires node-level rights, lawful operation, utility and network evidence, executed customer obligations, measured performance and financial reconciliation.
The principal failure is that all traffic is converted into one undifferentiated edge-compute forecast. The practical response is to forecast, contract and finance each workload class separately. Management estimates belong in a clearly identified model input register and should be replaced when observed evidence becomes available. Forecast changes should preserve the original case, the revised assumption, the source and the effect on utilisation, liquidity and debt coverage.
5. Choose the network architecture
Low Earth orbit, geostationary satellite, microwave, fibre and mobile networks offer different coverage, latency, capacity, cost and regulatory profiles. [1][9][10][11] The analysis should identify the asset owner, operator, customer, payer, financier and party responsible for performance failure or remediation. A regional statistic can prioritise diligence. It cannot replace a contract, licence, technical test or bank receipt.
The evidence file should begin with route design, orbit and provider, gateway, spectrum, capacity, contention, redundancy, terrestrial alternatives, service level and migration path. Each item should state its country and service scope, definition, effective date, expiry or refresh point, accountable owner and relationship to accepted service and collected cash. Public statistics, standards and policy documents provide context. Portfolio value requires node-level rights, lawful operation, utility and network evidence, executed customer obligations, measured performance and financial reconciliation.
The principal failure is that a satellite footprint is treated as committed capacity and an end-to-end service. The practical response is to select an architecture through measured service requirements, contracted capacity and tested alternatives. Management estimates belong in a clearly identified model input register and should be replaced when observed evidence becomes available. Forecast changes should preserve the original case, the revised assumption, the source and the effect on utilisation, liquidity and debt coverage.
6. Build the end-to-end service path
The financed service includes user access, local network, edge node, satellite terminal, space segment, gateway, terrestrial transit, application and response. [12][13][14][32] The analysis should identify the asset owner, operator, customer, payer, financier and party responsible for performance failure or remediation. A regional statistic can prioritise diligence. It cannot replace a contract, licence, technical test or bank receipt.
The evidence file should begin with logical and physical topology, ownership, hand-offs, latency, loss, jitter, capacity, encryption, monitoring, maintenance and remedies. Each item should state its country and service scope, definition, effective date, expiry or refresh point, accountable owner and relationship to accepted service and collected cash. Public statistics, standards and policy documents provide context. Portfolio value requires node-level rights, lawful operation, utility and network evidence, executed customer obligations, measured performance and financial reconciliation.
The principal failure is that the satellite hop or server benchmark substitutes for end-to-end performance. The practical response is to measure the complete path under normal, peak, degraded and failover conditions. Management estimates belong in a clearly identified model input register and should be replaced when observed evidence becomes available. Forecast changes should preserve the original case, the revised assumption, the source and the effect on utilisation, liquidity and debt coverage.
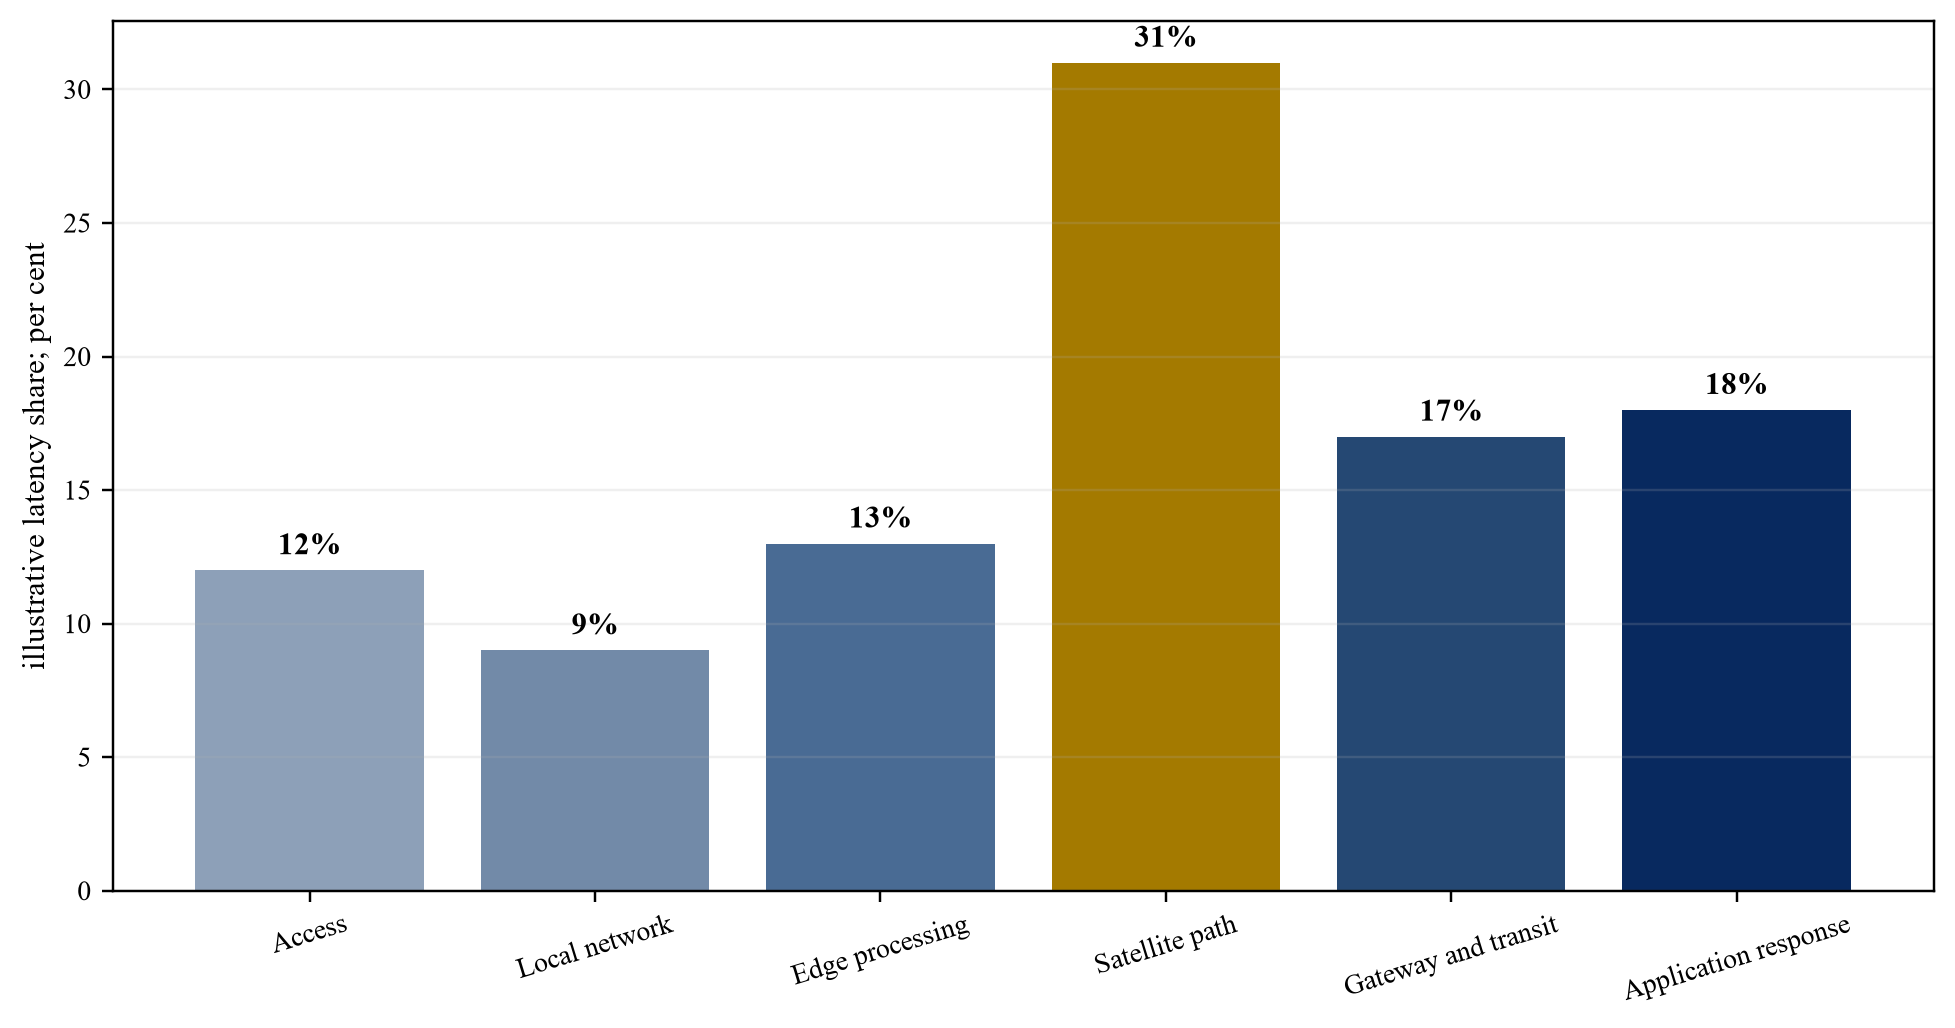
Wholly hypothetical allocation; replace with measured application traces.
| Architecture | Potential role | Required evidence |
|---|---|---|
| fibre | high-capacity primary or growth route | route, delivery, diversity and tariff |
| microwave | regional point-to-point backhaul | spectrum, line of sight and capacity |
| geostationary satellite | broad reach and established services | capacity, latency, gateway and SLA |
| low Earth orbit satellite | lower-latency distributed access | licence, terminal, capacity and continuity |
| mobile network | local access and redundancy | coverage, congestion and commercial terms |
Proposed comparison; actual results depend on location, provider, contract and measured performance.
7. Measure capacity and contention
Satellite and terrestrial capacity must be translated into committed information rates, burst rights, contention, priority, oversubscription and restoration obligations. [1][9][11][32] The analysis should identify the asset owner, operator, customer, payer, financier and party responsible for performance failure or remediation. A regional statistic can prioritise diligence. It cannot replace a contract, licence, technical test or bank receipt.
The evidence file should begin with beam and gateway allocation, committed and peak rate, fair-use rules, congestion history, traffic profile, quality of service and upgrade rights. Each item should state its country and service scope, definition, effective date, expiry or refresh point, accountable owner and relationship to accepted service and collected cash. Public statistics, standards and policy documents provide context. Portfolio value requires node-level rights, lawful operation, utility and network evidence, executed customer obligations, measured performance and financial reconciliation.
The principal failure is that advertised peak speed is used as continuous saleable capacity. The practical response is to size customer promises to enforceable capacity and measured busy-period performance. Management estimates belong in a clearly identified model input register and should be replaced when observed evidence becomes available. Forecast changes should preserve the original case, the revised assumption, the source and the effect on utilisation, liquidity and debt coverage.
8. Locate the payer and budget
Every forecast workload needs a customer, authorised budget owner, payment source, procurement route and credit assessment. [6][8][22][27] The analysis should identify the asset owner, operator, customer, payer, financier and party responsible for performance failure or remediation. A regional statistic can prioritise diligence. It cannot replace a contract, licence, technical test or bank receipt.
The evidence file should begin with customer identity, use case, procurement, approved budget, contract term, payment history, security, public appropriation and funding expiry. Each item should state its country and service scope, definition, effective date, expiry or refresh point, accountable owner and relationship to accepted service and collected cash. Public statistics, standards and policy documents provide context. Portfolio value requires node-level rights, lawful operation, utility and network evidence, executed customer obligations, measured performance and financial reconciliation.
The principal failure is that social value, technical interest or pilot use is treated as recurring revenue. The practical response is to progress demand from use case to priced proposal, approved budget, contract, acceptance and collection. Management estimates belong in a clearly identified model input register and should be replaced when observed evidence becomes available. Forecast changes should preserve the original case, the revised assumption, the source and the effect on utilisation, liquidity and debt coverage.
9. Test affordability and usage
Coverage creates value only when users or institutions can afford devices, services, applications and recurring connectivity. [2][3][4][5] The analysis should identify the asset owner, operator, customer, payer, financier and party responsible for performance failure or remediation. A regional statistic can prioritise diligence. It cannot replace a contract, licence, technical test or bank receipt.
The evidence file should begin with income and price data, device access, service bundle, subsidy, shared-access model, demand elasticity, churn and collection. Each item should state its country and service scope, definition, effective date, expiry or refresh point, accountable owner and relationship to accepted service and collected cash. Public statistics, standards and policy documents provide context. Portfolio value requires node-level rights, lawful operation, utility and network evidence, executed customer obligations, measured performance and financial reconciliation.
The principal failure is that a closed coverage gap is assumed to close the usage gap at the forecast tariff. The practical response is to model adoption and payment by customer cohort and identify the party funding any affordability gap. Management estimates belong in a clearly identified model input register and should be replaced when observed evidence becomes available. Forecast changes should preserve the original case, the revised assumption, the source and the effect on utilisation, liquidity and debt coverage.
10. Design the revenue contract
Contracts should define capacity, service, acceptance, price, currency, indexation, minimum payment, credits, termination and security. [22][23][27][30] The analysis should identify the asset owner, operator, customer, payer, financier and party responsible for performance failure or remediation. A regional statistic can prioritise diligence. It cannot replace a contract, licence, technical test or bank receipt.
The evidence file should begin with signed agreement, order form, service schedule, acceptance test, invoice basis, taxes, payment mechanics, credit support and dispute route. Each item should state its country and service scope, definition, effective date, expiry or refresh point, accountable owner and relationship to accepted service and collected cash. Public statistics, standards and policy documents provide context. Portfolio value requires node-level rights, lawful operation, utility and network evidence, executed customer obligations, measured performance and financial reconciliation.
The principal failure is that letters of intent, grants or traffic forecasts support debt sizing as contracted revenue. The practical response is to value cash according to enforceability, conditions, tenor, customer credit and collection evidence. Management estimates belong in a clearly identified model input register and should be replaced when observed evidence becomes available. Forecast changes should preserve the original case, the revised assumption, the source and the effect on utilisation, liquidity and debt coverage.
| Term | Evidence | Financing concern |
|---|---|---|
| reserved service | unit, site and commencement | acceptance condition |
| price and currency | tariff and indexation | margin and convertibility |
| service level | measurable performance | credits and termination |
| payment support | payer, account and security | arrears and set-off |
| renewal and exit | notice, data and migration | residual utilisation |
Proposed comparison; governing contracts determine enforceability.
11. Resolve licensing and spectrum
Country-specific authorisation, type approval, spectrum, landing, gateway, data and telecom rules affect launch timing and service legality. [1][10][11][17] The analysis should identify the asset owner, operator, customer, payer, financier and party responsible for performance failure or remediation. A regional statistic can prioritise diligence. It cannot replace a contract, licence, technical test or bank receipt.
The evidence file should begin with regulatory map, responsible authority, licence, spectrum rights, equipment approval, local entity, fees, renewal, reporting and sanctions. Each item should state its country and service scope, definition, effective date, expiry or refresh point, accountable owner and relationship to accepted service and collected cash. Public statistics, standards and policy documents provide context. Portfolio value requires node-level rights, lawful operation, utility and network evidence, executed customer obligations, measured performance and financial reconciliation.
The principal failure is that approval in one country or a global satellite licence is assumed to authorise regional service. The practical response is to make every country launch conditional on written local regulatory evidence. Management estimates belong in a clearly identified model input register and should be replaced when observed evidence becomes available. Forecast changes should preserve the original case, the revised assumption, the source and the effect on utilisation, liquidity and debt coverage.
12. Secure gateway and carrier rights
Satellite capacity depends on gateways, earth stations, terrestrial transit, peering and rights that may sit outside the project company. [9][10][15][33] The analysis should identify the asset owner, operator, customer, payer, financier and party responsible for performance failure or remediation. A regional statistic can prioritise diligence. It cannot replace a contract, licence, technical test or bank receipt.
The evidence file should begin with gateway location, ownership, licence, capacity, diversity, transit, interconnection, direct agreements, step-in and alternate route. Each item should state its country and service scope, definition, effective date, expiry or refresh point, accountable owner and relationship to accepted service and collected cash. Public statistics, standards and policy documents provide context. Portfolio value requires node-level rights, lawful operation, utility and network evidence, executed customer obligations, measured performance and financial reconciliation.
The principal failure is that multiple customer terminals are treated as network diversity despite a common gateway or upstream carrier. The practical response is to map shared dependencies and procure tested alternate routes where the service requires them. Management estimates belong in a clearly identified model input register and should be replaced when observed evidence becomes available. Forecast changes should preserve the original case, the revised assumption, the source and the effect on utilisation, liquidity and debt coverage.
13. Design reliable node power
Each node needs deliverable primary power, backup, storage, fuel or renewable supply, cooling and an operating response to outages. [16][17][18][19] The analysis should identify the asset owner, operator, customer, payer, financier and party responsible for performance failure or remediation. A regional statistic can prioritise diligence. It cannot replace a contract, licence, technical test or bank receipt.
The evidence file should begin with connection, sanctioned load, outage record, generation, battery autonomy, fuel logistics, cooling design, maintenance, tariff and test results. Each item should state its country and service scope, definition, effective date, expiry or refresh point, accountable owner and relationship to accepted service and collected cash. Public statistics, standards and policy documents provide context. Portfolio value requires node-level rights, lawful operation, utility and network evidence, executed customer obligations, measured performance and financial reconciliation.
The principal failure is that nameplate generation or a national access statistic is treated as continuous usable power. The practical response is to size services to commissioned power and stress outage duration, fuel, tariff and equipment degradation. Management estimates belong in a clearly identified model input register and should be replaced when observed evidence becomes available. Forecast changes should preserve the original case, the revised assumption, the source and the effect on utilisation, liquidity and debt coverage.
14. Control sites and equipment
Site tenure, physical access, equipment title, customs, insurance, security, assignment and relocation rights determine buildability and recovery. [18][27][28][30] The analysis should identify the asset owner, operator, customer, payer, financier and party responsible for performance failure or remediation. A regional statistic can prioritise diligence. It cannot replace a contract, licence, technical test or bank receipt.
The evidence file should begin with lease or title, permits, access, import and customs path, equipment register, serial numbers, insurance, assignment, direct agreement and exit route. Each item should state its country and service scope, definition, effective date, expiry or refresh point, accountable owner and relationship to accepted service and collected cash. Public statistics, standards and policy documents provide context. Portfolio value requires node-level rights, lawful operation, utility and network evidence, executed customer obligations, measured performance and financial reconciliation.
The principal failure is that a proposed host site or partner discussion is treated as controlled infrastructure. The practical response is to release capital only after transferable site and equipment rights are documented. Management estimates belong in a clearly identified model input register and should be replaced when observed evidence becomes available. Forecast changes should preserve the original case, the revised assumption, the source and the effect on utilisation, liquidity and debt coverage.
| Gate | Required evidence | Capital action |
|---|---|---|
| licence and site | written authority and transferable rights | condition precedent |
| power and cooling | commissioned capacity and test | size or defer |
| network path | contracted capacity and failover | procure or reject |
| customer and payer | acceptance schedule and contract | release or hold |
| cyber and recovery | approved controls and exercise | remediate before service |
Proposed minimum gate; local requirements may add conditions.
15. Map data and cyber obligations
Distributed nodes increase exposure across identity, remote access, suppliers, physical security, data location, logging and recovery. [20][21][31][32] The analysis should identify the asset owner, operator, customer, payer, financier and party responsible for performance failure or remediation. A regional statistic can prioritise diligence. It cannot replace a contract, licence, technical test or bank receipt.
The evidence file should begin with data inventory, processing roles, cross-border path, sector rules, trust boundaries, privileged access, segmentation, logging, incident plan and recovery test. Each item should state its country and service scope, definition, effective date, expiry or refresh point, accountable owner and relationship to accepted service and collected cash. Public statistics, standards and policy documents provide context. Portfolio value requires node-level rights, lawful operation, utility and network evidence, executed customer obligations, measured performance and financial reconciliation.
The principal failure is that encryption or a certification label substitutes for an operating control system. The practical response is to embed cyber, data and recovery obligations in design, acceptance and supplier contracts. Management estimates belong in a clearly identified model input register and should be replaced when observed evidence becomes available. Forecast changes should preserve the original case, the revised assumption, the source and the effect on utilisation, liquidity and debt coverage.
16. Allocate service-chain responsibility
The service crosses site owner, power supplier, satellite provider, gateway, carrier, equipment vendor, integrator, operator, application provider and customer. [18][20][27][30] The analysis should identify the asset owner, operator, customer, payer, financier and party responsible for performance failure or remediation. A regional statistic can prioritise diligence. It cannot replace a contract, licence, technical test or bank receipt.
The evidence file should begin with responsibility matrix, hand-off, service measure, maintenance window, warranty, credit, indemnity, cap, insurance, step-in and termination. Each item should state its country and service scope, definition, effective date, expiry or refresh point, accountable owner and relationship to accepted service and collected cash. Public statistics, standards and policy documents provide context. Portfolio value requires node-level rights, lawful operation, utility and network evidence, executed customer obligations, measured performance and financial reconciliation.
The principal failure is that the project company promises end-to-end service without matching rights against upstream providers. The practical response is to align customer obligations with measurable supplier obligations and fund retained gaps. Management estimates belong in a clearly identified model input register and should be replaced when observed evidence becomes available. Forecast changes should preserve the original case, the revised assumption, the source and the effect on utilisation, liquidity and debt coverage.
17. Build node unit economics
Each node should show revenue, satellite capacity, terrestrial transit, power, maintenance, field support, licence, tax, service credits, receivables and refresh. [3][9][22][24] The analysis should identify the asset owner, operator, customer, payer, financier and party responsible for performance failure or remediation. A regional statistic can prioritise diligence. It cannot replace a contract, licence, technical test or bank receipt.
The evidence file should begin with billable unit, customer and workload mix, price, utilisation, bandwidth, energy, support, downtime, bad debt, working capital and refresh. Each item should state its country and service scope, definition, effective date, expiry or refresh point, accountable owner and relationship to accepted service and collected cash. Public statistics, standards and policy documents provide context. Portfolio value requires node-level rights, lawful operation, utility and network evidence, executed customer obligations, measured performance and financial reconciliation.
The principal failure is that revenue per node or user omits idle capacity, shared-network cost, collection delay and service credits. The practical response is to measure contribution and collected cash by customer, workload, node and cluster. Management estimates belong in a clearly identified model input register and should be replaced when observed evidence becomes available. Forecast changes should preserve the original case, the revised assumption, the source and the effect on utilisation, liquidity and debt coverage.
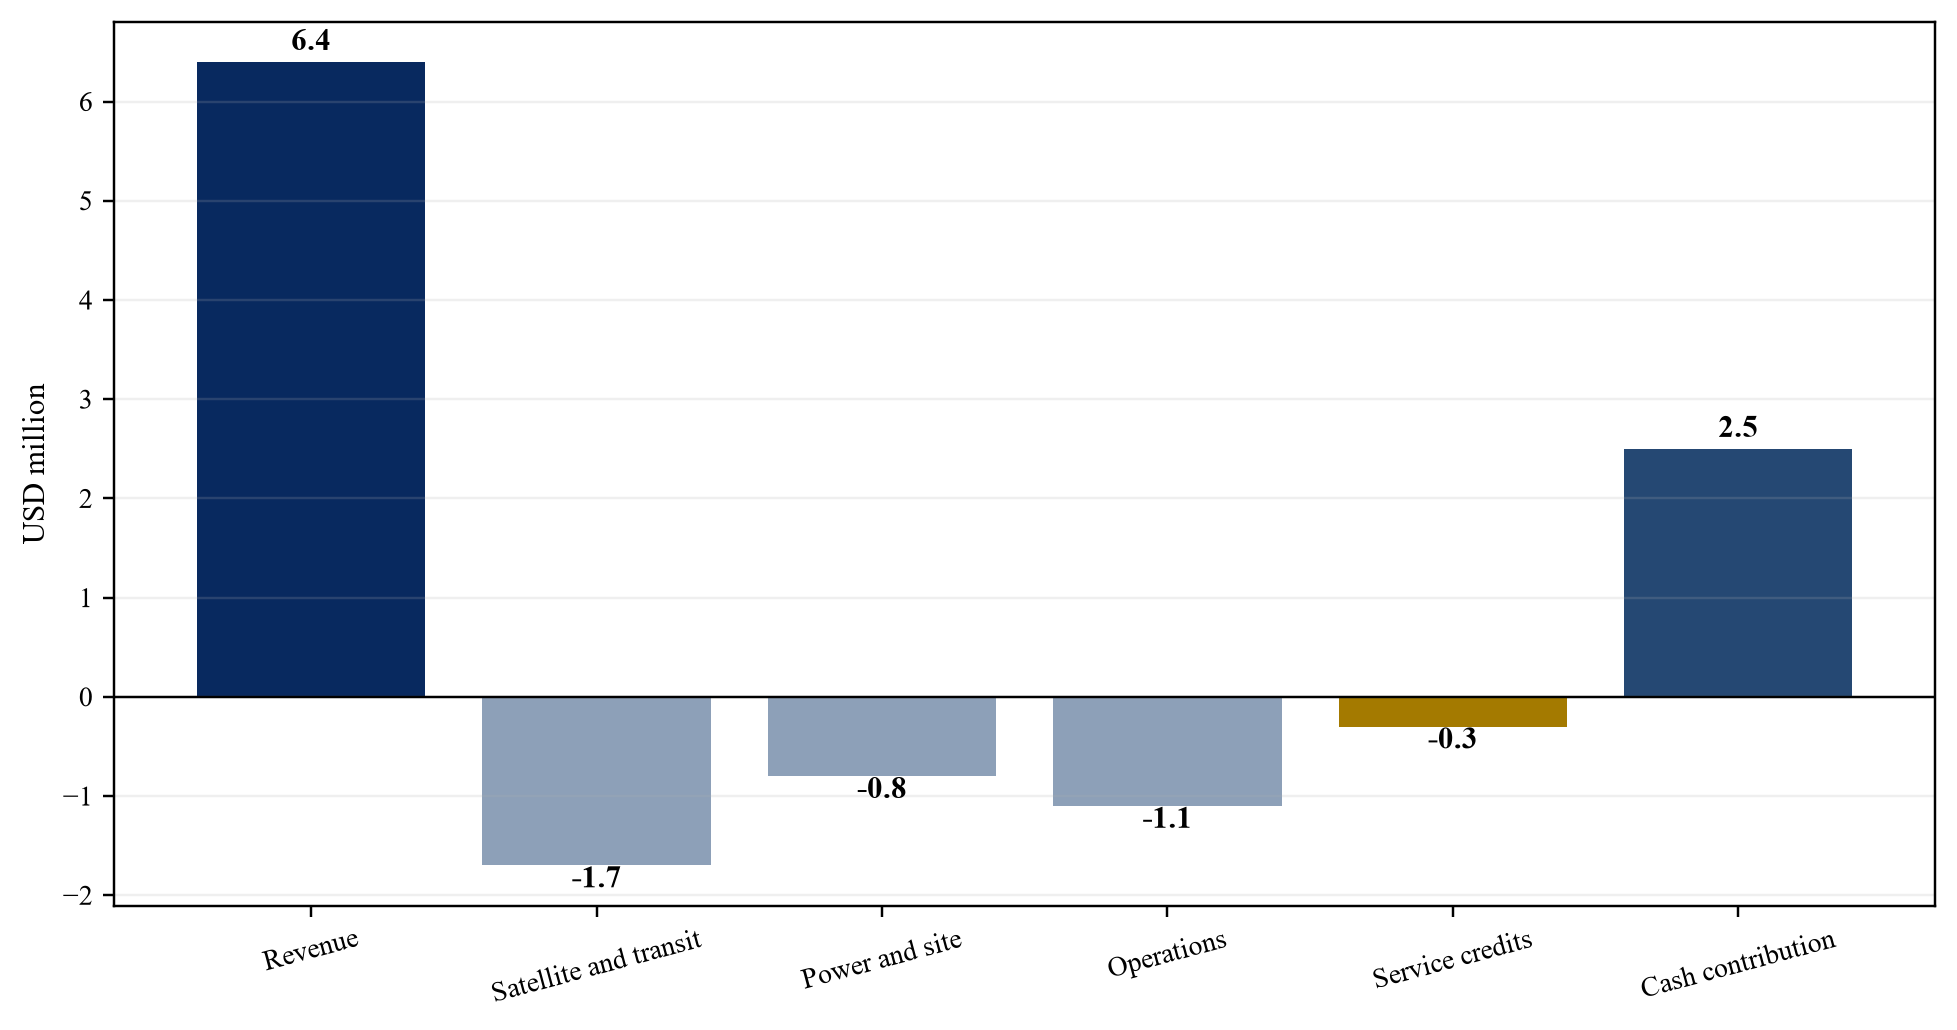
Wholly hypothetical; USD million for one representative accepted node.
18. Separate capacity states
Planned, licensed, installed, commissioned, connected, accepted, reserved, billable and collected capacity have different financing value. [1][9][22][27] The analysis should identify the asset owner, operator, customer, payer, financier and party responsible for performance failure or remediation. A regional statistic can prioritise diligence. It cannot replace a contract, licence, technical test or bank receipt.
The evidence file should begin with state definition, evidence, date, expiry, owner, remaining conditions, cost to advance and linked customer. Each item should state its country and service scope, definition, effective date, expiry or refresh point, accountable owner and relationship to accepted service and collected cash. Public statistics, standards and policy documents provide context. Portfolio value requires node-level rights, lawful operation, utility and network evidence, executed customer obligations, measured performance and financial reconciliation.
The principal failure is that ordered equipment or available satellite coverage is reported as revenue-generating capacity. The practical response is to use a capacity waterfall with evidence rules for every movement. Management estimates belong in a clearly identified model input register and should be replaced when observed evidence becomes available. Forecast changes should preserve the original case, the revised assumption, the source and the effect on utilisation, liquidity and debt coverage.
19. Measure concentration correctly
Geographic dispersion does not diversify a portfolio when nodes share a satellite provider, gateway, vendor, currency, government payer or power supplier. [9][11][23][29] The analysis should identify the asset owner, operator, customer, payer, financier and party responsible for performance failure or remediation. A regional statistic can prioritise diligence. It cannot replace a contract, licence, technical test or bank receipt.
The evidence file should begin with exposure by provider, beam, gateway, country, customer, currency, bank, vendor, technology and recovery path. Each item should state its country and service scope, definition, effective date, expiry or refresh point, accountable owner and relationship to accepted service and collected cash. Public statistics, standards and policy documents provide context. Portfolio value requires node-level rights, lawful operation, utility and network evidence, executed customer obligations, measured performance and financial reconciliation.
The principal failure is that node count or country count is used as the diversification measure. The practical response is to calculate common-cause exposures and set concentration limits before crediting diversification. Management estimates belong in a clearly identified model input register and should be replaced when observed evidence becomes available. Forecast changes should preserve the original case, the revised assumption, the source and the effect on utilisation, liquidity and debt coverage.
| Dependency | Exposure measure | Possible control |
|---|---|---|
| satellite provider and beam | revenue and nodes affected | alternate capacity and limit |
| gateway and carrier | cash exposed to one route | diverse path and direct agreement |
| sovereign and licence | assets and cash by country | staging and country cap |
| customer and payer | contracted revenue concentration | security and portfolio limit |
| currency and bank | cash and debt mismatch | matching, reserve and account control |
Proposed framework; exposure should be measured before portfolio diversification is credited.
20. Stage the twelve-node portfolio
The hypothetical programme releases six first-wave nodes, preserves four options and defers two until customer, licence and infrastructure evidence improve. [4][6][10][27] The analysis should identify the asset owner, operator, customer, payer, financier and party responsible for performance failure or remediation. A regional statistic can prioritise diligence. It cannot replace a contract, licence, technical test or bank receipt.
The evidence file should begin with node dossier, readiness score, anchor contract, cost, schedule, acceptance, ramp, liquidity, option expiry and stop authority. Each item should state its country and service scope, definition, effective date, expiry or refresh point, accountable owner and relationship to accepted service and collected cash. Public statistics, standards and policy documents provide context. Portfolio value requires node-level rights, lawful operation, utility and network evidence, executed customer obligations, measured performance and financial reconciliation.
The principal failure is that all candidate nodes receive simultaneous capital despite different readiness and common dependencies. The practical response is to use modular deployment and explicit rights to defer, resize, relocate or stop. Management estimates belong in a clearly identified model input register and should be replaced when observed evidence becomes available. Forecast changes should preserve the original case, the revised assumption, the source and the effect on utilisation, liquidity and debt coverage.
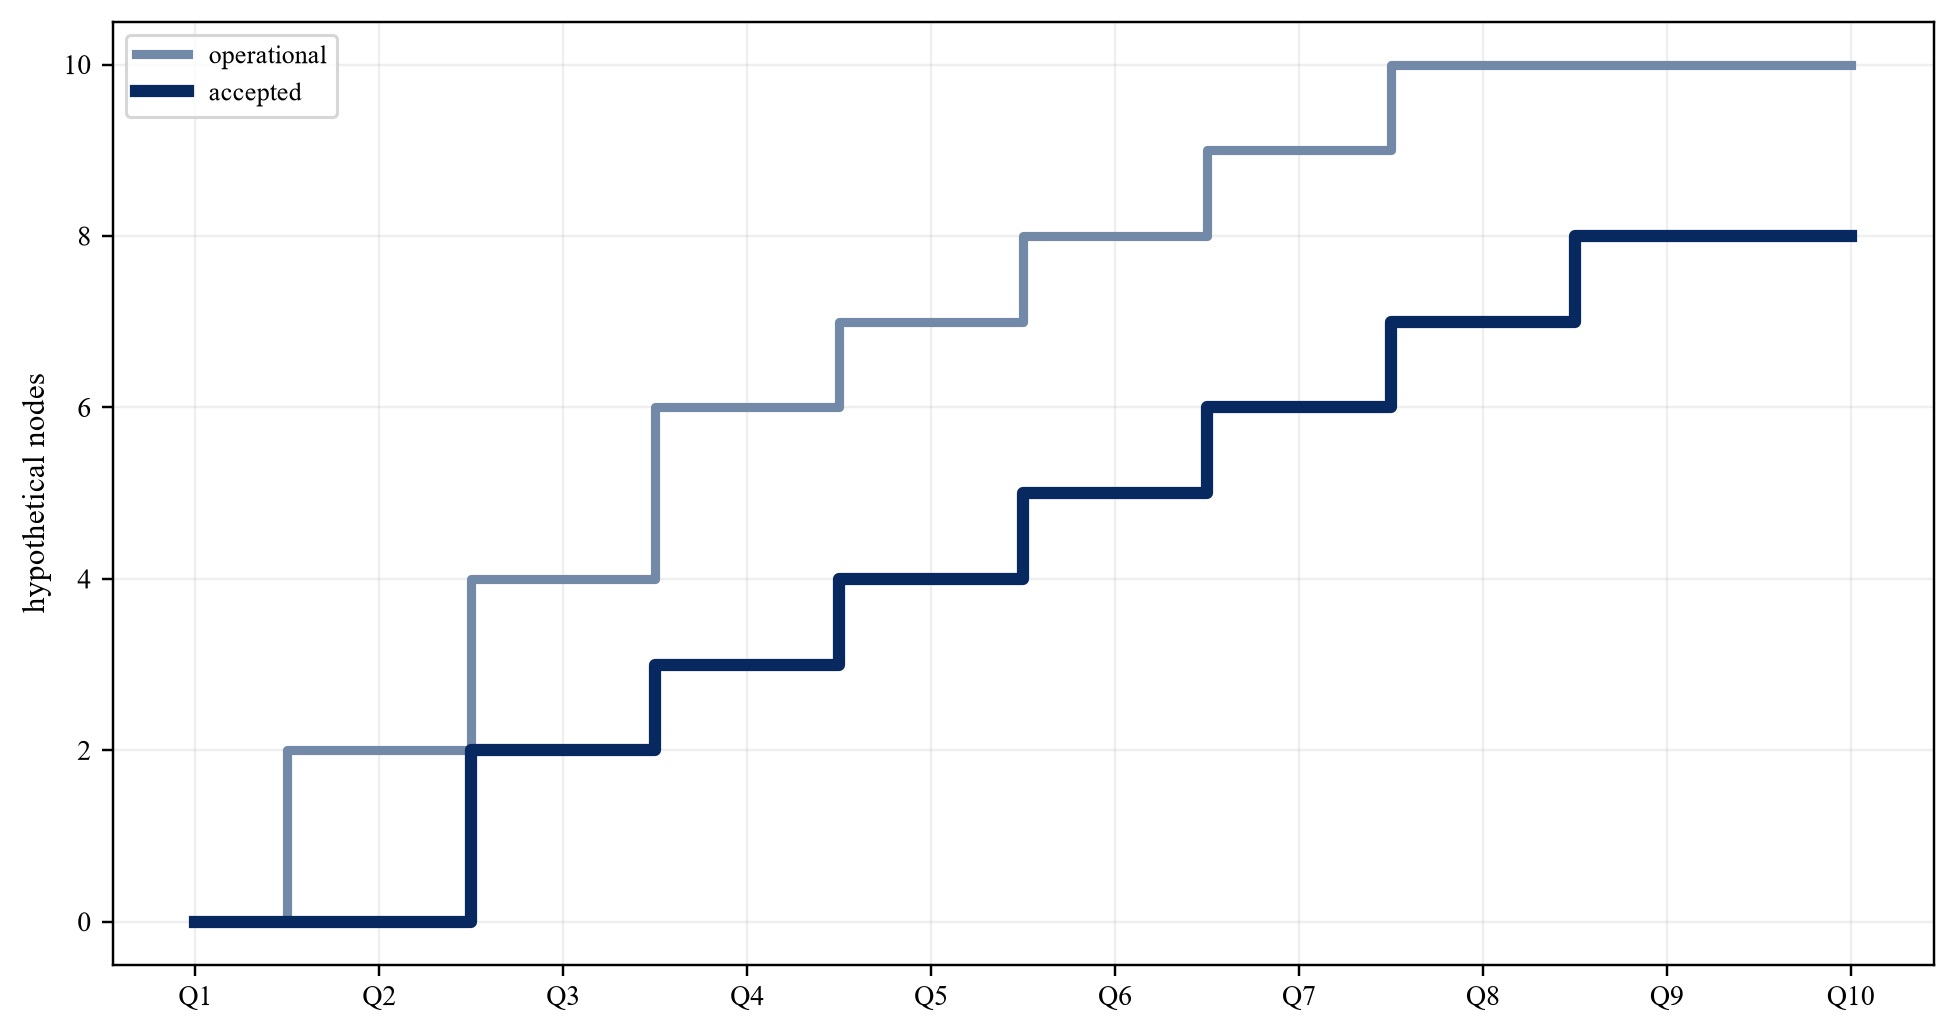
Wholly hypothetical; accepted nodes lag installed nodes until regulatory, customer and service acceptance.
21. Apply the hypothetical sources and uses
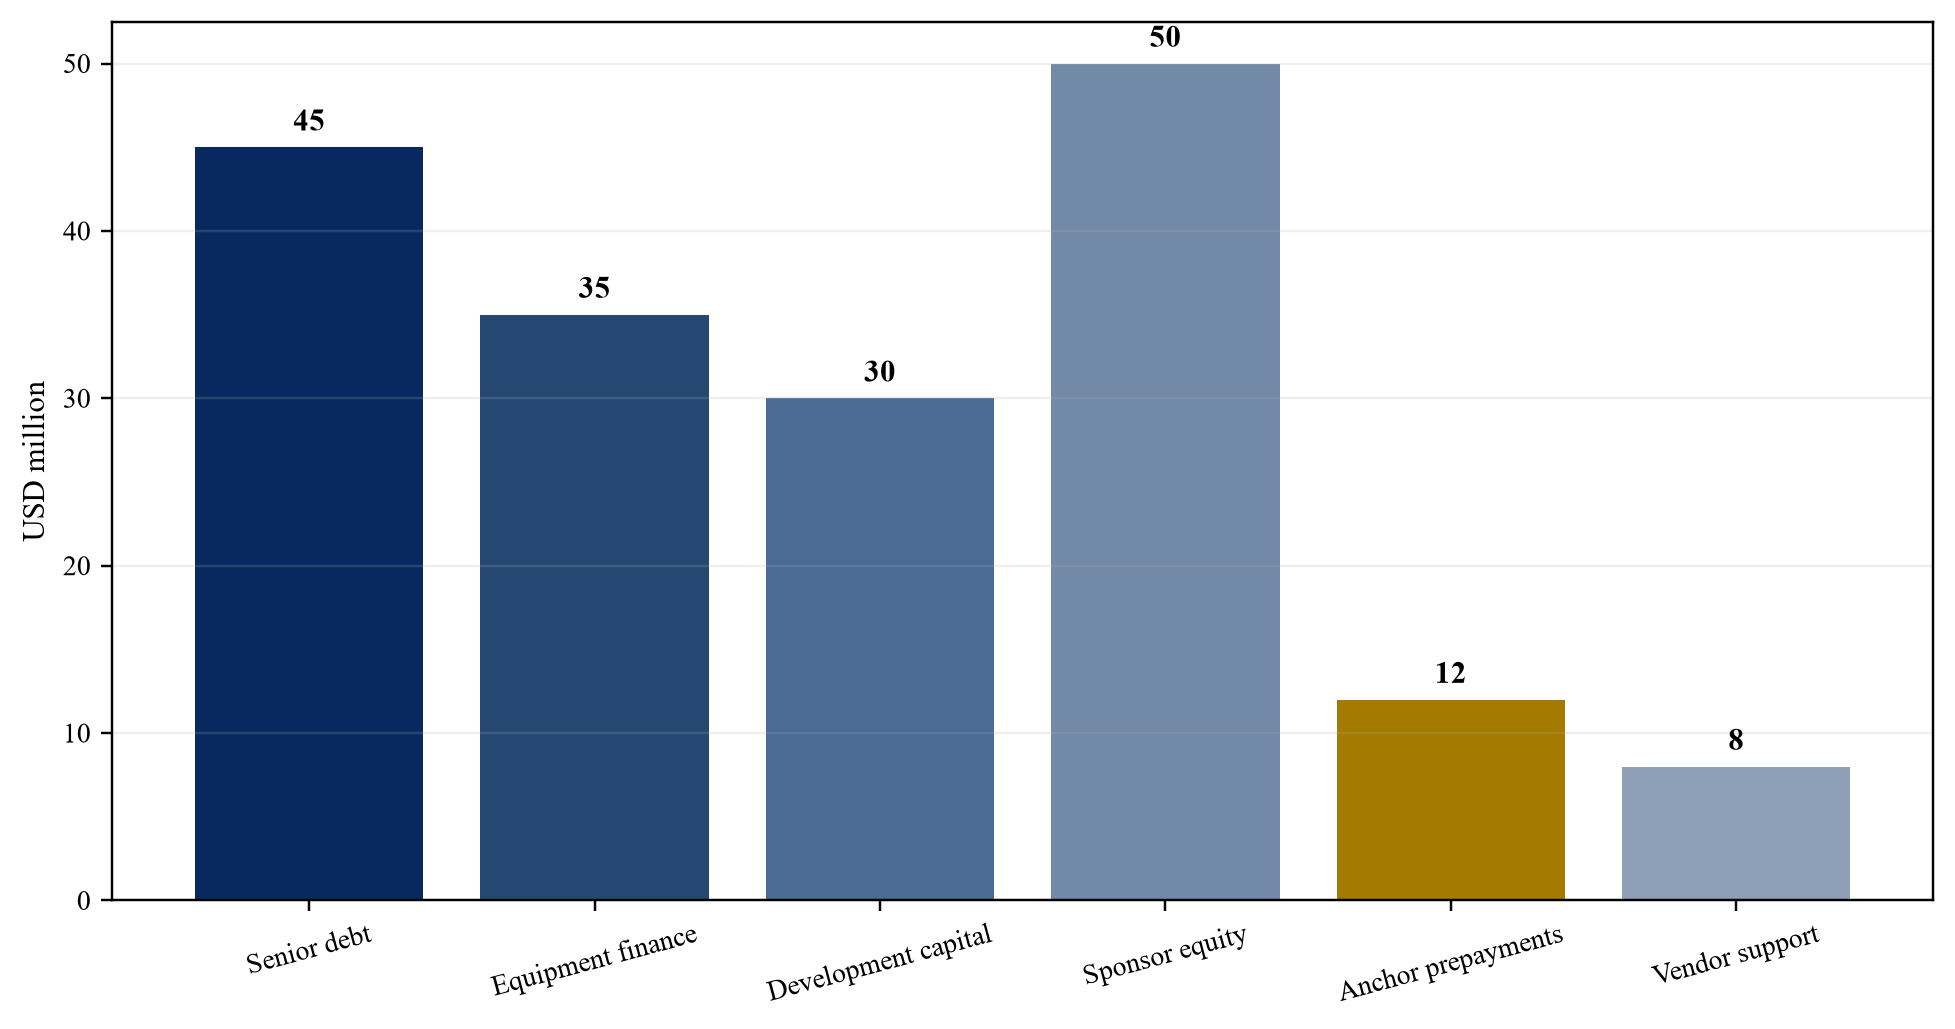
The USD 180 million case separates durable infrastructure, edge equipment, satellite integration, software, deployment and reserves. [23][27][28][29] The analysis should identify the asset owner, operator, customer, payer, financier and party responsible for performance failure or remediation. A regional statistic can prioritise diligence. It cannot replace a contract, licence, technical test or bank receipt.
The evidence file should begin with wholly hypothetical sources and uses, draw conditions, amortisation, grant or blended terms, reserve policy, anchor support, vendor terms and sponsor cure. Each item should state its country and service scope, definition, effective date, expiry or refresh point, accountable owner and relationship to accepted service and collected cash. Public statistics, standards and policy documents provide context. Portfolio value requires node-level rights, lawful operation, utility and network evidence, executed customer obligations, measured performance and financial reconciliation.
The principal failure is that funding categories hide which capital absorbs licensing, technology, demand, currency and operating risk. The practical response is to allocate debt to eligible accepted cash and risk-bearing capital to uncertainty. Management estimates belong in a clearly identified model input register and should be replaced when observed evidence becomes available. Forecast changes should preserve the original case, the revised assumption, the source and the effect on utilisation, liquidity and debt coverage.
Wholly hypothetical; USD million.
| Metric | Central case | Combined downside |
|---|---|---|
| accepted nodes in year five | 8 | 7 |
| billable utilisation | 62% | 38% |
| recurring revenue | USD 46 million | USD 25 million |
| deployment delay | none beyond plan | 12 months |
| satellite-cost variance | base | +18% |
| debt-service coverage ratio | 1.47x | 0.78x |
Wholly hypothetical; figures do not describe an announced project.
22. Match capital to asset lives
Sites and power, satellite terminals, servers, network equipment and software have different useful lives, portability and replacement cycles. [23][24][25][26] The analysis should identify the asset owner, operator, customer, payer, financier and party responsible for performance failure or remediation. A regional statistic can prioritise diligence. It cannot replace a contract, licence, technical test or bank receipt.
The evidence file should begin with asset register, useful life, warranty, maintenance, residual value, replacement, security, amortisation, cash sweep and refresh reserve. Each item should state its country and service scope, definition, effective date, expiry or refresh point, accountable owner and relationship to accepted service and collected cash. Public statistics, standards and policy documents provide context. Portfolio value requires node-level rights, lawful operation, utility and network evidence, executed customer obligations, measured performance and financial reconciliation.
The principal failure is that long-dated debt and terminal value rely on equipment beyond its economic or contractual life. The practical response is to separate borrowing bases and fund refresh within coverage and valuation. Management estimates belong in a clearly identified model input register and should be replaced when observed evidence becomes available. Forecast changes should preserve the original case, the revised assumption, the source and the effect on utilisation, liquidity and debt coverage.
23. Design the capital stack
Senior debt, equipment finance, development capital, sponsor equity, customer prepayments and vendor support should bear risks they can price and control. [27][28][29][30] The analysis should identify the asset owner, operator, customer, payer, financier and party responsible for performance failure or remediation. A regional statistic can prioritise diligence. It cannot replace a contract, licence, technical test or bank receipt.
The evidence file should begin with tranche purpose, eligibility, tenor, currency, repayment, security, intercreditor terms, conditions, reserves, cure and distribution tests. Each item should state its country and service scope, definition, effective date, expiry or refresh point, accountable owner and relationship to accepted service and collected cash. Public statistics, standards and policy documents provide context. Portfolio value requires node-level rights, lawful operation, utility and network evidence, executed customer obligations, measured performance and financial reconciliation.
The principal failure is that cheap capital is spread uniformly across assets and countries without regard to risk or cash availability. The practical response is to match each source to a defined asset, risk period and enforceable cash flow. Management estimates belong in a clearly identified model input register and should be replaced when observed evidence becomes available. Forecast changes should preserve the original case, the revised assumption, the source and the effect on utilisation, liquidity and debt coverage.
24. Allocate construction and operating risk
The party controlling a milestone or service failure should carry a measurable obligation, remedy or funded exposure. [18][20][27][30] The analysis should identify the asset owner, operator, customer, payer, financier and party responsible for performance failure or remediation. A regional statistic can prioritise diligence. It cannot replace a contract, licence, technical test or bank receipt.
The evidence file should begin with risk matrix, milestone, warranty, delay damages, service credit, insurance, direct agreement, cap, relief, step-in and termination. Each item should state its country and service scope, definition, effective date, expiry or refresh point, accountable owner and relationship to accepted service and collected cash. Public statistics, standards and policy documents provide context. Portfolio value requires node-level rights, lawful operation, utility and network evidence, executed customer obligations, measured performance and financial reconciliation.
The principal failure is that correlated risks remain in the project company without price, recourse, reserve or operating control. The practical response is to place risk with the party able to prevent, measure or remedy it and capitalise the remainder. Management estimates belong in a clearly identified model input register and should be replaced when observed evidence becomes available. Forecast changes should preserve the original case, the revised assumption, the source and the effect on utilisation, liquidity and debt coverage.
25. Stress correlated downside
Licensing delay, lower utilisation, satellite congestion, gateway outage, power failure, currency depreciation, customer arrears and equipment refresh can occur together. [3][11][16][23] The analysis should identify the asset owner, operator, customer, payer, financier and party responsible for performance failure or remediation. A regional statistic can prioritise diligence. It cannot replace a contract, licence, technical test or bank receipt.
The evidence file should begin with monthly integrated scenarios, covenant headroom, concentration, deferred nodes, alternate routes, sponsor cure, reserve use and termination cash. Each item should state its country and service scope, definition, effective date, expiry or refresh point, accountable owner and relationship to accepted service and collected cash. Public statistics, standards and policy documents provide context. Portfolio value requires node-level rights, lawful operation, utility and network evidence, executed customer obligations, measured performance and financial reconciliation.
The principal failure is that single-variable sensitivities understate interactions between demand, network, sovereign, currency and financing risk. The practical response is to test the seven-node, 38 per cent utilisation, twelve-month delay and 18 per cent satellite-cost increase together. Management estimates belong in a clearly identified model input register and should be replaced when observed evidence becomes available. Forecast changes should preserve the original case, the revised assumption, the source and the effect on utilisation, liquidity and debt coverage.
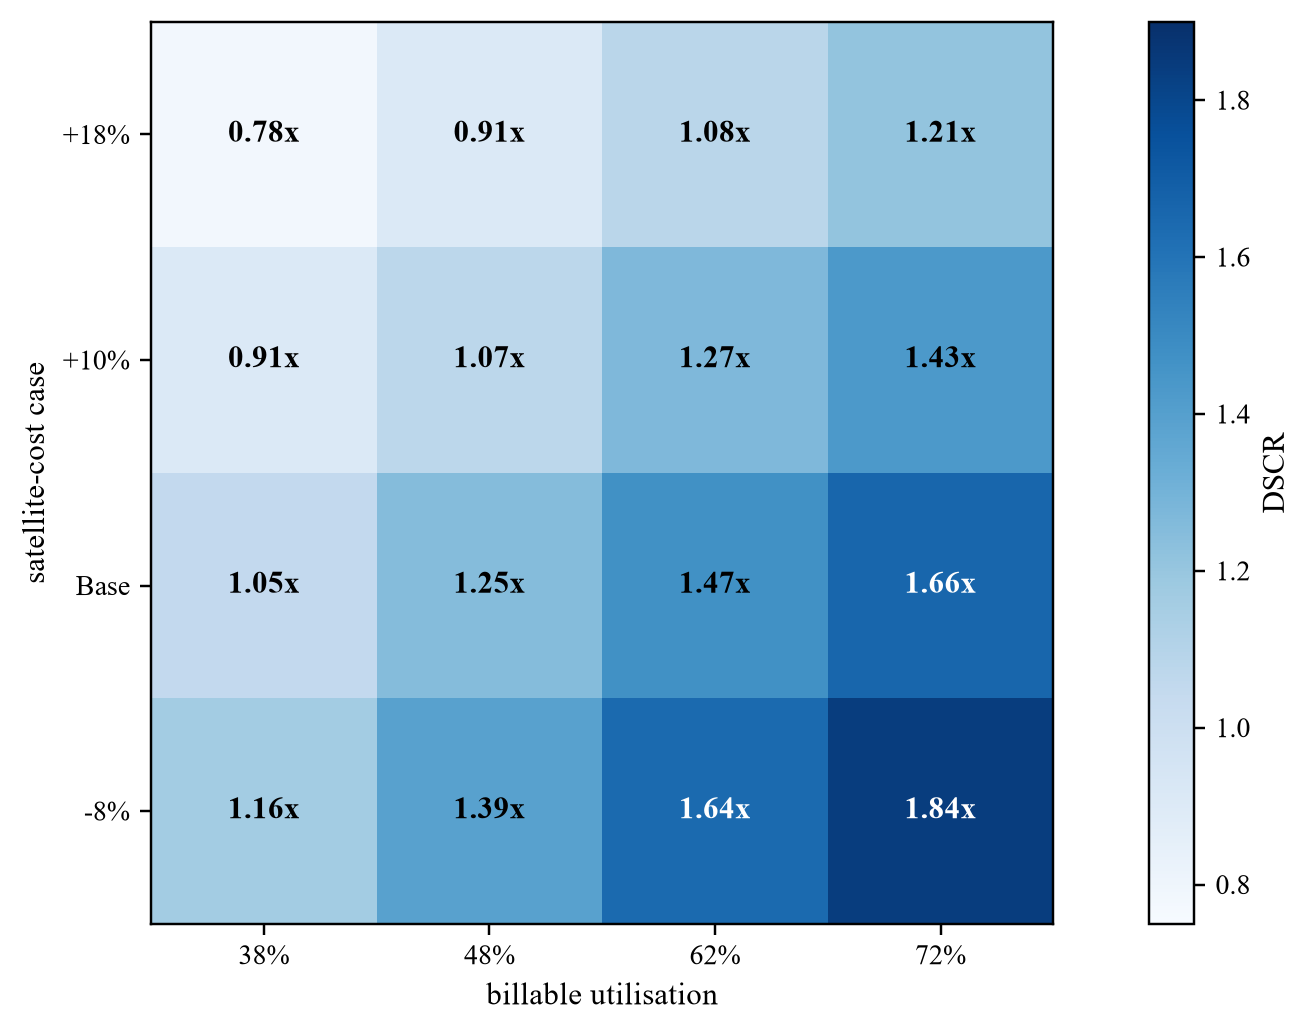
Wholly hypothetical; combined utilisation and satellite-cost cases.
26. Design covenants and reserves
Credit controls should identify deterioration before cash is exhausted and preserve funds for debt service, network, maintenance and refresh. [23][25][27][29] The analysis should identify the asset owner, operator, customer, payer, financier and party responsible for performance failure or remediation. A regional statistic can prioritise diligence. It cannot replace a contract, licence, technical test or bank receipt.
The evidence file should begin with minimum coverage, liquidity, concentration, accepted-node ratio, collections, outage, arrears, currency, reserve target, cash sweep and distribution lock. Each item should state its country and service scope, definition, effective date, expiry or refresh point, accountable owner and relationship to accepted service and collected cash. Public statistics, standards and policy documents provide context. Portfolio value requires node-level rights, lawful operation, utility and network evidence, executed customer obligations, measured performance and financial reconciliation.
The principal failure is that a single annual debt-service ratio allows operational weakness and concentration to develop unnoticed. The practical response is to use monthly operating and cash triggers with defined cure, hold and stop actions. Management estimates belong in a clearly identified model input register and should be replaced when observed evidence becomes available. Forecast changes should preserve the original case, the revised assumption, the source and the effect on utilisation, liquidity and debt coverage.
27. Protect step-in and recovery
Financiers need practical remedies when a supplier, customer, node, country or network path fails. [10][18][27][30] The analysis should identify the asset owner, operator, customer, payer, financier and party responsible for performance failure or remediation. A regional statistic can prioritise diligence. It cannot replace a contract, licence, technical test or bank receipt.
The evidence file should begin with security package, direct agreements, equipment title, software and data continuity, licence transfer, account control, relocation cost, alternate users and sale route. Each item should state its country and service scope, definition, effective date, expiry or refresh point, accountable owner and relationship to accepted service and collected cash. Public statistics, standards and policy documents provide context. Portfolio value requires node-level rights, lawful operation, utility and network evidence, executed customer obligations, measured performance and financial reconciliation.
The principal failure is that security is taken over assets and contracts that cannot transfer, move or operate after enforcement. The practical response is to test recovery routes net of consent, time, configuration, currency, tax and remarketing cost. Management estimates belong in a clearly identified model input register and should be replaced when observed evidence becomes available. Forecast changes should preserve the original case, the revised assumption, the source and the effect on utilisation, liquidity and debt coverage.
28. Reach the investment decision
Approval requires contracted anchor cash, lawful service, commissioned infrastructure, measured unit economics, controlled concentration, funded refresh and combined downside liquidity. [1][3][10][27] The analysis should identify the asset owner, operator, customer, payer, financier and party responsible for performance failure or remediation. A regional statistic can prioritise diligence. It cannot replace a contract, licence, technical test or bank receipt.
The evidence file should begin with investment memorandum, evidence ledger, contracts, technical acceptance, regulatory opinions, model, financing, security, scenarios and approval record. Each item should state its country and service scope, definition, effective date, expiry or refresh point, accountable owner and relationship to accepted service and collected cash. Public statistics, standards and policy documents provide context. Portfolio value requires node-level rights, lawful operation, utility and network evidence, executed customer obligations, measured performance and financial reconciliation.
The principal failure is that strategic urgency or regional digital growth replaces evidence for the specific portfolio. The practical response is to approve one node and customer cohort at a time with named owners, expiry dates and stop authority. Management estimates belong in a clearly identified model input register and should be replaced when observed evidence becomes available. Forecast changes should preserve the original case, the revised assumption, the source and the effect on utilisation, liquidity and debt coverage.
| Decision | Minimum evidence | Possible action |
|---|---|---|
| country entry | licence, entity, bank and currency route | enter, condition or defer |
| node release | site, power, network and permit | fund, resize or stop |
| service release | customer, acceptance and measured path | launch, redesign or hold |
| debt draw | eligible collected cash and coverage | draw, reduce or block |
| next cohort | acceptance, concentration and liquidity | expand, relocate or stop |
Proposed governance; each approval records evidence, owner and expiry.
Sources
- International Telecommunication Union, *The State of Broadband in Africa 2025*. Read the primary source
- International Telecommunication Union, *Measuring Digital Development Facts and Figures 2025*. Read the primary source
- GSMA, *The Mobile Economy Africa 2025*. Read the primary source
- GSMA, *The State of Mobile Internet Connectivity 2025 Network Coverage and Infrastructure*. Read the primary source
- International Telecommunication Union, *ICT Price Baskets*. Read the primary source
- World Bank, *From Connectivity to Services Digital Transformation in Africa*. Read the primary source
- African Union, *Digital Transformation Strategy for Africa 2020 to 2030*. Read the primary source
- African Development Bank, *Nigeria Digital Value Chain Infrastructure Project BRIDGE*. Read the primary source
- Orange and Eutelsat, *Strategic Partnership to Accelerate Satellite Internet in Africa and the Middle East*, 4 March 2025. Read the primary source
- International Telecommunication Union, *Regional Initiatives for Africa 2025 Satellite Regulation Training*. Read the primary source
- International Telecommunication Union, *Economic and Policy Aspects of High-Speed Internet Connectivity by Retail Satellite Operators*. Read the primary source
- ETSI, *Multi-access Edge Computing*. Read the primary source
- 3GPP, *Specifications*. Read the primary source
- ITU-T Recommendation Y.1541, *Network Performance Objectives for IP-based Services*. Read the primary source
- Internet Society, *Internet Resilience Index*. Read the primary source
- International Energy Agency, *World Energy Investment 2025 Africa*. Read the primary source
- World Bank, *Mission 300*. Read the primary source
- International Finance Corporation, *Environmental Health and Safety Guidelines for Telecommunications*. Read the primary source
- International Finance Corporation, *General Environmental Health and Safety Guidelines*. Read the primary source
- National Institute of Standards and Technology, *Cybersecurity Framework 2.0*. Read the primary source
- ISO, *ISO IEC 27001 Information Security Management Systems*. Read the primary source
- IFRS Foundation, *IFRS 15 Revenue from Contracts with Customers*. Read the primary source
- IFRS Foundation, *IFRS 9 Financial Instruments*. Read the primary source
- IFRS Foundation, *IAS 16 Property Plant and Equipment*. Read the primary source
- IFRS Foundation, *IAS 36 Impairment of Assets*. Read the primary source
- IFRS Foundation, *IFRS 16 Leases*. Read the primary source
- World Bank Group, *Public Private Partnership Contractual Provisions*. Read the primary source
- Private Infrastructure Development Group, *Emerging Africa and Asia Infrastructure Fund*. Read the primary source
- African Development Bank, *USD 100 Million Loan to EAAIF*, 12 November 2025. Read the primary source
- African Development Bank, *Partnership with AXIAN Telecom*, 29 January 2025. Read the primary source
- GSMA, *Mobile Privacy Principles*. Read the primary source
- International Telecommunication Union, *Quality of Service and Quality of Experience*. Read the primary source
- World Bank, *Africa Regional Connectivity*. Read the primary source
