

1. Define the financing decision
The first decision is whether a specified portfolio can support committed capital under stated downside conditions. The decision is not whether a map contains settlements with low visible electrification. It asks which sites have sufficient legal, commercial, technical and social evidence to enter development, which can receive construction funding, and which should remain options. The financing perimeter must identify the project companies, assets, licences, customer rights, subsidy entitlements, debt obligations and controlled accounts.
Mission 300 combines grid extension, renewable mini-grids and standalone systems and seeks electricity access for 300 million people in Africa by 2030 [1,2]. The IEA reports that about 600 million people in sub-Saharan Africa lacked access in 2024 and identifies financing as a central constraint [3,4]. Those continental facts establish scale. They do not prove that a particular settlement produces financeable cash flow. Each investment still needs site-level evidence.
The credit paper should state the decision date, data cut-off, eligible countries, targeted service tier, construction sequence, sources and uses, grant conditions, debt terms, foreign-exchange treatment and required coverage. It should also state what would cause rejection, redesign, delay or a lower debt amount. A model that only ranks sites has not completed the financing task.
| Gate | Required evidence | Decision | Financing consequence |
|---|---|---|---|
| Screen | Current spatial sources, grid plan, settlement and anchor hypotheses | Enter field diligence or reject | Development budget only |
| Validate | Rights, survey, customer commitments, load tests and community process | Fix design and commercial case | Conditional construction allocation |
| Finance | Permit path, contracts, subsidy eligibility, costs, accounts and downside model | Commit debt and equity | Controlled disbursement by cohort |
| Expand | Operating demand, collections, service quality and asset performance | Add connections or capacity | Release expansion tranche |
The framework separates screening evidence from conditions required for capital release.
2. Use geospatial evidence as a screen
Geospatial analysis can combine settlement extent, estimated population, buildings, roads, public facilities, mobile coverage, agricultural activity, terrain, solar resource and distance to existing or planned networks. It gives the developer a consistent way to compare a large area before expensive fieldwork. The World Bank identifies geospatial planning as a core tool for integrated electrification and notes that machine learning can support better demand estimates and technology selection [7,8].
The screen should preserve the raw observation, its date, resolution, licence, model transformation and uncertainty. A bright night-time pixel may indicate grid power, diesel generation, a commercial facility, gas flaring or reflected light. A building footprint does not establish occupancy. A population raster redistributes census or survey estimates and may miss seasonal movement. A road indicates access, not year-round logistics. The model should retain these distinctions instead of collapsing them into one opaque score.
A site can proceed to field validation when multiple independent indicators support a coherent hypothesis. The screen should also search for exclusion signals: planned grid arrival, protected areas, insecure access, flood exposure, dispersed settlement, weak mobile payment coverage or an anchor whose operating status is uncertain. Rejected and deferred sites remain part of the audit trail.
3. Freeze the site universe and legal geography
The portfolio needs a dated site register with coordinates, administrative boundaries, land status, proposed service area and model version. Boundaries matter because licensing, tariff approval, subsidy eligibility, environmental review and grid-arrival rules differ by country and can differ within a country. The lender should be able to connect every site in the financial model to a legal entity and an approval path.
Site substitution requires control. A developer may replace a difficult location with another that appears similar in the ranking. The replacement may have different land rights, logistics, customers, grant eligibility or political exposure. The financing documents should define permitted substitutions, evidence requirements, aggregate limits and lender or grant-provider consent.
National electrification plans should be reconciled with the portfolio. The Global Electrification Platform and related tools support least-cost planning [9]. Country plans can change as network economics, public budgets and demand evolve. The developer should obtain the latest available grid-extension information from the responsible authority and document the date and reliability of that information. No map can guarantee that the main grid will not arrive.
4. Build a source and lineage register
Every feature used in site selection should have a source owner, publication date, spatial resolution, coverage, licence, update cycle, known limitation and transformation log. The register should distinguish authoritative administrative or utility data from modelled datasets and volunteered geographic information. It should identify whether the financing parties may store, transform, disclose and continue using each dataset after financial close.
WorldPop combines census and official population estimates with remotely sensed and geospatial covariates and uses modelling to distribute population at high spatial resolution [18,19]. Such datasets are useful because they provide consistent coverage. Their modelled nature creates uncertainty that should be carried into site selection. The same discipline applies to building footprints, facility lists and night-time lights.
Model lineage should record the code version, features, training data, spatial joins, missing-value treatment, exclusions and score generated for each site. The lender does not need to own the model. It needs a reproducible explanation of how evidence became a capital decision and how a material error would be detected.
The register should also identify temporal mismatch. Population estimates, road layers, grid plans, facility registers and satellite scenes may describe different years. Combining them can create a map that appears current even when its components are not. Each site should carry a data-vintage profile and a materiality judgement. A recently expanded settlement may be understated by an older population surface. A facility marker may remain after closure. A new distribution line may be absent from open mapping. Field teams should prioritise sites where model value is sensitive to stale or conflicting inputs.
Data procurement needs its own budget and continuity plan. Commercial imagery, mobile-derived indicators or proprietary building data can improve resolution while creating recurring fees, contractual limits and vendor dependency. The operating company should know which data are required only for initial screening and which are needed for continuing monitoring, grant verification or expansion. A lender should not assume that an expensive dataset will remain available throughout the debt tenor unless rights and funding are secured.
| Evidence layer | Principal use | Required validation | Material failure mode |
|---|---|---|---|
| Population and settlement | Connection hypothesis | Field count, occupancy sample and local register | Modelled people treated as paying customers |
| Buildings and land use | Network layout and load nodes | Ground survey and asset classification | Roof or structure misclassified as occupied demand |
| Night-time lights | Existing energy and activity signal | Source attribution and operating-hours check | Grid, diesel and commercial light confused |
| Roads and terrain | Logistics and distribution cost | Seasonal access and route survey | Dry-season access assumed year-round |
| Public facilities | Anchor-load hypothesis | Authority confirmation, equipment list and budget | Facility exists but cannot contract or pay |
| Grid plans | Arrival and interconnection scenario | Utility or agency confirmation and dated plan | Obsolete plan treated as commitment |
Data resolution and freshness should match the decision made at each gate.
5. Quantify population uncertainty
Population is often a denominator for connection targets, grant calculations and average demand. It should not be a single precise input. The developer should compare available population surfaces, census or administrative counts, building observations and field enumeration. Differences should be reported by settlement and linked to design sensitivity.
The project model should distinguish residents, households, occupied structures and serviceable connections. Household size varies. Some structures may be seasonal, shared or non-residential. The distribution network may not reach every resident within the initial budget. A connection forecast should start from verified premises and customer acquisition rather than a raster total.
The financing case can use a range. The low case reflects confirmed occupied premises and conservative household conversion. The central case includes supported additions. The expansion case remains contingent on operating evidence. Debt should be sized against the case that retains coverage after reasonable uncertainty, while modular capacity protects upside.
6. Read economic activity without overstating it
Remote signals can identify markets, irrigation, milling, cold storage, telecom towers, workshops and transport corridors. These features help locate productive-use opportunities. They do not establish equipment ownership, operating hours, margins, seasonality, credit quality or willingness to sign a power contract.
Night-time light data can add information about existing activity and energy use, while its interpretation requires care [20]. A lender should expect the developer to distinguish persistent signals from transient or unrelated light sources. Land-cover and crop patterns can guide agricultural demand hypotheses, but fieldwork must establish crop calendar, water access, throughput, buyer relationships and the economics of electric equipment.
The model should assign every productive-load assumption to an identifiable activity, equipment specification, operating schedule, tariff, ramp period and evidence owner. Broad claims that electrification creates growth belong in the development rationale. Debt capacity depends on cash-generating customers and credible adoption plans.
7. Verify anchor customers
Clinics, schools, water systems, telecom towers, public offices and commercial processors can stabilise demand. Their value depends on contracting authority, budget, credit support, load shape, backup requirements and payment process. A facility list or map marker is only a lead.
Anchor diligence should confirm legal identity, decision rights, historic energy expenditure, equipment, service requirement, metering, procurement route, payment source and termination rights. A public facility may have essential demand and delayed payment. A telecom customer may require high availability and penalties. An agricultural processor may operate intensely for a short season.
The project should avoid counting the same anchor twice through separate datasets. Signed interest without an approved budget should remain contingent. A binding contract can enter contracted demand only after conditions are understood. Anchor concentration also needs a downside case because one large customer can dominate early cash flow.
8. Ground-truth the demand hypothesis
Field validation should test occupancy, appliance ownership, current energy spending, operating hours, seasonal migration, enterprise activity, productive equipment, payment channels and attitudes to tariffs. Sampling should cover different settlement zones and customer types. The methodology should explain selection, non-response and how results are scaled.
Community engagement provides evidence that cannot be inferred remotely. It can identify land claims, excluded groups, seasonal livelihoods, local institutions, security issues and prior project experience. It also helps the developer explain service limits, tariffs, connection costs, grievance mechanisms and the distinction between a survey and a commitment.
Survey answers should be compared with observable behaviour and transaction evidence where lawfully available. Stated willingness to pay can exceed actual consumption after connection. Current spending on candles, diesel or phone charging does not translate mechanically into electricity revenue. The model should use adoption and usage cohorts and retain uncertainty.
9. Separate access, connections and kilowatt-hours
An access target measures a development outcome. A connection count measures customers attached. Revenue depends on energy consumed, tariff, metering, collection and losses. These quantities should never be substituted for one another. The Multi-Tier Framework assesses capacity, duration, reliability, quality, affordability, legality and safety rather than treating access as a binary condition [17].
The technical and financing case should specify the intended service tier for households, enterprises and public facilities. A low initial consumption level can satisfy basic access while producing limited contribution to fixed costs. Productive use can improve asset utilisation but may require financing for appliances and customer support.
The lender should reconcile the connections funded by grants, the active meters generating revenue and the service obligations attached to each. Dormant or disconnected accounts should not remain in the demand base. Reporting should preserve both development and credit metrics.
10. Forecast adoption by cohort
Customer acquisition should be modelled from verified serviceable premises through application, connection, activation and continuing use. Each stage needs a conversion rate, timing, cost and evidence source. Households, micro-enterprises, anchors and productive users should have separate curves.
Early adopters can have higher income or stronger demand than later cohorts. Extrapolating their use can overstate the portfolio. The forecast should compare similar operating sites and explain differences in tariff, service, customer mix and local economy. A model trained on mature sites should not treat a new settlement as mature on day one.
Expansion capital should follow defined evidence: active meters, collections, peak load, daytime utilisation, outage performance and a verified pipeline of new customers. This creates an option to add capacity when demand appears without forcing the initial debt case to fund speculative load.
11. Build productive use from transactions
Productive-use demand should be constructed from equipment and business economics. A mill, cold room, irrigation pump or welding shop has a rated load, operating schedule, seasonal profile, utilisation limit, financing need and revenue source. The electricity bill must fit the customer’s gross margin and cash cycle.
The World Bank’s mini-grid work emphasises productive uses and customer engagement as drivers of higher-quality service and lower unit cost [5,6]. The Nigeria programme combined geospatial analysis, portfolio preparation, technical standards and appliance-market support [16]. These examples support an integrated approach. They do not establish performance for the hypothetical portfolio.
The developer should identify who finances appliances, bears repossession or technology risk, services equipment and manages default. Appliance credit can accelerate demand while adding another receivable. The project-finance model should not recognise productive-load revenue before the equipment, customer finance and operating plan are credible.
12. Test affordability and collection
Affordability links tariff, consumption, connection charge, appliance finance and household or enterprise cash flow. The model should show bills by customer segment and compare them with observed energy spending and income seasonality. A tariff can recover cost in theory and still produce low consumption or non-payment.
Prepayment reduces receivables but does not remove demand risk. Mobile-money interruptions, agent liquidity, customer identification, meter failure and disputed balances can affect cash. The lender should examine collection data at operating sites, including dormant accounts, reversals, arrears, refunds and concentration.
Subsidies can lower the capital recovered through tariffs. Their eligibility, verification, timing, currency and disbursement conditions must be explicit. The central case should not use an uncommitted subsidy. A delayed grant can create a construction or liquidity gap even when it is ultimately paid.
Collection should be analysed as a process rather than one percentage. The project needs meter availability, vending channels, customer cash-in, successful payment allocation, reversals, refunds, fraud monitoring and settlement to the controlled bank account. Each step has timing and failure risk. A headline prepayment ratio can conceal inactive meters or customers who purchase only intermittently. The credit case should show active customers, median purchase frequency, consumption distribution and the share of revenue concentrated in anchors or a small number of enterprises.
Affordability stress should combine lower household income, seasonal agricultural receipts, higher connection charges and changes in productive-use margins. A customer may remain connected while reducing consumption below the level assumed in the financial model. Service-quality failures can produce the same outcome. The project should maintain a customer-protection process that distinguishes genuine affordability constraints, technical disputes and deliberate non-payment and assigns remedies that comply with local law.
13. Translate demand into technical design
The design should follow the load profile, required reliability, renewable resource, storage duty, backup strategy, distribution length, voltage, losses and expansion plan. Nameplate capacity alone does not establish service. The model should cover hourly and seasonal operation and test cloudy periods, equipment outages and demand growth.
Overbuilding raises capital cost and idle capacity. Underbuilding damages reliability and can suppress productive demand. Modular solar, storage and distribution extensions provide flexibility when procurement, standardisation and site access support later installation. The expansion interface should be designed at the outset.
Technical advisers should reconcile the bill of quantities, energy model, warranties, spares, maintenance plan, remote monitoring and replacement schedule. Storage degradation and inverter replacement affect long-term cash. ESMAP has supported storage analysis and financing alongside mini-grid programmes [26].
14. Phase capital against evidence
The hypothetical portfolio contains twenty-four sites, 7.2 MW of solar generation and 18 MWh of storage. Initial connections are 11,800. Total capital expenditure is USD 28 million. These figures are management assumptions created solely to demonstrate the framework.
Phase one funds civil works, distribution backbone and initial generation for sites with verified rights, anchors and customer evidence. Phase two adds connections and modular capacity after activation and collection tests. Phase three supports productive-use growth and resilience upgrades. A site that misses its gate can be deferred without preventing the strongest cohort from proceeding.
The financing agreement should define cohort eligibility, cost variance, substitution, completion tests and retained amounts. A portfolio contingency should remain available for genuine common risks rather than automatically covering a weak site. Evidence-based phasing can reduce stranded capacity while preserving expansion options.
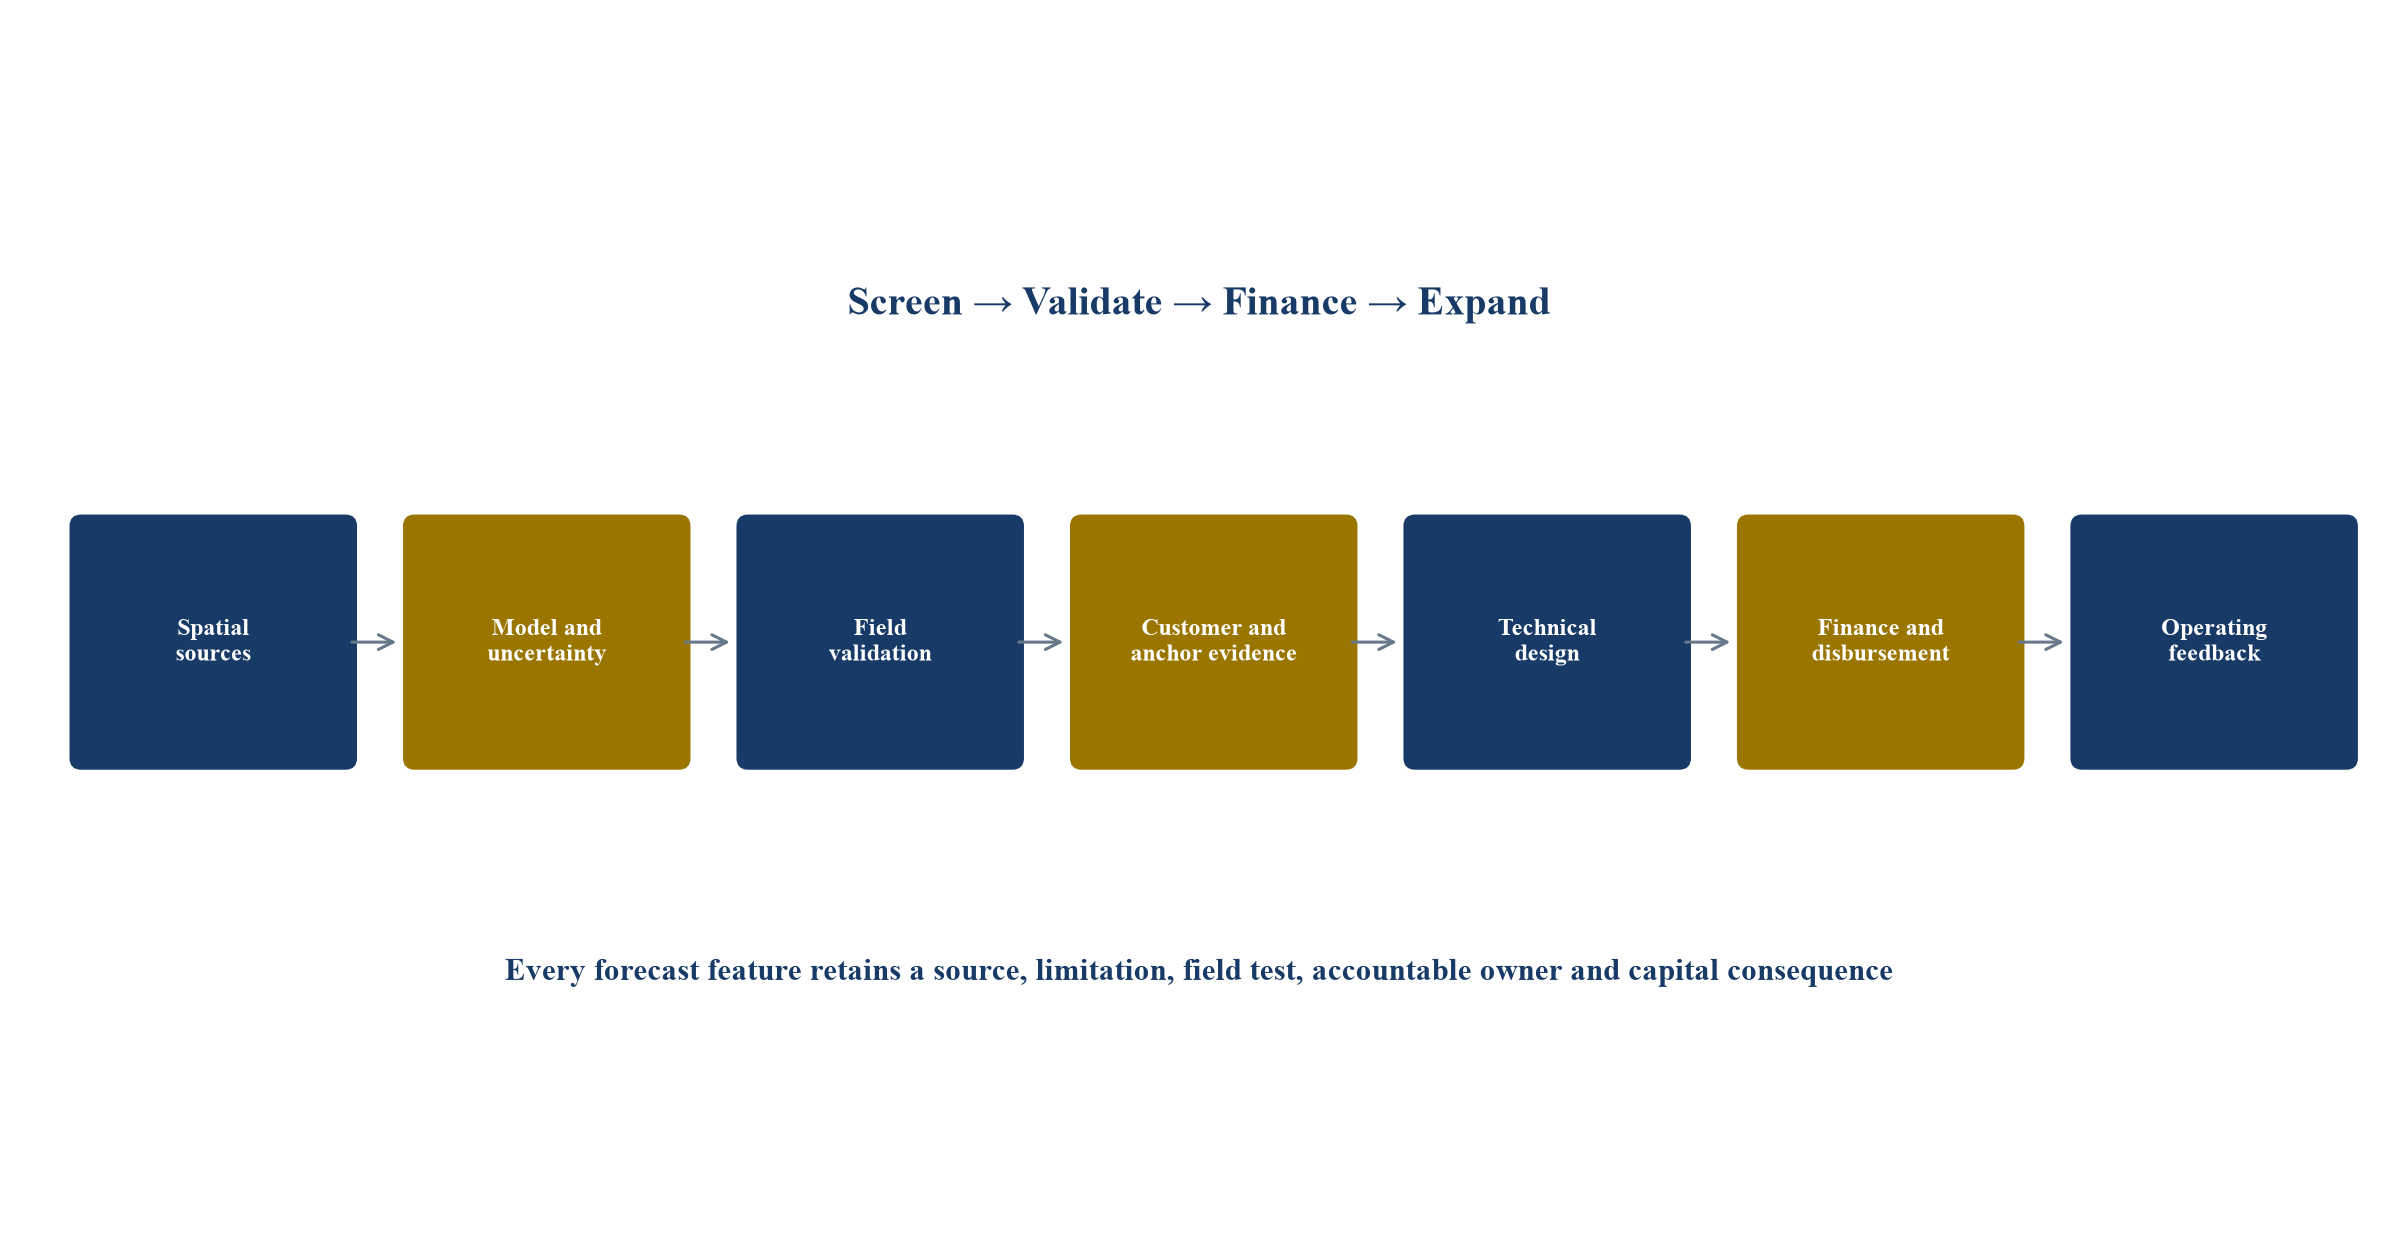
Proposed control sequence. Spatial evidence creates a field hypothesis; capital follows verified legal, commercial, technical and cash evidence.
15. Model main-grid arrival
Grid arrival can create interconnection, compensation, conversion or stranded-asset risk. The treatment depends on the country’s rules, licence and contract. The lender should obtain the latest plan, assess implementation credibility and model several dates rather than rely on a static distance buffer.
The developer should know whether the mini-grid may interconnect, become a distribution franchise, sell assets, receive compensation or continue independently. Technical design can preserve options through compatible voltage, protection, meters and records. Contractual provisions should allocate the consequences of public-plan changes.
A site with high demand and likely grid arrival may still be valuable under an interconnection case. A remote site may face low arrival risk and high logistics cost. The portfolio model should price both. Legal advice is required for each jurisdiction and should not be replaced by a generic continental assumption.
16. Underwrite regulation and customer protection
Licensing thresholds, tariff approvals, service standards, land rights, environmental requirements, metering rules, consumer protection and grid-arrival treatment affect revenue and enforceability. The project register should state the authority, application, condition, renewal, reporting and consequence of breach for each site.
The African Development Bank’s mini-grid programmes address enabling environments, regulation, financing templates, results-based finance and ESG controls [11,12]. These initiatives can improve market readiness. The transaction still needs jurisdiction-specific evidence and a schedule that links approvals to disbursement.
Customer documents should explain tariff, connection charge, service level, prepayment, disconnection, data use, complaints and changes. Remote monitoring and digital payments create personal-data and cyber responsibilities. The project should apply applicable law and proportionate security, retention and access controls.
17. Rebuild capital cost and logistics
Capital expenditure should be built from quantities, supplier terms, freight, duties, inland transport, civil works, distribution, meters, development cost, owner’s cost, taxes, contingency and financing cost. A per-site average can conceal long distribution lines, difficult terrain or fragile logistics.
The geospatial model can estimate route length and terrain. A field survey must confirm access, rights of way, seasonal conditions and construction methods. Procurement should address supplier concentration, warranty enforcement, spare parts, currency, delivery security and local service capability.
Contingency should be tied to identified uncertainty. It is not a substitute for incomplete design. Cost overruns above a threshold should require equity, scope change or a formal re-underwriting rather than automatic debt expansion.
18. Choose site, portfolio and company risk deliberately
A portfolio can diversify weather, customer and operating risk while creating cross-default and governance complexity. Site cash may sit in local companies, while debt is raised at a holding or financing vehicle. The lender must trace ownership, security, permits, customer contracts, cash accounts and distributions.
The structure should define which risks remain site-specific and which are shared. A weak site should not consume unrestricted cash indefinitely. Conversely, rigid ring-fencing can prevent efficient maintenance and liquidity support. The documents can use site-level reporting, minimum performance gates and controlled portfolio transfers.
Standardised design, procurement, contracts and data can reduce diligence and operating cost. The World Bank and IFC have promoted portfolio approaches to move beyond one-off projects [10,15]. Scale creates value only when the portfolio retains evidence by site.
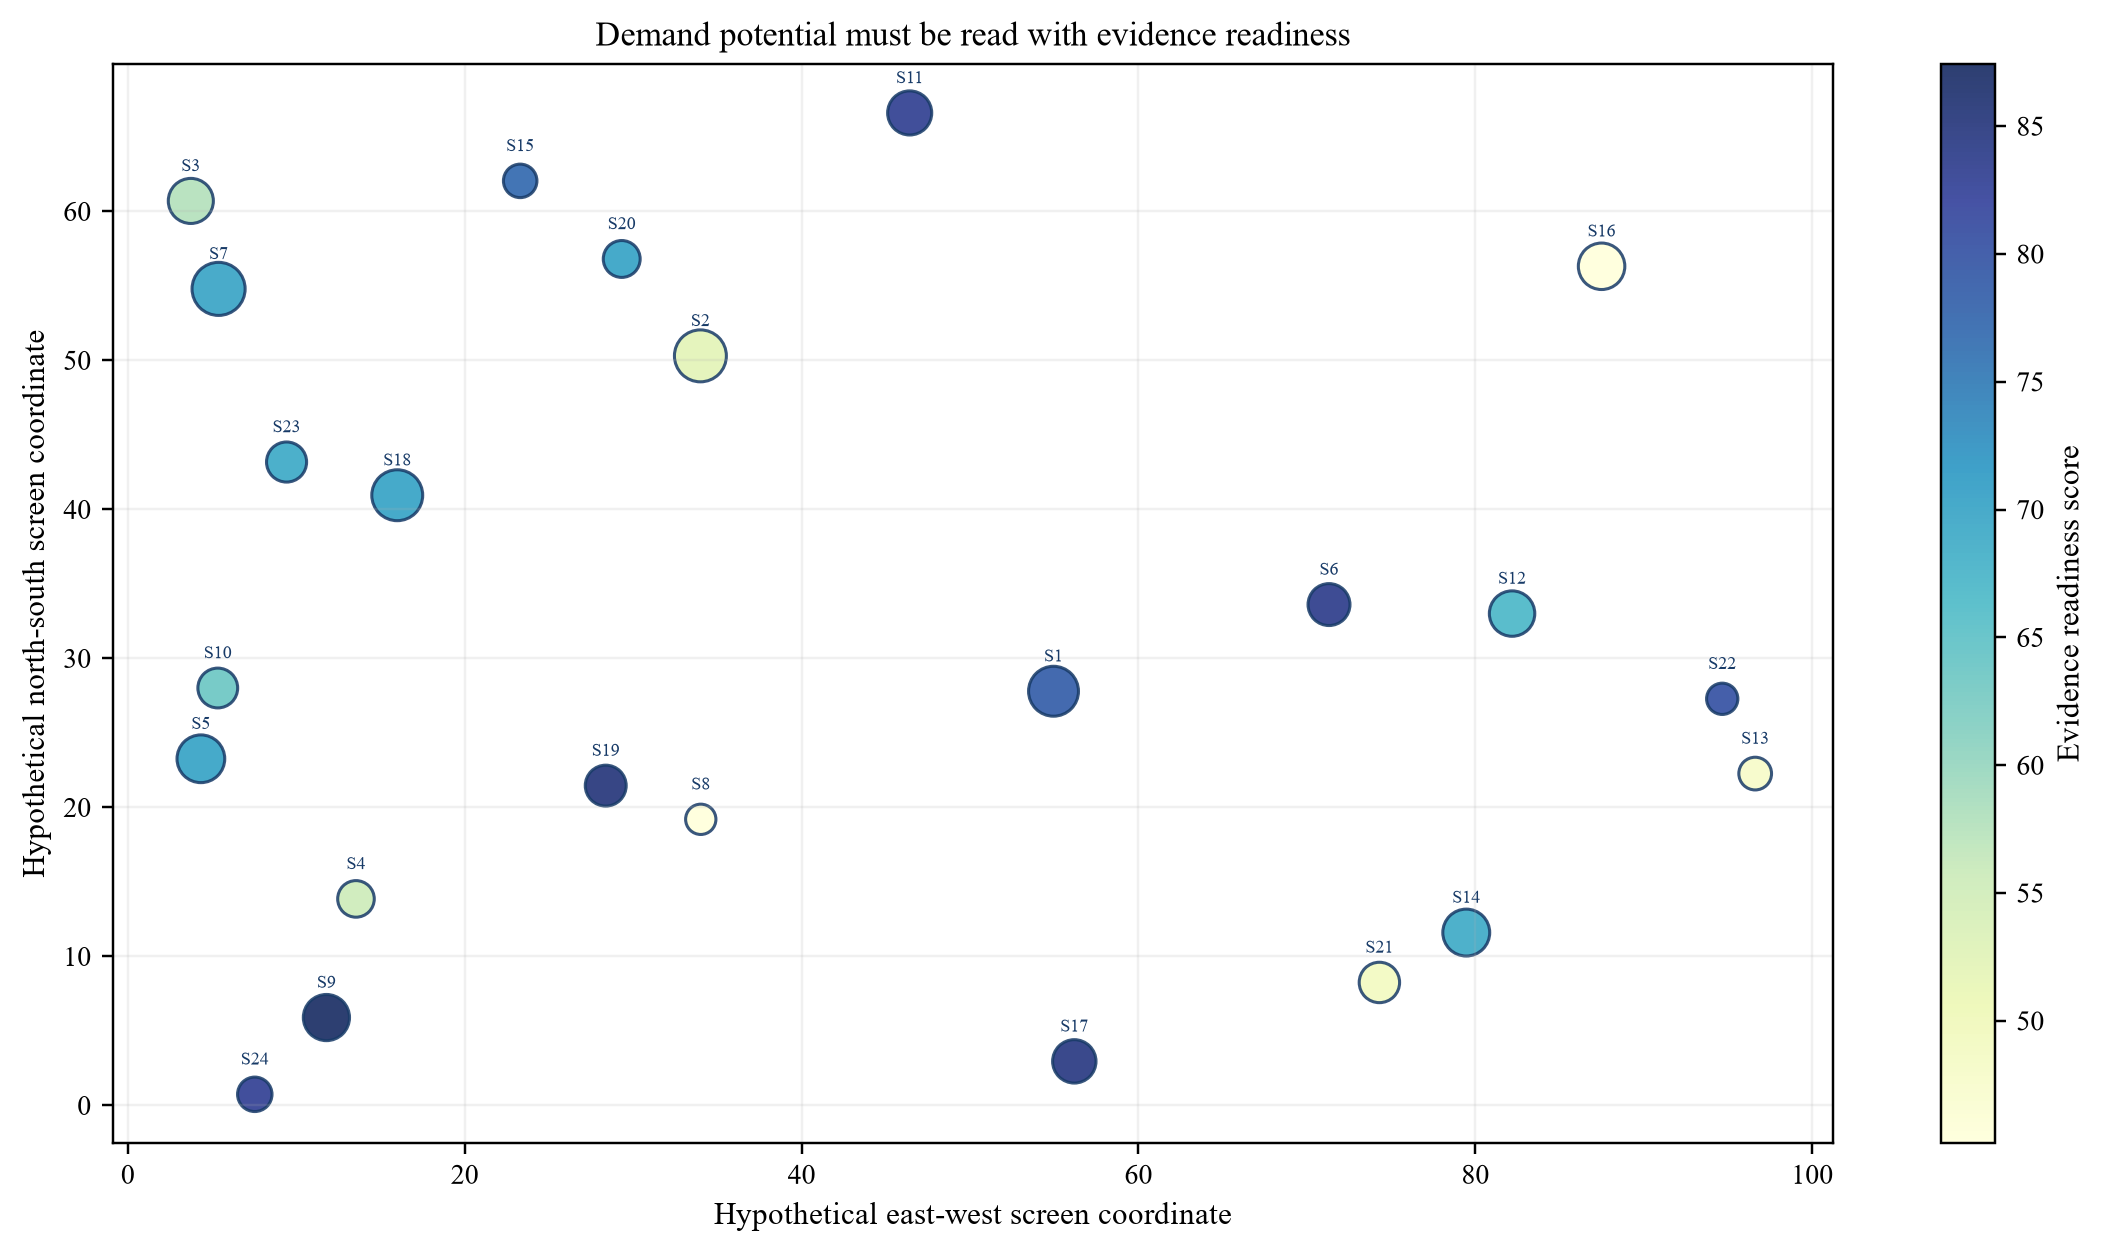
Abstract coordinates do not represent real locations. Bubble size shows management-estimated year-four demand; colour shows evidence readiness.
19. Match blended capital to distinct risks
The hypothetical sources comprise an USD 8 million results-based grant, USD 12 million of senior debt and USD 8 million of equity. The allocation is illustrative. Equity absorbs development, demand and completion risk. Grants support affordability and access outcomes subject to verification. Senior debt funds assets after conditions and downside coverage are established.
The IEA reports limited private finance for electricity access and a continuing role for public and concessional capital [3,4]. SEFA uses technical assistance, results-based financing, loans and equity to close viability gaps [13]. The Facility for Energy Inclusion was designed to support small-scale renewable and mini-grid projects [14]. These sources show available instrument types, not committed funding for the hypothetical portfolio.
Each source needs a use, currency, availability period, condition, repayment or outcome obligation and loss-bearing position. A blended structure should not hide an uneconomic tariff or unverified demand. It should allocate public support to measurable access and affordability outcomes while preserving operating incentives.
The financing plan should identify the risk each instrument can reasonably bear. Development grants can fund early surveys, designs and regulatory work that cannot support commercial debt. Results-based grants can reduce the recoverable capital base after verified outputs. Concessional debt can lengthen tenor or reduce pricing where the project produces defined development value. Commercial debt should enter only where repayment evidence and enforcement support it. Equity remains responsible for development, completion and residual risk. Mixing these instruments without explicit allocation makes it difficult to see who absorbs delay, cost overrun, demand shortfall or grant rejection.
Disbursement should follow a common conditions matrix. Separate financiers may require different environmental reviews, procurement steps, customer definitions and reporting. The project company needs one reconciled programme that satisfies each source without double counting the same connection or asset. Conditions that depend on another financier should be identified before commitment. A funding plan that closes on paper can still fail if one source cannot disburse when another expects matching capital.
| Sources | USD million | Uses | USD million |
|---|---|---|---|
| Results-based grant | 8.0 | Generation and storage | 13.0 |
| Senior debt | 12.0 | Distribution and meters | 7.0 |
| Equity | 8.0 | Development, logistics and owner costs | 4.0 |
| Working capital, reserves and contingency | 4.0 | ||
| Total | 28.0 | Total | 28.0 |
Management assumptions in USD million. The table is illustrative and does not represent committed financing.
20. Make results-based finance cash-real
Results-based funding may depend on verified connections, service quality, equipment, location, customer class or continuing operation. The financing model should reflect the verification period, rejection risk, evidence cost, currency and payment date. A grant receivable is not construction cash until the conditions and bridge are funded.
The developer should maintain a connection evidence chain from approved site and customer to installed meter, commissioning, activation, service and independent verification. Duplicate, dormant or ineligible connections should be excluded. Personal data should be minimised and protected.
If debt bridges a grant, the facility needs a borrowing base, evidence cut-off, ageing, reserve and repayment path. Equity should cover rejected or delayed claims beyond agreed limits. Grant rules and debt documents should use compatible definitions.
21. Control currency and convertibility
Equipment and debt may be denominated in hard currency while tariffs are collected locally. Currency depreciation can raise debt service, spare-parts cost and battery replacement without increasing affordable tariffs. The model should map currency by revenue, operating cost, capital cost, reserve and financing obligation.
Mitigants can include local-currency debt, concessional tenor, indexed components where lawful and affordable, reserves, phased procurement and carefully sized hedging. Each has a cost. An indexation right does not prove that customers can pay or the regulator will approve the adjustment.
Convertibility and transfer risk should be separated from exchange-rate risk. The project needs bank-account, cash-transfer, tax and distribution analysis by jurisdiction. Debt capacity should follow cash that can legally and practically reach the borrower.
22. Build the cash waterfall and downside cases
In the hypothetical central case, year-four revenue is USD 6.9 million, EBITDA is USD 2.6 million and cash available for debt service is USD 2.1 million. Annual debt service is USD 1.45 million, producing coverage of about 1.45 times. These are management assumptions and not a forecast.
The combined downside assumes seventy per cent of central demand, eighty-two per cent collection efficiency and a twelve per cent capital-cost overrun. Under the illustrative model, coverage falls below one times. The result shows that site ranking alone cannot support the proposed debt. The response is to phase capacity, verify anchors, protect grant timing, increase reserve funding and lower debt if evidence remains weak.
The waterfall should deduct taxes, operating cost, maintenance, battery reserve, working capital and required capital before debt service. It should show monthly liquidity during construction and ramp-up. Portfolio cash transfers, reserve draws and distribution tests require clear priority.
Revenue sensitivity should remain granular. Household consumption, anchor contracts and productive-use demand respond differently to price, reliability and economic activity. A single demand haircut can obscure a severe loss of high-margin daytime load or the failure of one anchor that supported the original battery and generation design. The lender should test customer mix, load shape and collection together. Technical consequences matter because lower demand may leave assets underused, while a shift in peak demand can require additional capacity even when annual energy remains close to plan.
Operating-cost sensitivity should cover field staff, security, vegetation management, communications, payment fees, spare parts, insurance, battery augmentation and emergency logistics. Some costs are fixed by site and do not fall when demand is weak. A geographically dispersed portfolio can diversify revenue and increase service expense. The model should distinguish cost savings that management can implement quickly from structural obligations that remain through the stress period.
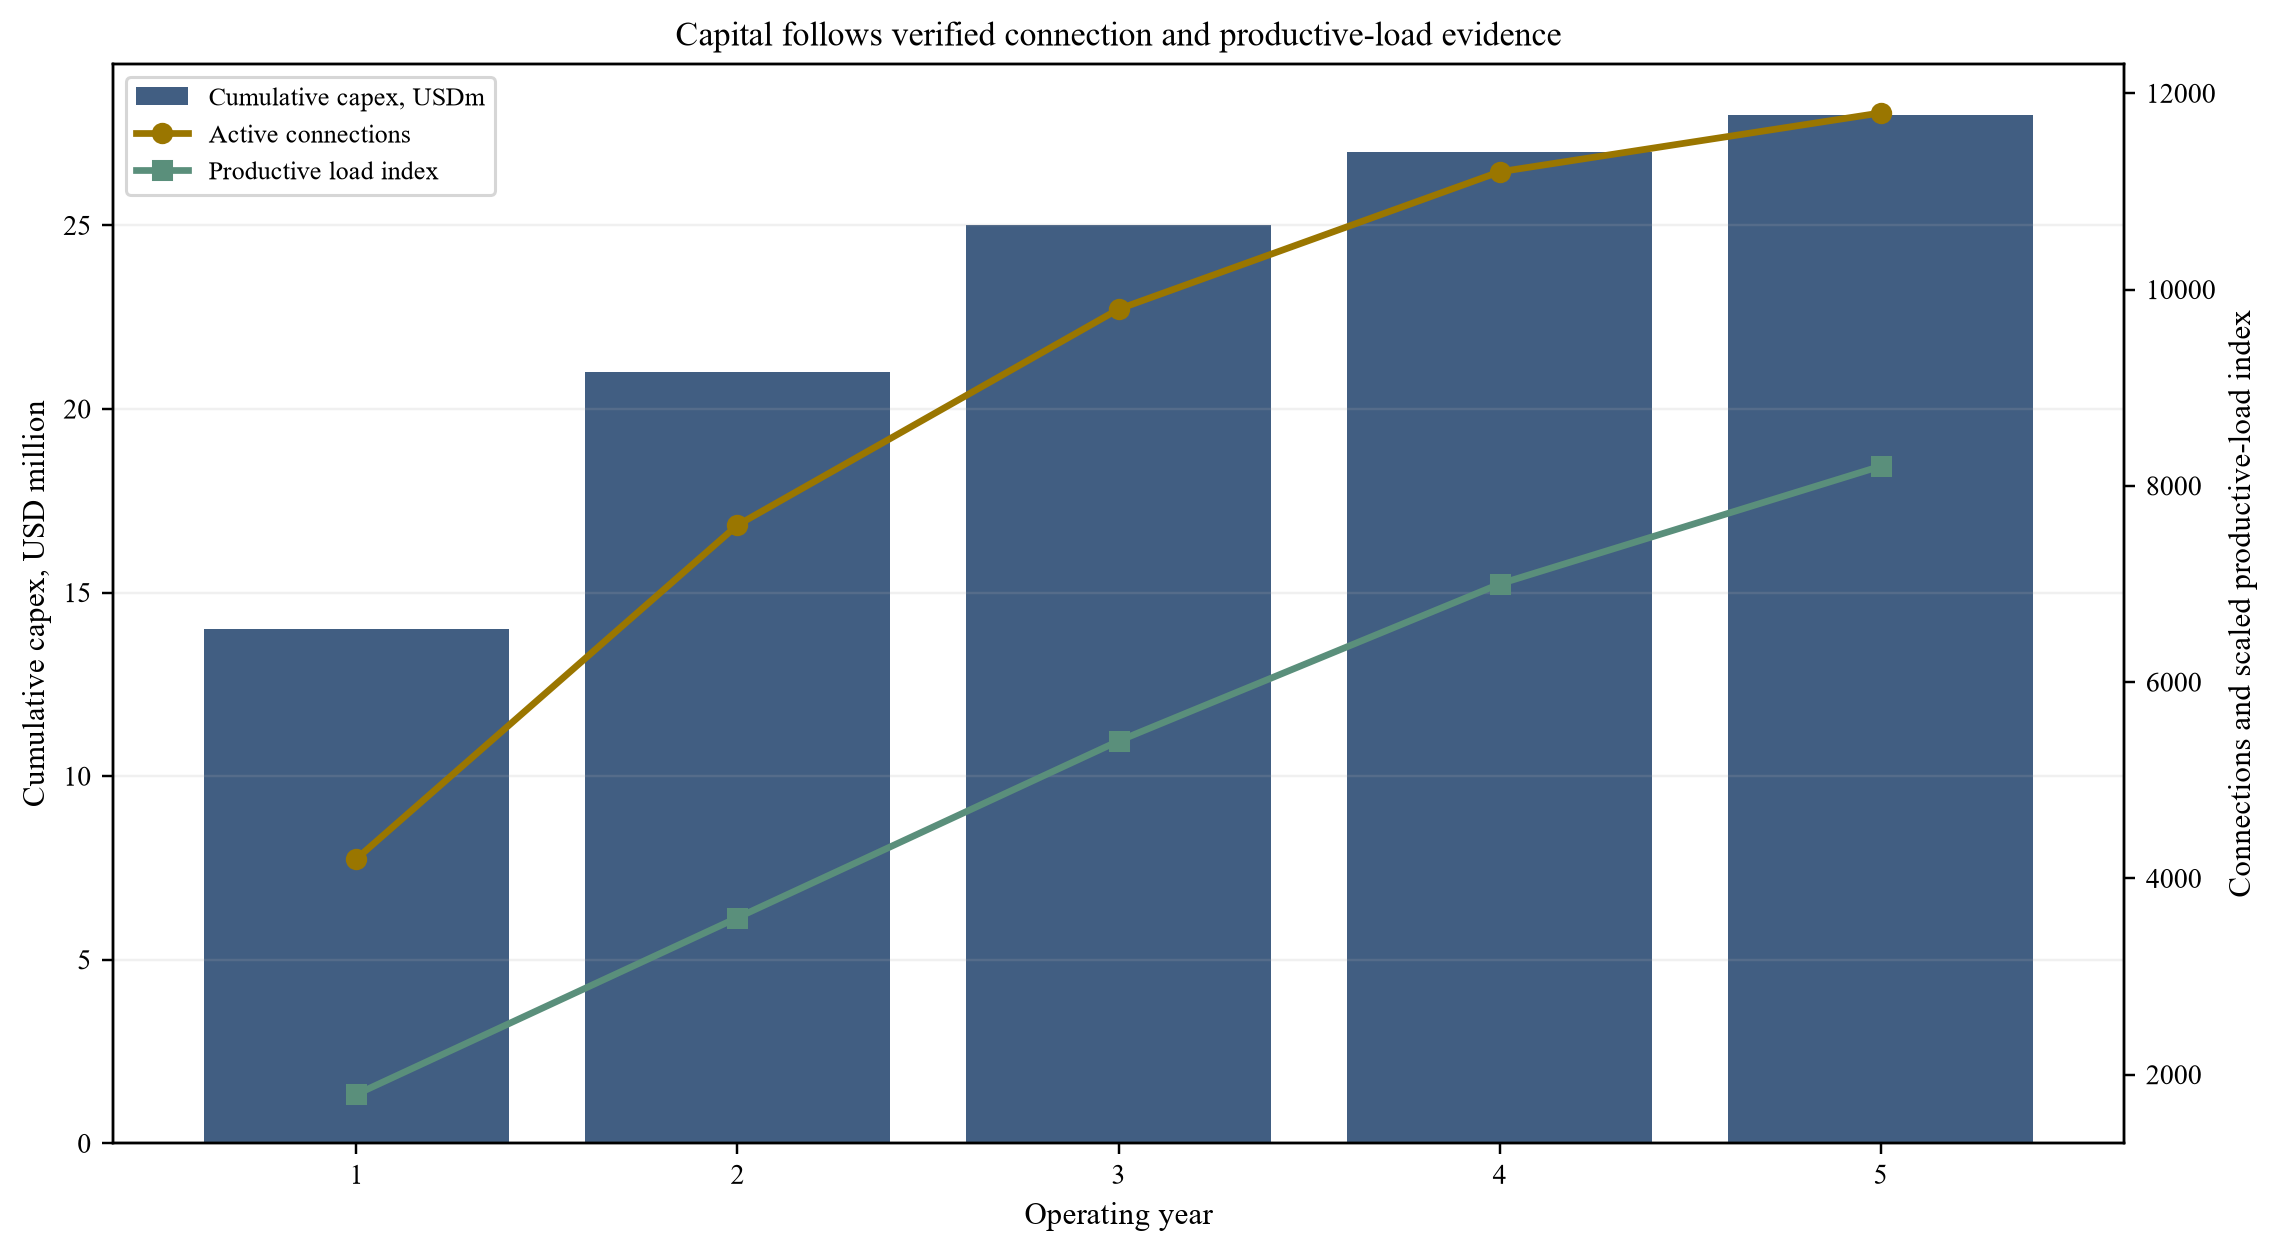
Management assumptions. Bars show cumulative capital deployed; lines show active connections and productive load.
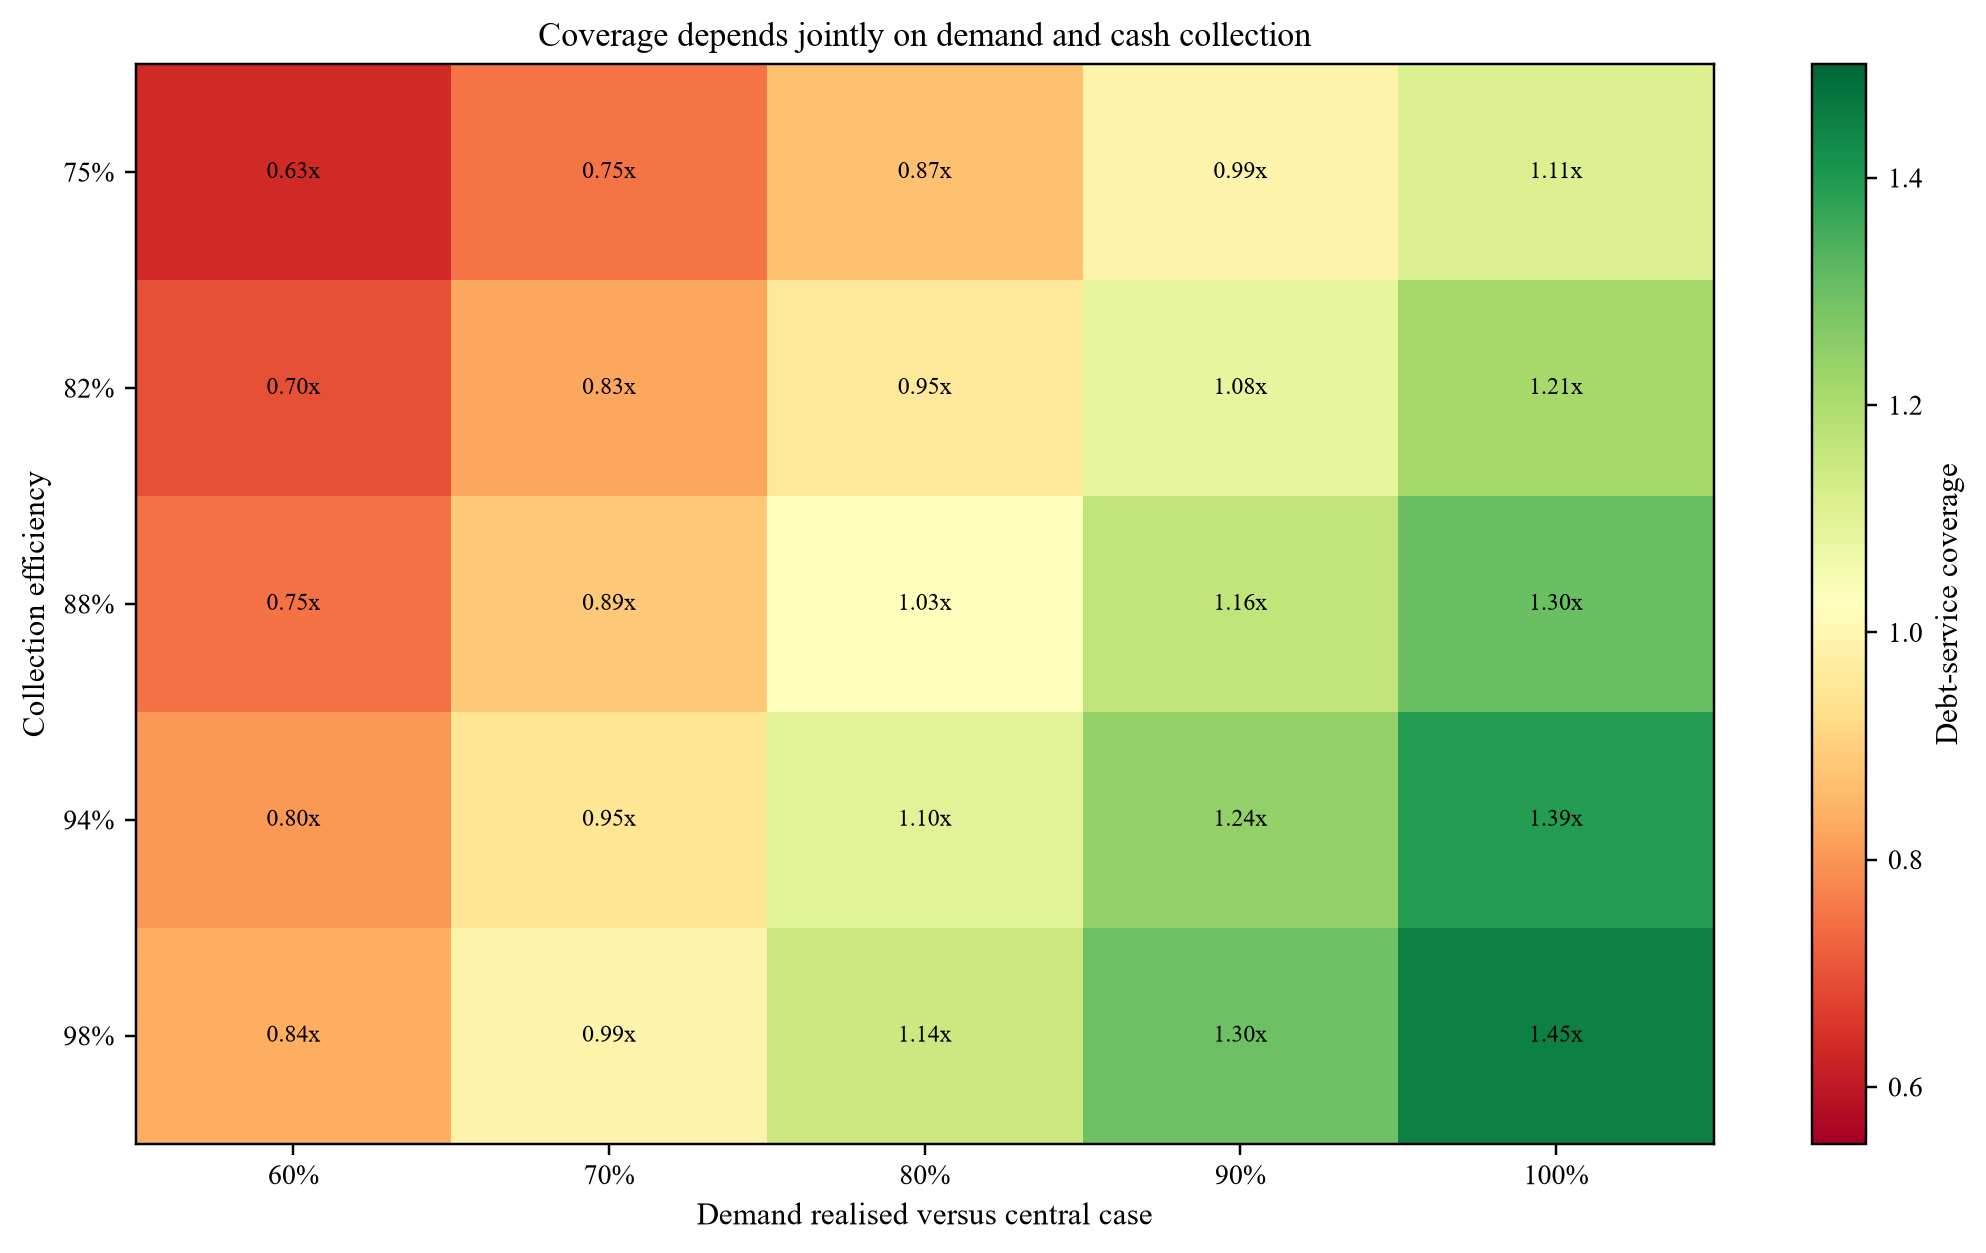
Management assumptions. Values below one times indicate that cash available for debt service is insufficient for scheduled debt service.
23. Govern the AI model as a financing control
The model should have a defined purpose, owner, version, input register, validation standard, override rule and monitoring plan. It should report uncertainty and missing data. A high ranking should trigger diligence rather than automatic approval. Human accountability remains with the people who approve site development and capital.
Validation should use sites and periods excluded from training. The team should test geographic transfer, class imbalance, stale inputs and sensitivity to alternative population or building datasets. Performance should be measured against field and operating outcomes: occupied premises, connections, demand, collection, cost and service quality.
After commissioning, new operating data can improve later decisions. The original investment case must remain frozen for accountability. Model changes should be logged and backtested. A feedback system that silently learns from commercially selected sites can reinforce selection bias because rejected communities never produce operating data.
Independent validation should focus on decisions with material capital effect. The validator should reproduce site features from source data, inspect a sample of spatial joins, test alternative inputs, review field exceptions and compare rankings with realised outcomes at existing sites. Validation should report limitations and unresolved uncertainty, not only a pass score. A model can be statistically stable and commercially weak when the outcome variable is an imperfect proxy for cash demand.
Override governance is equally important. Local teams may know that a mapped road is impassable, a facility has closed or a community boundary is wrong. The process should allow a documented override with evidence, accountable approval and later review. Frequent overrides in one region may reveal model drift or missing features. The objective is a better decision record, not blind adherence to an algorithm.
24. Integrate environmental, social and inclusion evidence
Site selection affects land, livelihoods, safety, biodiversity, cultural heritage and distributional outcomes. Environmental and social assessment should begin during screening and deepen before construction. The project should follow applicable law and the requirements of its financiers, including land access, labour, community health and safety, grievance and stakeholder engagement [23,25].
Geospatial data can identify sensitive areas and access constraints. Field assessment remains necessary. Community consent processes and legal rights cannot be inferred from imagery. The project should also test whether tariffs, connection charges and appliance finance exclude lower-income households or women-owned enterprises.
Inclusion metrics should connect to actions and budget. A map of underserved areas does not prove inclusive service. Connection support, customer engagement, productive-use assistance, complaint channels and service-quality reporting can form part of grant and operating covenants.
25. Execute a one-hundred-and-twenty-day diligence plan
During days one to thirty, freeze the site universe, data cut-off and model, reconcile country plans, rank evidence gaps and select field samples. Confirm legal entities, development budget, grant route and preliminary capital structure. Reject sites with fundamental rights or exclusion problems.
During days thirty-one to seventy-five, complete field surveys, anchor verification, customer sampling, land and approval work, route surveys, technical designs, costs and community engagement. Rebuild adoption, productive use, affordability, collection and grid-arrival cases by site.
During days seventy-six to one hundred and twenty, group sites into construction cohorts, finalise sources and uses, test correlated downside, agree subsidy and debt conditions, establish accounts and reserves, and present the investment committee with approved, conditional and deferred sites. The actual programme should follow access, country process and specialist advice.
The diligence room should be structured by site and by common portfolio workstream. Site folders should contain location, rights, customers, anchors, survey, design, costs, approvals, community evidence and environmental findings. Portfolio folders should contain the model, procurement, financing, grant, treasury, insurance, cyber, governance and operating standards. A master register should show document owner, date, status, reliance, exception and approval consequence. This structure lets the investment committee distinguish a common weakness from an isolated site issue.
Decision papers should include a change log from initial screen to approved case. Site removals, cost changes, lower demand, grant conditions and revised construction phases should remain visible. The record should identify which evidence changed value or debt capacity. This discipline reduces the risk that a later model quietly absorbs adverse findings without showing their commercial consequence.
26. Maintain an operating evidence register
The register should connect every site to rights, licences, customers, anchors, meters, service quality, demand, collections, losses, asset condition, grant claims, cash accounts and expansion decisions. Data should reconcile from operational systems through invoices and payment records to the financial statements.
Management should report forecast error by source rather than only total variance. Lower connections, lower consumption, poor collection, outages, losses and delayed anchors require different responses. The board and lenders need early indicators and accountable actions.
The portfolio should expand when verified operating evidence supports capacity and cash. Sites that underperform need remediation, redesign or disciplined exit. Geospatial AI remains useful throughout the lifecycle when it guides investigation and preserves uncertainty. It cannot substitute for the contracts, field evidence, engineering and cash controls that make project finance repayable.
| Indicator | Evidence | Trigger question | Potential action |
|---|---|---|---|
| Active connections | Meter activation and continuing use | Is acquisition behind the approved cohort curve? | Intensify engagement or defer expansion |
| Productive load | Equipment, hours and metered demand | Has financed equipment produced sustainable use? | Repair business model or resize capacity |
| Collection efficiency | Billing, payment and reversals | Is invoiced revenue becoming controlled cash? | Change payment process or increase reserve |
| Service quality | Availability, voltage and incidents | Is weak service suppressing demand? | Repair assets and suspend distributions |
| Forecast error | Frozen case versus actual by driver | Is the error data, adoption, operation or market? | Revalidate model and re-underwrite next cohort |
| Grant claims | Eligible, submitted, verified and paid connections | Can the bridge be repaid on time? | Fund delay, cure evidence or stop new draw |
Illustrative controls should be calibrated to the final financing and operating model.
Sources
- World Bank Group, Mission 300 FAQ. Read the primary source
- World Bank Group, Seventeen Countries Commit to Concrete Plans to Scale Up Electricity Access, 2025. Read the primary source
- International Energy Agency, Financing Electricity Access in Africa: Executive Summary, 2025. Read the primary source
- International Energy Agency, Financing Electricity Access in Africa: State of Play, 2025. Read the primary source
- World Bank, Solar Mini Grids Could Power Half a Billion People by 2030, 2022. Read the primary source
- World Bank and ESMAP, Mini Grids for Half a Billion People. Read the primary source
- World Bank and ESMAP, Global Facility on Mini Grids. Read the primary source
- World Bank and ESMAP, Integrated Electrification Planning, 2020. Read the primary source
- World Bank, Global Electrification Platform 3.0. Read the primary source
- World Bank and ESMAP, Mini Grids for Half a Billion People: geospatial portfolio planning. Read the primary source
- African Development Bank, Africa Mini-Grid Market Acceleration Program 2.0, 2025. Read the primary source
- African Development Bank, Africa Mini Grid Acceleration Program appraisal report. Read the primary source
- African Development Bank, Sustainable Energy Fund for Africa. Read the primary source
- African Development Bank, Facility for Energy Inclusion attracts USD 160 million in commitments, 2020. Read the primary source
- International Finance Corporation, Scaling Mini-Grids. Read the primary source
- World Bank, Expanding Nigeria's Mini Grid Market, 2025. Read the primary source
- World Bank and ESMAP, Multi-Tier Framework for Measuring Electricity Access. Read the primary source
- WorldPop, Methods. Read the primary source
- WorldPop, Global 2 Population Data release statement. Read the primary source
- NASA Earthdata, Suitability of VIIRS Nighttime Lights for Population and Migration Modelling. Read the primary source
- European Commission Joint Research Centre, Global Human Settlement Layer. Read the primary source
- OpenStreetMap Foundation, Copyright and Licence. Read the primary source
- World Bank, Environmental and Social Framework. Read the primary source
- World Bank, Procurement Framework. Read the primary source
- International Finance Corporation, Performance Standards on Environmental and Social Sustainability. Read the primary source
- World Bank and ESMAP, Scaling Up Energy Storage to Accelerate Renewables, 2023. Read the primary source
