

1. Define route to market as a cash-and-service system
Route to market is often described as a choice of distributors, wholesalers, retailers, digital platforms or direct sales. That description begins too late. In agribusiness, the route begins with a production commitment and ends only when product has been accepted, claims have been resolved and cash is available. The board therefore needs one operating model that connects supply, physical condition, ownership, service, price, working capital and risk.
The central decision is which customer promise the business can fulfil profitably under the biological and operational constraints of its supply base. A promise may concern grade, variety, size, maturity, temperature, packaging, traceability, volume, delivery window, shelf life or certification. Each promise changes growing practices, harvest timing, sorting yield, inventory life, transport, rejection risk and selling price. A premium specification is valuable only when the incremental revenue exceeds the full cost and loss it creates.
The board should distinguish five evidence states. An opportunity is an analytical hypothesis. An approved intervention has a responsible owner, resources, timing and acceptance criteria. A physical result is verified product, service or capacity evidence. An accounting result is the treatment recognised under applicable policies. Realised cash is the movement reconciled to bank, receivables, payables, tax, inventory and financing. These states prevent a potential loss reduction from being presented as earnings and prevent earnings from being presented as liquidity before collection.
Table 1. Evidence states for an agribusiness route-to-market reset
| Evidence state | Required support | Permitted board use | Principal control |
|---|---|---|---|
| opportunity | demand, supply, quality and stated assumptions | prioritise diligence and design | disclose uncertainty, exclusions and dependencies |
| approved intervention | owner, budget, timing, food-safety safeguards and acceptance criteria | release conditional resources | commercial, operations, quality and finance approval |
| validated physical result | repeated lot, yield, service or loss evidence | assess operating effect | frozen baseline and comparable conditions |
| accounting result | ledger entry and documented policy conclusion | management and statutory reporting | reconcile inventory, revenue, provisions and disclosures |
| realised cash | receipts, payments, claims, financing and bank evidence | assess liquidity and debt capacity | reconcile timing, leakage and one-off effects |
Opportunity, operating evidence, accounting and cash remain distinct. Commodity-specific conclusions require professional review.
2. Map the farm-to-customer chain and freeze the baseline
The operating baseline should follow product by lot, batch or other economically meaningful unit. It records the supply source, location, production window, expected and actual harvest, custody transfers, ownership, condition, processing, packaging, inventory location, customer order, delivery, acceptance, invoice, claim and collection. Where commingling occurs, the control design should state how identity, quantity and quality are preserved or reconstructed.
Physical flow and title flow may differ. A processor can hold farmer-owned crop, a distributor can own product stored with a third party, or a retailer can control inventory before legal title transfers under a particular contract. The board should map possession, title, risk of loss, insurance, payment obligation and decision rights separately. A single enterprise-resource-planning status cannot safely represent all of these questions.
The baseline needs time as well as quantity. Production lead time, harvest window, collection delay, grading time, storage dwell, processing cycle, order lead time, transport, customer acceptance, invoicing and collection determine the cash conversion cycle. Perishable inventory loses option value as remaining life falls. Commodity inventory may retain physical quality while price, basis, storage and financing costs change. The operating model should therefore report both age and condition.
FAO recommends measuring food loss across multiple supply-chain stages because an aggregate loss rate cannot identify the point or cause of failure.[1][2] The baseline should distinguish quantity loss from quality deterioration, economic downgrade, moisture or weight change, contamination, theft, documentation error, rejected deliveries and forecast cancellation. It should also preserve valid conversion processes, such as trimming or drying, rather than classifying every weight reduction as avoidable waste.
Table 2. Farm-to-customer stage control map
| Stage | Minimum physical record | Commercial decision | Working-capital exposure |
|---|---|---|---|
| production commitment | crop, acreage or herd, expected yield, timing and inputs | contract, forecast or speculative production | input cash before harvest and forecast risk |
| intake and grading | source, lot, quantity, condition, grade and rejection | acceptance, price basis and supplier settlement | payable timing and loss before sale |
| storage and processing | location, custody, age, temperature, yield and downtime | hold, process, blend, downgrade or dispose | inventory days, conversion cost and shrinkage |
| fulfilment and delivery | order, allocation, pick, pack, dispatch and proof of delivery | service level, freight and substitution | inventory plus unbilled delivery |
| acceptance and collection | invoice, claim, rebate, return, credit note and receipt | resolve, recover, insure or write off | receivable days and disputed cash |
Each stage needs a physical record, a commercial event and a cash consequence linked through stable identifiers.
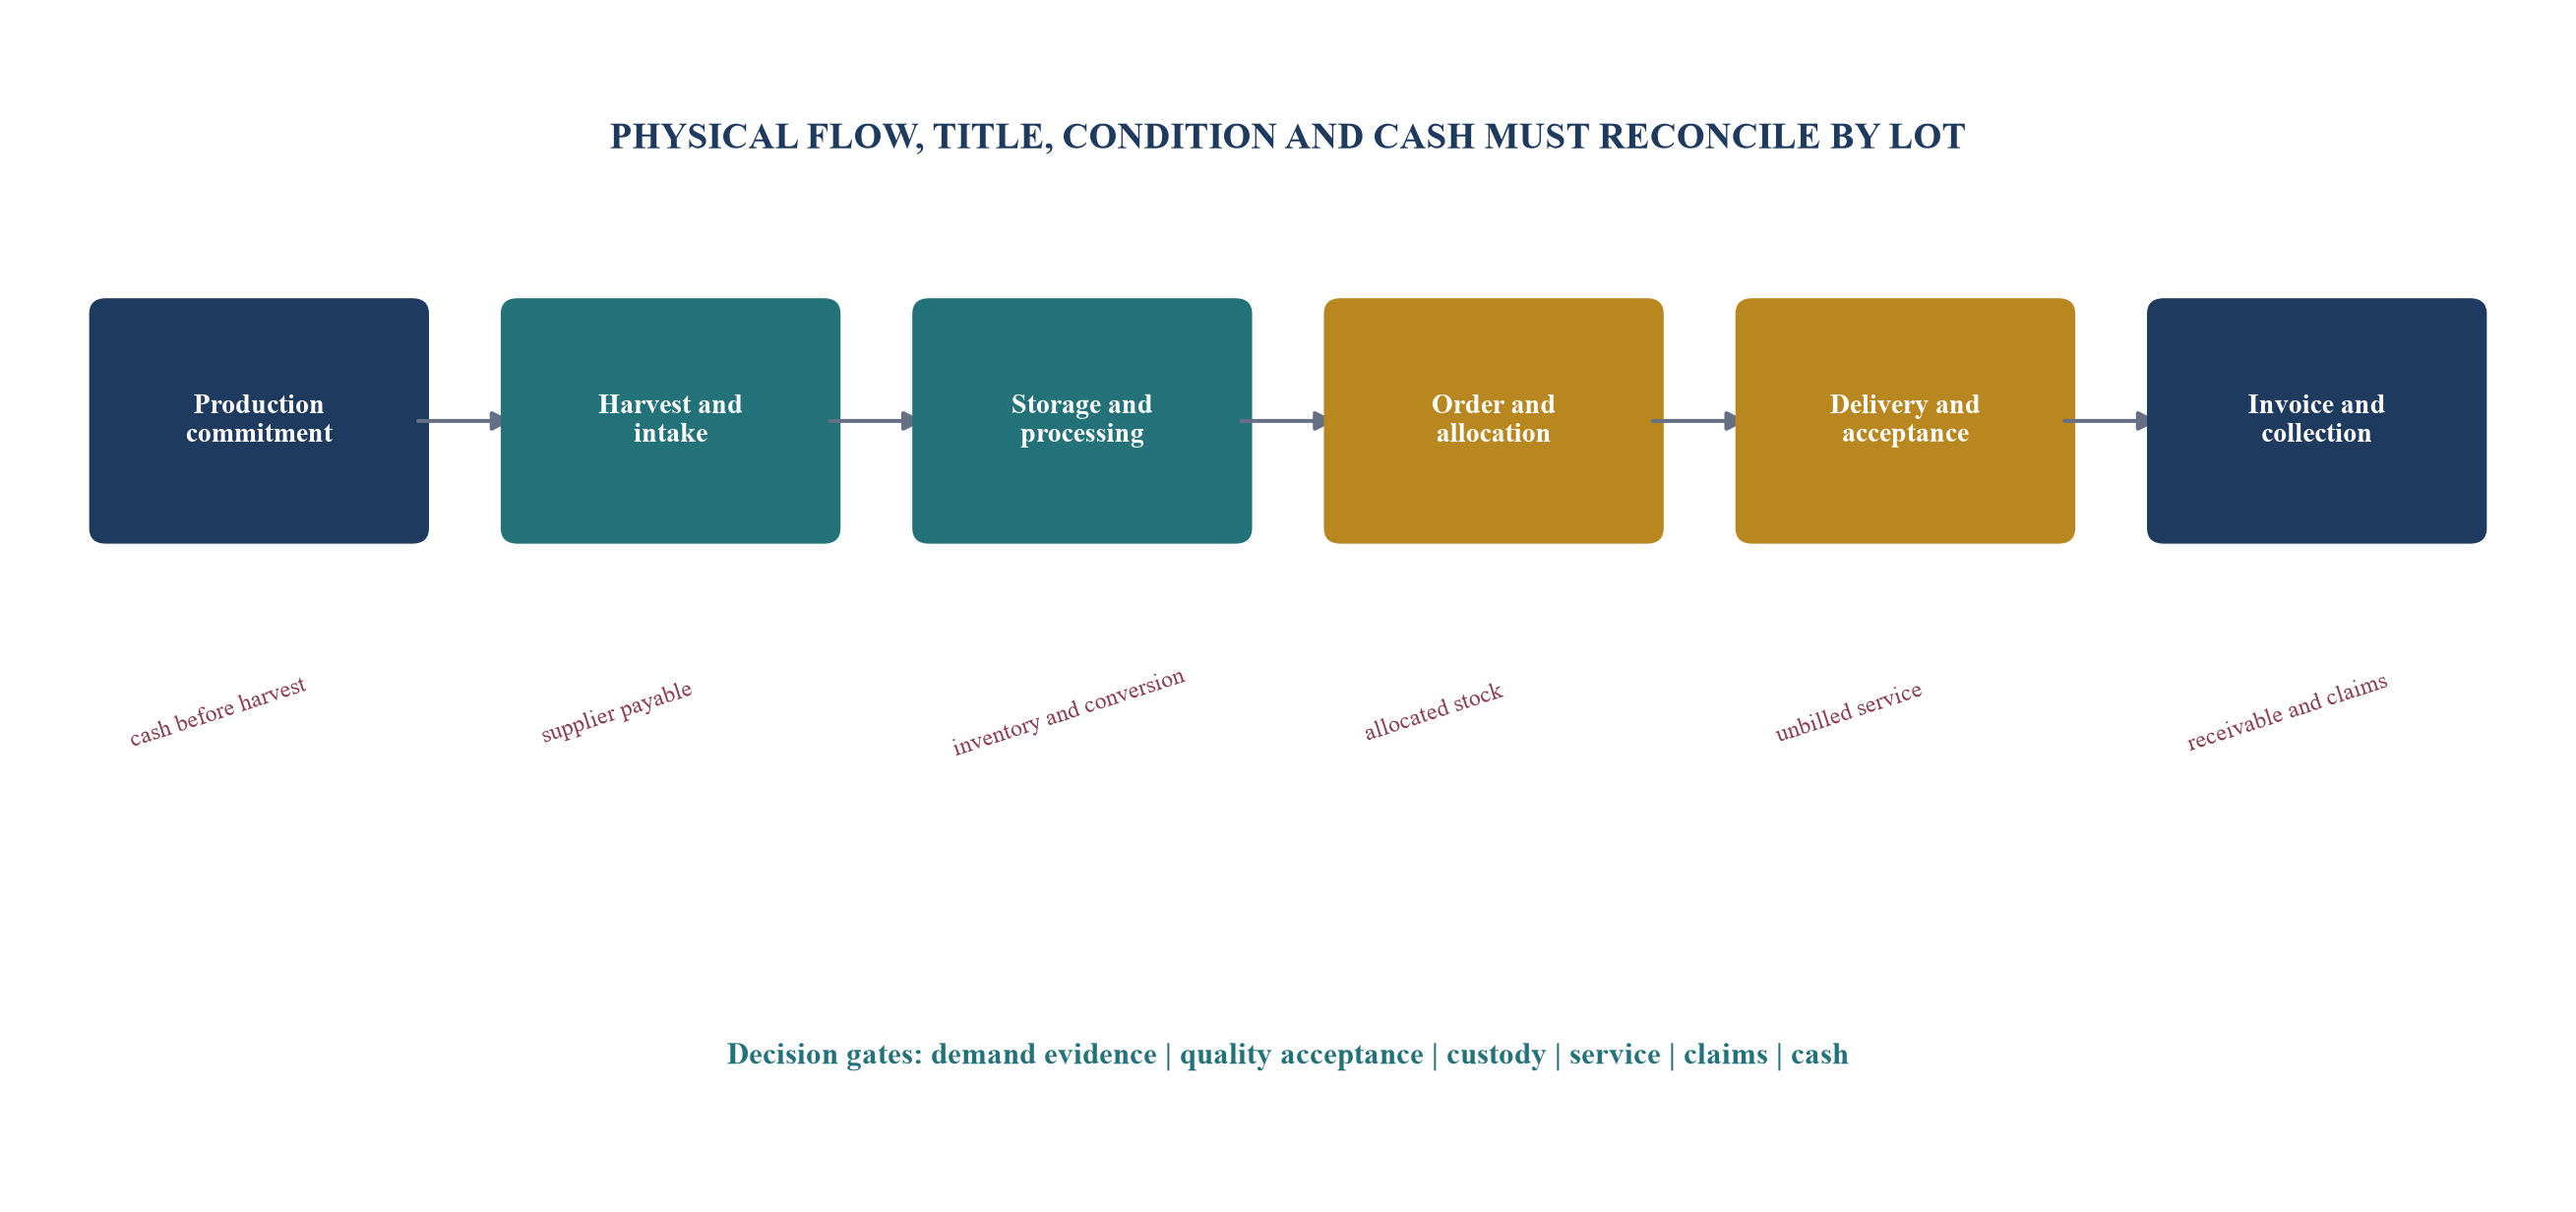
The map is a decision architecture. Each arrow requires identifiers, ownership, condition, time and reconciliation evidence.
3. Connect production commitments to demand evidence
Agricultural supply cannot be switched on when an order arrives. Planting, breeding, feeding and growing decisions create capacity months or years before sale. The commercial organisation should therefore translate demand into a commitment ladder rather than one forecast. The ladder separates contracted demand, repeat demand with observed behaviour, qualified pipeline, market opportunity and unsupported aspiration. Production and procurement policy should state which evidence level can support each commitment.
Demand should be defined by product attributes and delivery period, not by revenue alone. A forecast for one thousand tonnes may conceal grade, variety, pack, geography or timing mismatches. Sales teams should record customer specifications, forecast authority, call-off mechanism, cancellation rights, substitution rules and claim history. Operations should translate these into harvest, intake, processing, storage and transport capacity.
The supply portfolio also matters. Owned farms, contracted growers, cooperatives, spot suppliers and imports have different control, flexibility, traceability and cash profiles. Concentrating supply may improve standardisation and coordination while increasing weather, disease or counterparty risk. Diversification can improve resilience while creating more variable quality and higher collection cost. The route-to-market strategy should value both expected economics and downside continuity.
The OECD-FAO Outlook expects global agricultural and fish production to rise over the decade, driven mainly by productivity, while international trade remains essential as production and consumption are geographically separated.[4] These system-level projections do not determine a company's demand. They reinforce the need to distinguish long-run market direction from customer-level commitments and local production risk.
4. Govern harvest intake, grading and supplier settlement
The intake point converts biological production into a commercial lot. It should record supplier, field or production unit, harvest time, arrival time, gross and net weight, moisture, temperature, visible condition, sample, test, grade, accepted quantity, rejected quantity and settlement basis. Calibration, sampling method and authority to accept exceptions should be controlled because small measurement errors can move significant value across large volumes.
Grading rules should be commercially connected. A tighter specification can increase price while reducing saleable yield or redirecting product into lower-value channels. The board should see the complete grade-out: premium, standard, processing, feed, recovery, donation and disposal. Downgraded product is not automatically a loss when an alternative route preserves contribution. Conversely, product recorded as saleable can conceal economic loss if shelf life, customer access or price has deteriorated.
Supplier terms influence both behaviour and liquidity. Payment at delivery may support growers and secure supply while transferring quality and price risk to the buyer. Payment after customer acceptance may reduce buyer risk while imposing finance needs on suppliers. Advances, input finance, minimum prices, quality premiums, deductions and netting should be explicit. Disputes require time limits, retained samples, independent testing and a clear approval route.
Table 3. Lot quality and settlement register
| Field | Required evidence | Decision supported | Control question |
|---|---|---|---|
| identity and custody | supplier, origin, lot, timestamps and custody signatures | trace, segregate, blend or recall | can the physical lot be located and reconstructed? |
| quantity | calibrated gross, tare, net and conversion measures | accept, settle and reconcile yield | are measurement method and tolerances consistent? |
| quality and remaining life | sample, test, grade, temperature and condition | route, process, store, downgrade or reject | does the evidence represent the whole lot? |
| price and settlement | contract basis, grade differential, deductions and payment date | approve supplier payable | are commercial terms applied to verified condition? |
| exception | deviation, authority, retained sample and resolution | release, quarantine, claim or dispose | is the exception visible to quality, finance and customer service? |
Quality evidence should support both operating decisions and supplier or customer settlement without erasing uncertainty.
5. Control storage and processing as value transformations
Storage is an economic decision, not an empty interval. The product may gain option value through timing, aggregation, conditioning or access to a different market. It also consumes space, energy, handling, insurance and finance, and may lose weight, quality or remaining life. The hold decision should compare expected price and service value with storage cost, expected loss, financing cost and downside risk.
Processing should be governed through a mass-and-value balance. Input quantity becomes saleable output, co-products, recoverable material, normal process loss and abnormal loss. Yield should be measured by product, line, shift, recipe or grade where decisions differ. A higher headline yield can reduce value if it weakens specification, throughput, shelf life or customer acceptance. The board needs both physical yield and contribution yield.
IAS 41 addresses biological assets and agricultural produce at the point of harvest; it does not govern processing after harvest.[13] IAS 2 addresses inventories and requires measurement and recognition under its accounting framework.[14] These standards establish reporting boundaries. Management still needs an operating ledger detailed enough to explain how physical change, valuation, write-down, overhead absorption and cash relate.
Inventory records should identify ownership, location, quantity, condition, age, reserved status, financing encumbrance and customer allocation. Cycle counts and reconciliations should focus on economic risk, including high-value, high-loss, regulated or pledged stock. A warehouse total that agrees to the ledger can still conceal obsolete, damaged, misgraded or unavailable inventory.
6. Measure spoilage as a causal and economic waterfall
Food loss should be reconstructed from expected available product to realised sale and cash. Causes can include field loss, delayed harvest, intake rejection, grading downgrade, storage deterioration, processing variance, packaging damage, temperature excursion, transport delay, customer rejection, expiry, return and disposal. The waterfall should show both quantity and value because one unit lost before processing has different economics from one rejected after freight and customer service.
FAO's Food Loss Index measures losses from production up to, but excluding, retail and distinguishes supply-chain stages.[1][2] FAO reports a global post-harvest and pre-retail loss estimate of 13.2 percent; its SDG data portal reports that fruit and vegetable loss increased from 23.2 percent in 2015 to 25.4 percent in 2023.[2][3] These figures are policy-level indicators. A company should use its own commodity, location, season and process evidence rather than applying global percentages to a business case.
Loss attribution requires care. A temperature excursion may originate with harvesting heat, loading delay, refrigeration failure or customer unloading. A customer rejection may reflect genuine non-conformance, ambiguous specification, sampling error or commercial dispute. The value ledger should preserve the immediate failure, contributing conditions, contractual responsibility, recovery and final cash outcome. Root-cause analysis should not be forced into one label when evidence supports several causes.
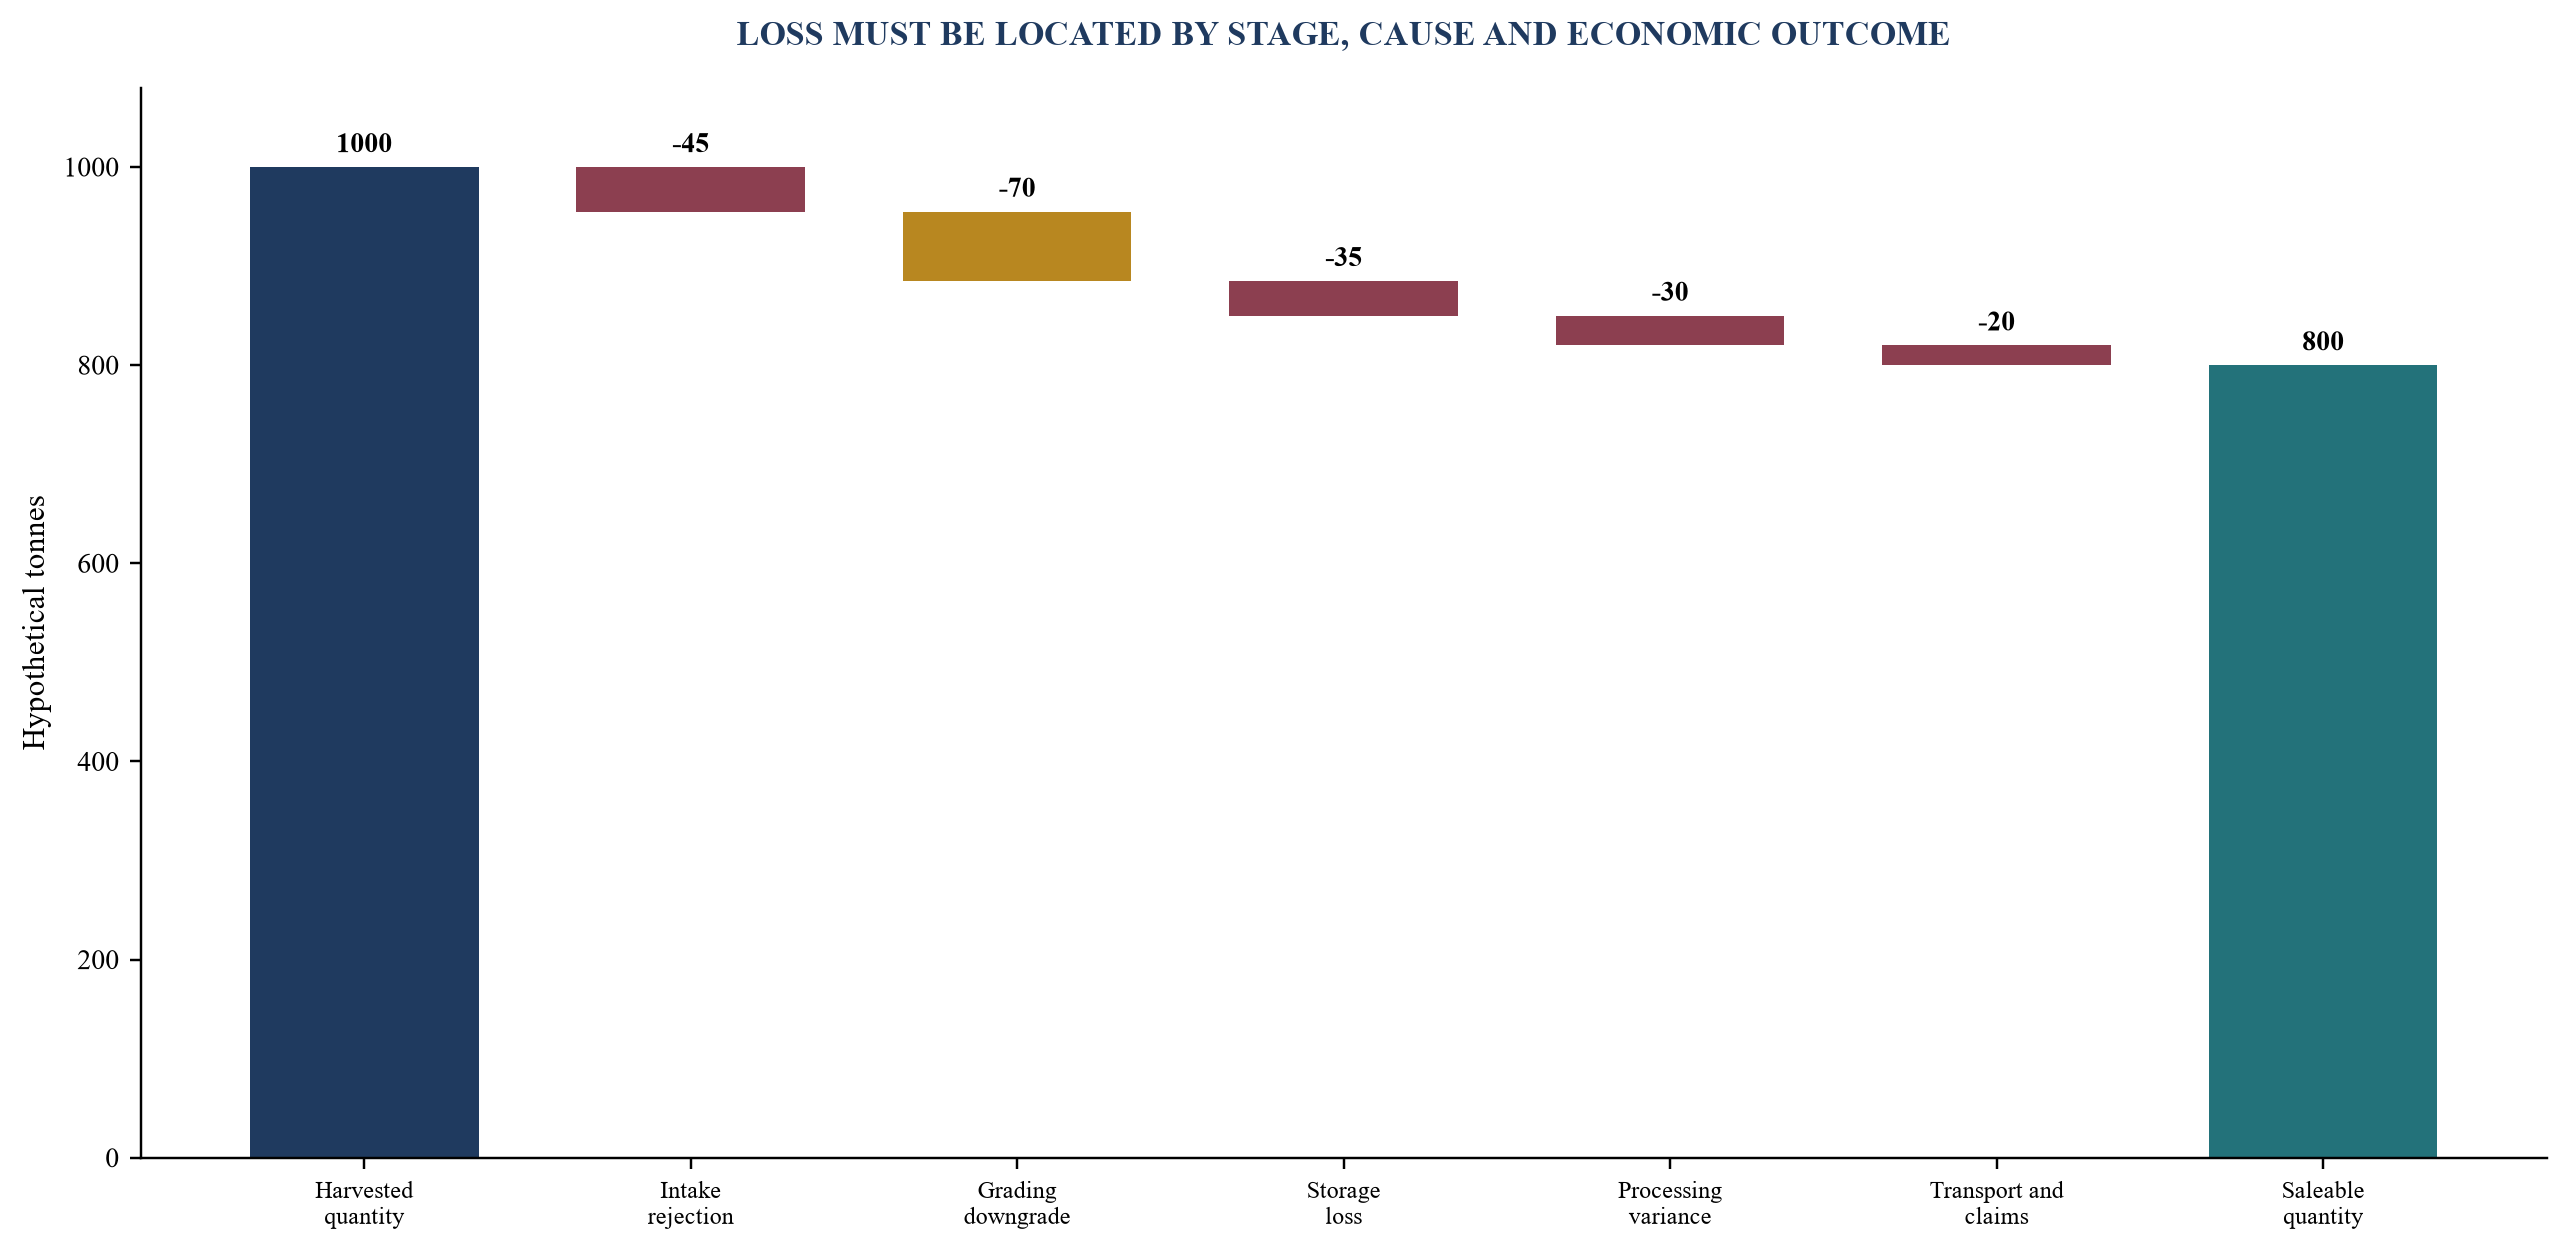
Values are hypothetical tonnes. Normal conversion, avoidable loss and commercial downgrade should remain separately visible.
7. Design the channel portfolio around contribution and risk
Agribusiness channels can include processors, commodity traders, wholesalers, food-service distributors, retailers, export agents, marketplaces, direct business customers and direct consumers. Each channel changes specification, order size, forecast visibility, packaging, credit, logistics, data, claims and price risk. The correct comparison is incremental contribution after complete service and working-capital cost.
Gross price can mislead. A retailer programme may command a higher unit price while requiring retail-ready packaging, promotional allowances, listing fees, strict service levels, returns, long payment terms and customer-specific inventory. A trader may offer a lower price with faster lifting, standard documentation and earlier cash. A direct channel may preserve customer data and margin while adding acquisition, fulfilment, payment, returns and support costs.
The channel account should begin with accepted net revenue. It then deducts grading and pack conversion, incremental processing, packaging, storage, pick and handling, freight, commissions, rebates, marketing support, returns, claims, credit loss and financing. It should add recoveries and co-product value only when evidenced. Shared cost allocation should remain consistent and decision-relevant.
Channel concentration creates dependency. A large customer may improve planning and asset utilisation, yet renegotiation, delayed acceptance or a sudden specification change can lock up working capital. Smaller channels can diversify demand but increase commercial and logistics complexity. The board should set concentration, term, service and margin thresholds and preserve exit routes for customer-specific stock.
Table 4. Channel economics and working-capital record
| Channel field | Required evidence | Contribution question | Risk question |
|---|---|---|---|
| accepted net revenue | order, delivered quantity, acceptance, invoice and deductions | what revenue survived claims and rebates? | who controls specification and acceptance? |
| incremental service cost | grade, pack, storage, handling, freight and support | what contribution remained after fulfilment? | which capacity or customer-specific assets are committed? |
| inventory intensity | forecast, allocation, minimum stock, age and remaining life | what margin is earned per inventory day? | can stock be rerouted if demand changes? |
| receivable and credit | terms, disputes, credit limit, insurance and collection | what cash return follows the sale? | who bears delay, default and currency risk? |
| data and relationship | demand signal, sell-through, claims and customer contact | can information improve production and service? | does the business depend on opaque downstream decisions? |
Channel choice should combine net contribution, cash timing, information and downside dependence.
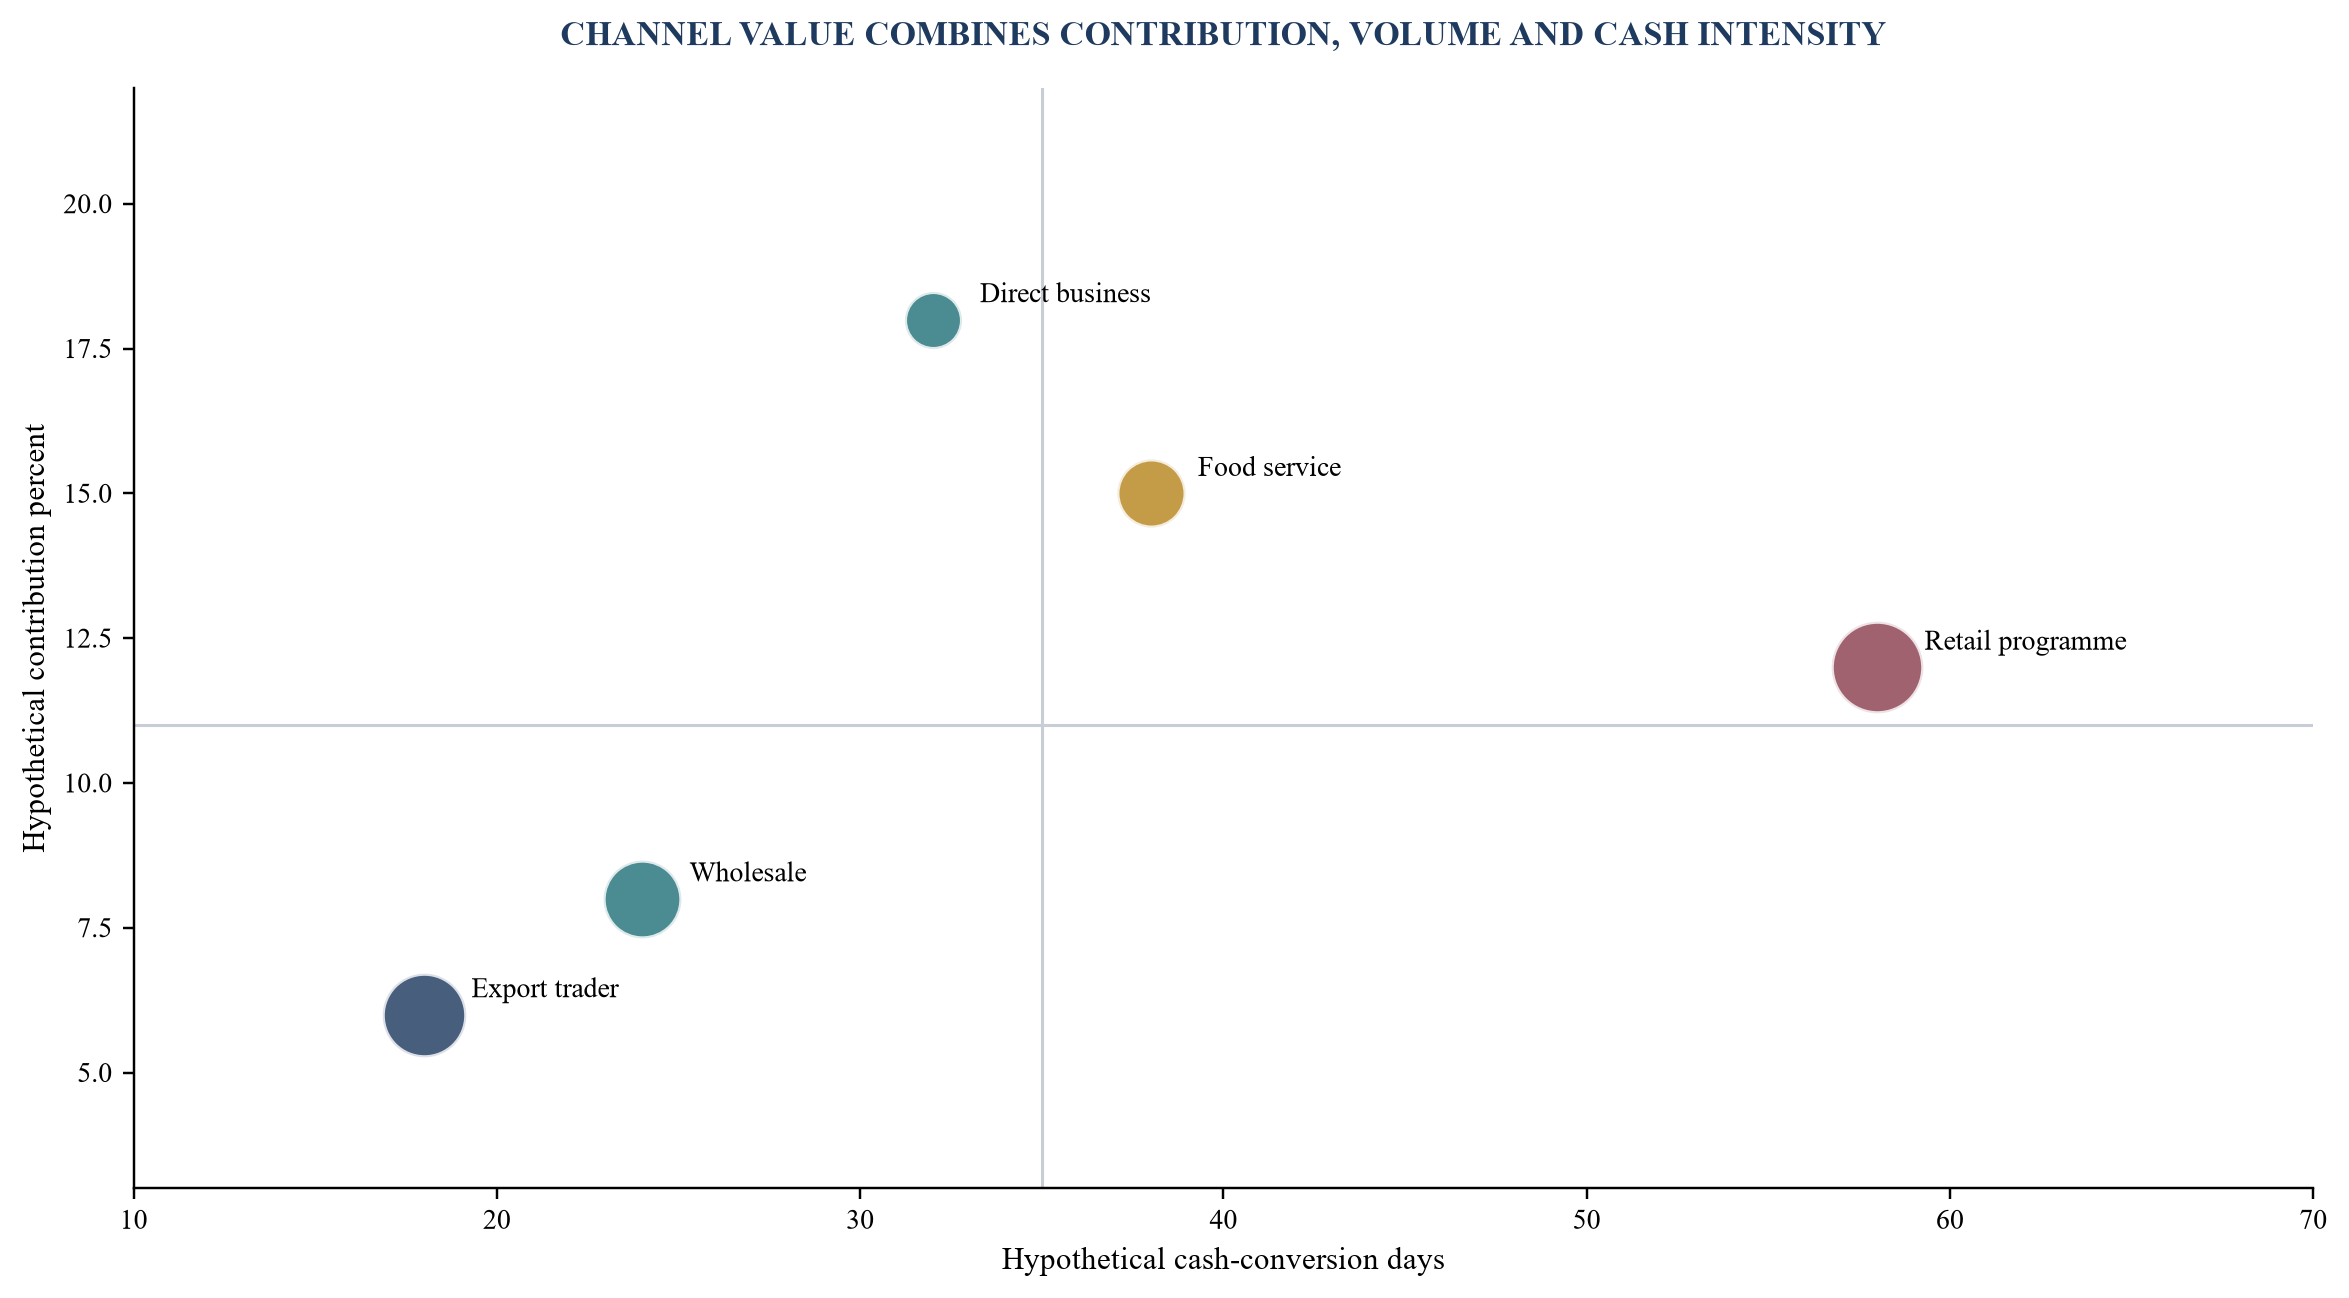
Values are hypothetical. Bubble size represents annual volume; management should replace all values with customer-level evidence.
8. Rebuild customer terms around service and acceptance
Customer terms allocate operational and financial risk. The contract should define product, tolerance, forecast, order, substitution, delivery point, title, risk, inspection, acceptance, claim window, return, price adjustment, invoice trigger, payment, set-off and dispute resolution. Commercial teams should understand which operational event creates a receivable and which unresolved condition can prevent collection.
Service levels should reflect product physics. Delivery in full and on time is incomplete when temperature, remaining shelf life, grade or documentation determines usability. The scorecard should distinguish supplier-caused failure, carrier failure, customer appointment failure, forecast error and force majeure. Penalties and claims should link to verified events and contractual responsibility.
IFRS 15 establishes principles for revenue from contracts with customers.[15] The accounting conclusion depends on facts and policy assessment. The operating system should therefore preserve order, fulfilment, control transfer, acceptance, variable consideration, returns and collection evidence without assuming that dispatch, invoice and revenue are the same event.
Customer credit should be governed before order acceptance. Credit limit, uninsured exposure, concentration, payment behaviour, disputes and expected deductions should be visible to sales and supply planning. A revenue target should not override a blocked-credit decision without explicit authority and a documented liquidity consequence.
9. Build the working-capital bridge from commitment to cash
The working-capital bridge should begin before inventory appears on the balance sheet. Production advances, input finance, deposits, minimum purchase commitments and grower support can consume cash before harvest. After intake, cash remains tied in raw material, work in progress, finished goods, goods in transit, unbilled delivery and receivables. Supplier credit, customer advances and financing can offset part of the requirement.
Days measures are useful when they preserve the business driver. Inventory days should be segmented by product, condition and remaining life. Receivable days should separate current, disputed, insured and overdue balances. Payable days should distinguish contractual terms from delayed payment and supplier distress. A favourable aggregate can conceal expired stock, concentrated overdue debt or unsustainable supplier stretching.
Cash forecasting should follow physical events. The model connects production calendar, harvest intake, processing throughput, order book, delivery schedule, claims, customer payments, supplier settlements, tax and financing. Scenarios should test yield, price, loss, customer delay, transport disruption, currency, interest and facility headroom. The board should see peak cash need, duration and recovery, not only year-end working capital.
IAS 7 requires cash-flow information to be classified and reconciled under its reporting framework.[16] Management's route-to-market cash model is more granular. It should explain which operational intervention changed receipts, payments, inventories or financing and when that change reached the bank.
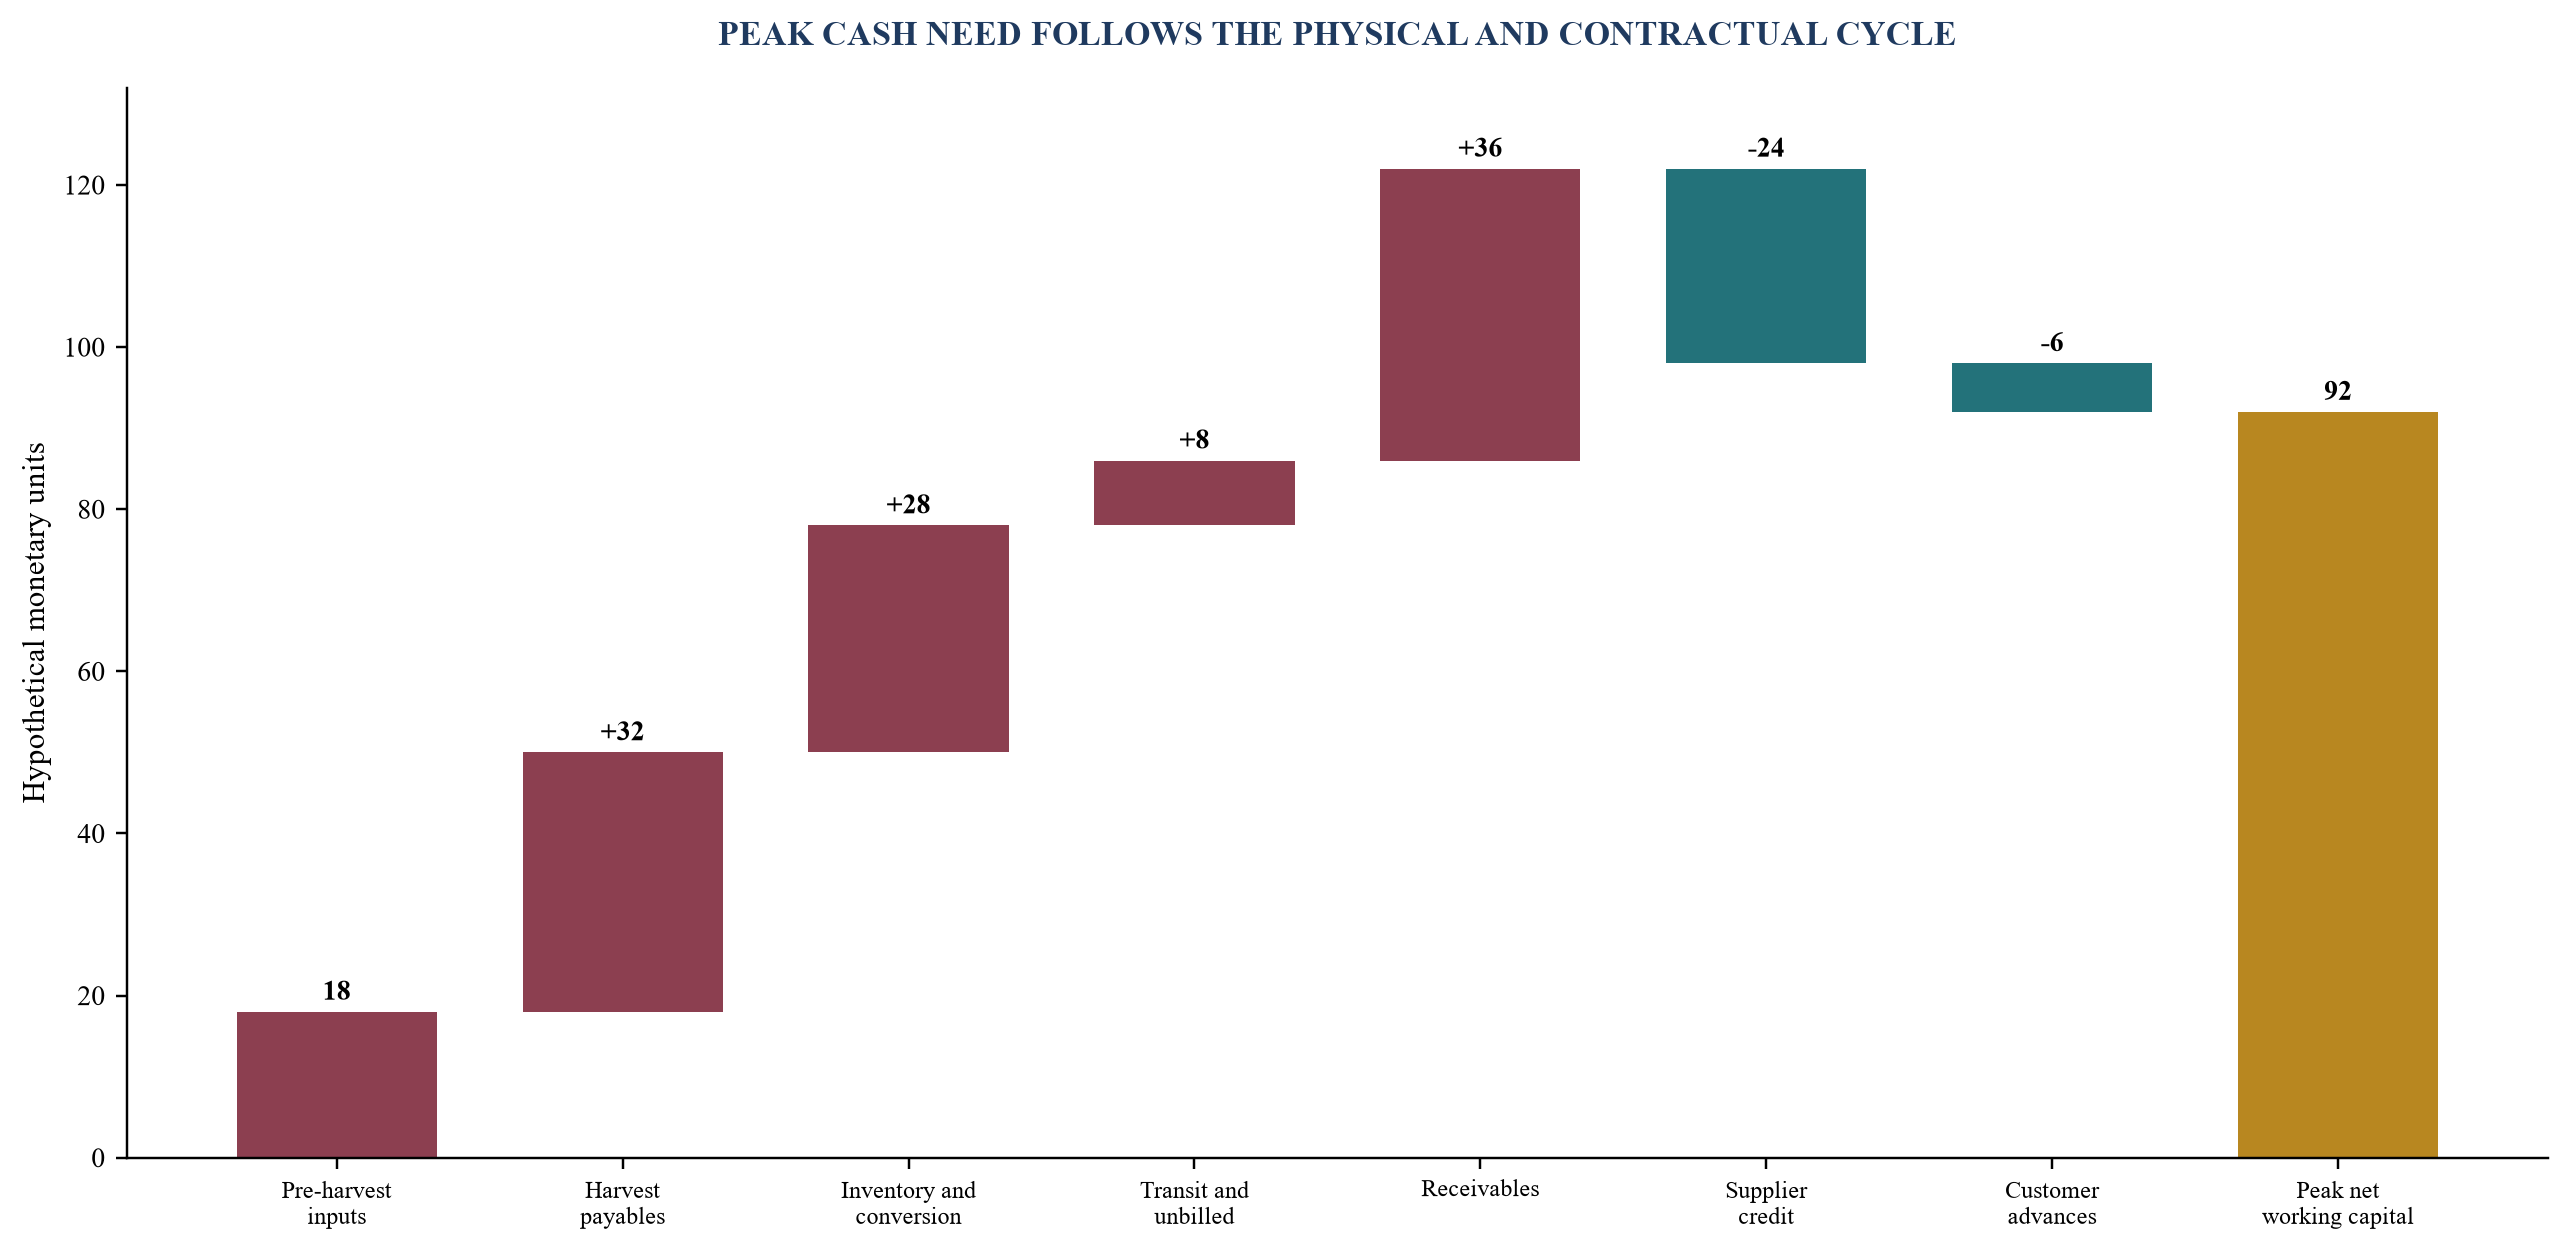
Values are hypothetical monetary units. The bridge shows funding uses and offsets at peak seasonal exposure.
10. Match financing instruments to controllable assets and events
Financing should follow the operating asset, legal right and repayment source. Pre-harvest needs may use sponsor equity, seasonal facilities, input finance, contract-backed advances or crop-receipt structures where legally available. Post-harvest inventory may support warehouse-receipt or borrowing-base finance when quantity, quality, custody, insurance, title and enforceability are satisfactory. Accepted receivables may support factoring or supply-chain finance when dilution, dispute and concentration are controlled.
IFC's Global Warehouse Finance Program supports working-capital financing for agricultural producers and traders using warehouse receipts or equivalent collateral. IFC notes that collateral management or stock monitoring agreements may be used in jurisdictions without an enabling warehouse-receipt regime.[5] Its Global Supply Chain Finance program allows eligible suppliers to convert receivables into cash under programme conditions.[7] These programmes illustrate structures; they do not establish availability or terms for a specific company.
The 2024 UNCITRAL-UNIDROIT Model Law is technology-neutral and addresses paper and electronic warehouse receipts, transfer, protected holders, warehouse-operator obligations and security rights.[8] A company must still establish the law actually enacted, warehouse licensing, title, perfection, priority, enforcement, insurance, inspection and fraud controls in its jurisdiction.
Borrowing-base governance should prevent double financing and unavailable collateral. Eligible inventory should exclude disputed ownership, expired or damaged product, customer-reserved goods where restrictions apply, uninsured stock, unverified third-party locations and quantities outside approved limits. Receivables should be tested for acceptance, dilution, set-off, concentration, ageing and credit insurance. Daily operating systems should reconcile to lender reports.
Table 5. Financing map for agribusiness working capital
| Funding need | Potential structure | Core evidence | Principal failure mode |
|---|---|---|---|
| production and inputs | seasonal facility, advance or crop-receipt structure | production plan, contract, grower, insurance and repayment source | yield, price, diversion or enforceability failure |
| stored commodity | warehouse-receipt or borrowing-base facility | title, receipt, licensed custody, quantity, quality, insurance and price | fraud, commingling, deterioration or collateral shortfall |
| processing inventory | revolving working-capital facility | mass balance, eligible stock, controls and conversion cycle | overstated yield, ineligible stock or downtime |
| accepted receivable | factoring or supply-chain finance | invoice, acceptance, dilution, debtor and assignment | dispute, set-off, concentration or late payment |
| seasonal peak and shocks | committed liquidity reserve or overdraft | cash forecast, covenants, headroom and triggers | facility unavailable when peak cash need arrives |
Instrument choice depends on jurisdiction, enforceability, asset control, lender policy and transaction-specific evidence.
11. Redesign logistics and the cold chain around product life
Logistics should be optimised for delivered contribution and remaining life rather than freight price alone. Collection routes, consolidation points, vehicle type, loading sequence, temperature, humidity, handling, border time, appointment windows and return journeys affect quality and cash. A cheaper lane can be expensive when it increases rejection, markdown, buffer stock or lost customer capacity.
Codex codes of practice include general food-hygiene principles and commodity-specific storage and transport requirements.[9] UNECE's good-practice code for fresh fruit and vegetables addresses handling from producer through trader, transporter and retailer, including challenges such as inadequate cooling and sorting equipment.[10] The operating design should translate the applicable standard and customer specification into measurable controls, training, records and corrective action.
Cold-chain evidence should include product temperature where relevant, ambient conditions, equipment set point, calibration, loading and unloading time, door openings, excursion duration and disposition. Data volume alone is insufficient. Thresholds, product science, alarm ownership and release authority should be defined. A sensor alert that nobody evaluates is not a control.
Network design should include service and capital. More collection or distribution nodes can shorten product travel and improve responsiveness while increasing fixed cost, inventory fragmentation and control complexity. Centralisation can improve utilisation and standardisation while increasing distance and single-site risk. The model should compare total delivered cost, loss, working capital, resilience and customer service.
12. Make traceability commercially useful and regulatorily sound
Traceability should answer defined decisions: locate affected product, verify origin, support certification, manage withdrawal, allocate claims, satisfy customers and improve process performance. The identifier architecture should connect supplier, lot, process, packaging, pallet, shipment, customer and financial record. Data should be captured at the event where it is created and reconciled at transfers.
UNECE describes traceability and transparency as enabling reliable information across complex, cross-jurisdictional value chains. Its 2026 Recommendation No. 49 addresses accessibility and interoperability of sustainability information at scale.[11] These principles can guide system design. They do not replace sector rules, customer requirements or verification of the underlying claim.
The WTO SPS Agreement permits measures necessary to protect human, animal or plant life or health subject to its disciplines, including scientific basis, non-discrimination and transparency.[12] Export route design should map permits, certificates, inspections, testing, treatment, border procedures and contingency time by product and destination. A commercially attractive market is unavailable when the compliance route cannot be executed reliably.
Access and change control matter because traceability systems contain supplier, customer, price, location and sometimes personal data. Roles, master-data ownership, audit logs, backups, integration controls, cybersecurity, incident response and exit arrangements should be part of route-to-market governance. Blockchain or another technology label does not prove accurate source data, legal effect or user adoption.
13. Use analytics and AI within controlled decision rights
Forecasting, computer vision, optimisation, anomaly detection and predictive maintenance can support agribusiness decisions. Potential uses include harvest forecasting, grade classification, storage-risk alerts, production scheduling, route planning, demand sensing, price analysis, claims triage and collections. Each use case should begin with a decision, an accountable owner and a measurable operating baseline.
Agricultural data are exposed to seasonality, weather, biological variation, sparse labels, changing varieties, equipment drift and selection bias. A model trained on accepted product may fail on unusual or rejected lots. A demand model can learn past stock-outs as low demand. A route optimiser can reduce kilometres while increasing product age or service risk. Validation should therefore use time, geography, commodity and operating regimes that reflect deployment.
Human override should be designed, recorded and reviewed. Quality, food safety, credit and regulatory decisions may require qualified authority. The system should show the recommendation, evidence, uncertainty, action and outcome. Overrides can reveal model weakness, but unexplained overrides can also conceal inconsistent practice. Governance should learn from both.
Benefits should be measured through the same value ledger as other interventions. A forecast improvement matters when it changes commitment, inventory, service, loss or cash. A vision model matters when grading accuracy, throughput, claims or yield improve. Technology cost includes integration, sensors, data preparation, training, monitoring, fallback and vendor dependence.
14. Run a 120-day reset through explicit decision gates
The first thirty days establish facts. Freeze definitions, map product and cash flows, reconcile lots to inventory and ledger, segment customers and channels, inventory contracts, inspect storage and logistics, rebuild the seasonal cash forecast and identify urgent food-safety, quality, custody or liquidity risks. The board approves evidence states, owners and acceptance criteria.
Days thirty-one to sixty test reversible interventions. Examples include intake scheduling, grade routing, first-expiry allocation, customer order rules, collection routes, packaging, claim workflows and targeted term changes. Tests should be limited by supplier, product, location, customer or period. Product safety and contractual obligations remain protected.
Days sixty-one to ninety scale interventions with repeated evidence. Standard operating procedures, system rules, supplier and customer communications, training and performance reviews are updated. Financing diligence tests title, collateral, receivables, cash forecasts and reporting. Capital proposals for storage, processing or cold chain require a validated bottleneck and commissioning plan.
Days ninety-one to one hundred and twenty institutionalise control. Management reconciles the value ledger to accounts and bank, closes unsupported opportunities, embeds daily and weekly routines, agrees lender reporting and refreshes downside cases. The board receives a route-to-market portfolio showing service, loss, contribution, working capital and risk by product and channel.
Table 6. Operating cadence for a route-to-market control tower
| Cadence | Primary review | Required participants | Decision output |
|---|---|---|---|
| daily | intake, exceptions, stock condition, orders, dispatch, claims and cash blocks | operations, quality, logistics, customer service and finance | contain, reroute, expedite, quarantine or escalate |
| weekly | demand-supply balance, yield, loss, channel contribution and working capital | commercial, supply, operations, finance and procurement | approve tests, capacity, terms and corrective actions |
| monthly | value ledger, cash forecast, concentration, financing and capital | executive team and investment committee | stop, scale, redesign, fund or hedge |
| quarterly | portfolio, customer and network strategy | board, management and independent specialists as required | reset strategic choices and risk appetite |
Escalation thresholds should be defined in measurable units and linked to named decision rights.
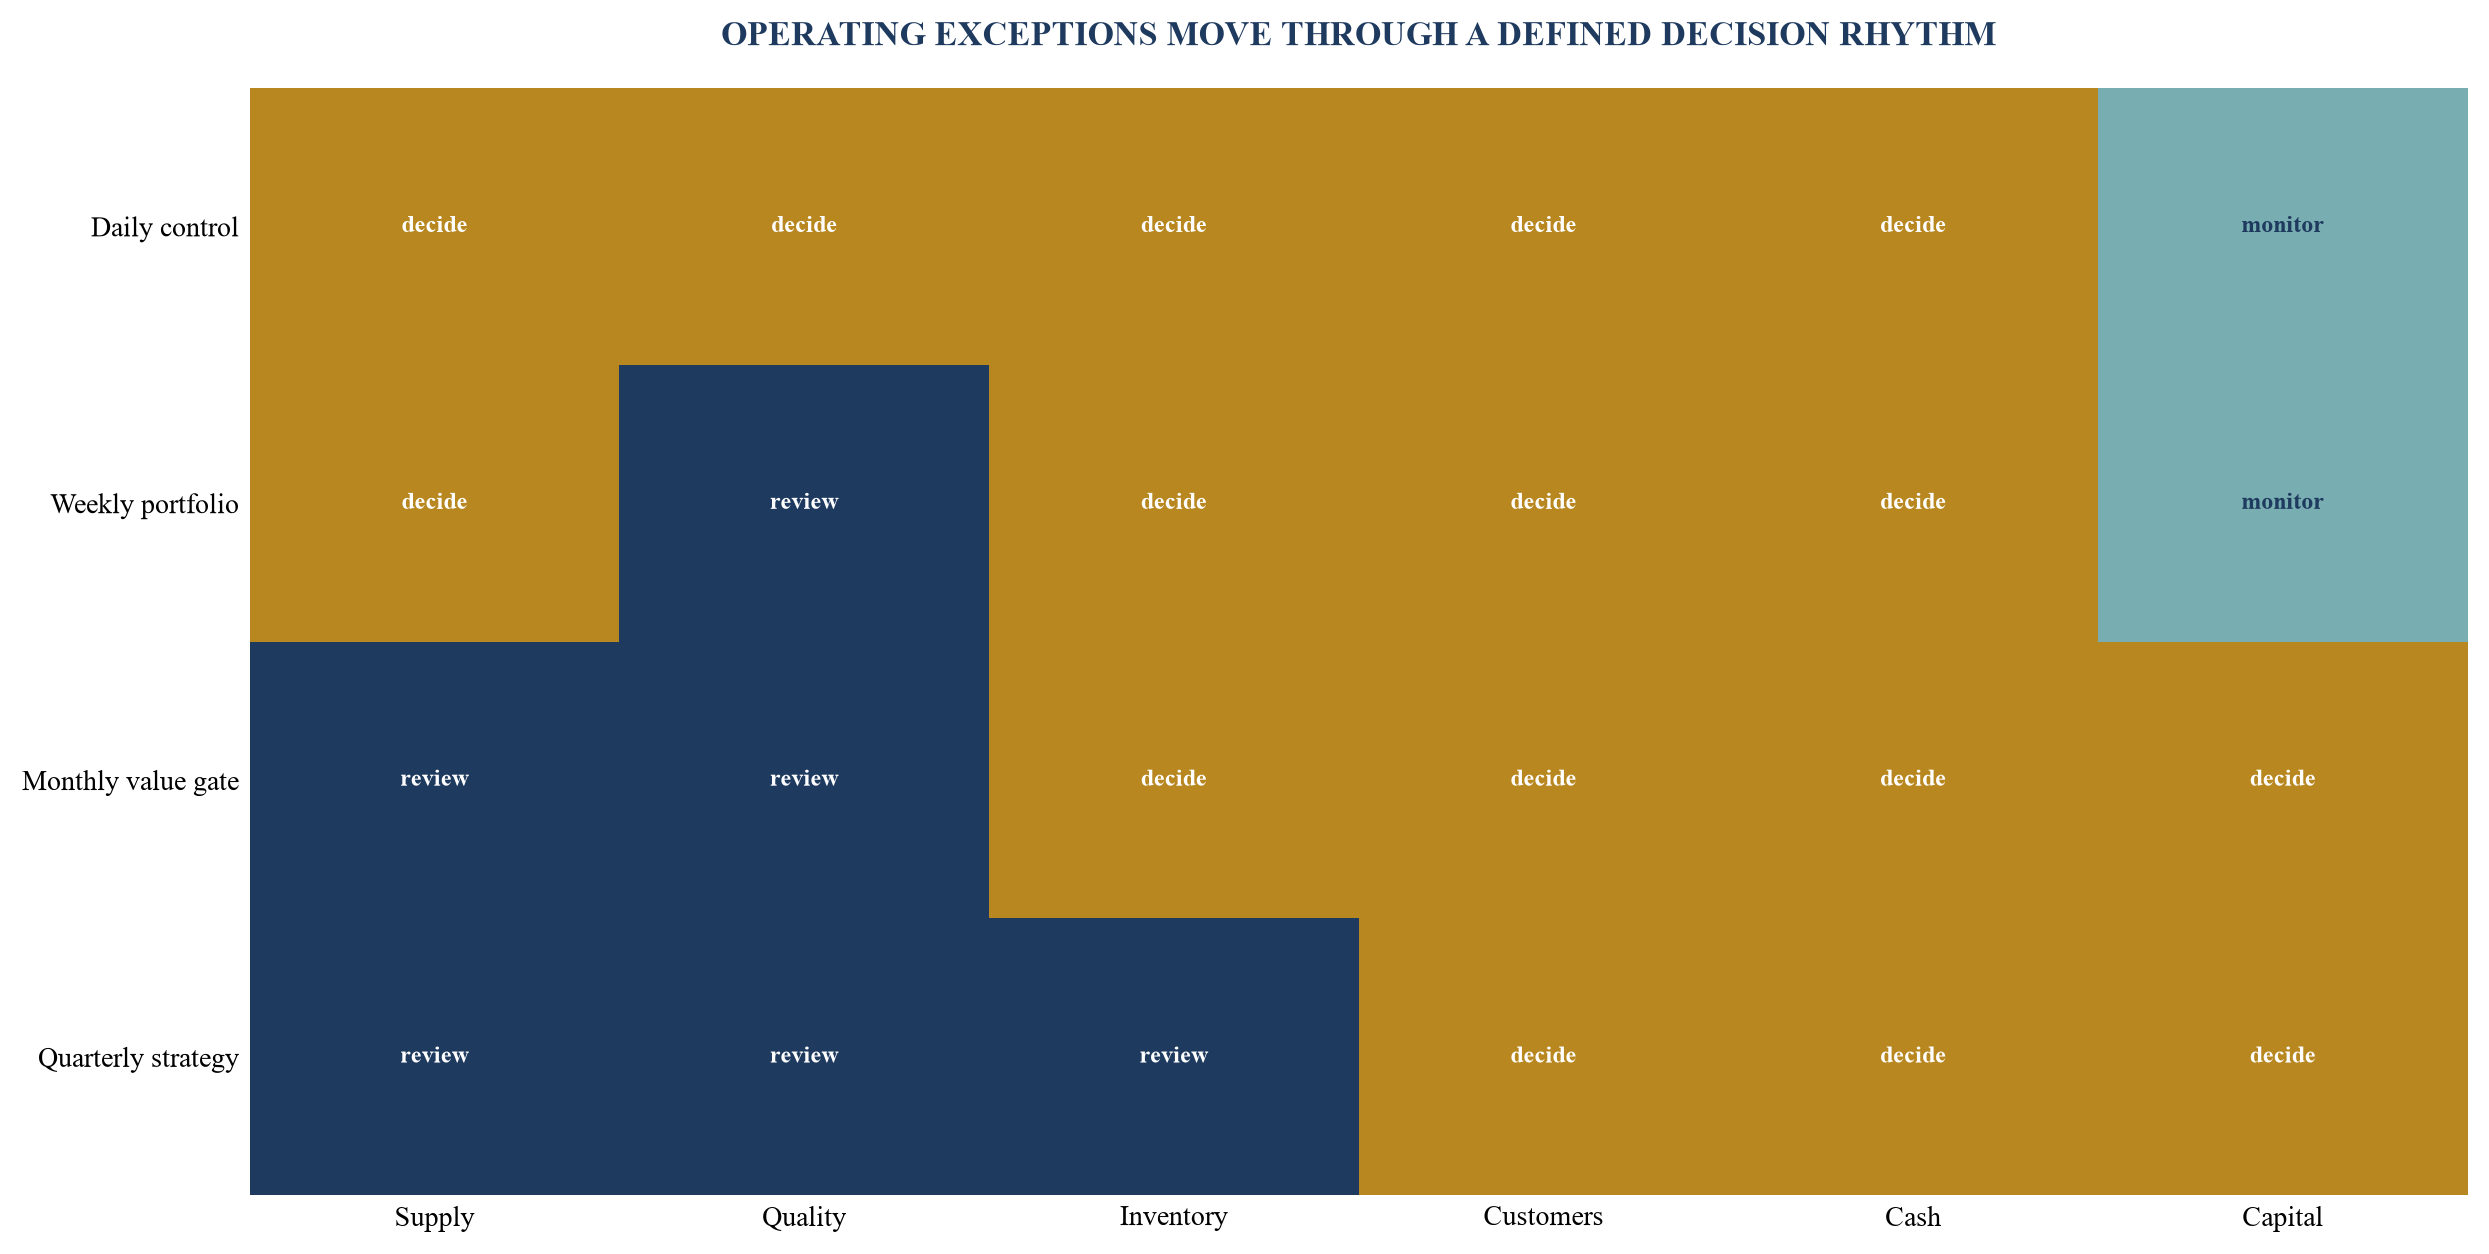
The cadence links physical exceptions to commercial, financial and board decisions without waiting for month-end reporting.
15. Hypothetical worked example
Consider a hypothetical integrated fresh-produce business sourcing from owned and contracted farms, operating a packhouse and cold store, and selling through retail, wholesale and food-service channels. Management reports revenue growth, yet peak seasonal borrowing has increased. The available data show purchase volumes, sales and aggregate waste; they do not connect supplier lots, grade yield, customer allocation, claims and collection.
The baseline reveals that production commitments are based on total-tonnage forecasts while customer demand is grade and week specific. Harvest peaks create queues at intake. Product waits before pre-cooling, premium grade falls, and lower grades enter channels with weak demand. Retail inventory is packed early to protect service levels, increasing remaining-life risk. Wholesale orders are profitable but receive residual stock too late.
The first intervention introduces appointment-based intake, source-level harvest forecasts and lot-level temperature and grade capture. A limited pilot aligns harvest time with packhouse capacity. Queue time declines in the hypothetical model, yet management records all labour, equipment and grower effects before accepting the result. Product is released only under existing quality authority.
The second intervention creates a grade-routing rule. Premium product follows contracted demand, standard product is allocated across retail, food service and wholesale using contribution and remaining life, and processing grade has a pre-agreed outlet. The rule includes customer service, logistics capacity and credit limits. Commercial teams can override it with a recorded reason and accountable approval.
The third intervention rebuilds customer economics. A high-volume retail programme retains its strategic role, but customer-specific stock is reduced and promotional forecasts require confirmation gates. Wholesale receives earlier visibility and defined capacity. Food-service pack formats are simplified. Claims are linked to delivery and condition evidence. The business negotiates terms only after establishing the cost and cash consequence.
The working-capital model separates pre-harvest support, supplier payables, raw inventory, packed stock, transit, receivables and financing. Management explores warehouse and receivables structures subject to legal and lender diligence. The board sees that part of the peak requirement comes from loss and early packing, part from customer terms, and part from the seasonal production cycle that must still be financed.
At the end of the programme, management presents verified physical changes, accepted accounting effects and realised cash separately. It does not claim every avoided loss as revenue or every inventory reduction as recurring profit. The board can decide which channel commitments, operating changes, financing instruments and capital projects create durable value.
16. Implementation principles
Start with product physics and the customer promise. Commodity, perishability, quality, regulation, production lead time and seasonality determine the feasible route. Commercial aspiration should operate within those constraints.
Freeze identifiers and definitions. Lot, location, ownership, condition, age, customer allocation, invoice and receipt need stable links. Corrections require dated authority rather than silent overwriting.
Measure loss in quantity, quality, price and cash. The board should see the stage and cause, recovery route, responsibility and final economic outcome. Global benchmarks can frame questions; company evidence should drive decisions.
Manage channels as portfolios. Compare contribution, working-capital intensity, data, concentration, service burden and exit flexibility. A high price can accompany poor cash economics.
Match finance to the asset and repayment event. Legal rights, custody, eligibility, insurance, dilution, concentration and reporting determine whether inventory or receivables can support funding.
Pilot reversible changes. Limit tests by product, supplier, facility, channel, customer or period. Preserve food safety, quality, supplier fairness and customer obligations. Scale only after evidence repeats.
Keep accounting and cash visible. Physical improvement, accounting recognition and bank movement occur on different evidence and timing. The value ledger should reconcile them without forcing equivalence.
17. Limitations and research agenda
The framework is analytical and operational. It does not establish agronomic advice, food-safety conclusions, commodity prices, customer terms, financing availability, accounting treatment, tax treatment or legal enforceability. Agribusinesses vary by commodity, geography, production model, climate, regulation, infrastructure, channel, ownership and market structure. Transaction-specific evidence and professional judgement remain essential.
Data may be incomplete or inconsistent. Weights can change with moisture. Lots can be blended. Quality samples may not represent the whole load. Product may move through third parties. Customer deductions can arrive after payment. Supplier and customer identifiers may differ across systems. A route-to-market reset should treat reconciliation as substantive work.
Future research should test which demand signals improve production commitments, which intake and cold-chain controls reduce economic loss, how channel concentration affects working-capital resilience, and how electronic warehouse receipts change finance access under different legal regimes. Anonymised lot-level evidence could also test how AI recommendations perform across seasons, commodities and operating conditions.
18. Conclusion
Agribusiness route-to-market strategy should connect the production commitment to collected cash. The board needs a lot-level account of physical flow, ownership, quality, service, contractual responsibility, accounting and liquidity. That account reveals where product gains value, where it deteriorates, where cash becomes locked and which party controls the outcome.
The reset begins with a frozen baseline and a complete farm-to-customer map. It aligns supply commitments with demand evidence, governs intake and grading, measures storage and processing yield, reconstructs spoilage, compares channel economics and rebuilds customer terms. The working-capital bridge then links pre-harvest cash, inventory, fulfilment, receivables, supplier credit and financing.
The programme creates value through controlled decisions. Opportunities remain distinct from approved action. Physical results remain distinct from accounting. Earnings remain distinct from realised cash. Financing remains connected to enforceable rights and controllable assets. Technology remains connected to an accountable decision and verified outcome.
A credible route-to-market system allows management, lenders and investors to reproduce the path from farm to customer. It improves the quality of commercial choices, protects product and relationships, reduces avoidable cash lock-up and shows which working capital is structural, which is contractual and which can be released through better execution.
References
- Food and Agriculture Organization of the United Nations, “Food loss measurement,” Technical Platform on the Measurement and Reduction of Food Loss and Waste, https://www.fao.org/platform-food-loss-waste/food-loss/food-loss-measurement/
- Food and Agriculture Organization of the United Nations, “FAO Policy Series: Food Loss and Food Waste,” https://www.fao.org/policy-support/policy-themes/food-loss-and-food-waste/fao-policy-series--food-loss---food-waste/
- Food and Agriculture Organization of the United Nations, “12.3.1 Global food losses,” SDG Indicators Data Portal, https://www.fao.org/sustainable-development-goals-data-portal/data/indicators/1231-global-food-losses/en
- OECD and Food and Agriculture Organization of the United Nations, OECD-FAO Agricultural Outlook 2025-2034, 15 July 2025, https://doi.org/10.1787/601276cd-en
- International Finance Corporation, “Improving Working Capital Finance for Agricultural Producers and Traders,” Global Warehouse Finance Program, updated July 2026, https://www.ifc.org/en/what-we-do/sector-expertise/trade-and-supply-chain-finance/global-warehouse-finance-program
- International Finance Corporation, Crops Receipts: A New Financing Instrument for Africa, 2019, https://www.ifc.org/en/insights-reports/2019/crops-receipts
- International Finance Corporation, “Global Supply Chain Finance Program,” https://www.ifc.org/en/what-we-do/sector-expertise/trade-and-supply-chain-finance/global-supply-chain-finance
- UNIDROIT and UNCITRAL, Model Law on Warehouse Receipts, adopted 2024, https://www.unidroit.org/instruments/warehouse-receipts/overview/
- Codex Alimentarius Commission, Codes of Practice, including General Principles of Food Hygiene and commodity storage and transport codes, https://www.fao.org/fao-who-codexalimentarius/codex-texts/codes-of-practice
- United Nations Economic Commission for Europe, Code of Good Practice: Reducing Food Loss and Ensuring Optimum Handling of Fresh Fruit and Vegetables Along the Value Chain, 2023, https://unece.org/trade/publications/code-good-practice-food-loss
- United Nations Economic Commission for Europe, Recommendation No. 49: Transparency at Scale, April 2026, https://unece.org/trade/publications/recommendation-ndeg-49-ecetrade493-transparency-scale-fostering-sustainable
- World Trade Organization, Agreement on the Application of Sanitary and Phytosanitary Measures, https://www.wto.org/english/docs_e/legal_e/sps_e.htm
- IFRS Foundation, IAS 41 Agriculture, https://www.ifrs.org/issued-standards/list-of-standards/ias-41-agriculture/
- IFRS Foundation, IAS 2 Inventories, https://www.ifrs.org/issued-standards/list-of-standards/ias-2-inventories/
- IFRS Foundation, IFRS 15 Revenue from Contracts with Customers, https://www.ifrs.org/issued-standards/list-of-standards/ifrs-15-revenue-from-contracts-with-customers/
- IFRS Foundation, IAS 7 Statement of Cash Flows, https://www.ifrs.org/issued-standards/list-of-standards/ias-7-statement-of-cash-flows.html/
