

1. Begin with the transaction decision
An industrial data room can contain millions of records and still leave the investment committee unable to answer the central questions. The useful starting point is a decision map: which assumptions drive value, which risks could impair cash, which facts affect completion, and which actions need funding after control passes. The data request then follows the decision map.
Five questions usually organise the work. First, can the plant convert orders into conforming output at the stated rate? Second, what physical condition and maintenance burden sit behind current production? Third, which cost, energy and yield assumptions support maintainable margin? Fourth, which liabilities, cash needs and capital projects should affect price or contractual protection? Fifth, what must the buyer do in the first 100 days to protect continuity and verify the value thesis?
AI is useful when it helps the team connect a large and heterogeneous evidence set. It can identify repeated alarm sequences, classify work-order text, detect unusual cycle-time distributions, align documents, cluster failure modes and test operating scenarios. NIST's 2026 smart-manufacturing roadmap describes industrial big-data complexity, heterogeneous sensing and control systems, and the need for trustworthy, explainable and reliable operation.[1] Those characteristics make industrial diligence a controlled analytical problem rather than a generic automation exercise.
The diligence charter should name each decision, evidence owner, source system, test, reviewer and deadline. It should also state what the analysis cannot establish. A model may detect correlation between a vibration signature and unplanned downtime. Engineering inspection must determine the physical explanation. A work-order classifier may identify recurring bearing failures. Procurement and maintenance evidence must establish whether parts, skills and shutdown windows are available. A throughput forecast can support valuation only after it reconciles to saleable output, customer demand and cash.
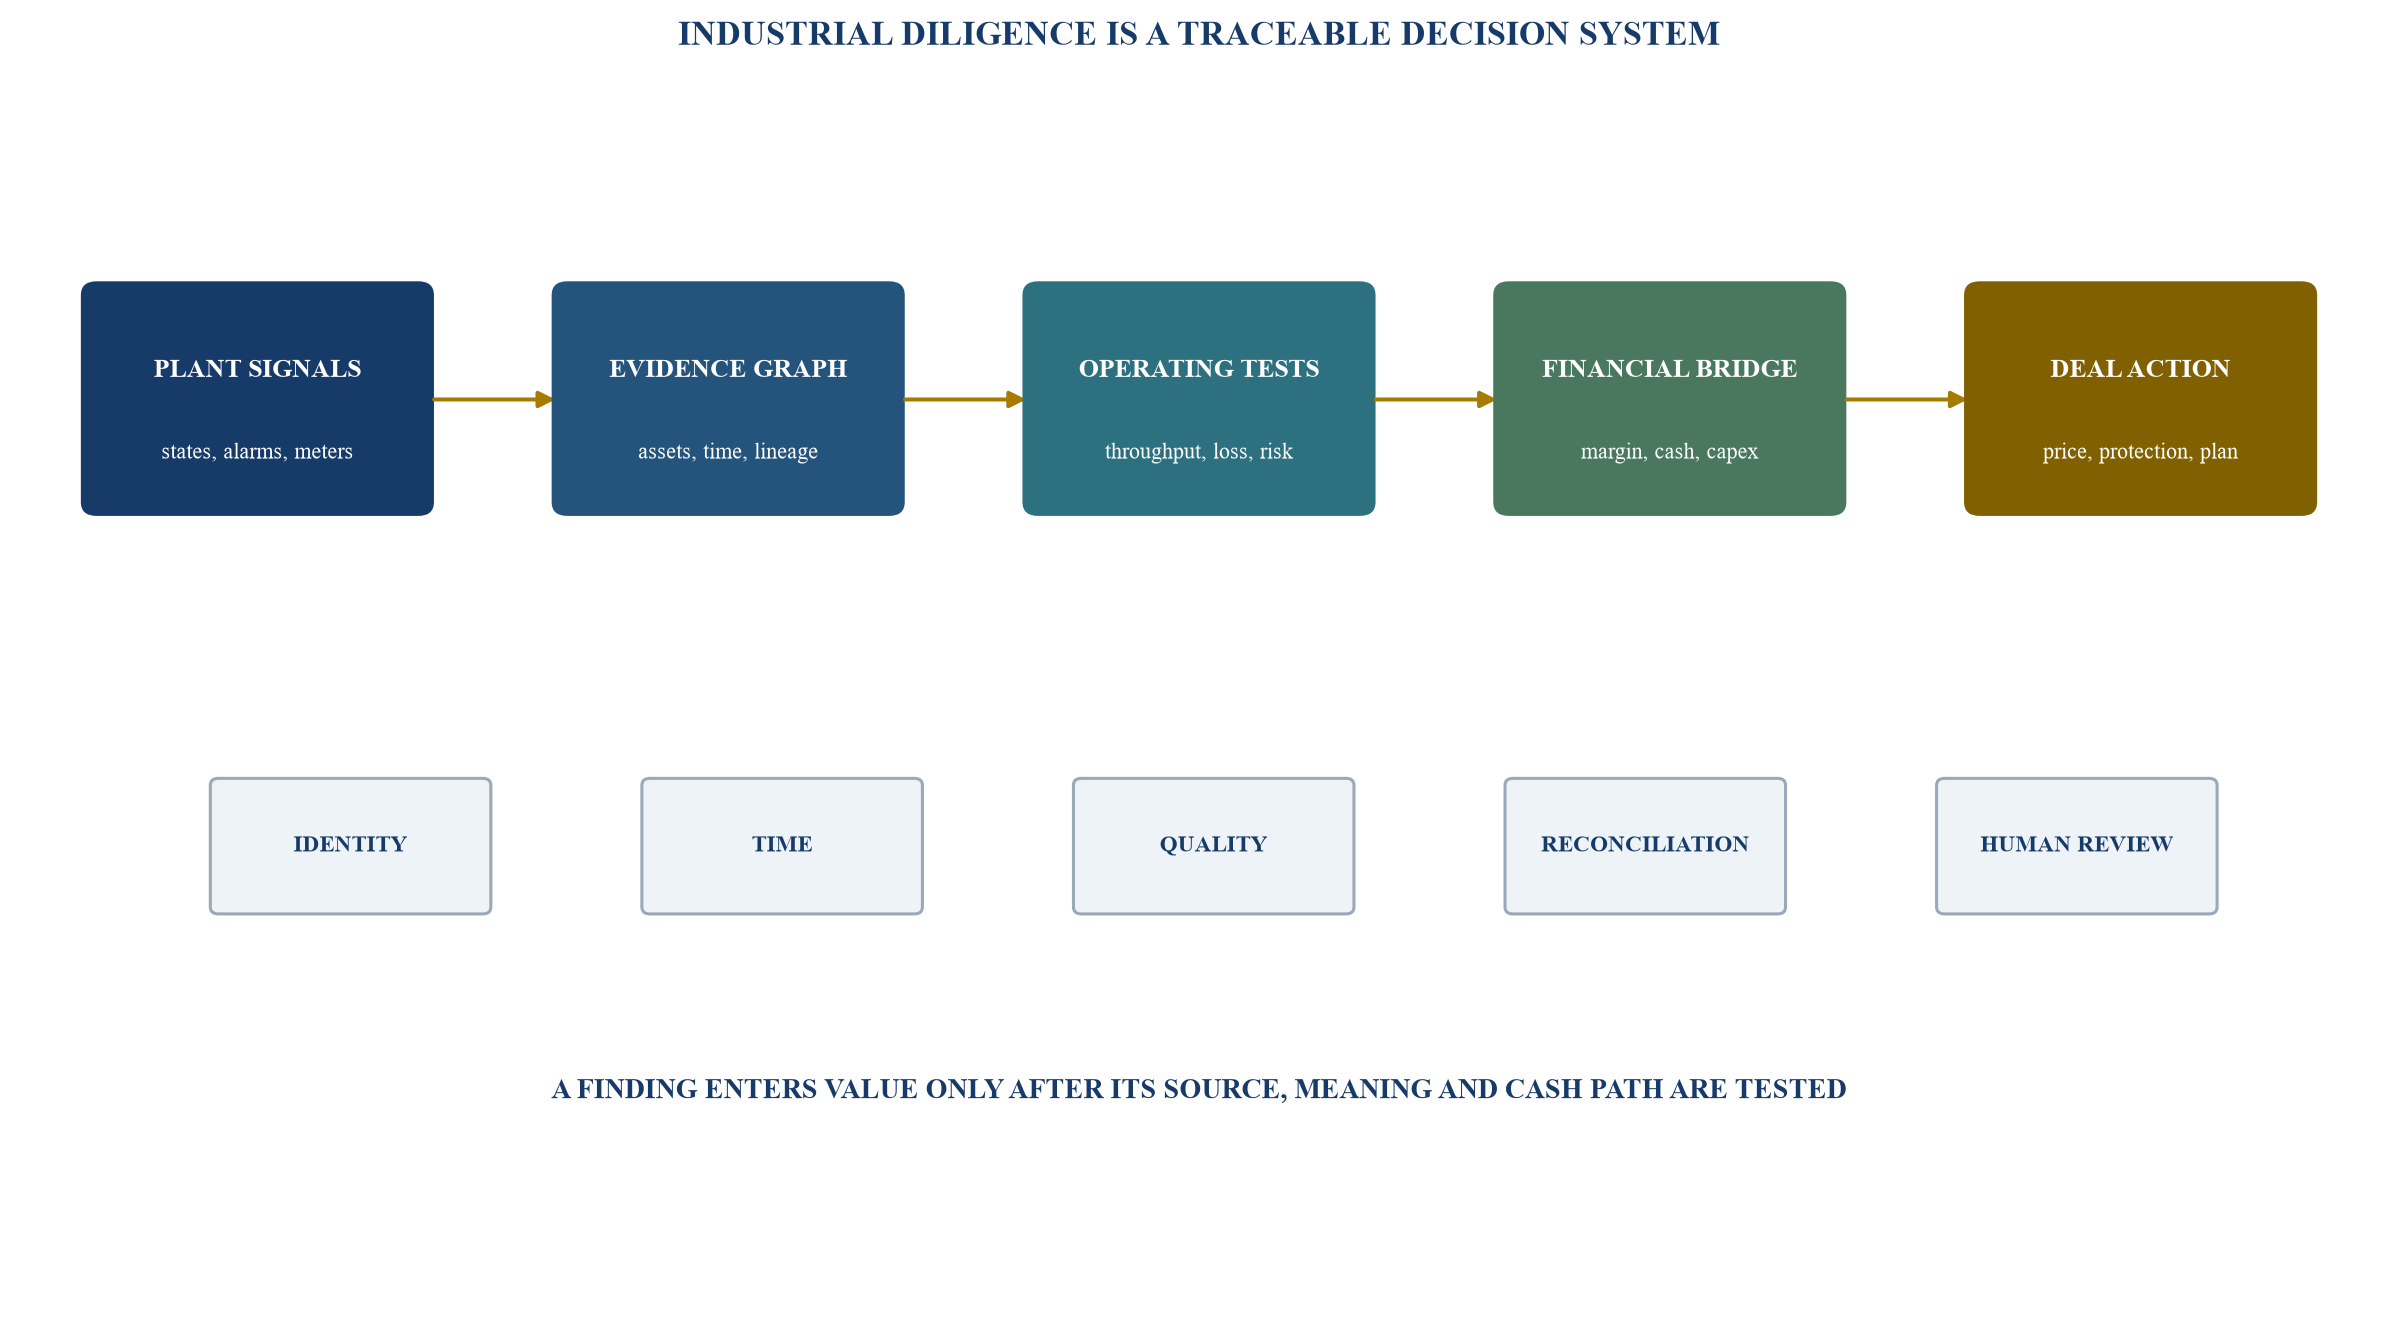
Each decision requires traceable operational, engineering and financial evidence.
2. Define the plant and data perimeter
The legal entity is rarely the correct analytical boundary. Production may depend on leased equipment, supplier-owned tooling, shared utilities, third-party warehouses, contract manufacturers, group information systems and personnel employed elsewhere. The perimeter should follow the product and cash flow from customer order through planning, materials, conversion, testing, dispatch, invoicing and collection.
The asset perimeter should identify production lines, cells, utilities, buildings, laboratories, tooling, mobile equipment, warehouses and environmental-control systems. Each material asset needs a stable identifier, location, owner, manufacturer, model, commissioning date, rated capacity, current use, criticality and source records. ISO 55001:2024 places decision-making, value, data and information, knowledge and life-cycle management within the asset-management system.[3] That structure is useful for diligence because it connects asset facts to organisational objectives and risk.
The system perimeter should cover operational technology and enterprise technology. Typical sources include programmable logic controllers, supervisory control and data acquisition systems, distributed control systems, historians, manufacturing-execution systems, laboratory systems, computerised maintenance-management systems, enterprise-resource-planning systems, quality systems, energy meters, warehouse systems and spreadsheets. NIST defines operational technology broadly as programmable systems and devices that interact with the physical environment and notes their distinct performance, reliability and safety requirements.[7]
Access design matters. The buyer should request extracts through a controlled path agreed with the seller, cyber advisers and plant management. Live interrogation of production systems can introduce availability and security risk. Read-only exports, documented query windows, clean-room analysis and seller-supervised validation may be appropriate. The team should record access restrictions and gaps because a missing source can change confidence in a finding.
Table 1. Industrial diligence perimeter and decision use
| Evidence domain | Typical records | Primary transaction question | Principal limitation |
|---|---|---|---|
| assets and configuration | register, drawings, bills of material, control versions | what is owned, critical and replaceable? | identifiers may be inconsistent |
| production | orders, runs, counts, cycle time, state history | can stated throughput be reproduced? | counters may reset or include rework |
| quality | inspection, deviations, scrap, complaints, traceability | how much output is saleable and compliant? | defect coding may change over time |
| maintenance | work orders, alarms, spares, labour, shutdowns | what failure and deferred-work burden exists? | closed work orders may lack root cause |
| energy and utilities | meters, tariffs, demand, production context | what energy intensity and constraint affects margin? | site totals may mask line performance |
| finance and commercial | ledger, invoices, inventory, capex, contracts | how do plant facts affect earnings and cash? | period and product mappings may differ |
The perimeter follows production and cash rather than the legal-entity chart alone.
3. Build an evidence graph before building a model
Industrial systems often describe the same event differently. A production order may have one number in the enterprise system, another in the manufacturing system and no direct key in the historian. A machine may be known by an asset tag, line nickname, controller address and maintenance code. A quality record may refer to a batch that spans several machine runs. The evidence graph resolves those relationships.
The graph has four organising dimensions: identity, time, state and quantity. Identity links plant, line, machine, tool, product, order, batch, material, work order, operator role and financial account. Time establishes a common chronology, including time zone, daylight-saving treatment, clock drift, aggregation interval and late entry. State defines running, planned stop, unplanned stop, changeover, starved, blocked, maintenance, test and idle conditions. Quantity defines units, good output, scrap, rework, energy, material, labour and cost.
Every transformation should be recorded. Raw files receive hashes and access controls. Parsers record field names, units and rejected rows. Mapping tables show how local codes become common categories. Derived measures identify their formula, version and owner. A diligence conclusion should be reproducible from the preserved extract without reconnecting to the plant.
Data profiling comes before anomaly detection. The team should measure coverage, missingness, duplicates, impossible values, counter resets, timestamp gaps, unit changes, out-of-sequence events and identifier collisions. A model trained on a period when one sensor was faulty can produce a confident answer to the wrong question. NIST's AIMS programme combines metrology, physics-based models and AI, with periodic verification and model updating, to support accurate and trustworthy machine monitoring.[2] The same principle applies in transaction analysis.
Seller management should review the evidence graph, while the buyer retains an independent record of assumptions and exceptions. Plant operators often know that an apparent stoppage is a planned clean-down, that a quality code changed after a system migration, or that an asset tag covers two physical machines. Their explanation becomes evidence when it is documented and tested against records.
4. Establish data reliability and model governance
The diligence team should grade evidence before using it. Grade A evidence may reconcile across a controlled system, physical observation and finance. Grade B may be complete and internally consistent but lack an independent cross-check. Grade C may be partial, manually maintained or dependent on explanation. Grade D may be unavailable, contradictory or unsuitable for the proposed conclusion. The grade attaches to a specific use; a dataset can support scheduling analysis while remaining unsuitable for valuation.
AI models require their own control record. The record should state the intended use, training or reference data, features, algorithm, test period, performance measures, limitations, reviewer and version. NIST's AI Risk Management Framework describes valid and reliable, safe, secure and resilient, accountable and transparent, explainable and interpretable, privacy-enhanced and fair characteristics.[8] Industrial diligence should emphasise validity, reliability, safety, security, explainability and accountability in the plant context.
The team should test leakage and circularity. If a maintenance work order created after a breakdown is used to predict the same breakdown, the model may simply recognise the outcome. If production volume and revenue are both derived from the same manually uploaded file, apparent reconciliation is not independent. If the test period includes the training period, reported performance can be overstated.
Human review should focus on high-value decisions and model failure modes. Engineers examine whether features have physical meaning. Operators review unusual states. Finance tests whether operating changes reach the ledger and cash. Cyber specialists assess whether the analysis path exposes operational systems. Legal advisers consider data rights, privacy, confidentiality and permitted use. The investment committee receives a conclusion, confidence grade and sensitivity; it does not receive an unexplained model score.
Table 2. Evidence-grade framework for transaction use
| Grade | Data condition | Corroboration | Permitted use | Required action |
|---|---|---|---|---|
| A | complete, controlled and reconciled | physical or independent system plus finance | direct input to supported deal analysis | retain lineage and reviewer sign-off |
| B | materially complete and consistent | partial independent check | base case with stated sensitivity | close defined corroboration gap |
| C | partial, manual or explanation-based | limited | scenario or protection discussion | seek evidence, price uncertainty or plan action |
| D | unavailable, contradictory or unsuitable | none | no affirmative valuation reliance | treat as unresolved risk and govern access |
Grade applies to the stated conclusion and can change as corroborating evidence is obtained.
5. Reconstruct throughput from events, not slogans
Rated capacity, demonstrated capacity and saleable capacity are different measures. Rated capacity reflects design conditions. Demonstrated capacity reflects a defined historical period, product mix, labour pattern and asset state. Saleable capacity also incorporates yield, quality release, downstream constraints, demand and logistics. The diligence model should keep them separate.
ISO 22400 defines manufacturing-operations KPIs through formulas, elements, time behaviour, units and user groups.[4] A common vocabulary helps, while local system definitions still require verification. Overall equipment effectiveness, availability, performance and quality measures can be useful, but they can conceal losses when planned time, ideal cycle time or good-count rules are selected optimistically.
The throughput reconstruction should begin with individual runs. It links order, product, start and end, planned quantity, total count, good count, scrap, rework, machine state, labour, material and quality release. The model then explains the difference between theoretical production and shipped conforming units through planned shutdown, changeover, breakdown, starved time, blocked time, reduced speed, startup loss, defect, hold and logistics loss.
Product mix is central. A line may achieve high output on a simple product and struggle on the products that carry future demand. Changeovers may consume capacity as variety increases. Bottlenecks can move between process steps. A monthly average can therefore mask the sequence and constraint that determine cash generation.
The team should compare management's plan with a bottom-up capacity model. Each incremental unit needs machine time, labour, tooling, material, utility capacity, quality capacity, maintenance support and customer demand. Where the model depends on overtime, deferred maintenance or unusually low changeover, the investment committee should see the operating condition and cost.
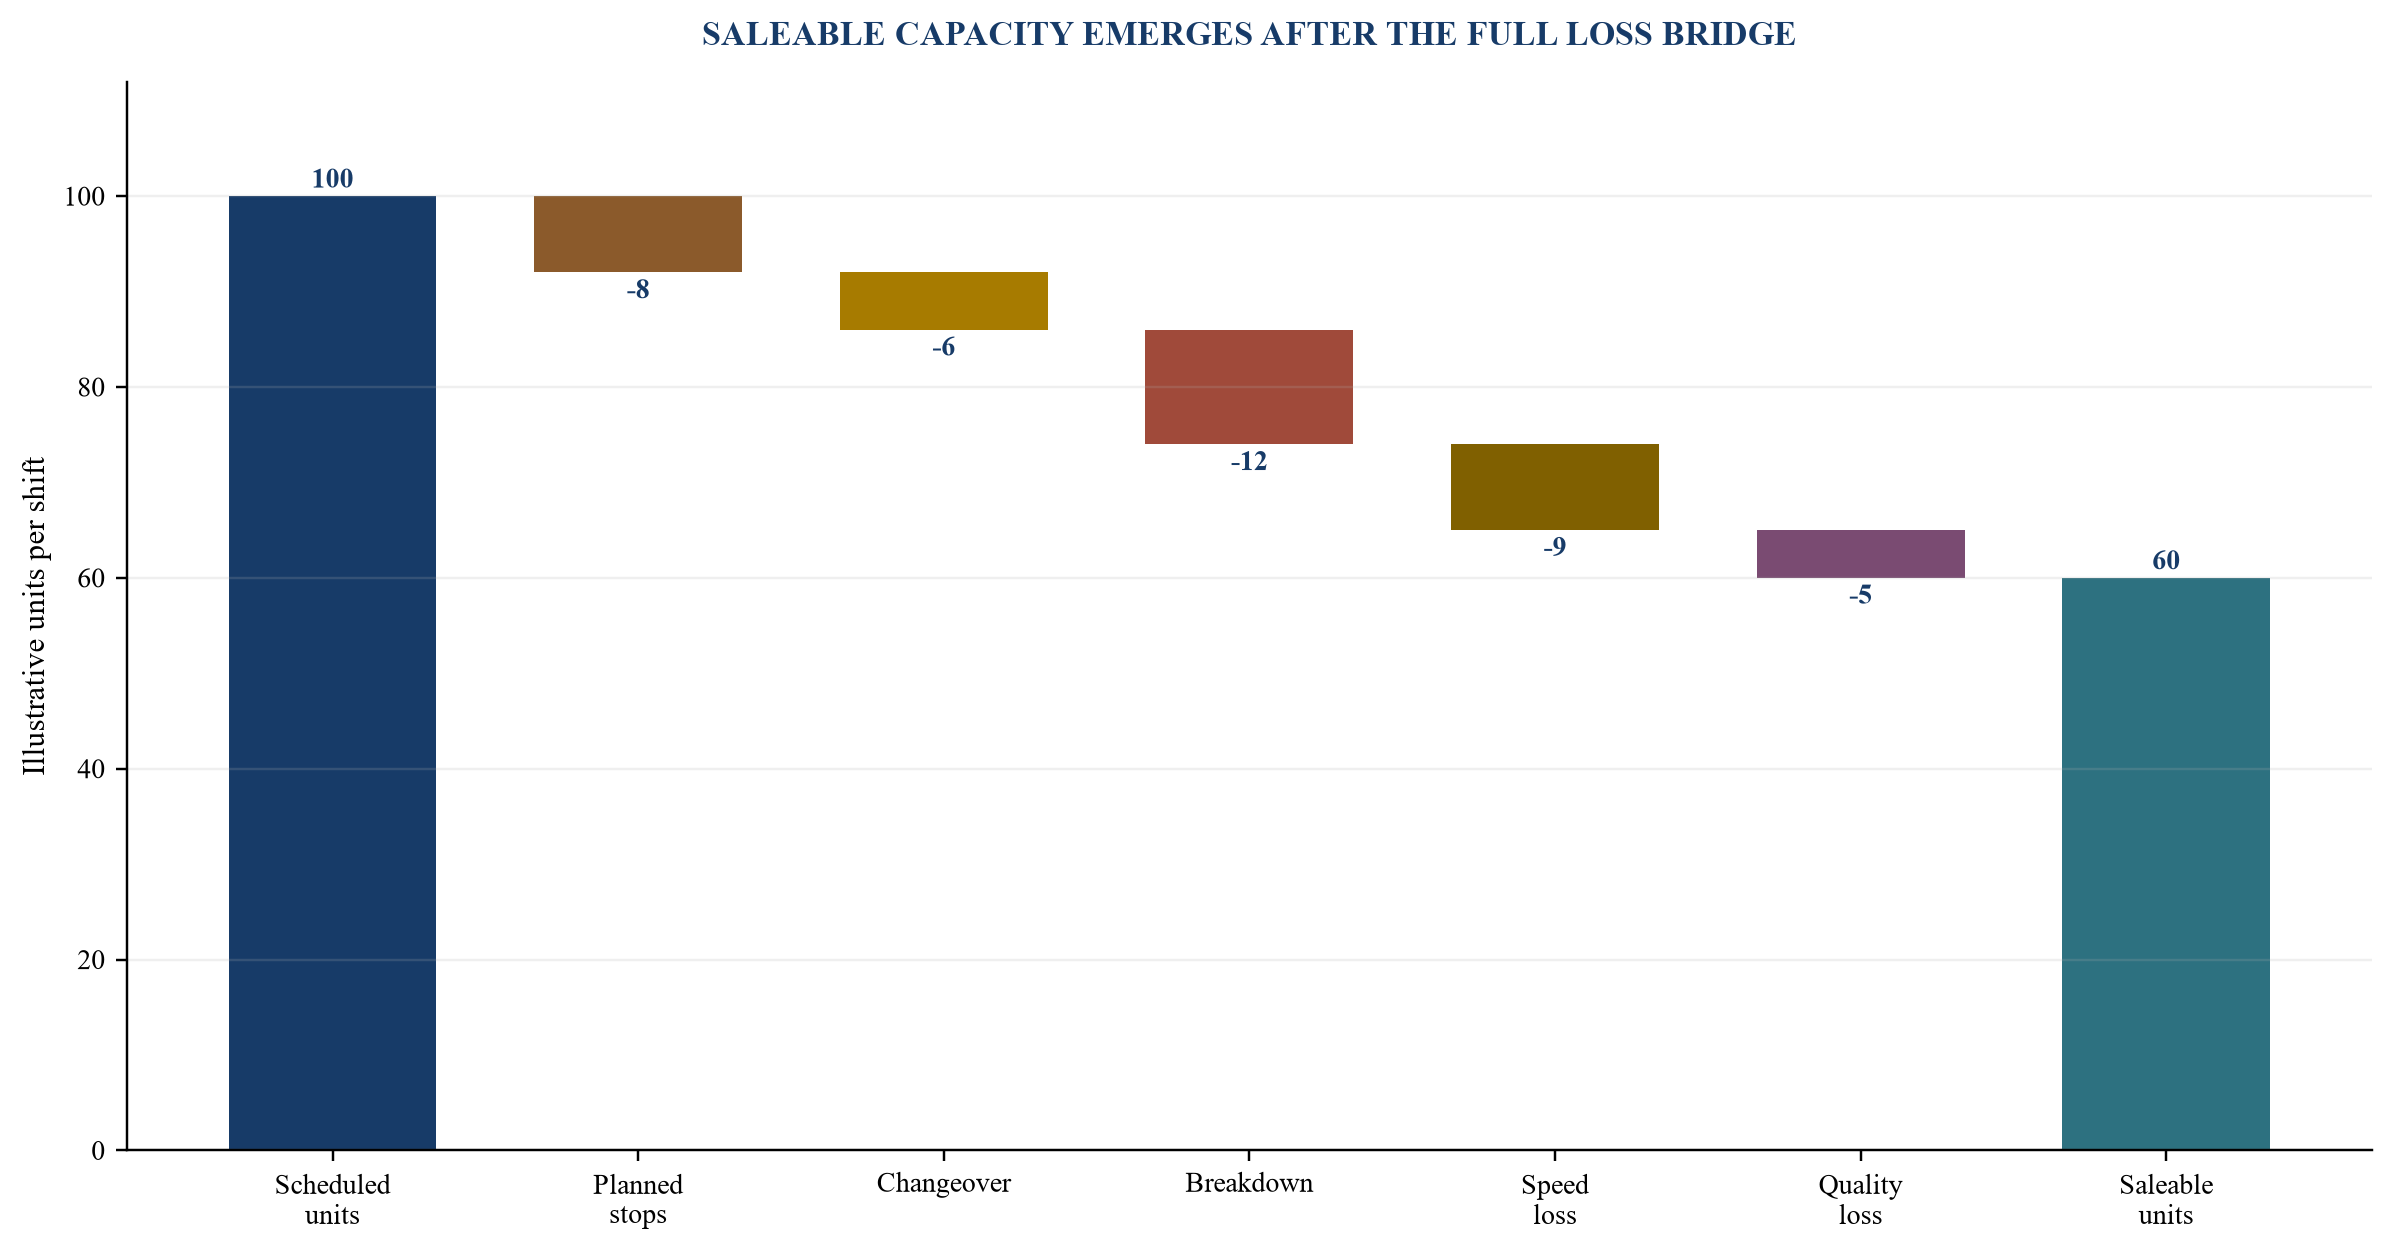
Values are hypothetical management assumptions and demonstrate loss attribution.
6. Separate downtime symptoms from maintenance causes
Downtime classification often reflects reporting convenience rather than physical cause. A line may record "mechanical" while the underlying sequence begins with contamination, poor setup, a failed sensor or delayed spare part. Diligence should reconstruct event chains and then review the physical explanation.
The maintenance dataset should connect alarms, operator calls, work requests, work orders, labour, parts, failure codes, inspections, condition-monitoring results and production recovery. It should distinguish planned, preventive, predictive and corrective work. Closed work orders need completion evidence, and repeated temporary repairs should remain visible.
HSE guidance states that work equipment should be maintained in efficient order and that maintenance logs should remain current where they exist; it also emphasises competence, safe isolation and planning.[6] Diligence should therefore consider maintenance governance and safety alongside cost and availability. A backlog of safety-critical inspections is different from a backlog of cosmetic work.
Criticality determines the economic response. A low-cost component can stop a line when there is no redundancy or spare. A large asset may have a redundant train and limited near-term consequence. The team should map single points of failure, lead times, specialist dependence, obsolescence, inspection intervals, failure history and recovery time.
AI can classify unstructured work-order text and identify recurring sequences, while the result requires engineering validation. The model may show that similar alarm combinations precede failure. The engineer determines whether the pattern reflects wear, process conditions, instrumentation or coding. The valuation question then concerns expected production loss, maintenance spend, capital replacement, insurance and customer consequence.
Table 3. Maintenance-risk map
| Risk dimension | Evidence | Analytical test | Deal consequence | 100-day action |
|---|---|---|---|---|
| repeat failure | alarm and work-order sequence | recurrence and root-cause closure | earnings sensitivity or specific protection | engineering review and permanent remedy |
| deferred work | backlog age, criticality and planned hours | capacity and safety exposure | capex or working-capital consideration | funded shutdown plan |
| spare dependency | usage, stock, lead time and sole source | time to recover under failure | inventory target or covenant | critical-spares policy |
| obsolescence | controller, drive and software versions | support and replacement path | capex reserve and access rights | architecture and migration plan |
| contractor dependence | work history and service agreements | response, competence and continuity | contract consent or retention | secure coverage and knowledge transfer |
| inspection control | legal, insurer and OEM requirements | overdue or adverse findings | condition, indemnity or remediation | close critical inspections |
Priorities combine safety, production, quality, environment, lead time and recoverability.
7. Test energy as a production variable
Energy analysis should connect consumption to output, product, operating state, weather where relevant, tariff, demand charge and utility constraint. A site-level bill can identify total spend but may not explain the production economics of individual lines or products. Sub-metering quality therefore affects confidence.
The US Department of Energy's industrial tools address plant-level efficiency and systems such as compressed air, motors, process heating, cooling, pumps and steam.[5] Its energy-management guidance states that useful data can include consumption, efficiency, loading, operating time, production and cost, and that baselines and performance indicators should follow the chosen metric.[9] These principles support a transaction energy bridge.
The team should normalise energy intensity for operating conditions. A plant may consume substantial baseload during idle periods because furnaces, compressed air, chilled water or environmental controls remain active. Startup and shutdown can create energy and yield loss. Peak demand may reflect simultaneous loads rather than annual consumption. Product mix can change energy intensity.
The financial model should distinguish tariff exposure, physical efficiency and required investment. A lower tariff can hide poor performance. An efficiency project can require shutdown, engineering design and verification. A renewable-energy contract can introduce volume, price, credit and change-of-control terms. Claims of savings should therefore show baseline, action, cost, timing, uncertainty and measurement method.
Energy data can also reveal operating anomalies. A compressor running during non-production hours, rising motor current, higher furnace energy per conforming unit or unstable cooling demand may support further investigation. Such signals are diagnostic leads rather than standalone proof of condition.
8. Convert quality data into margin and liability evidence
Gross output is economically relevant only when it becomes conforming, accepted and collectible output. Quality diligence should connect process parameters, inspection, deviation, scrap, rework, customer complaint, return, warranty, concession and corrective action. The analysis should distinguish detection from underlying defect generation.
Yield can appear stable while inspection intensity falls or concessions rise. Scrap may be booked to material variance while labour and machine time remain in conversion cost. Rework can consume bottleneck capacity and delay other orders. Customer returns can arrive months after production. The model should therefore follow the quality event through production, inventory, invoice, credit note, cash and any warranty cost.
AI can support pattern recognition across process variables and defect records. It can cluster defect descriptions, compare images where rights and quality permit, and identify parameter combinations associated with failure. The training labels and inspection system require review. A model cannot recover defects that were never recorded or consistently misclassified.
The transaction response depends on whether the exposure is historical, ongoing or contingent. A known batch issue may support a specific indemnity or escrow. A recurring process weakness may reduce maintainable margin and require funded remediation. A weak traceability system can support broader contractual protection and a Day 1 control action. Customer-specific approval or certification issues may affect closing conditions.
9. Reconcile the plant model to quality of earnings
Operational analysis becomes transaction evidence when it explains financial performance. The team should bridge volume, mix, price, yield, labour, material, energy, maintenance, overhead and working capital from the plant model to the general ledger. Differences should be documented rather than forced into a false reconciliation.
Maintainable earnings require a normal operating basis. Recent margin may reflect deferred maintenance, supplier stretch, low inspection, unusual overtime, temporary labour, favourable mix, customer advances, capitalised cost or a period without major shutdown. The operational model should identify the physical and timing assumptions behind each adjustment.
Throughput upside deserves disciplined treatment. A demonstrated improvement can enter a scenario when the action, capacity, demand, cost, quality and cash path are supported. Unused theoretical capacity is not earnings. A modelled AI optimisation without production validation is an initiative rather than maintainable EBITDA.
The bridge should avoid double counting. A reduction in breakdown time may increase output, reduce overtime and lower repair cost, but the same production gain should not appear in several synergy lines. Energy savings may already be captured in unit cost. Scrap reduction can improve material cost and capacity simultaneously; the model should assign one coherent cash effect.
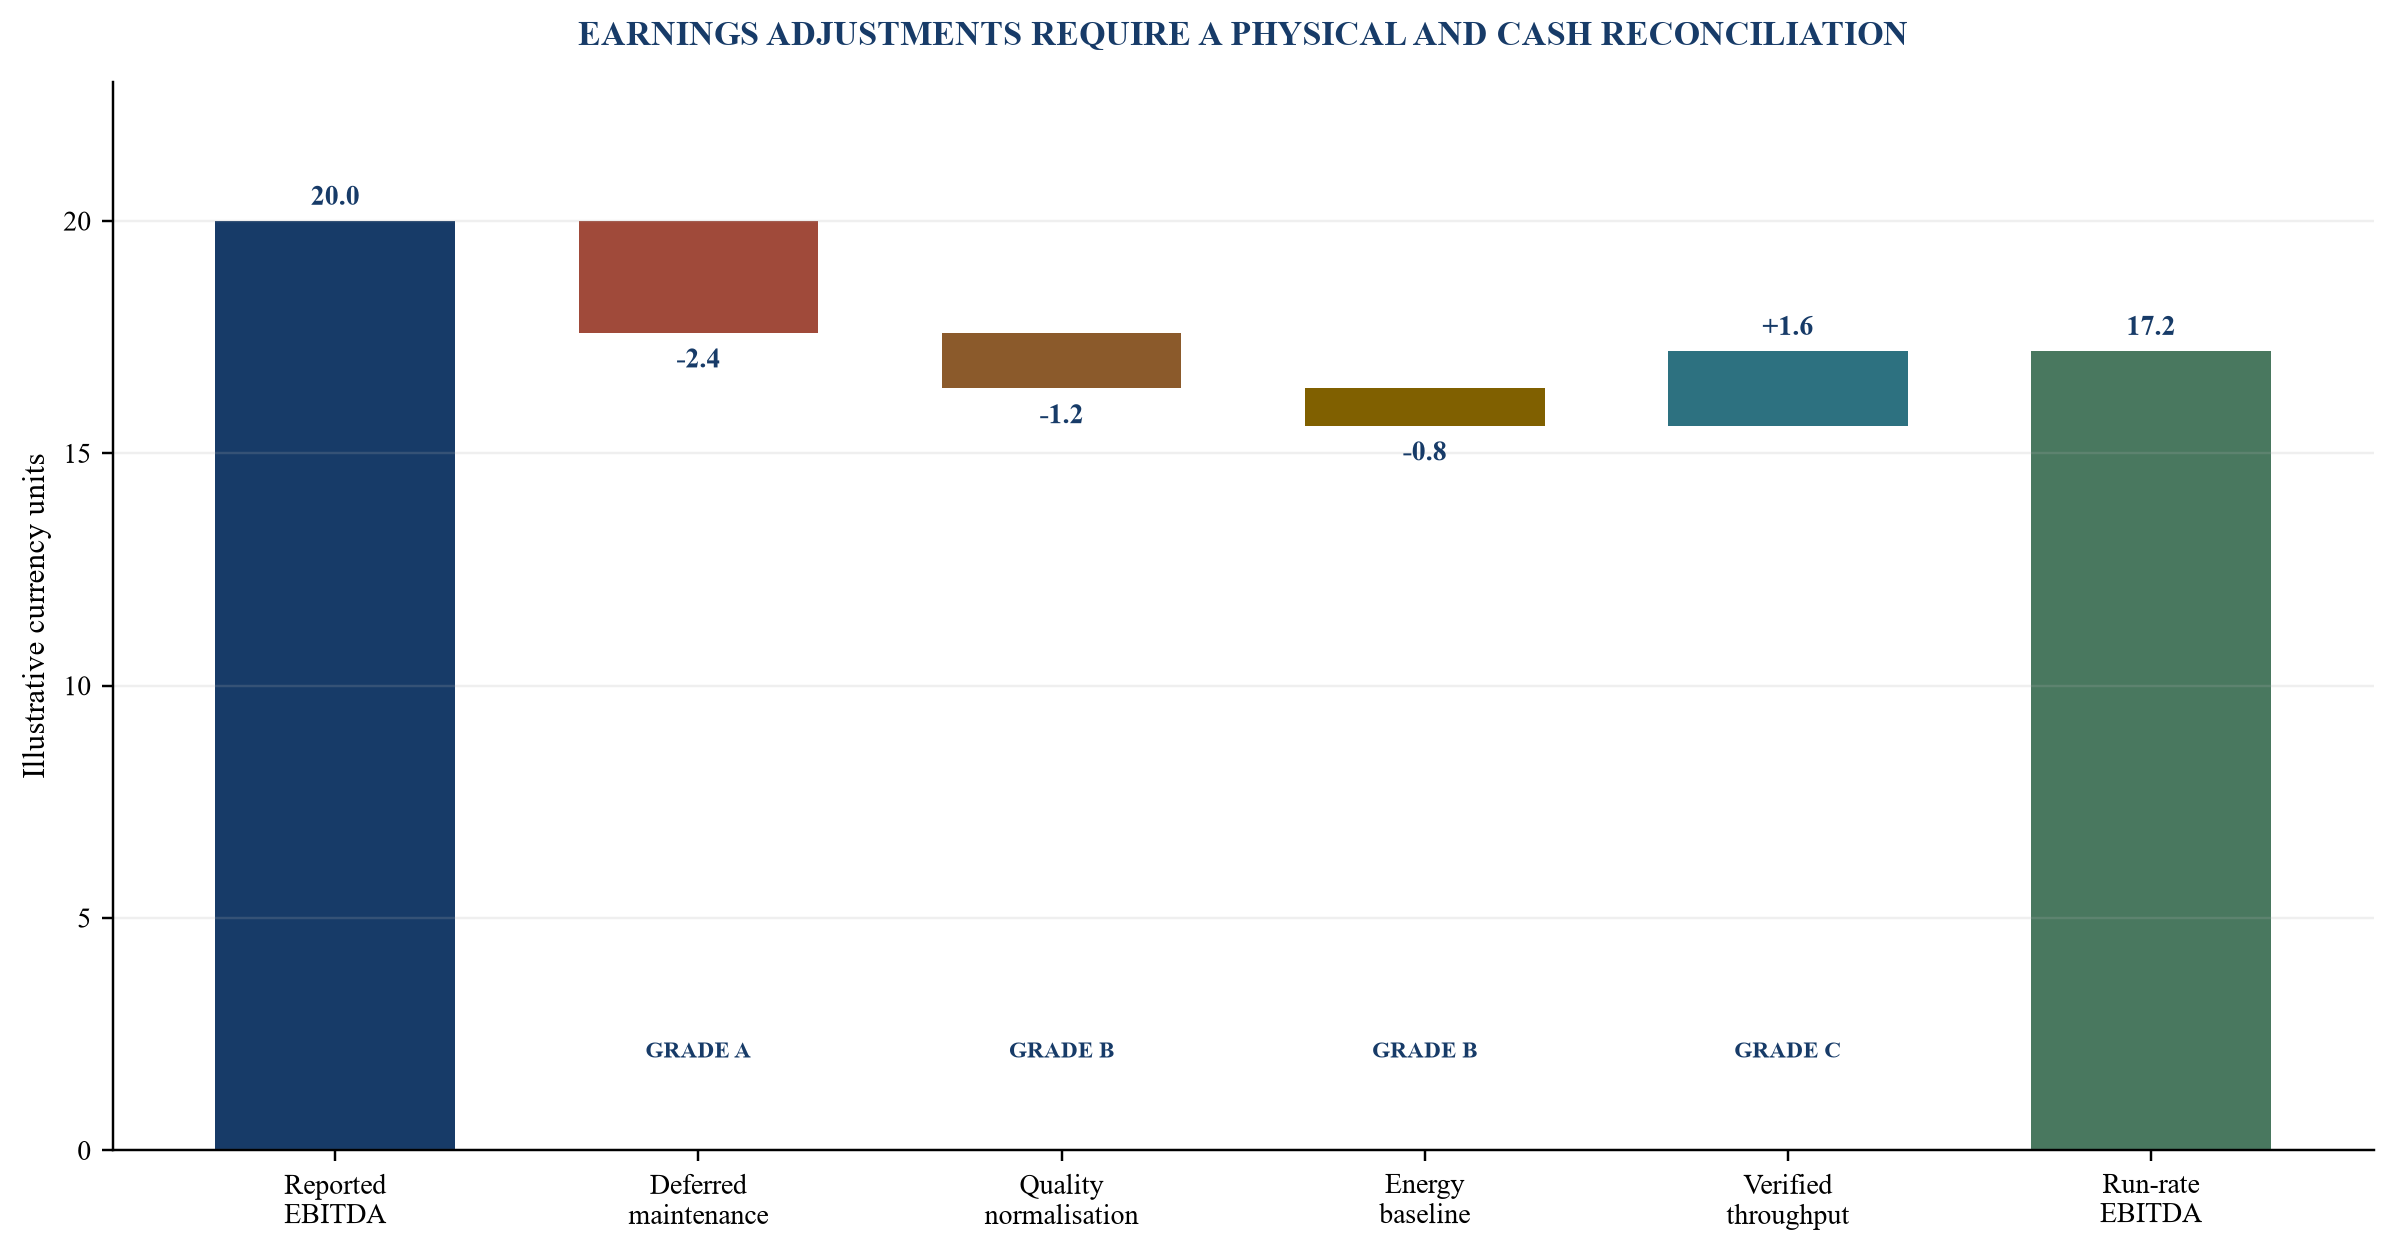
Values and confidence grades are hypothetical management assumptions.
10. Translate condition into capital expenditure
Maintenance expense and capital expenditure describe different accounting treatments; industrial risk follows physical need and cash timing. The diligence team should identify sustaining capital, compliance capital, reliability capital, growth capital and transformation capital. Each item needs scope, urgency, cost basis, shutdown requirement, dependencies and confidence.
IAS 16 addresses recognition, carrying amount, depreciation and derecognition of property, plant and equipment.[11] IAS 36 requires assessment of recoverable amount when impairment indicators exist and defines recoverable amount through fair value less costs of disposal and value in use.[12] IFRS 13 provides a framework for fair-value measurement.[13] These standards inform accounting and valuation analysis; they do not replace engineering assessment of condition or transaction definitions.
Condition should be tested through inspection, maintenance history, operating data, OEM guidance, statutory or insurer records and specialist assessment. Age alone is an incomplete proxy. A well-maintained older asset can be reliable; a newer asset operated outside design conditions can carry substantial risk. Remaining life should be expressed as a range with its operating assumptions.
The capex schedule should connect to the production plan. A replacement may require a long-lead order, design, permits, civil work, controls integration, commissioning and ramp-up. The associated downtime, inventory build, customer qualification and working capital can exceed the equipment invoice. These cash effects should appear in the deal case and 100-day plan.
Table 4. Capital-expenditure classification and transaction treatment
| Capex class | Evidence test | Financial treatment question | Deal response | Execution gate |
|---|---|---|---|---|
| sustaining | required to hold current output and quality | is current margin supported by normal spend? | earnings normalisation or price case | funded plan and outage window |
| compliance | required by law, permit, insurer or customer | who bears existing non-compliance? | condition, indemnity, escrow or price | approval and closure evidence |
| reliability | removes recurring failure or single point | is cash benefit included elsewhere? | specific reserve or value initiative | engineering scope and baseline |
| growth | adds capacity for supported demand | does demand and bottleneck analysis support it? | separate investment case | customer, capacity and funding gate |
| transformation | changes automation, data or process | is benefit demonstrated or speculative? | scenario only until validated | pilot, cyber and adoption gate |
Treatment depends on verified facts, accounting policy and negotiated definitions.
11. Connect inventory and working capital to the factory
Inventory is the physical memory of production decisions. Raw material can cover supplier lead time, minimum order quantities, yield loss and quality risk. Work in progress can reflect normal routing, bottlenecks, hold status, rework or weak close-out. Finished goods can support service levels or conceal demand and obsolescence problems.
The diligence team should reconcile quantities by item, location, status, batch and ownership. It should test negative inventory, duplicate locations, slow movement, aged work in progress, quarantine, consignment, customer-owned material, supplier-owned stock and material at third parties. Cycle-count and physical-count evidence matters because system balance and physical existence can diverge.
Operational data can improve the working-capital target. Lead time, batch size, changeover, yield and production volatility help explain normal inventory. Schedule adherence, dispatch and customer acceptance help explain receivables and accrued revenue. Supplier terms, order timing and critical-spares policy help explain payables. The model should separate normal operating need from transaction window management.
Completion mechanisms need definitions that match plant reality. Customer advances, unpaid capital items, overdue maintenance suppliers, inventory provisions, consignment and quality reserves may be treated differently under negotiated debt, cash and working-capital definitions. Legal and accounting advisers should align the SPA wording with the evidence and model.
12. Protect operational technology and data rights
Industrial diligence touches systems that can affect safety, availability and product quality. NIST SP 800-82 Rev. 3 provides OT security guidance that accounts for performance, reliability and safety requirements.[7] The diligence protocol should preserve network segregation, approved access paths, logging, least privilege and seller control of live systems.
The buyer should map OT assets, network zones, remote access, identity, backups, unsupported software, third-party connections and incident history. A spreadsheet asset list is a starting point. Configuration evidence, network observation and control ownership provide stronger support. The team should identify which systems and licences transfer and which depend on group or vendor arrangements.
Data rights can affect the buyer's ability to operate and improve the plant. Equipment vendors, integrators, cloud platforms and customers may have rights in software, models, recipes, telemetry, diagnostic data or derived information. The transaction workstream should identify ownership, access, portability, retention, confidentiality, export and termination terms.
AI use introduces model and data governance. The buyer needs to know whether models are owned, licensed or embedded in vendor services; how they are updated; what data they use; how performance is monitored; and how a human can intervene. A model that controls a process requires a different diligence standard from a model that prioritises maintenance review.
13. Convert findings into price and protections
Findings should enter a decision matrix with evidence grade, financial effect, timing, uncertainty, responsible adviser and proposed treatment. The available responses include valuation adjustment, debt-like item, working-capital target, completion-account definition, locked-box protection, warranty, indemnity, escrow, holdback, earn-out, covenant, condition precedent, access right and post-close action.
Price is suitable for risks that affect the sustainable economics or required cash investment and can be estimated with adequate confidence. A specific indemnity may suit an identified contingent exposure where causation and allocation can be defined. A warranty can support disclosure and recourse for factual matters. A condition can address an item that must be resolved before control transfers. An escrow or holdback can support recovery where credit risk or dispute timing matters.
The mechanism should match the evidence. A recurring maintenance burden with a supported run-rate cost may affect earnings. A known replacement can affect enterprise-to-equity value or price. A possible failure with uncertain probability may require a scenario, specific protection and operational plan. Missing data may justify access rights, a conservative assumption or a decision not to proceed.
The matrix should also consider materiality and execution. Excessive contractual complexity can create negotiation and enforcement risk. Some findings are best addressed through a funded plan and governance right. The investment committee should see the residual exposure after the proposed treatment.
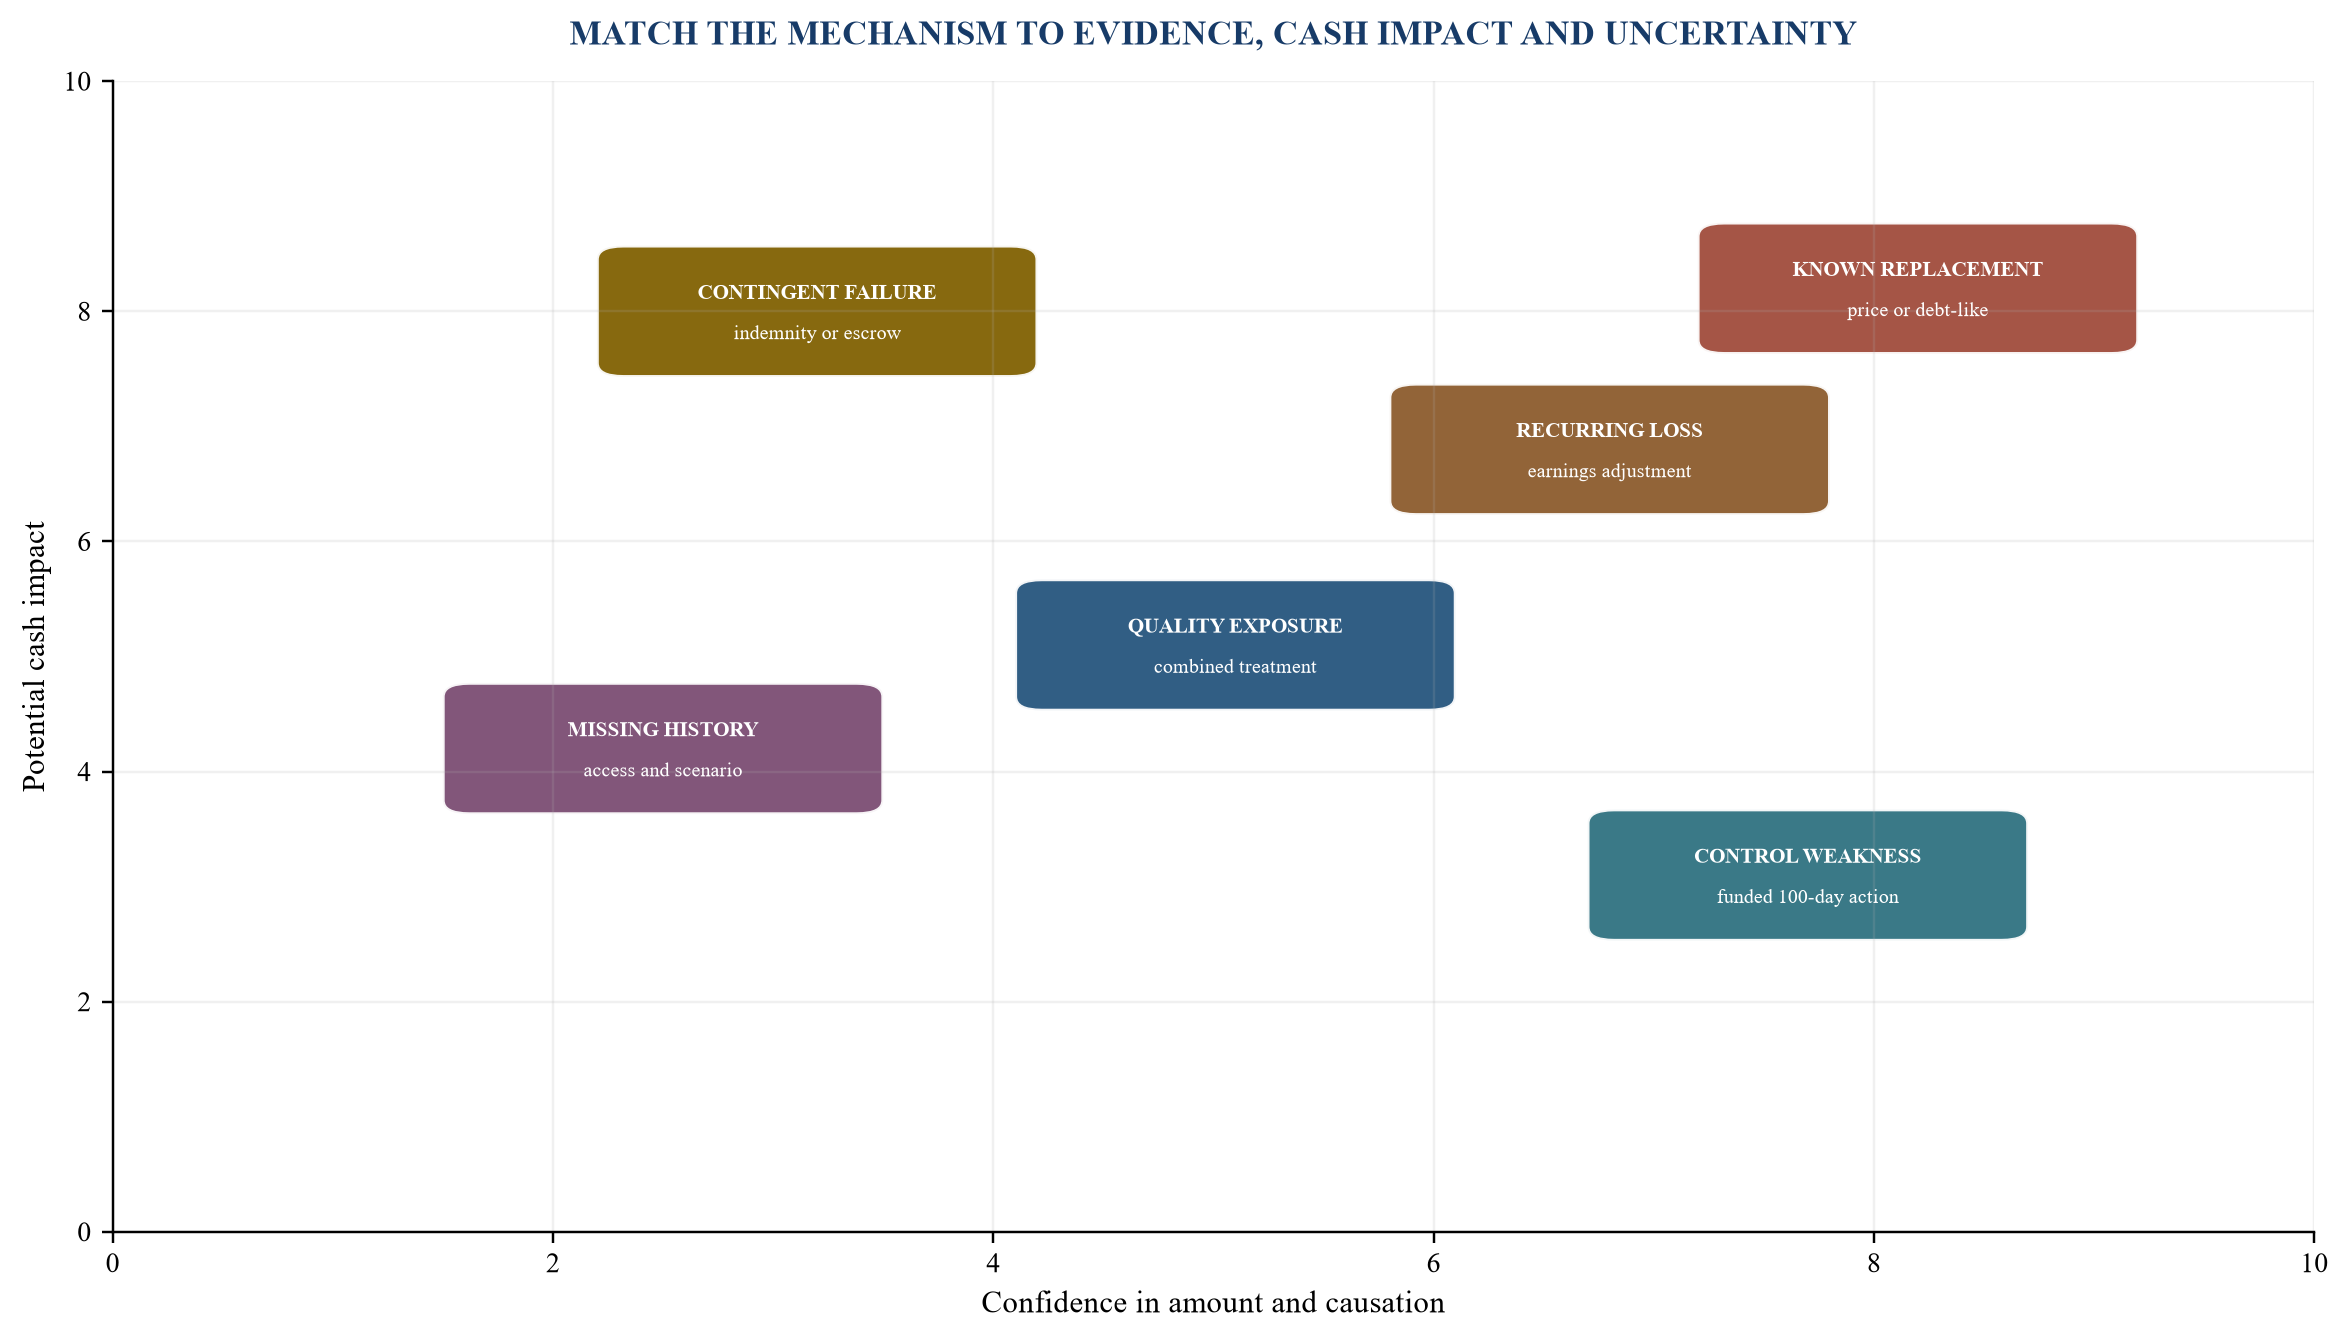
Positioning is illustrative; transaction-specific advice and evidence determine treatment.
Table 5. Transaction-response matrix
| Finding | Evidence needed | Potential financial bridge | Contractual response | Post-close response |
|---|---|---|---|---|
| overstated saleable capacity | run-level output, quality and demand | reduce volume or margin case | information warranty and access | bottleneck and scheduling plan |
| deferred critical maintenance | backlog, inspection, parts and outage | capex, downtime and working capital | price, covenant, condition or escrow | funded reliability recovery |
| recurring quality loss | process, inspection, return and cash | yield, rework, warranty and capacity | warranty, indemnity or holdback | root-cause and control plan |
| abnormal energy intensity | meter, production and tariff | unit cost and capex sensitivity | disclosure and data access | verified baseline and projects |
| unsupported OT or model | asset, licence, version and security | replacement and disruption cost | licence, consent and transition support | architecture and governance plan |
| incomplete data lineage | source, mapping and exception log | confidence range | access right or conservative definition | Day 1 control and reconstruction |
The table organises adviser judgement and does not prescribe legal treatment.
14. Write the 100-day plan during diligence
The first 100 days should convert unresolved but controllable findings into owned actions. The plan begins before signing because access, people, spares, shutdowns and system changes can require agreement. It should protect production and safety while improving evidence and control.
Day 1 priorities include decision authority, safe system access, customer continuity, cash control, critical maintenance, material availability, quality release and incident escalation. The buyer should know who can stop the line, release product, approve maintenance, change recipes, access OT, commit capex and communicate with priority customers.
The first thirty days establish baselines. The team confirms asset and system inventories, reconciles production definitions, validates critical spares, reviews safety-critical work, secures backups, freezes ungoverned model changes, counts high-risk inventory and rebuilds the plant-to-finance bridge. Actions should avoid destabilising production during ownership transition.
Days thirty to sixty address priority exposures. The plant may execute critical maintenance, correct quality controls, restore metering, close access gaps, qualify suppliers or prepare a shutdown. Each action needs cost, schedule, production consequence, owner and verification measure.
Days sixty to one hundred test value initiatives. The buyer can pilot downtime classification, energy optimisation, predictive-maintenance workflows, scheduling changes or quality analytics on a bounded line. The baseline, test design, human oversight and rollback condition should be approved before the pilot. Benefits enter the value ledger after operational and cash evidence is observed.
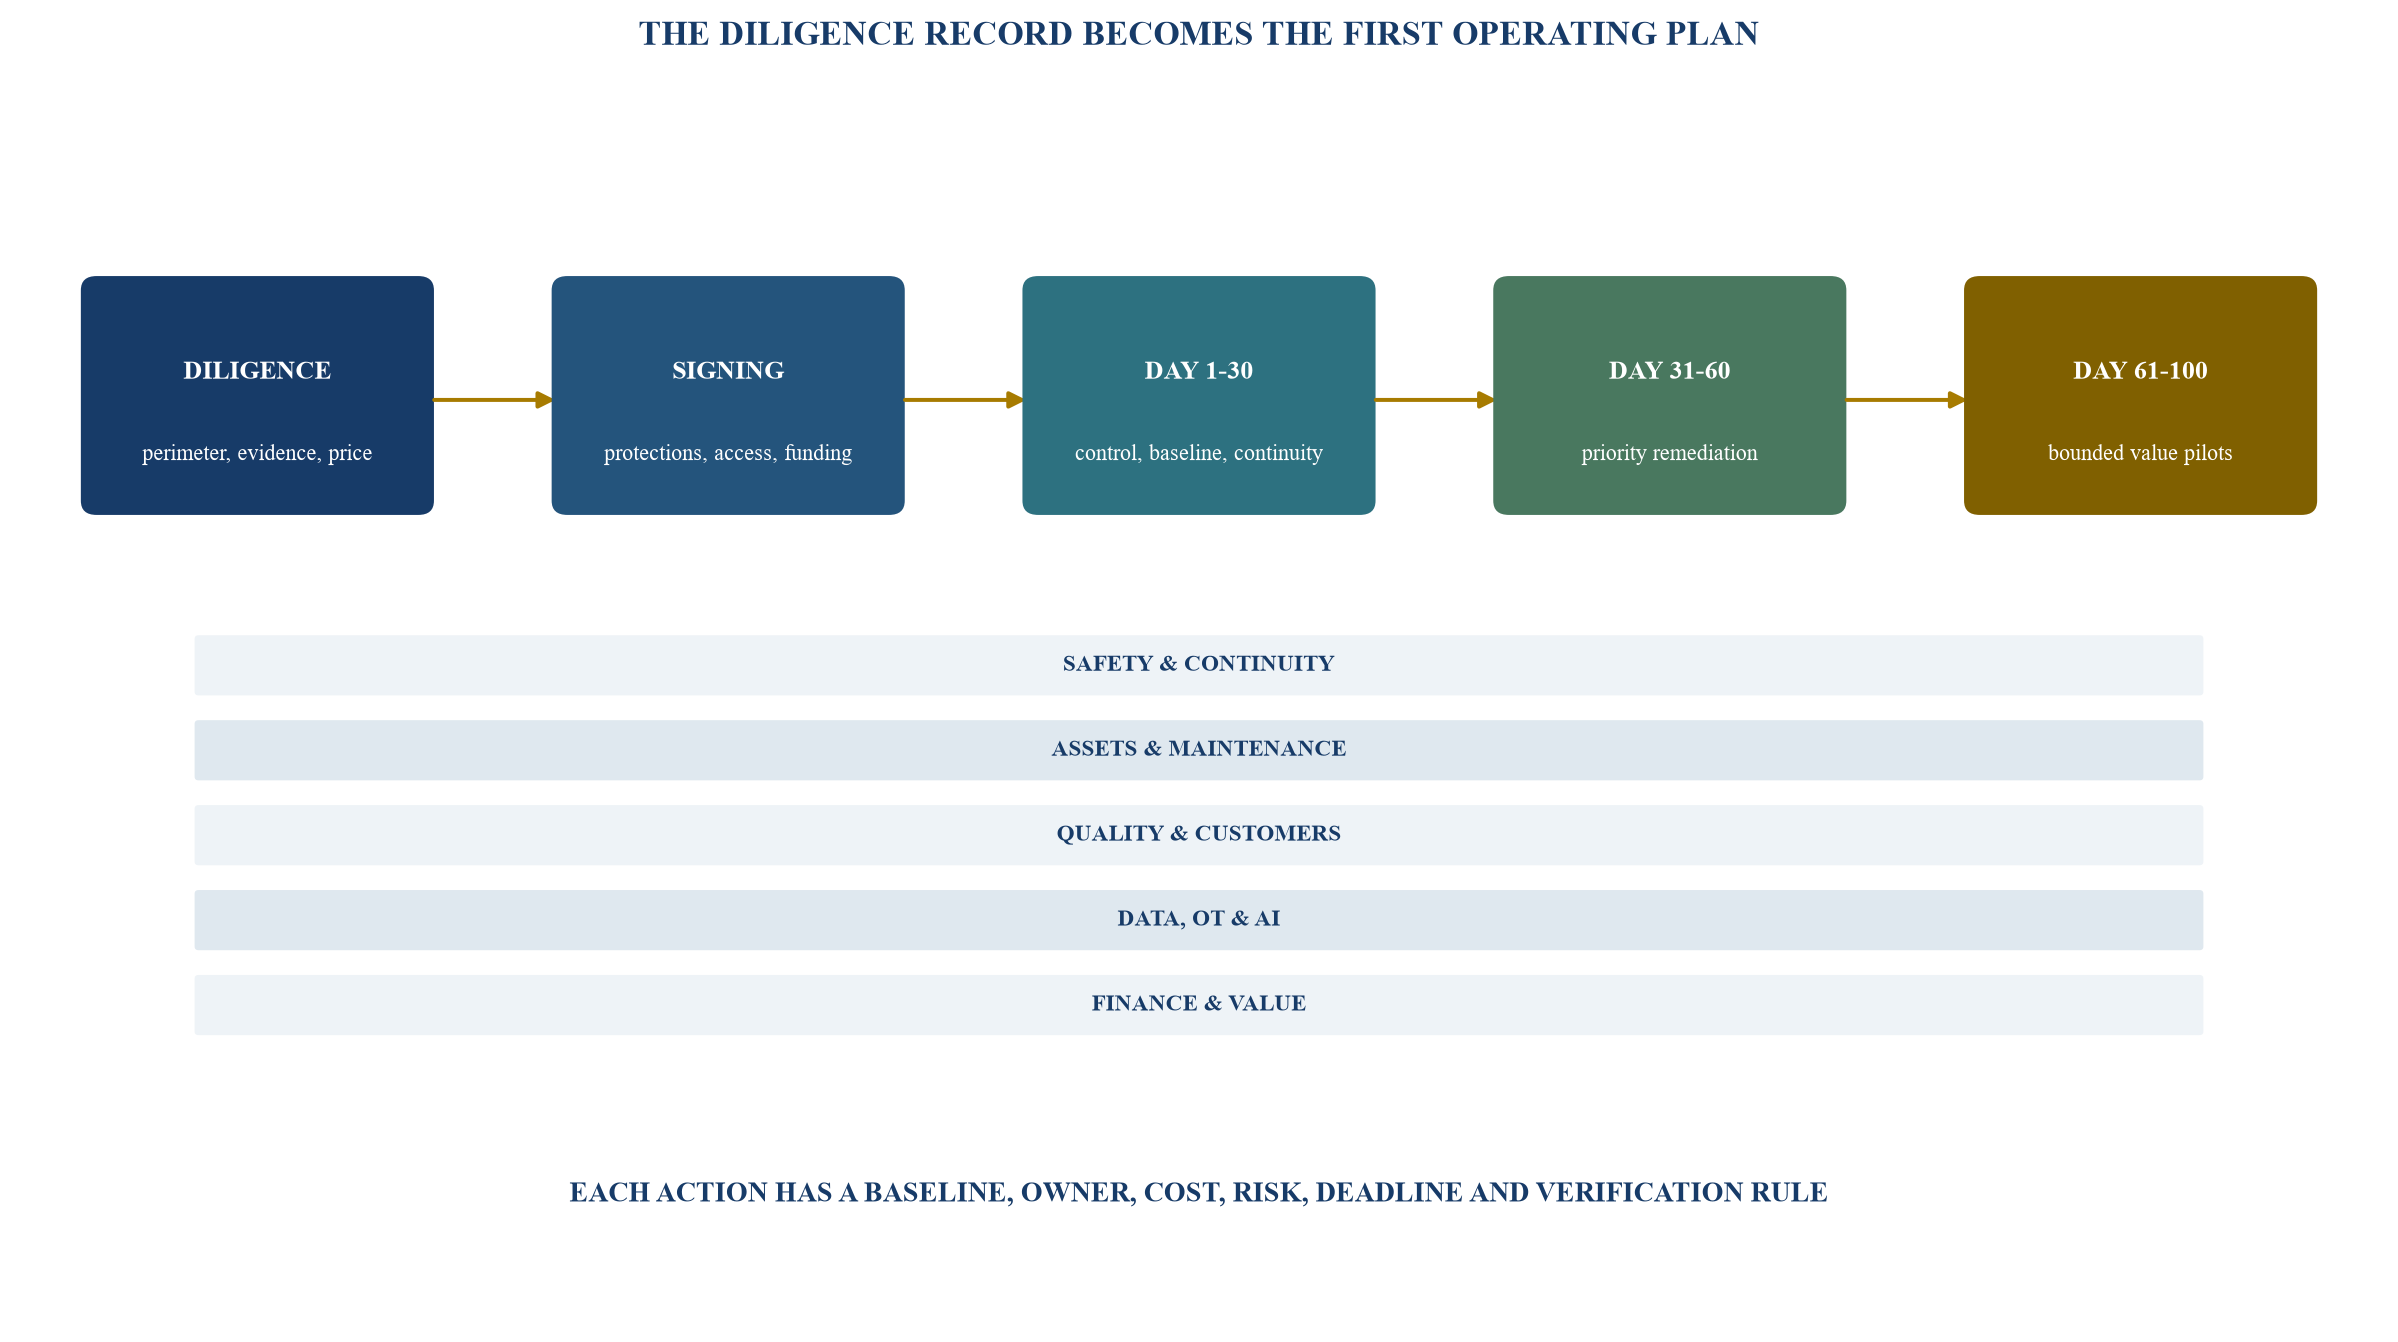
Production continuity, safety and evidence quality govern the pace of change.
Table 6. First 100 days of industrial ownership
| Period | Primary objective | Required output | Decision gate |
|---|---|---|---|
| pre-signing | convert findings into terms and funding | price bridge, protections, access schedule, action budget | acceptable residual risk |
| signing to close | prepare authority and continuity | Day 1 roles, critical supply, customer and system plan | safe to complete |
| Day 1-10 | protect operations and access | escalation, OT control, cash, quality and maintenance cover | stable control perimeter |
| Day 11-30 | establish verified baselines | asset graph, throughput, loss, energy, inventory and cash bridge | reliable operating view |
| Day 31-60 | close priority exposure | critical work, spares, quality, meter and access remediation | controlled downside |
| Day 61-100 | test selected value actions | bounded pilots, measured outcomes and revised value ledger | scale, revise or stop |
Actions should be adapted to the plant, transaction and specialist advice.
15. Govern the combined human and machine judgement
Industrial diligence depends on people who understand the process. Operators know normal sounds, workarounds and sequencing. Maintenance teams know recurring failures and spare constraints. Quality teams understand deviations and customer acceptance. Engineers understand physical causation. Finance understands accounting and cash. AI can organise and test their evidence; it cannot replace their accountability.
Interviews should be structured around records. The reviewer presents a run, failure sequence or reconciliation and asks the responsible person to explain it. The explanation is tested against another source where possible. This approach respects operational knowledge while reducing dependence on memory and presentation.
Model outputs should have a named human owner. The owner decides whether the output is suitable for the decision and records overrides. High-impact recommendations should include the data period, confidence, alternative explanation and sensitivity. Where the model's behaviour cannot be explained sufficiently, the output should remain a lead for investigation.
The transaction timetable should leave time for challenge. A late data dump can create pressure to accept automated summaries. The committee should know which findings were fully reviewed, which remain preliminary and which could not be tested. A decision to proceed with uncertainty should be explicit and reflected in price, protection, funding or governance.
16. Apply stop rules and preserve evidence
The diligence workstream needs stop rules. Examples include a request that could affect plant availability, uncontrolled remote access, evidence of an immediate safety issue, data use outside the agreed purpose, unexplained changes to source extracts, or a model result being presented as verified engineering fact. The appropriate response may include suspending the test, escalating to the seller, isolating the environment or obtaining specialist review.
Deal stop rules concern the acquisition case. The committee may pause when saleable capacity cannot be reproduced, critical compliance evidence is missing, maintenance exposure exceeds funded capacity, a key customer or licence cannot transfer, OT risk cannot be contained, or the seller cannot provide agreed access. The threshold should be approved before deal momentum weakens discipline.
Evidence preservation supports negotiation, closing and integration. Raw extracts, hashes, mapping tables, model versions, reviewer notes, photographs where permitted, source documents and decision logs should be retained under transaction controls. The record should show what was known, when it was known and how it affected the decision.
After completion, the same evidence graph can support baseline confirmation and value tracking. The buyer should avoid changing definitions before the baseline is secured. A genuine improvement should be measured against a stable and understood starting point.
17. Use a plant-to-value control room
The investment committee and integration steering group need a compact operating view. The control room should show saleable throughput, critical downtime, quality loss, energy intensity, maintenance backlog, critical spares, inventory exposure, capex, cash impact, protection status and 100-day actions. Each measure links to source lineage and an owner.
The dashboard should distinguish fact, model and decision. Fact reports the observed value and data coverage. Model reports the normalised or scenario result with confidence. Decision reports the treatment approved in price, contract or plan. Combining these layers into one number obscures uncertainty.
Trend matters more than decorative precision. A daily plant metric can be useful during stabilisation, while a transaction adjustment may be reviewed at defined gates. Red status should indicate a specific threshold, consequence and action. The board should see unresolved assumptions and overdue evidence requests.
Value tracking should focus on collected economics. Increased speed without saleable demand does not create revenue. Reduced downtime without lower overtime, higher output or avoided cost may not create cash. A maintenance prediction creates value when it changes an action and the outcome is measured. The control room should keep the physical and financial ledgers connected.
Conclusion
AI-assisted industrial diligence can improve transaction judgement when it is built as a traceable evidence system. The useful unit is not the model or dashboard. It is the supported connection from plant condition and operation to price, protection and funded action.
The work begins with decision questions and a perimeter that follows production and cash. It creates an evidence graph across assets, time, states and quantities. It profiles data quality before modelling, combines metrology and physical understanding with analytics, reconstructs throughput and downtime, evaluates maintenance, energy, quality, inventory and capital expenditure, and reconciles operating findings to earnings and cash.
AI supports classification, anomaly detection, sequence analysis and scenario testing. Its output remains governed by intended use, validation, security, explanation and human review. High-impact conclusions require engineering, operational and financial corroboration. Missing data becomes an explicit uncertainty rather than a hidden model assumption.
The transaction response should match the evidence. Sustainable operating effects can influence price. Identified contingent exposure can support tailored protection. Preconditions can govern completion. Access, funding and decision rights can support a 100-day plan. Each mechanism should show the residual risk that remains with the buyer.
The result is a diligence record that survives signing. It becomes the baseline for production continuity, maintenance recovery, OT control, quality, energy, cash and value tracking. The buyer can then test whether the plant performs as underwritten and revise the plan from observed evidence.
Appendix A. Minimum industrial data request
The initial request should be proportionate to the decision and the plant. It should seek source-system extracts rather than presentation summaries where controlled access permits. Asset and configuration records include the asset register, line hierarchy, equipment specifications, commissioning history, controls versions, drawings, criticality, ownership, leases, warranties and support agreements.
Production records include orders, schedules, run history, machine states, cycle time, counts, good output, scrap, rework, changeovers, staffing, shifts, routing and dispatch. Quality records include specifications, inspection plans, test results, deviations, holds, concessions, corrective actions, complaints, returns, warranty and traceability.
Maintenance records include work requests, work orders, failure codes, labour, parts, inspections, condition monitoring, preventive plans, backlog, shutdowns, contractor records, spares and obsolescence. Energy records include invoices, tariffs, interval meters, sub-meters, utility constraints, production context and approved projects.
Commercial and financial records include product and customer mapping, pricing, order book, revenue, material, labour, overhead, inventory, receivables, payables, capital expenditure, leases, insurance and cash. OT and data records include architecture, asset inventory, remote access, accounts, backups, incidents, licences, interfaces, data dictionaries, retention and AI-model records.
The seller should identify unavailable data, known changes in definition, migrations and manual workarounds. The buyer should log rejected records, access limits and unresolved mappings. The request should avoid unnecessary personal or sensitive information and follow agreed legal and cyber controls.
Appendix B. Investment committee questions
1. Which plant assumptions drive enterprise value and downside liquidity? 2. Can saleable throughput be reproduced from run-level records? 3. Which losses arise from demand, scheduling, changeover, failure, speed or quality? 4. Which assets are critical, unsupported, single-point or near a required outage? 5. What maintenance and inspection work is deferred, and what cash and downtime does it require? 6. Does energy performance reconcile to production, operating state and tariff? 7. How do quality losses reach inventory, customer acceptance, margin and cash? 8. Which inventory is owned, conforming, usable, saleable and physically verified? 9. Which data and models are reliable enough for price, and which remain scenario inputs? 10. Which findings affect maintainable earnings, net debt, working capital or capital expenditure? 11. Which protections, conditions, access rights and funding address the remaining exposure? 12. Who owns each Day 1 and 100-day action, and how will completion and value be verified?
References
- National Institute of Standards and Technology. 2026 Roadmap on Artificial Intelligence and Machine Learning for Smart Manufacturing. 3 July 2026. https://www.nist.gov/publications/2026-roadmap-artificial-intelligence-and-machine-learning-smart-manufacturing
- National Institute of Standards and Technology. Augmented Intelligence for Manufacturing Systems. https://www.nist.gov/programs-projects/augmented-intelligence-manufacturing-systems-aims
- International Organization for Standardization. ISO 55001:2024 Asset management systems requirements. https://committee.iso.org/sites/tc251/home/projects/published/iso-55001.html
- International Organization for Standardization. ISO 22400-2:2014 Manufacturing operations management key performance indicators. https://www.iso.org/standard/54497.html
- US Department of Energy. Industrial Technologies Office software tools. https://www.energy.gov/cmei/ito/ito-software-tools
- UK Health and Safety Executive. Maintenance of work equipment. https://www.hse.gov.uk/work-equipment-machinery/maintenance.htm
- National Institute of Standards and Technology. SP 800-82 Rev. 3, Guide to Operational Technology Security. September 2023. https://csrc.nist.gov/pubs/sp/800/82/r3/final
- National Institute of Standards and Technology. Artificial Intelligence Risk Management Framework. https://www.nist.gov/itl/ai-risk-management-framework
- US Department of Energy. AMO eGuide, Identify data needs for energy management. https://www1.eere.energy.gov/manufacturing/eguide/iso_step_2_2.html
- International Organization for Standardization. ISO 55013:2024 Guidance on the management of data assets. https://www.iso.org/standard/82455.html
- IFRS Foundation. IAS 16 Property, Plant and Equipment. https://www.ifrs.org/issued-standards/list-of-standards/ias-16-property-plant-and-equipment/
- IFRS Foundation. IAS 36 Impairment of Assets. https://www.ifrs.org/issued-standards/list-of-standards/ias-36-impairment-of-assets/
- IFRS Foundation. IFRS 13 Fair Value Measurement. https://www.ifrs.org/issued-standards/list-of-standards/ifrs-13-fair-value-measurement/
- National Institute of Standards and Technology. AI Risk Management Framework Core. https://airc.nist.gov/airmf-resources/airmf/5-sec-core/
- National Institute of Standards and Technology. Operational Technology Security publications. https://csrc.nist.gov/Projects/operational-technology-security/publications
- US Department of Energy. What are Energy Management Information Systems? https://www.energy.gov/cmei/femp/what-are-energy-management-information-systems
