

1. Define the investment decision
Growth-equity diligence should begin with the decision that the investment committee must make. The mandate should specify the proposed security, proceeds, ownership, governance rights, expected holding period, return framework and material conditions. A broad instruction to assess an AI company can produce extensive activity without resolving the price, structure and risk questions that govern capital deployment.
The decision frame should identify the operating thesis. Management may argue that rapid product releases increase adoption, that adoption produces recurring customer outcomes, that those outcomes support retention and expansion, and that scale improves contribution margin. Each link requires a definition, a source and an observation period. A strong result at one link does not prove the rest of the chain.
The committee should approve the evidence standard before diligence accelerates. The standard should distinguish verified records, management representations, tested calculations, third-party evidence and hypothetical scenarios. Material missing information should remain visible. The investor should also decide which findings can change valuation, security terms, governance, staged funding, conditions or the decision to stop.
2. Build the integrated diligence architecture
Commercial, product, technical, financial and governance workstreams should use one claim register. Separate reports can describe the same fact differently, apply inconsistent periods or miss a dependency that crosses functions. The integrated architecture assigns each material assertion to an owner, source, test, reviewer and investment consequence.
The architecture should cover product purpose, customer segments, release history, task success, adoption, retention, pricing, revenue recognition, cost allocation, model and cloud dependencies, data rights, security, regulation, organisation, forecast, capital need and cap table. It should also preserve the relationship among these elements. A new feature can improve adoption while increasing inference cost, implementation work or model concentration.
NIST’s AI Risk Management Framework connects organisational practices with mapping, measurement, management and governance across the AI lifecycle [1]. Its core calls for documented test, evaluation, verification and validation, and for production monitoring under conditions similar to deployment [2]. Those principles support an investment evidence system, although the investor must adapt them to the transaction and company.
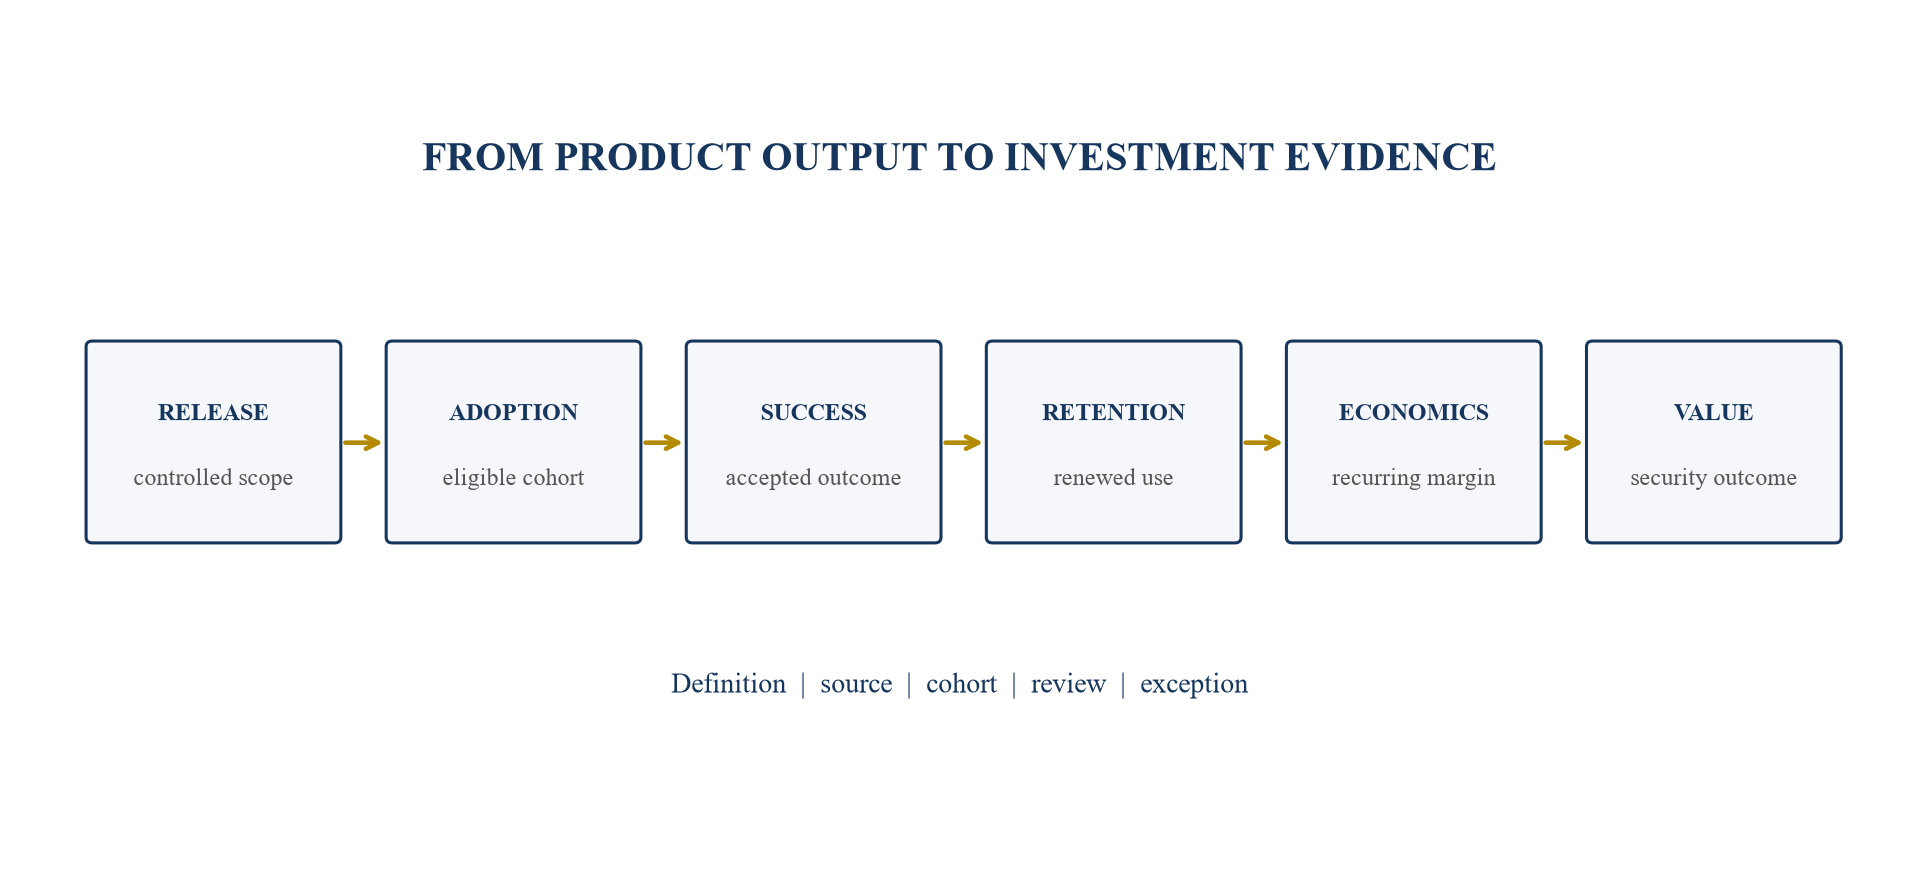
Each stage requires a defined population, source, period and review before it supports the next conclusion.
3. Create the evidence ledger
The evidence ledger is the transaction record for material claims. Each entry should state the assertion, metric definition, population, period, source system, extraction method, calculation, owner, reviewer, version, limitation and potential investment response. The ledger should link to source files while retaining access and confidentiality controls.
Management dashboards are useful starting points. They may change definitions, exclude failed activity, combine production and testing traffic, or report a current snapshot beside a historical forecast. The diligence team should reconcile selected metrics to source systems, contracts and accounting records. Reperformance should focus on claims that drive valuation, downside protection or capital need.
The ledger should retain adverse evidence. Failed evaluations, churned cohorts, cost overruns, customer complaints and unresolved rights can explain the range of outcomes more effectively than a polished data room. An exception should have an owner, financial relevance, proposed action and decision date. Deleting it after a workaround removes the audit trail.
Table 1. Core evidence-ledger fields
| Field | Diligence question | Control |
|---|---|---|
| assertion | what is the investor being asked to accept? | state one testable claim |
| definition | how are numerator, denominator and period fixed? | preserve version history |
| source | which system or document supports the claim? | retain lineage and access |
| test | how can the result be reproduced? | record calculation and sample |
| limitation | what remains uncertain or excluded? | keep visible in the decision pack |
| consequence | what can change if the claim fails? | map to price, terms, action or stop |
A completed field requires source evidence and review proportionate to its investment importance.
4. Define AI-native product scope
The diligence team should establish what makes the company AI-native in operational terms. The product may train proprietary models, fine-tune third-party models, orchestrate multiple models, apply retrieval and workflow logic, provide infrastructure, or embed external AI services within a broader application. These architectures create different intellectual-property, cost, reliability and switching exposures.
The product map should identify each customer-facing workflow, the model and data path, human intervention, production environment and commercial promise. A single company can contain several architectures. One workflow may use a proprietary classifier, another may route to a foundation-model provider, and a third may require expert review. Aggregated margin and reliability can hide those differences.
Scope also affects comparability. A company whose economics depend on third-party inference should not be assessed solely as traditional software. A services-heavy deployment should not be represented as self-serve recurring revenue without evidence. The investor should use the actual operating model, contractual rights and cost drivers rather than a label.
5. Define a controlled release
Feature velocity requires a stable unit of analysis. A release should represent a production change that reaches an eligible customer population and can be associated with defined behaviour or outcomes. Code commits, experiments, internal demonstrations and marketing announcements are separate events. Counting them together rewards activity without testing customer value.
The release record should include intended user, problem, owner, approval, deployment date, eligible population, exposure logic, rollback plan, evaluation result, incident history and commercial hypothesis. Material model, prompt, retrieval, data and policy changes should be included because they can alter product behaviour without a visible interface change.
Velocity should be assessed beside quality and reversibility. Frequent releases can demonstrate learning capacity when telemetry, testing and rollback are strong. They can also create fragmentation, support load and reliability risk. The investor should measure the proportion of releases that reach stable production, achieve their acceptance threshold and remain supported after the observation window.
6. Measure feature velocity
Useful velocity measures include lead time from approved problem to production, deployment frequency, release acceptance, rollback rate, defect escape, evaluation coverage and time to remediate. The denominator should be explicit. Median lead time for accepted releases can convey more than an average distorted by a few abandoned initiatives.
The team should segment velocity by product area, customer type and change class. A user-interface adjustment, model migration and regulated workflow require different tests and risk tolerances. Comparisons across periods should explain changes in team size, architecture, customer mix and release policy.
Velocity can be compared with the investment plan. If growth requires a defined sequence of enterprise controls, integrations or workflow capabilities, diligence should test whether historical throughput supports that sequence. The forecast should include discovery, security review, customer acceptance and deployment effort. Engineering estimates alone do not establish commercial availability.
7. Connect releases to adoption cohorts
Each material release should have an eligible cohort and an exposed cohort. Eligibility answers who could use the feature; exposure answers who actually received or discovered it. Adoption should then distinguish first use, meaningful use, repeated use and successful use. A large eligible population with limited exposure may indicate distribution friction rather than product rejection.
Cohorts should preserve start date, account characteristics, contract, segment, geography and relevant baseline. The team should compare exposed users with a suitable pre-release baseline or control where feasible. Product analytics can show association; causal claims require stronger design and stated limitations.
Adoption curves should be followed long enough to distinguish novelty from recurring workflow. A feature used once during onboarding may reduce implementation time without becoming a daily workflow. That outcome can still create value, but it should enter the revenue and retention thesis through the correct mechanism.
8. Define task success and customer acceptance
AI products require workflow-specific success definitions. A response can be delivered within the latency target and still be inaccurate, unsafe or unusable. The definition may combine completion, quality, reliability, latency, escalation, review effort and customer acceptance. The investor should understand who sets the threshold and how it relates to the contractual promise.
Evaluation evidence should cover conditions similar to production, consistent with NIST’s emphasis on documented testing and production monitoring [2]. Samples should represent material customer populations and failure modes. Results from curated demonstrations should be separated from live performance. Human evaluation should document instructions, reviewers, disagreement and escalation.
The team should trace failures to customer and economic consequences. A low-severity error may create limited cost; a rare failure in a high-stakes workflow may constrain market access or require expensive review. Aggregate accuracy can hide that distribution. The investment model should reflect the actual use case and residual controls.
9. Build the customer-outcome bridge
The customer-outcome bridge connects product activity with the result the buyer values. It begins with the contracted or intended workflow, follows eligible users through exposure and successful use, and then tests time, cost, revenue, risk or quality outcomes. The bridge should identify confounding changes such as new pricing, implementation support or customer staffing.
Evidence can include customer system data, accepted deliverables, service levels, renewal decisions and documented case studies. Testimonials without a baseline provide context while leaving magnitude unresolved. The investor should distinguish company calculations, customer-confirmed results and independently reproduced evidence.
Outcome durability matters. A saving achieved through intensive vendor support may not persist at scale. The bridge should show support hours, implementation effort and exceptions. A customer can renew because of a broader bundle even when the AI feature has low direct adoption. Attribution should remain proportionate to the evidence.
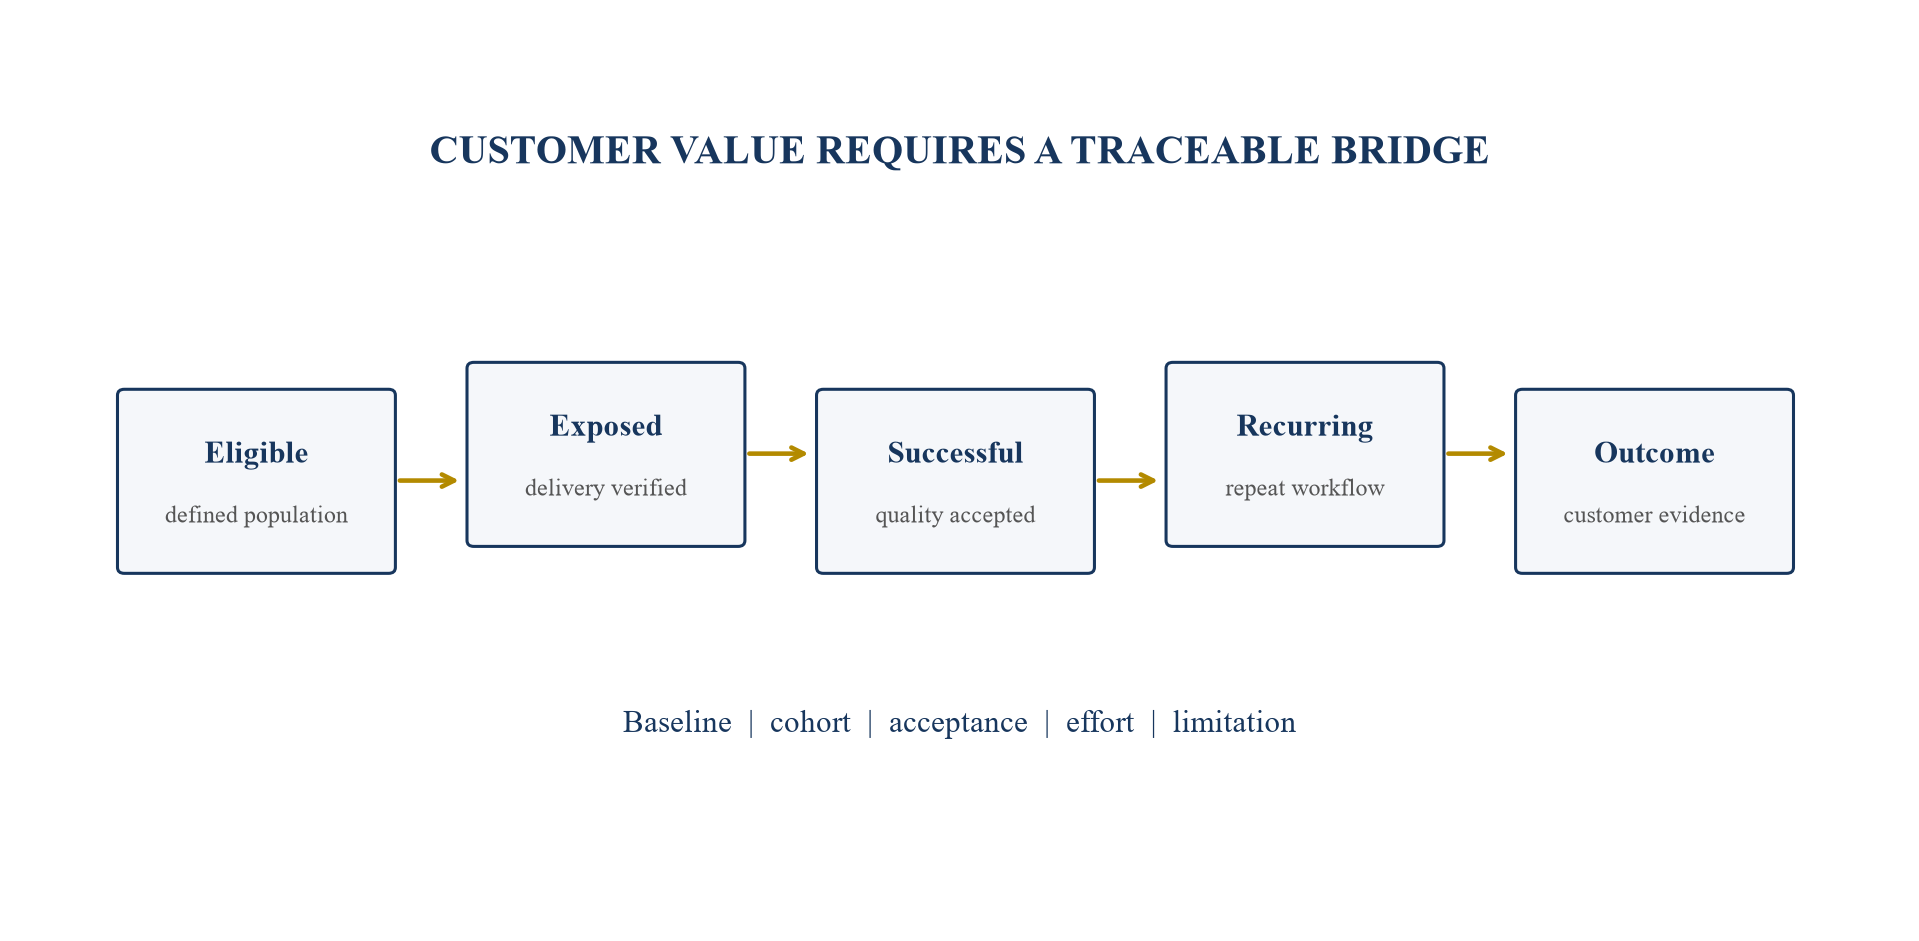
Customer value should be supported by a baseline, cohort, acceptance evidence, delivery effort and stated limitation.
10. Analyse retention by cohort
Retention should be calculated from a defined population and economic base. Logo retention, gross revenue retention, net revenue retention, product retention and workload retention answer different questions. The team should reconcile the selected measure to contracts and recognised or billed revenue as appropriate.
Release-to-retention analysis follows cohorts exposed to material features and compares renewal, contraction, expansion and churn. The observation window must match contract and usage cycles. Recent cohorts can look healthy because they have not reached renewal. Mature cohorts may reflect an older product and customer profile. Both should be shown.
Public filings demonstrate that companies define and discuss retention with care. DigitalOcean reported net dollar retention alongside AI-native product releases in its 2025 results [15]. Atlassian identifies satisfaction, releases, support, pricing, packaging and AI offerings among factors that may affect retention and expansion [16]. These disclosures illustrate relevant variables; they do not establish a benchmark for another company.
Table 2. Release-to-retention cohort structure
| Cohort | Eligible accounts | Successful recurring use | Renewal reached | Gross revenue retention | Direct-cost trend |
|---|---|---|---|---|---|
| earlier release | 120 | 54% | 100% | 88% | improving |
| current release | 180 | 67% | 62% | not mature | stable |
| enterprise subset | 35 | 74% | 91% | 94% | mixed |
| assisted deployment | 28 | 82% | 86% | 96% | support-intensive |
The values are hypothetical and illustrate the diligence calculation structure only.
11. Diagnose churn and contraction
Churn review should use account-level reasons supported by evidence. Categories may include product fit, quality, reliability, security, procurement, integration, support, pricing, budget, competitor, customer failure or strategic change. A single primary reason can be convenient while hiding interacting causes.
The team should compare stated reason, usage history, support record, product exposure, pricing change and account notes. Lost accounts should be segmented by revenue, margin, industry, product and dependency. A small number of concentrated losses can affect the forecast more than a broad set of low-value experiments.
Contraction deserves separate analysis. Customers may retain the contract while reducing seats, workloads or premium features. An AI feature can increase engagement without preventing budget reduction elsewhere. The revenue bridge should show starting value, churn, contraction, expansion, price and foreign-exchange effects using consistent periods.
12. Test expansion quality
Expansion should be linked to a repeatable driver. It may result from more users, higher workload, new products, price, implementation, acquired entities or temporary consumption. The investor should separate contractual commitments from variable use and identify whether the same releases that support adoption also support paid expansion.
Consumption businesses require additional care. Product optimisation can reduce customer consumption while improving value. A decline in usage is not automatically adverse, and growth driven by inefficient token or compute use is not automatically favourable. The analysis should connect usage units to customer outcomes, price and direct cost.
Expansion concentration should be tested. A small number of large customers can create attractive net retention while increasing bargaining power and forecast volatility. The model should show expansion by cohort, segment and customer, along with pipeline assumptions and contractual evidence. Unsupported cross-sell assumptions remain scenario inputs.
13. Reconcile revenue quality
Revenue quality analysis should reconcile contracts, billing, recognised revenue, cash collection and product evidence. IFRS 15 establishes principles for recognising revenue from customer contracts [5]. The diligence team should obtain transaction-specific accounting advice and understand performance obligations, variable consideration, contract modifications, principal-agent questions and significant financing components where relevant.
Recurring labels require examination. Revenue may include implementation, custom development, expert review, training, support, marketplace pass-through or cloud resale. Those streams can be commercially valuable while carrying different margin, working-capital and scalability characteristics. The model should preserve the mix.
The team should test bookings, annualised values and pipeline claims against executed terms and start dates. Contracted backlog may contain termination rights, consumption variability, acceptance conditions or delayed deployment. Cash collection should be analysed beside recognised revenue. A customer outcome can be strong while procurement or acceptance delays create liquidity pressure.
14. Allocate recurring delivery cost
AI-native margin analysis should include the resources required to deliver the contracted outcome. Direct cost may include model inference, cloud compute, storage, data acquisition, observability, orchestration, human review, implementation, support, service credits and third-party licences. Classification should reconcile to the accounting record while supporting an economic view.
Promotional credits, minimum commitments and reserved capacity should be visible. Reported cost during a credit period may not represent sustainable economics. A commitment can reduce unit price while creating take-or-pay or underutilisation exposure. The diligence model should show contracted and economic cost under relevant utilisation scenarios.
Microsoft’s 2025 filing notes significant development and operational costs associated with AI models, services, platforms and infrastructure [17]. Alphabet’s 2025 filing describes rising technical-infrastructure investment and operating costs for AI offerings [18]. These issuer-specific disclosures support the need to test cost architecture; they are not direct evidence about the target.
15. Calculate recurring contribution margin
Recurring contribution margin should use a defined revenue base and a complete direct-cost perimeter. The team should calculate account, workflow and cohort views where data permits. Gross margin reported for the company can conceal an unprofitable AI workflow supported by a profitable legacy product or services line.
The bridge should separate price, volume, mix, provider rate, model choice, token or workload intensity, caching, human intervention, support and service credits. Improvements should be linked to deployed changes and sustained observation. A forecast that assumes lower model cost and lower support effort simultaneously should explain the operating evidence for both.
Margin quality also depends on customer value. Reducing model quality, context or review can lower cost while damaging outcomes and retention. The investor should test the efficient frontier between outcome, latency, reliability and direct cost. One optimisation metric cannot represent all four.
16. Map the dependency architecture
The dependency architecture identifies the systems, rights and counterparties required to deliver each material workflow. It should cover foundation models, proprietary models, cloud services, accelerators, data, retrieval, vector stores, observability, security, evaluation tools, integrations, specialists and licensed content. Each dependency should connect to customer promise and cost.
For every dependency, diligence should record provider, contract, term, renewal, price mechanics, volume commitment, service level, data use, intellectual-property allocation, liability, termination, portability, alternative, switching effort and residual limitation. Technical substitutability and contractual portability are separate questions.
NIST’s Generative AI Profile highlights risks across the generative-AI lifecycle and encourages actions aligned with organisational goals and risk tolerances [3]. The dependency map converts those concerns into investment evidence. It should be maintained at workflow level because a company may have strong portability in one product and material concentration in another.
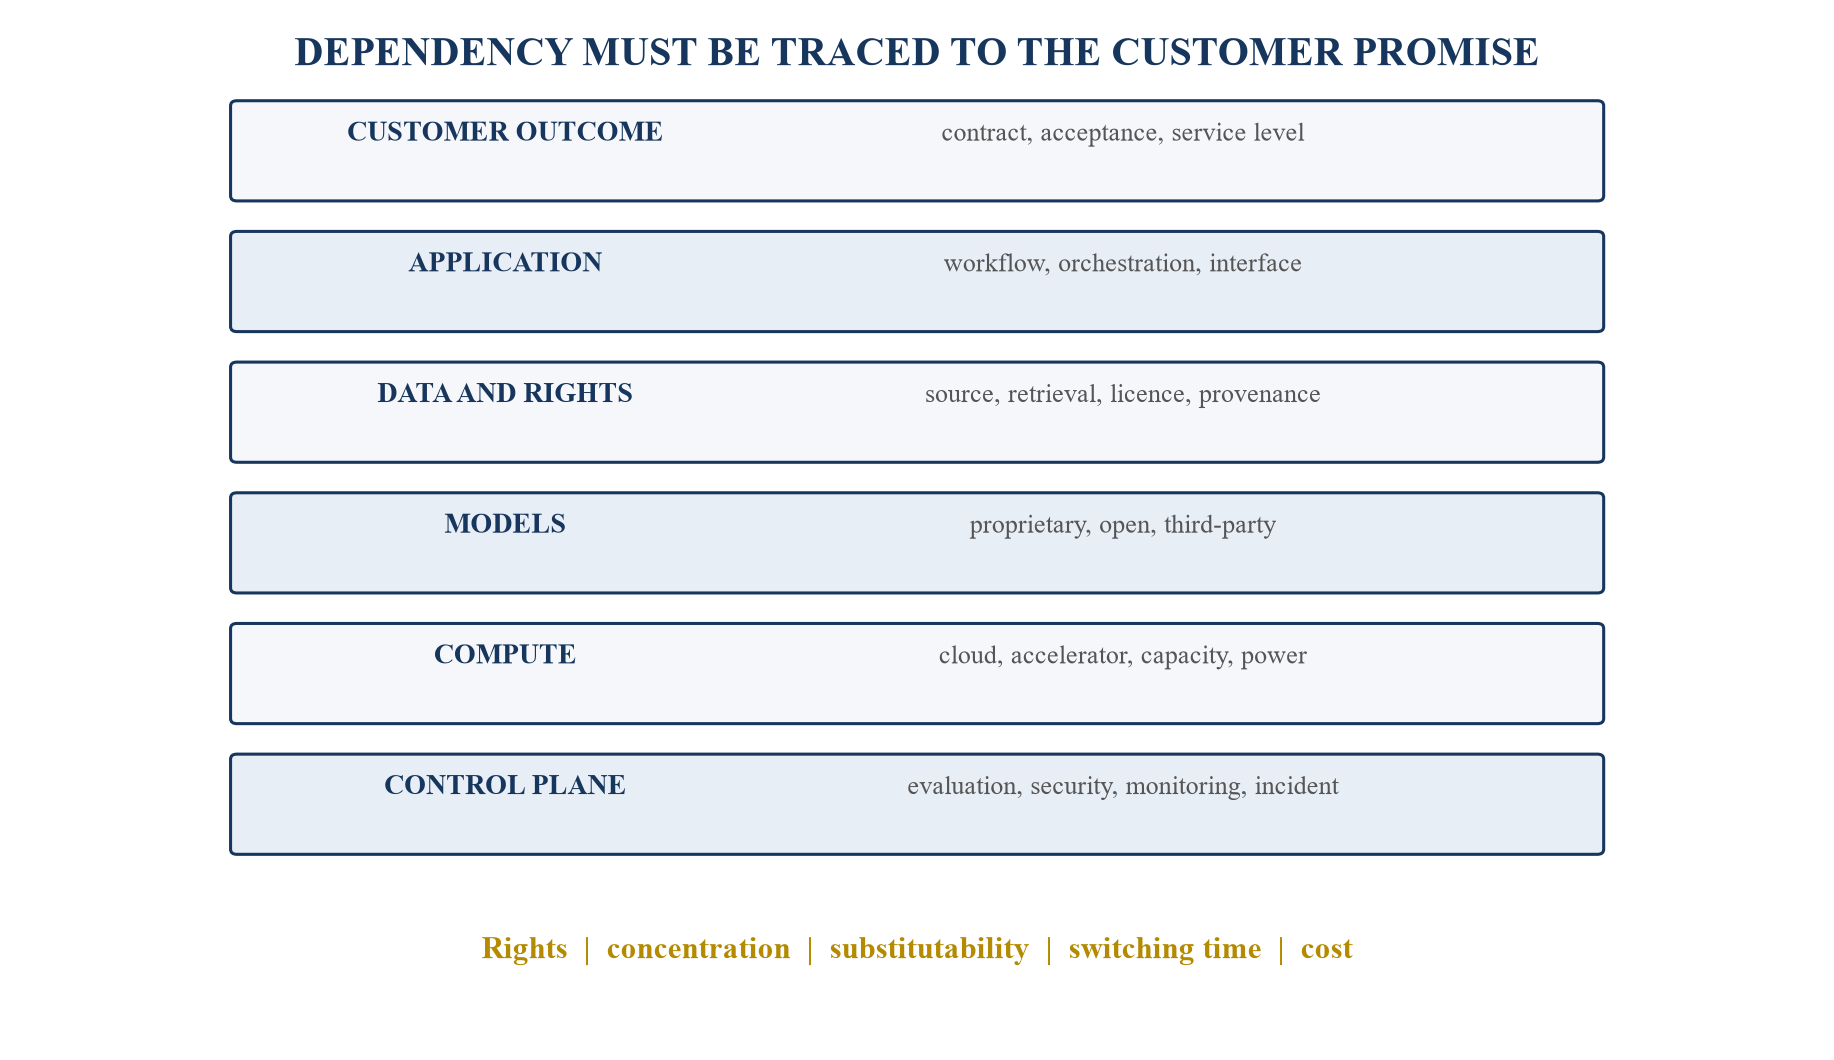
Each layer should be tested for rights, concentration, substitutability, switching time and economic exposure.
17. Assess foundation-model dependence
Foundation-model dependence should be assessed by workflow, not provider count alone. A product may call several models while relying on one provider for quality, latency, enterprise terms or a critical capability. The team should identify default routing, fallback behaviour, fine-tuning, prompt and evaluation assets, provider-specific features and failure modes.
The contract review should cover access, pricing, rate limits, service commitments, data handling, training rights, output terms, indemnities, territorial restrictions, change rights and termination. Technical tests should measure outcome and cost under feasible alternatives. A nominal fallback that fails acceptance thresholds does not provide equivalent resilience.
Atlassian’s filing states that it relies on certain third-party AI models, products and integration providers, and identifies availability, jurisdiction and price as possible exposures [16]. This public disclosure illustrates questions relevant to dependency diligence. The target’s risk must be established from its own architecture, contracts and tests.
18. Test model substitutability
Substitutability testing should use representative production workflows and approved acceptance criteria. The team should compare outcome quality, latency, reliability, safety, context handling, tool use, cost, integration effort and operational controls. A benchmark score can support the analysis while leaving workflow performance unresolved.
Switching time should include procurement, security review, data processing terms, implementation, evaluation, customer approval, deployment and monitoring. It should also include the time required to rebuild provider-specific prompts, fine-tuning, retrieval or guardrails. The company should identify which assets remain usable after a switch.
The investment model can use discrete dependency scenarios. A base case may assume current commercial terms; a downside can apply a price increase, capacity limit or quality degradation; a migration case can include duplicate running cost and delayed releases. The assumptions should be traceable and should avoid suggesting that all dependencies fail simultaneously without a coherent cause.
Table 3. Dependency and portability scorecard
| Dimension | Evidence | Investment question |
|---|---|---|
| technical alternative | production-like evaluation | does an alternative meet acceptance criteria? |
| contractual portability | rights and termination review | can data, prompts and outputs move lawfully? |
| switching time | tested migration plan | can migration finish within liquidity runway? |
| economic exposure | price and usage sensitivity | how do margin and cash change? |
| customer constraint | contract and approval review | is customer consent or recertification required? |
| operating resilience | fallback and incident evidence | can service continue during disruption? |
Scores should follow documented evidence and workflow-specific thresholds.
19. Review proprietary-model claims
Claims of proprietary model advantage should be decomposed. The company may own training code, weights, fine-tunes, synthetic data, evaluation sets, routing, retrieval, domain ontologies or workflow feedback. Each asset has different rights, reproducibility and commercial relevance. A general assertion of ownership is insufficient.
The team should review development records, licences, employee and contractor assignments, data provenance, training permissions, security and model documentation. Performance should be tested against a relevant baseline under production conditions. The analysis should include the cost and time required to reproduce the claimed advantage.
Durability depends on customer value and competitive response. A measurable performance lead may erode if providers improve or if customers accept a cheaper alternative. Proprietary assets can also reduce dependence while increasing training, talent and compute requirements. The valuation model should incorporate both benefit and obligation.
20. Review data rights and provenance
Data diligence should map source, ownership, licence, consent, permitted purpose, geography, retention, transformation, sharing and deletion. The map should cover training, fine-tuning, retrieval, evaluation, monitoring and customer-generated feedback. Rights that support one purpose may not support another.
The team should test whether the company can reproduce critical datasets and whether lineage survives transformation. Synthetic data should retain generation method and quality controls. Customer data should be separated according to contract and policy. Public availability does not by itself establish an unrestricted commercial right.
The European Commission’s AI regulatory framework describes obligations that vary with AI system risk and role [6]. The OECD AI Principles provide an international reference for responsible stewardship [7]. Applicable law and contract require qualified advice; the investment record should state which matters were reviewed, by whom and with what limitations.
21. Test evaluation governance
Evaluation governance should define who approves metrics, datasets, thresholds, releases and exceptions. Development teams can prepare evidence, while material product claims benefit from independent review proportionate to risk. The record should preserve failed tests and explain any threshold change.
The team should review offline evaluation, red-team testing, human review, production monitoring and customer acceptance. Test sets should represent material populations and known failure modes. Leakage between training and evaluation should be assessed. Versioning should connect model, prompt, data, code and result.
NIST’s AI RMF Core states that test sets, metrics and tools used during evaluation should be documented and that production functionality and behaviour should be monitored [2]. The investor should test whether the company’s evidence supports its actual commercial promises rather than a generic compliance checklist.
22. Review security and resilience
Security diligence should cover product, model, data, infrastructure, identity, access, secrets, software supply chain, customer integration, monitoring, incident response and business continuity. The team should identify which controls are company-managed and which depend on providers. Certifications can support evidence while leaving scope and operating effectiveness to be tested.
AI-specific scenarios may include prompt injection, data leakage, insecure tool use, model extraction, poisoned knowledge sources, unsafe automation and abuse. The analysis should focus on the product’s architecture and threat model. A catalogue of possible risks is not evidence of exposure or control.
Incidents, near misses, vulnerabilities and exceptions should be linked to remediation, customer impact, contractual notice and cost. Resilience testing should include dependency outage and degraded model performance. Material findings can affect conditions, indemnities, reserves, investment timing or the decision to stop.
23. Assess cloud and compute concentration
Compute concentration should be assessed across provider, region, accelerator, capacity commitment and workload. A company may use several cloud services while relying on one region or hardware class for a critical product. The map should include deployment, evaluation, training, data and business-continuity workloads.
The contract review should cover price, discounts, credits, commitments, capacity, service levels, data location, security, termination and migration support. The technical review should test observability, workload portability and recovery. The financial model should show utilised and committed cost separately.
CoreWeave’s 2025 filing discusses customer adoption, performance, efficiency, remaining performance obligations and financing of AI infrastructure [19]. Oracle’s 2026 filing describes power, capacity and third-party data-centre dependencies [20]. These infrastructure disclosures illustrate upstream conditions that can reach an application company through price, availability or supplier terms.
24. Build the compute sensitivity
Compute sensitivity should connect workload volume, task success, model mix, input and output intensity, caching, batch treatment, latency tier, provider rate, credits and minimum commitments. The model should reconcile to invoices and telemetry for a selected period. It should then bridge to recurring contribution margin and cash.
The team should avoid a single cost-per-query measure when queries vary materially. Cost per successful accepted workflow may provide a stronger economic unit, provided success is well defined. The model should also show failed attempts, retries, human review and idle capacity.
Scenario design can test higher volume, lower provider rates, model migration, quality thresholds, customer mix and commitment utilisation. Each scenario should preserve operational feasibility. Lower cost may require a quality trade-off; a larger commitment may improve unit price while increasing cash risk.
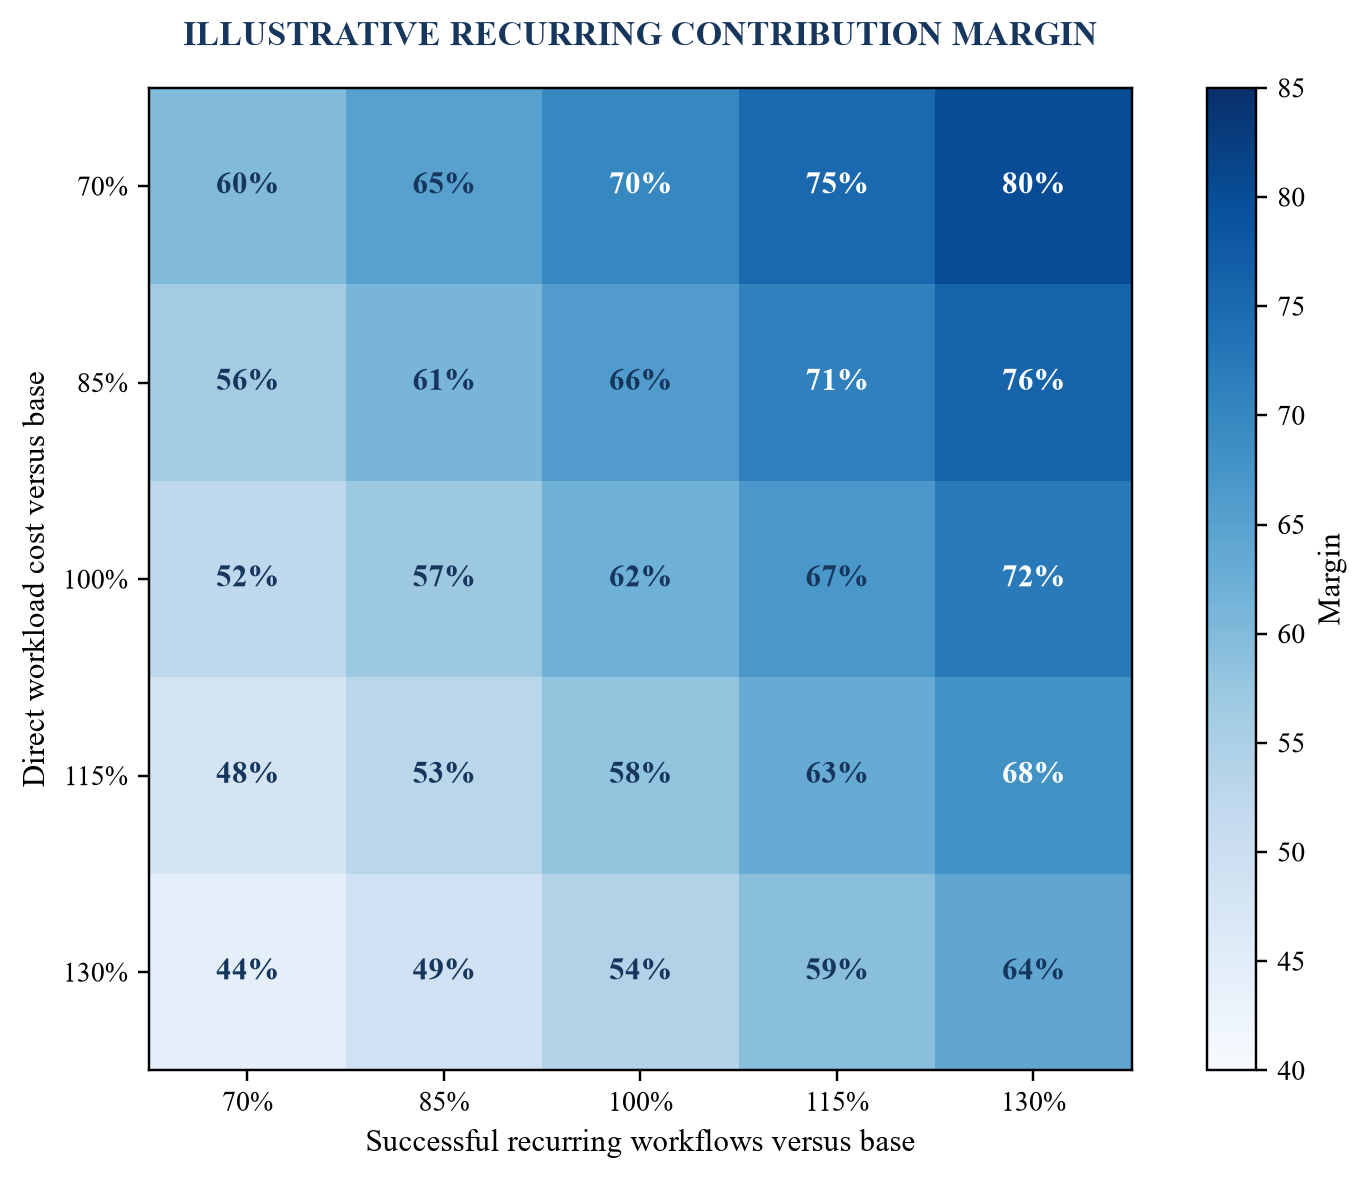
The values are hypothetical and illustrate model structure; they are not a forecast or valuation conclusion.
25. Assess product reliability
Reliability should be defined through the customer promise. Measures may include availability, latency, error rate, successful completion, escalation, recovery, data freshness and service credits. Aggregate uptime can conceal a failing AI workflow inside an available application.
The team should review service objectives, actual performance, incidents, root causes, remediation and customer communication. Release-level analysis can show whether velocity increases incident frequency or reduces recovery time. Material customer segments and peak periods should be visible.
Reliability economics include lost revenue, credits, support, rework, duplicate capacity and customer churn. The forecast should include the investment required to support growth. A strong historical record at limited scale does not establish performance at projected volume; the capacity and resilience plan should explain the bridge.
26. Evaluate the product organisation
Organisation diligence should map decision rights, leadership, product management, engineering, machine learning, data, security, reliability, customer success and finance. The team should test whether owners can define outcomes, instrument the product, review evidence and respond to incidents. Headcount alone does not establish capability.
Release throughput should be normalised for team size, architecture and change class. Key-person dependence should include technical knowledge, customer relationships and approval rights. The investor should review succession, retention, incentives, hiring plan and contractor exposure while respecting applicable employment and privacy requirements.
The operating plan should connect hires to specific constraints. Adding developers may not resolve poor product discovery, data rights or slow enterprise approval. A planned specialist role should include timing, cost and interim control. The investment case should reflect the execution capacity available after closing.
27. Review customer concentration and referenceability
Customer concentration should be measured across revenue, gross profit, cash collection, workload and product evidence. A customer can represent a moderate share of revenue while contributing a large share of successful-use data or product direction. The investor should understand commercial and technical concentration together.
Contracts should be reviewed for term, termination, renewal, pricing, minimums, acceptance, service level, liability, data rights, publicity and change of control. Reference calls require customer consent and a controlled question set. The record should distinguish management-selected advocates from a representative sample.
Reference evidence should test problem importance, implementation, outcome, reliability, support, alternatives, renewal intent and expansion. It should also capture limitations and customer-specific factors. One enthusiastic reference cannot establish portfolio-wide retention. The findings should reconcile to usage, support and commercial records where permitted.
28. Analyse market and competitive position
Market diligence should define the customer problem, economic buyer, user, budget, purchase process and credible alternatives. AI-native companies can compete with software vendors, internal development, outsourced services, model providers or continued manual work. Market size should follow addressable workflows and willingness to pay.
Competitive evidence should compare customer outcome, quality, integration, security, deployment, price, direct cost and switching. Feature counts can mislead because capabilities differ in production readiness and customer acceptance. The team should review win-loss records, competitor references and renewal decisions while preserving sample limitations.
The investment thesis should state where advantage resides and how it may change. Provider improvements can strengthen the product or compress differentiation. Open models can lower cost or increase competition. Regulation can raise barriers and compliance cost. Scenarios should connect these forces to customer outcomes, retention and margin.
29. Test pricing and packaging
Pricing diligence should map the charge unit to customer value and company cost. Seat, workflow, outcome, subscription, consumption and hybrid structures distribute risk differently. The team should examine list price, realised price, discounts, credits, minimums, overages, services and renewal mechanics by cohort.
Packaging should show which features drive acquisition, adoption, expansion and retention. AI features offered at low or no incremental price can support a broader platform while increasing hosting cost, as Atlassian describes as a risk in its filing [16]. That issuer-specific statement illustrates the need to test the target’s package economics.
Price experiments should be separated from contracted outcomes. The investor should test willingness to pay, procurement response, usage elasticity and churn. A forecast that assumes higher price and higher adoption should explain the customer value and transition plan. Price changes can also alter support, channel and revenue-recognition requirements.
30. Assess go-to-market repeatability
Go-to-market analysis should trace target account, qualified opportunity, technical validation, security review, commercial approval, implementation, adoption and renewal. Cycle time should be segmented by customer and use case. AI products can face long evaluation and governance stages even when demonstrations are rapid.
The team should reconcile customer-relationship records, contracts, product telemetry, implementation records and revenue. Pipeline stages should have evidence-based exit criteria. Partner-sourced, founder-led and self-serve routes should be shown separately because capacity and conversion can differ.
Repeatability requires more than historical growth. The company should show a defined problem, referenceable outcome, viable deployment, support capacity and unit economics across successive cohorts. The forecast should include sales, solution engineering, security, implementation and customer-success resources needed to reproduce the motion.
31. Build the forecast from operating drivers
The forecast should begin with customer cohorts and operational drivers. Starting customers, new acquisition, activation, successful recurring use, renewal, contraction, expansion, price and revenue timing form the commercial bridge. Workload, model mix, provider rates, support and implementation form the cost bridge.
Each assumption should have a source, base period and owner. Historical evidence may support a range rather than a point. Recent product changes may lack mature renewal data. The model should state where management judgement extends beyond observed evidence and should preserve the alternative cases.
The balance sheet and cash-flow statement should follow the operating model. Deferred revenue, receivables, provider commitments, capitalised development, leases, debt, taxes and transaction costs can affect liquidity. The forecast should reconcile to accounting policies and receive qualified review where required.
Table 4. Forecast assumption evidence map
| Driver | Primary evidence | Key limitation | Scenario response |
|---|---|---|---|
| new customers | pipeline and cohort conversion | changing segment mix | vary volume and cycle time |
| renewal | matured contract cohorts | recent cohorts not mature | apply segment ranges |
| expansion | account-level paid growth | concentration and pricing effects | separate volume and price |
| successful use | production workflow evidence | definition and sampling | vary adoption and quality |
| direct cost | invoice and workload reconciliation | credits and commitments | test provider and model mix |
| support effort | time and case records | incomplete allocation | vary assisted-deployment load |
Each assumption should retain a source, observation period and approved scenario range.
32. Construct coherent scenarios
Scenarios should describe internally consistent operating states. A base case may assume current product acceptance, measured retention and planned hiring. An upside may combine stronger adoption with proven support leverage. A downside may combine slower enterprise deployment, weaker renewal and higher model cost. Each case should specify the mechanism.
The team should avoid mixing every favourable assumption in one case without operational dependencies. Faster releases may require more evaluation and reliability capacity. Higher customer volume may increase support and working capital before efficiency appears. Lower provider prices may attract competitors as well as improve margin.
Scenario probabilities should be used carefully. Where evidence is limited, ranges and decision thresholds may be more transparent. The investment committee should see which assumptions drive security value, capital need and return. Sensitivity analysis should not replace a coherent narrative about how the business operates.
33. Determine capital need and runway
Capital need should extend from signing through a credible next financing, self-funding point or strategic decision. It should include operating cash, provider commitments, working capital, transaction costs, debt service, contingent payments and a liquidity reserve. The model should use actual security terms and closing conditions.
The diligence plan should identify evidence milestones that require time and cash. Enterprise renewals, model migrations, certifications and market expansion may extend beyond the proposed runway. A staged security can align funding with evidence while introducing execution and control considerations that require legal and tax advice.
Runway should be tested under delayed revenue, higher cost and closing risk. A signed term sheet does not provide cash. The company may need capacity to operate through documentation, approvals and receipt. The investor should also understand whether customer or supplier confidence depends on balance-sheet strength.
34. Translate findings into valuation
Valuation should follow the purpose, basis, methods, evidence and security rights. IFRS 13 defines fair value as a market-based measurement and establishes a framework for measurement and disclosure [4]. International Valuation Standards provide standards relevant to valuation assignments [8]. Transaction-specific qualified advice may be required.
Market approaches can use comparable companies and transactions, with adjustments supported by differences in growth, retention, margin, concentration, capital intensity, rights and risk. Income approaches can translate cohort and cost evidence into cash flows. A recent financing can provide context while requiring review of rights and market conditions.
Diligence findings should enter the model through explicit drivers. A mature retained cohort can affect revenue durability; model concentration can affect margin, capital need or scenario range; security findings can affect closing conditions and investment. Arbitrary discounts can double count effects already captured in the forecast.
35. Model the security waterfall
Enterprise value does not determine current shareholder value without the capital structure. The model should include cash, debt, convertibles, preferences, participation, anti-dilution, warrants, options, pool changes, tranches and transaction costs. Definitions should follow the actual documents and qualified legal review.
The waterfall should show proceeds across enterprise-value scenarios and convert them into investor ownership, return and downside. New funding can improve operating value while changing allocation among securities. Milestone tranches, liquidation preferences and governance rights can affect both protection and incentives.
The committee should evaluate price and terms together. A higher headline valuation with senior economic rights can produce a different result from a lower price with simpler terms. The decision pack should retain the cap-table source, assumptions and sensitivity so the outcome can be reproduced.
36. Design investment protections
Protections should respond to material, evidenced risks. They may include conditions precedent, staged funding, information rights, board rights, reserved matters, covenants, use-of-proceeds controls, key-person provisions, representations, indemnities or specific remediation plans. Their feasibility and effect require legal, regulatory and tax advice.
The team should avoid using terms as a substitute for understanding the business. A covenant cannot create customer value or model portability. It can provide information, consent or intervention rights while potentially restricting operation and future financing. Each protection should have a defined risk, trigger, remedy and monitoring source.
Closing conditions should be capable of objective verification. Vague requirements for improved technology or satisfactory performance can create dispute. Evidence from the diligence ledger can support specific deliverables, acceptance tests and authorised sign-off. Residual risks should remain in the investment recommendation.
37. Build the investment scorecard
The investment scorecard should combine evidence strength, operating result, financial consequence and proposed response. It should avoid a single opaque total that hides a fatal issue. Categories can include customer value, retention, economics, dependency, data rights, security, team, market, forecast, liquidity and security terms.
Each score should follow an approved rubric and link to underlying evidence. The committee should see confidence and limitation separately from result. A strong observed outcome supported by a small sample differs from a weak outcome supported by a complete population. Both dimensions matter.
The scorecard should support judgement, not automate it. Decision makers should record reasons, dissent, conditions and unresolved matters. Changes between initial review, final approval and closing should be versioned. The record can then support post-investment governance.
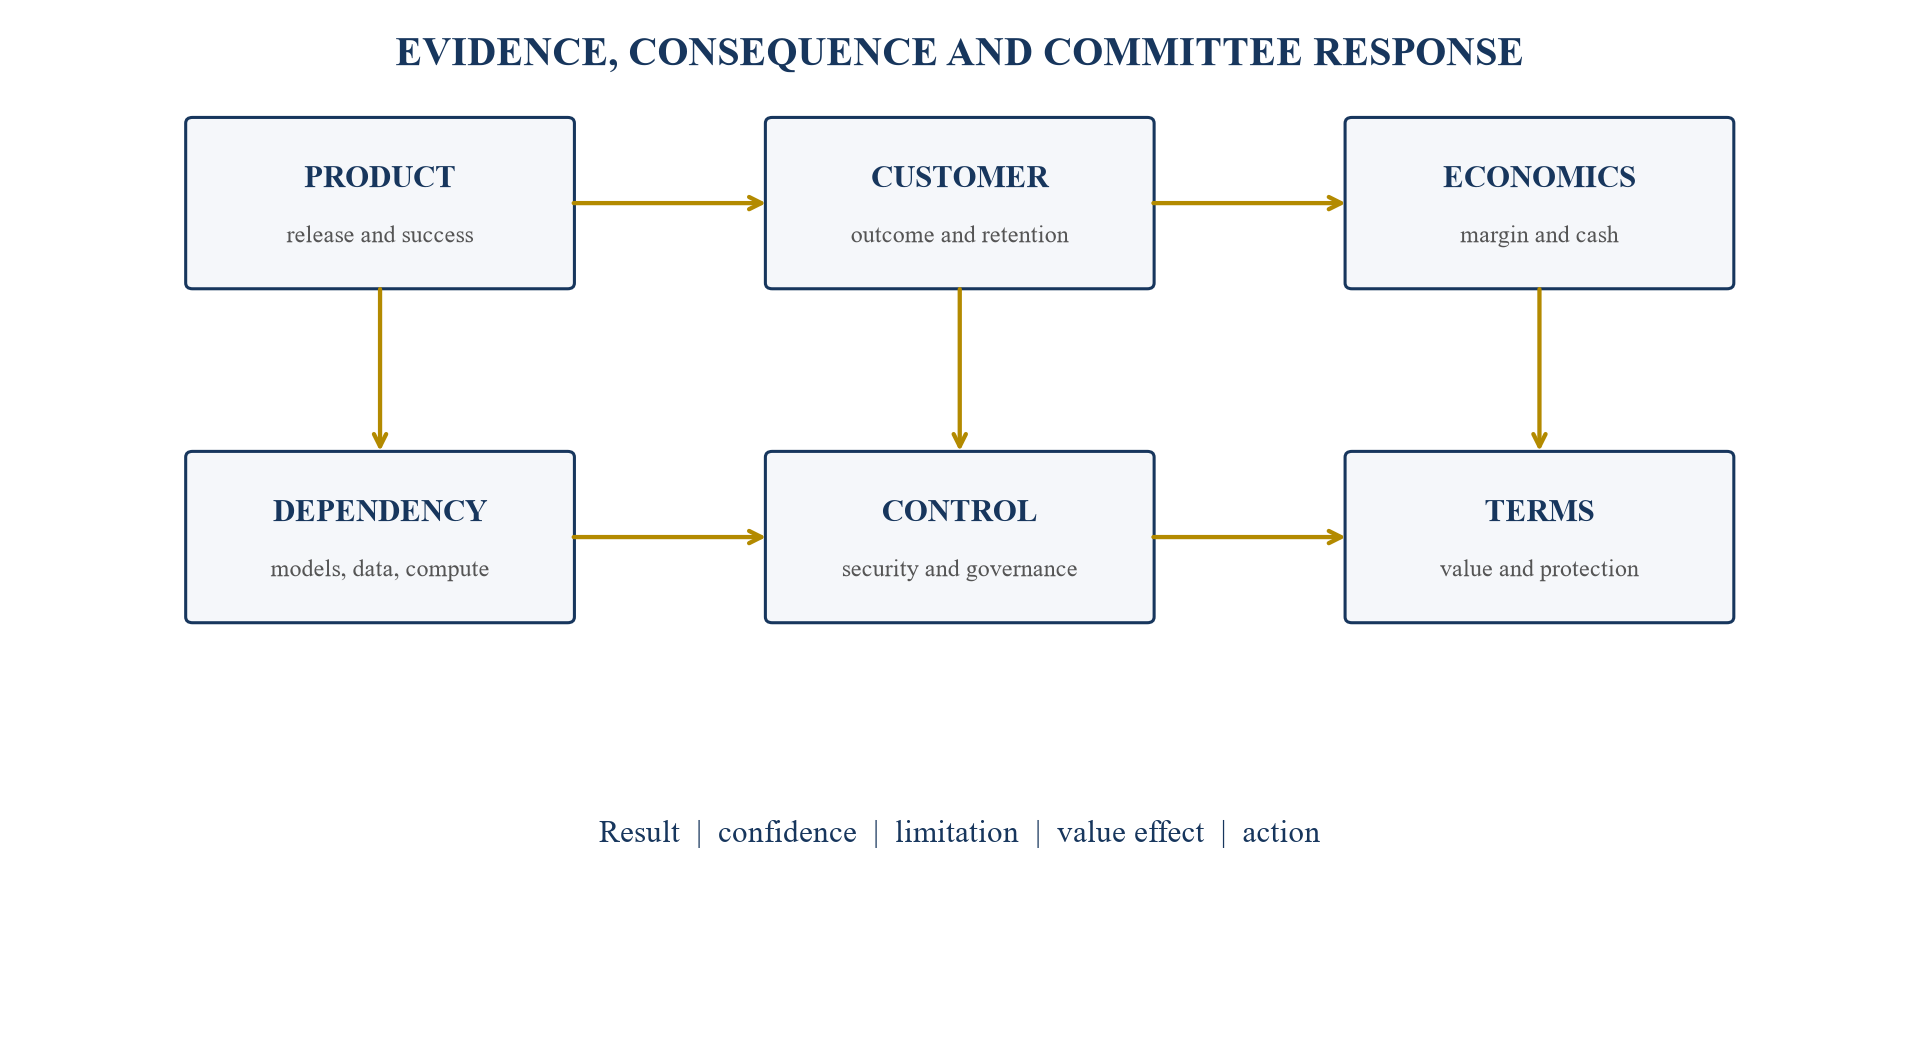
The committee should consider operating result, evidence confidence, limitation, value effect and proposed action.
Table 5. Investment scorecard fields
| Module | Result | Evidence confidence | Financial consequence | Committee response |
|---|---|---|---|---|
| release-to-retention | favourable, mixed or adverse | source, cohort and maturity | revenue range | accept, condition or revise |
| recurring economics | favourable, mixed or adverse | cost reconciliation | margin and cash | price, tranche or action |
| model dependency | favourable, mixed or adverse | contract and migration test | cost and continuity | protection or remediation |
| data and security | favourable, mixed or adverse | rights and control review | liability and market access | condition, reserve or stop |
| capital and terms | favourable, mixed or adverse | forecast and documents | ownership and return | approve, negotiate or stop |
A score does not override a material stop condition or specialist advice.
38. Prepare the investment committee pack
The committee pack should state the decision requested, security, price range, proceeds, ownership, governance, return cases and conditions. It should then present the operating thesis, evidence chain, material findings, scenario model, capital need, waterfall, protections, limitations and recommendation. Appendices should retain the detailed ledger and specialist reports.
The pack should distinguish fact, tested calculation, management representation and scenario. Source dates and versions matter because product and financial evidence can change during a process. Material changes after circulation should be highlighted rather than silently incorporated.
The committee should receive sufficient time to challenge assumptions. Questions and responses should enter the decision record. Approval should identify delegated authority for final negotiation and define changes that require renewed approval. A valuation range without term boundaries or closing conditions leaves the mandate incomplete.
The pack should include a clear bridge from the initial thesis to the final recommendation. Every material change should identify the evidence that caused it, the model input affected and the proposed committee response. This discipline helps reviewers distinguish genuine learning from unexplained movement in the valuation range. It also reduces the risk that favourable operating evidence is incorporated quickly while adverse findings remain isolated in specialist appendices.
Specialist conclusions should retain their scope. A technical reviewer may confirm that an alternative model passes a defined test while leaving contractual portability, customer consent and migration cost to other advisers. The integrated pack should connect these boundaries without suggesting broader assurance. Legal, tax, accounting, cybersecurity and valuation opinions should be attributed to the qualified provider and used within their stated assumptions.
39. Establish post-investment monitoring
Post-investment monitoring should continue the diligence evidence architecture. The company can report release acceptance, successful recurring use, retention, direct cost, dependency exposure, incidents, cash, forecast and covenant status on a controlled cadence. Definitions should remain stable or show a documented bridge.
Board reporting should focus on thresholds tied to the investment thesis. A surge in releases may be favourable if customer success and reliability hold. It may require intervention if support, incidents or churn rise. Dependency tests and contract renewals should be scheduled before switching options become constrained.
The investor should track remediation commitments, use of proceeds and financing milestones. Exceptions should have owners and dates. Monitoring should remain proportionate and respect management authority, confidentiality and applicable law. The objective is timely decision evidence, not operational duplication.
Monitoring design should address metric drift. As products, pricing and customer segments change, management may need to revise definitions. The board pack should retain the previous measure, the revised measure, the reason for change and a bridge for comparable periods where practicable. A metric that improves after a denominator change should not be presented as operating progress without the reconciliation.
The investor should also schedule dependency decisions before contract expiry or capacity renewal. A migration test has limited value when the remaining term is too short to execute it. Calendar controls can connect supplier renewal, customer commitments, liquidity gates and product roadmaps. This makes optionality observable and gives the board time to approve a switch, negotiate protection, fund duplication or accept the exposure with a documented rationale.
40. Conclusion
AI-native growth-equity diligence should follow the complete chain from release to customer value, retention, recurring economics and security outcome. Product velocity provides useful evidence when releases are defined, tested, adopted and associated with durable workflows. Customer and financial records must complete the bridge.
Model, data, cloud and compute dependencies shape quality, continuity, margin and capital need. They should be mapped at workflow level and tested through contracts, production-like evaluation and feasible migration plans. Unsupported claims of portability or proprietary advantage should remain limitations.
The investment committee needs a reproducible decision record. The evidence ledger, coherent scenarios, valuation bridge, security waterfall and scorecard connect diligence to price, terms, governance, action or stop. They also create a controlled baseline for post-investment monitoring. The final decision remains fact-specific and requires professional judgement and specialist advice.
A disciplined process should remain usable under time pressure. Named owners, dated sources, controlled calculations and explicit decision rights allow the team to update evidence without rebuilding the entire case. This operating discipline can improve negotiation readiness, closing control and the quality of the first board decisions after investment.
References
- National Institute of Standards and Technology, Artificial Intelligence Risk Management Framework 1.0, https://www.nist.gov/publications/artificial-intelligence-risk-management-framework-ai-rmf-10
- National Institute of Standards and Technology, AI RMF Core, https://airc.nist.gov/airmf-resources/airmf/5-sec-core/
- National Institute of Standards and Technology, Artificial Intelligence Risk Management Framework: Generative Artificial Intelligence Profile, https://nvlpubs.nist.gov/nistpubs/ai/NIST.AI.600-1.pdf
- IFRS Foundation, IFRS 13 Fair Value Measurement, https://www.ifrs.org/issued-standards/list-of-standards/ifrs-13-fair-value-measurement/
- IFRS Foundation, IFRS 15 Revenue from Contracts with Customers, https://www.ifrs.org/issued-standards/list-of-standards/ifrs-15-revenue-from-contracts-with-customers/
- European Commission, Regulatory framework for artificial intelligence, https://digital-strategy.ec.europa.eu/en/policies/regulatory-framework-ai
- Organisation for Economic Co-operation and Development, OECD AI Principles, https://oecd.ai/en/ai-principles
- International Valuation Standards Council, International Valuation Standards, https://www.ivsc.org/standards/
- International Organization for Standardization, ISO/IEC 42001 artificial intelligence management systems, https://www.iso.org/standard/81230.html
- U.S. Securities and Exchange Commission, EDGAR company filings database, https://www.sec.gov/edgar/search/
- U.S. Securities and Exchange Commission, Remarks at the Roundtable on Artificial Intelligence in the Financial Industry, 27 March 2025, https://www.sec.gov/newsroom/speeches-statements/crenshaw-remarks-ai-roundtable-032725
- Financial Accounting Standards Board, Accounting Standards Codification Topic 606, https://asc.fasb.org/topic&trid=2129938
- Bank for International Settlements, Artificial intelligence topic publications, https://www.bis.org/topic/artificial_intelligence.htm
- Amplitude Inc., annual reports and SEC filings, https://investors.amplitude.com/financial-information/sec-filings
- DigitalOcean Holdings Inc., 2025 fourth-quarter and annual results filed with the SEC, https://www.sec.gov/Archives/edgar/data/1582961/000158296126000015/a2025-q4dopressrelease.htm
- Atlassian Corporation, 2025 annual report, https://www.sec.gov/Archives/edgar/data/1650372/000165037225000060/team2025annualreport.pdf
- Microsoft Corporation, 2025 annual report filed with the SEC, https://www.sec.gov/Archives/edgar/data/789019/000095017025100235/msft-20250630.htm
- Alphabet Inc., 2025 annual report filed with the SEC, https://www.sec.gov/Archives/edgar/data/1652044/000165204426000018/goog-20251231.htm
- CoreWeave Inc., 2025 annual report filed with the SEC, https://www.sec.gov/Archives/edgar/data/1769628/000176962826000104/crwv-20251231.htm
- Oracle Corporation, 2026 annual report filed with the SEC, https://www.sec.gov/Archives/edgar/data/1341439/000119312526277521/orcl-20260531.htm
- Snowflake Inc., annual reports and SEC filings, https://investors.snowflake.com/financials/sec-filings/default.aspx
- C3.ai Inc., annual reports and SEC filings, https://ir.c3.ai/financials/sec-filings/default.aspx
- NVIDIA Corporation, financial reports and SEC filings, https://investor.nvidia.com/financial-info/financial-reports-and-sec-filings/default.aspx
- National Institute of Standards and Technology, AI RMF Playbook, https://airc.nist.gov/airmf-resources/playbook/
- National Institute of Standards and Technology, TEVV-Athlon Framework for Evaluating AI Systems, https://www.nist.gov/artificial-intelligence/ai-research/tevv-athlon-framework-evaluating-ai-systems
- IFRS Foundation, Educational material on measuring the fair value of unquoted equity instruments, https://www.ifrs.org/content/dam/ifrs/supporting-implementation/ifrs-13/education-ifrs-13-eng.pdf
