

1. Define the valuation question
Valuation should begin with the interest being valued, the measurement date, purpose, standard of value, unit of account and transaction context. A fundraising negotiation, employee-option exercise, financial-reporting measurement, acquisition, secondary sale and internal planning exercise can require different inputs, rights analysis and professional standards. The team should state whether it is estimating enterprise value, equity value, a security value or a transaction range.
The question should identify the capital structure, preferred rights, debt, cash, options, warrants, convertibles and expected financing need. A headline post-money figure can differ materially from the value of common equity when liquidation preferences, participation, anti-dilution, seniority or milestone terms apply. The model should preserve these differences rather than treat every share as economically identical.
Usage evidence enters the valuation because it can inform revenue durability, margin, capital need and risk. It does not create an independent value formula. The framework connects operational observations to established market and income approaches while making assumptions and limitations explicit.
2. Establish the measurement perimeter
The perimeter should include the legal entities, products, models, customer contracts, data rights, infrastructure commitments and human services that generate the economics. An AI product may rely on third-party foundation models, cloud credits, contractors, embedded services or founder labour that are not fully reflected in current cost. These dependencies belong in the analysis.
The team should map intellectual property ownership, licences, open-source obligations, customer data permissions, model-provider terms and material restrictions. Product value can depend on rights to use training data, retain outputs, improve models, distribute integrations and serve regulated customers. Qualified legal review is required for the actual rights.
Financial and product data should share a common period and entity perimeter. Cohort activity from one product cannot be compared mechanically with consolidated revenue or cash cost from another. Reconciliation identifies which observations support the forecast and which remain directional.
3. Build the usage-to-margin chain
The chain begins with eligible accounts and users, then activation, meaningful use, task attempts, successful outcomes, recurring workflows, paid conversion, retention, revenue, direct model cost, service effort and contribution margin. Each step has a definition, source, owner and observation window. A break in the chain becomes a diligence question.
Activity should be connected to the economic unit. A developer tool may price seats, tokens, executions or enterprise contracts. A customer-support agent may price resolved cases or capacity. A scientific platform may combine subscriptions with compute. The cohort model should show how product units become billing units and how billing units become collected cash.
The chain should retain failed and non-paying activity. Excluding unsuccessful tasks or free users can overstate product efficiency. Including all raw events without distinguishing intent can understate the value of high-quality workflows. Segmentation and reconciliation are therefore essential.
Data lineage should follow each metric from the originating event through transformation, reporting and financial use. The company should retain the event schema, query logic, exclusions, version and responsible owner. Changes to product instrumentation can create artificial cohort movements; these should be identified before trend analysis. Sampling can test whether logged activity represents the stated customer outcome. Access permissions and change controls help make the analysis reproducible at a later diligence date.
The chain should also record time. Activation measured within seven days differs from activation at any point in a year. A successful task followed by renewal carries different evidence from a successful task in an unpaid trial. Observation windows, censoring and cohort maturity should be visible. Where the available history is short, the valuation should use wider sensitivity and avoid extrapolating a mature retention curve from incomplete cohorts.
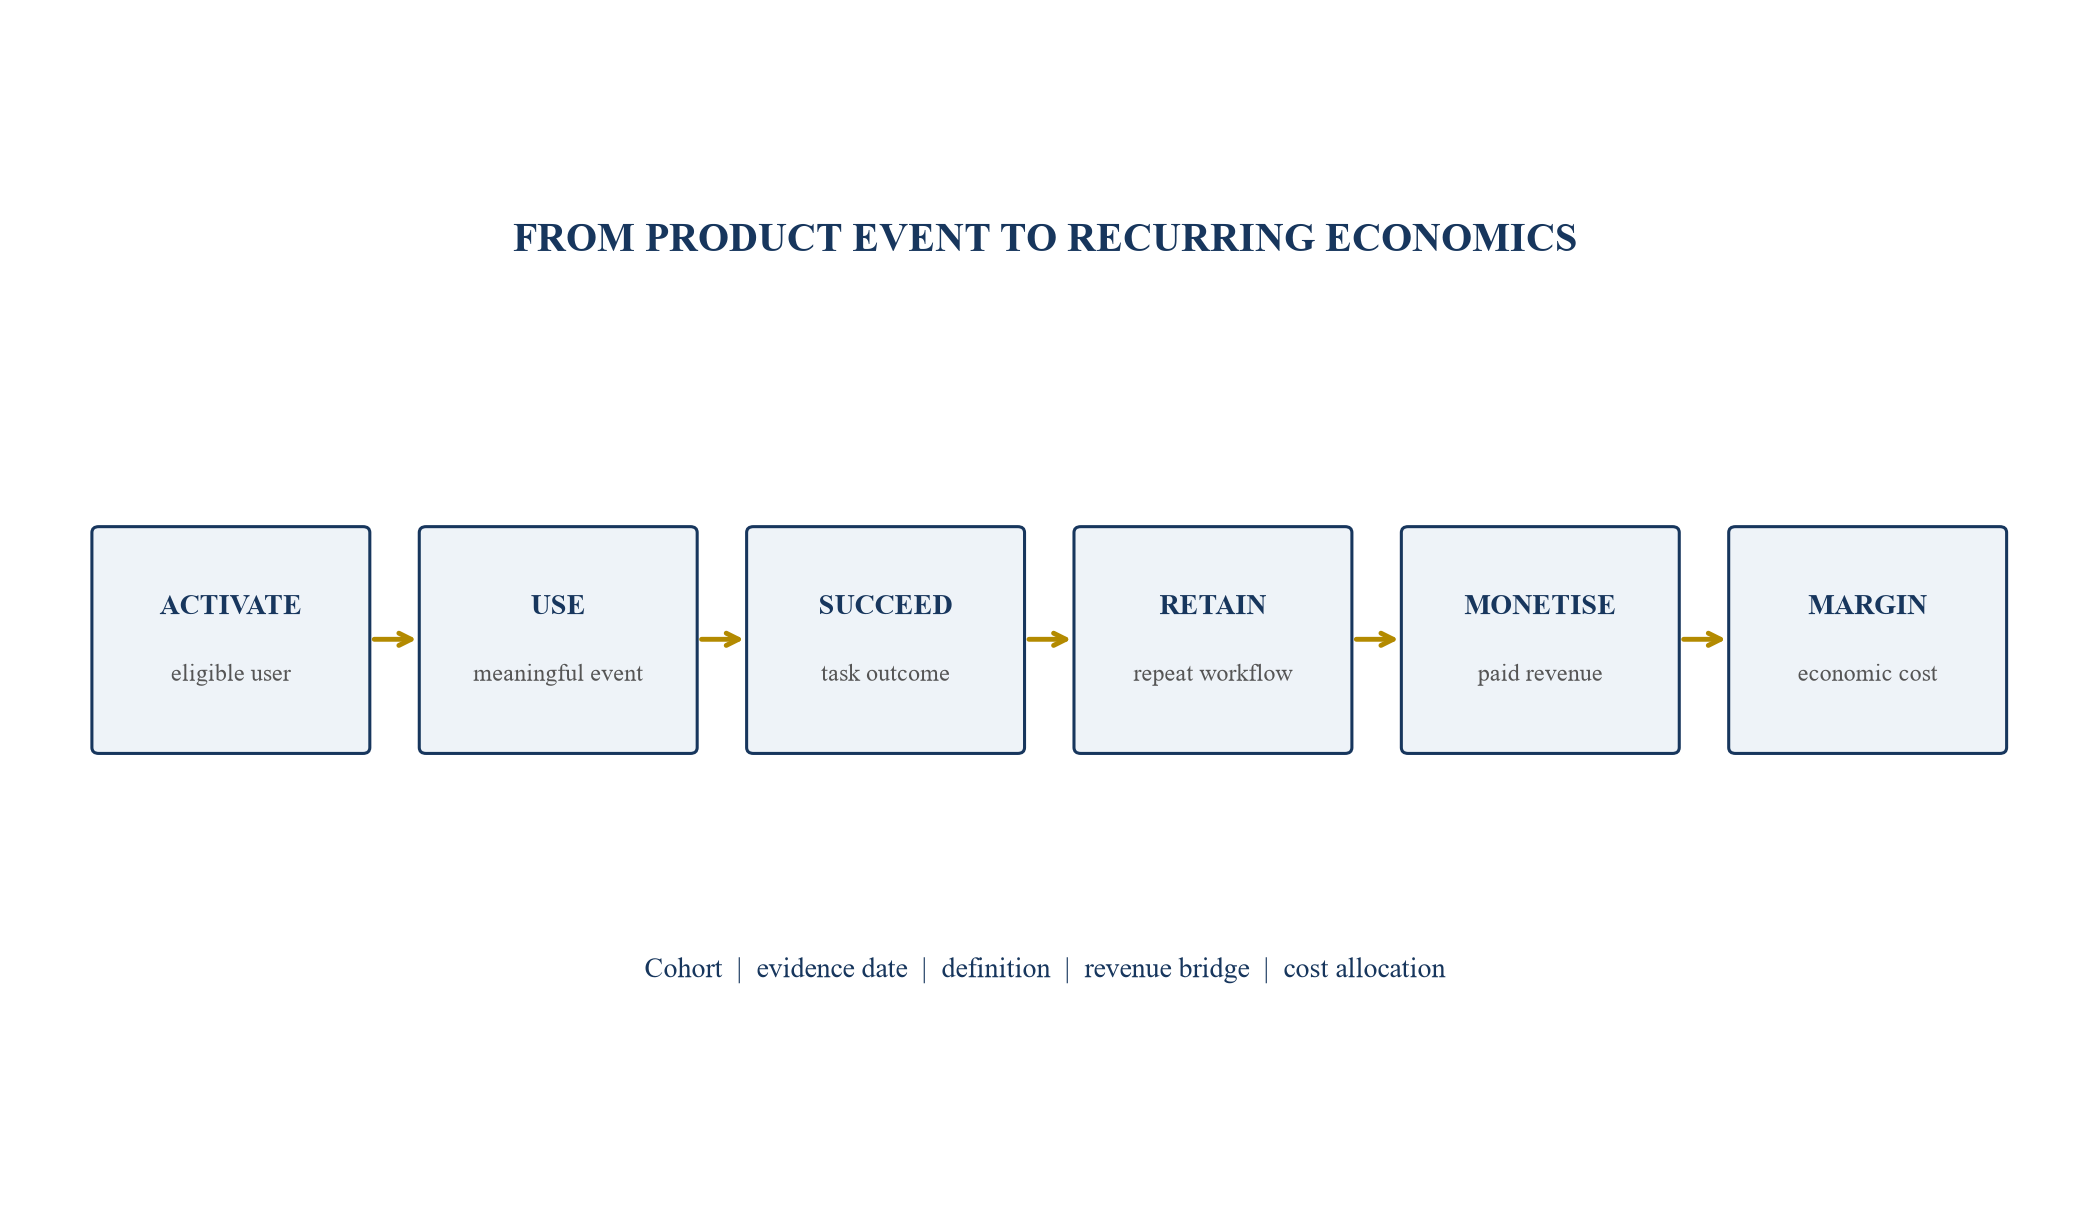
Product signals support valuation only when they reconcile through paid outcomes and economic cost.
Table 1. Evidence map for the usage-to-margin chain
| Stage | Evidence | Distortion risk | Valuation use |
|---|---|---|---|
| activation | verified account and first-value event | sign-ups without value | acquisition and onboarding assumptions |
| meaningful use | product event tied to a job | curiosity or automated noise | engagement and workflow depth |
| task success | completed outcome with quality test | self-reported or partial completion | value delivery and retention |
| recurring workflow | repeated use in a defined period | one-off project activity | revenue durability |
| monetisation | contract, billing and collection | free use or promotional price | revenue forecast |
| margin | direct model, data and service cost | omitted credits or labour | cash flow and valuation |
Definitions should be approved for the specific product and pricing model.
4. Define the account and user cohorts
Cohorts should group customers or users by a meaningful starting event such as contract signature, activation, first successful task, paid conversion or production deployment. Calendar cohorts reveal changes over time; behavioural cohorts reveal differences in product path; commercial cohorts reveal pricing, channel and segment economics. One cohort scheme rarely answers every question.
The unit should match the buying and usage model. An enterprise contract may contain many users, applications and departments. User retention can fall while account revenue expands through automation. A developer platform may have many individual users whose employer controls procurement. The analysis should therefore retain both account-level and user-level views where material.
Cohort membership and observation windows must remain stable. Moving weak customers into a new category after performance is known introduces bias. Acquisitions, migrations and pricing changes should be identified so historical comparisons remain interpretable.
5. Distinguish eligible, registered and active users
Registered users can include invited, duplicate, test, inactive, automated and free accounts. Eligible users are those permitted and able to use the product. Active users perform a defined meaningful event within a period. The event should reflect value creation rather than a login or background call.
Daily and monthly active measures require a stated denominator and time zone. A high daily-to-monthly ratio can indicate workflow frequency, though automated activity or a small specialist cohort can distort it. The team should inspect distributions rather than rely on one average.
Enterprise products often expand through seats provisioned before adoption. The cohort bridge should show contracted seats, provisioned users, activated users, recurring users and paid utilisation. This connects sales claims with product reality and identifies expansion capacity.
6. Define a meaningful product event
A meaningful event represents progress in the customer's job: a resolved case, accepted code change, completed analysis, approved document, deployed model, generated design used in production or another validated outcome. Prompt submission, token generation or page view may be an input rather than an outcome.
The event definition should address quality, user intent, duplication and reversals. A generated answer later discarded should not count like an accepted answer. A task repeated because of failure should not inflate successful volume. Instrumentation should retain attempt and outcome separately.
Changes to the event definition need version control. When the product adds agents or automation, event counts can rise mechanically. Historical series should be restated where possible or shown with a break so growth is not confused with taxonomy change.
7. Measure activation to first value
Activation should mark the first credible delivery of the intended outcome. Time to first value can influence conversion and retention because a customer bears integration, learning and change-management cost before receiving benefit. The measure should begin at a defined point and exclude waiting periods only when justified.
The cohort analysis should show the proportion activated by day or week, median time, distribution tails and reasons for failure. Segmenting by channel, company size, integration path and use case can reveal whether apparent product-market fit depends on intensive services.
Founder-led pilots may activate faster because the team provides exceptional support. A scalable valuation case should normalise for this effort and test whether later cohorts reach value with comparable quality and lower assistance.
8. Construct the task-success funnel
The task funnel begins with eligible demand, then attempted tasks, technically completed tasks, quality-passing tasks, user-accepted outcomes and economically valuable outcomes. Each stage removes a different failure mode. Technical completion without accuracy or acceptance can create usage without value.
Quality tests should fit the context. A coding product may use tests and review acceptance. A research product may use source fidelity and factual validation. A customer-service product may use resolution, escalation and satisfaction. High-stakes use cases can require human approval and post-deployment monitoring.
Latency, availability and consistency affect success. A model can be accurate in a benchmark and unsuitable in production because it is slow, unreliable or difficult to control. Cohort evidence should therefore combine product, operational and human outcomes.
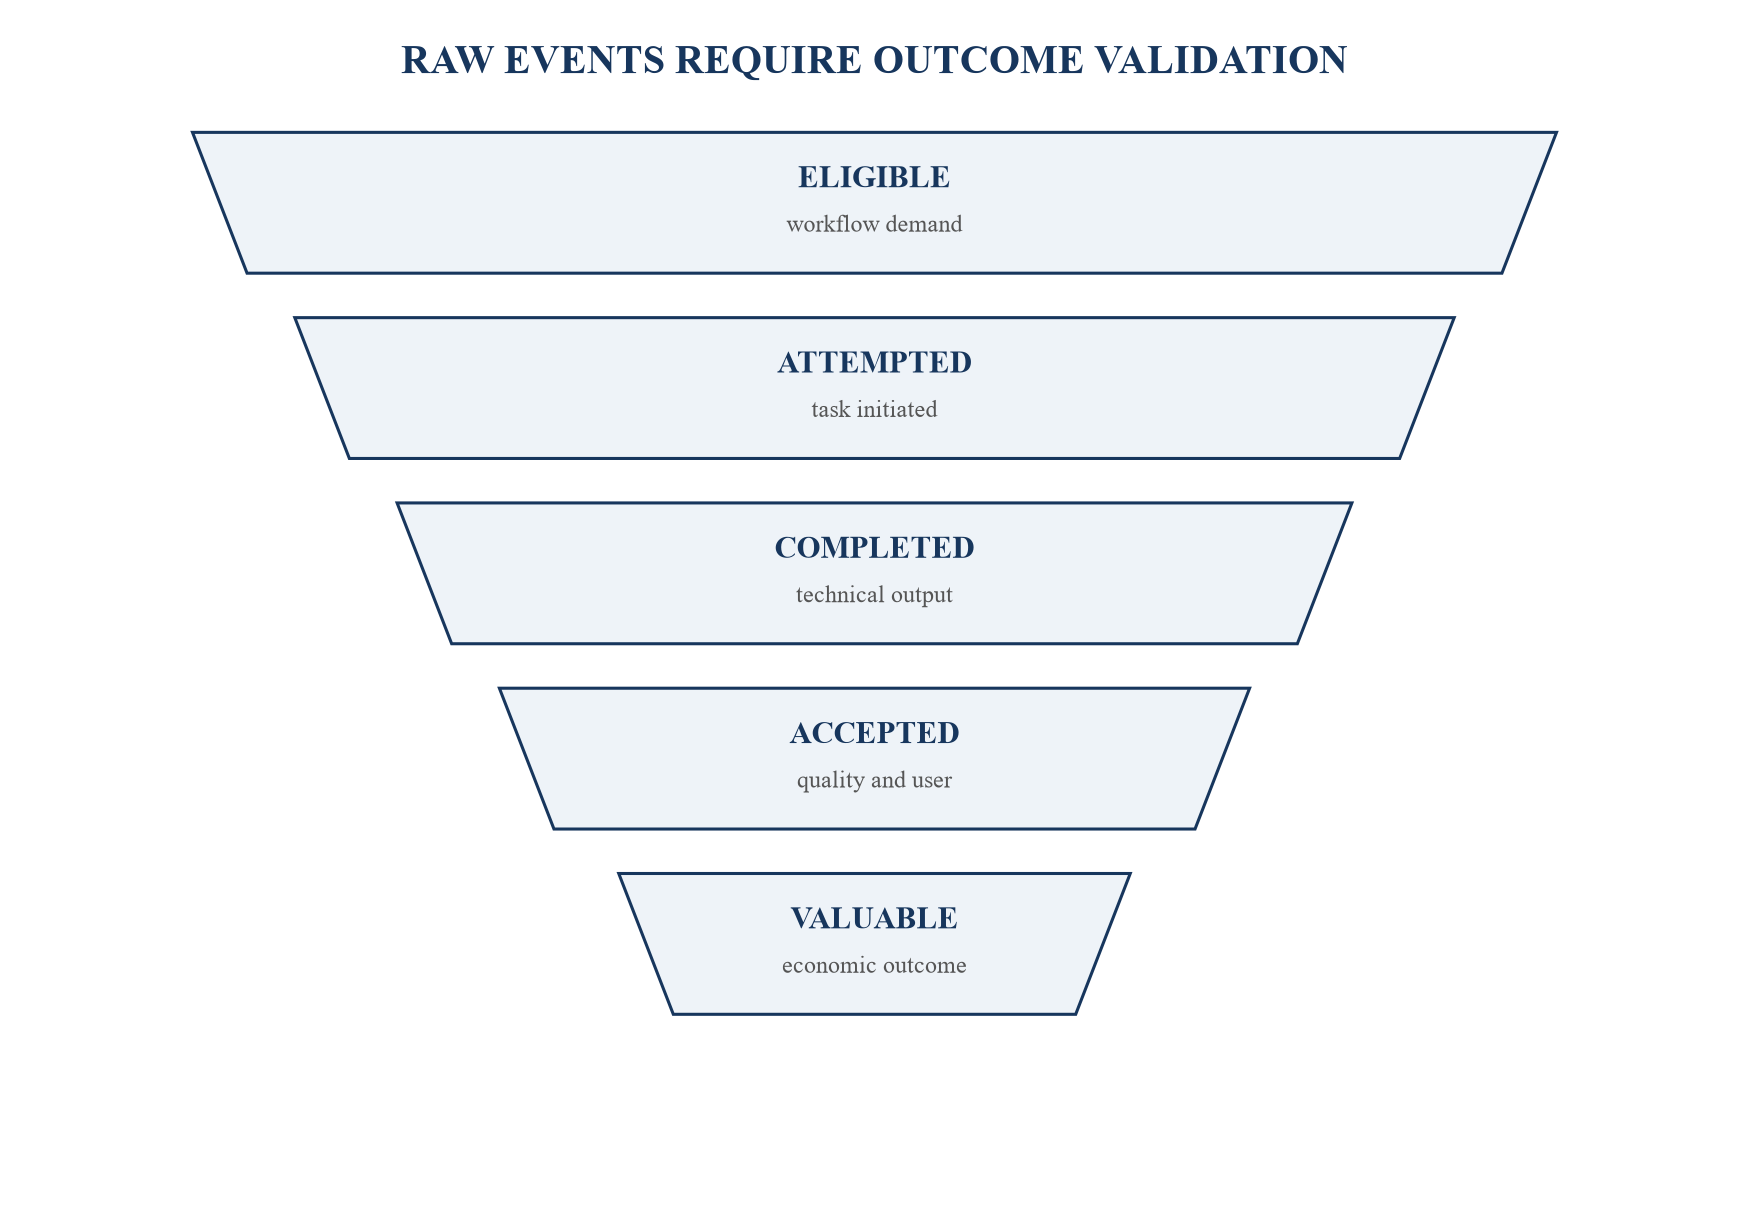
Illustrative stages separate raw activity from accepted and economically valuable outcomes.
Table 2. Task-success measurement design
| Measure | Definition | Evidence | Valuation implication |
|---|---|---|---|
| completion | system returns the required form | event log | capacity and reliability |
| quality pass | output meets defined test | benchmark or review | usable product value |
| acceptance | authorised user accepts outcome | workflow record | adoption and switching cost |
| correction | additional work after output | edits and support | hidden service cost |
| escalation | human specialist required | case routing | scalability and margin |
| economic outcome | time, revenue, loss or cost effect | customer-approved evidence | willingness to pay and retention |
Measures and thresholds should reflect the product, customer and consequence of error.
9. Measure repeat use and workflow depth
Repeat use should be observed by account, user, use case and task. Frequency alone can reward trivial or inefficient usage. Workflow depth asks how many material steps, teams, data sources and decisions depend on the product. Deeper integration can support retention while increasing implementation and support burden.
The cohort view should distinguish recurring operating workflows from episodic projects. A due-diligence tool may be valuable with irregular use; monthly inactivity does not necessarily mean churn. The retention window should match the natural job cycle and contract.
Expansion across departments or workflows can indicate product value. It can also reflect discounted bundles or central procurement. The analysis should connect usage expansion to paid contract value and cost-to-serve.
10. Separate human and machine users
Agentic products can replace or augment human activity. Machine users may call the system continuously while human seats decline. The valuation model should distinguish human users, service accounts, API clients, agents and downstream applications because their usage and willingness to pay differ.
Machine-generated events can compound through agent loops, retries or orchestration. The system should detect runaway activity and allocate it to the originating customer and workflow. Token or call growth driven by inefficiency should not be treated as adoption.
Pricing may migrate from seats to consumption, capacity or outcomes. The forecast should model the transition, customer procurement, billing controls and margin effects. Historical seat metrics can lose relevance before revenue catches up.
11. Connect usage to paid conversion
The conversion bridge should show free, trial, pilot, paid pilot, initial production and scaled production cohorts. Each stage requires a defined commercial event and time window. A signed pilot and a recurring production contract carry different revenue durability.
Conversion should be measured by accounts and economic value. A high logo conversion rate can coexist with weak revenue when discounts are large. A lower conversion rate can still create value if retained accounts expand at attractive margin. Channel and segment mix should therefore remain visible.
The analysis should identify credits, waived implementation, promotional model cost and partner subsidies. These can support customer acquisition, though steady-state economics require their expiry and replacement cost.
12. Analyse retention by product and cohort
Logo, gross revenue and net revenue retention answer different questions. AI startups should also examine retained successful tasks, workflow retention and paid consumption. Revenue can remain stable while product use falls under a committed contract; usage can grow while price compression limits revenue.
Retention should be separated into churn, contraction, expansion, price, product migration and foreign exchange. The cohort table should show renewal windows and contract terms. Recent cohorts with incomplete observation should not be compared as if fully matured.
Customer concentration affects interpretation. One expanding account can mask broad contraction. The valuation case should show concentration-adjusted retention and the contribution of top customers to growth and margin.
13. Measure monetisation and price realisation
List price, contracted price, billed price and collected price can differ. The analysis should reconcile units, tiers, minimums, overages, discounts, credits, refunds and implementation fees. Outcome pricing requires a clear definition of the outcome and dispute process.
Price realisation should be observed by cohort and use case. Early design partners may receive unusually favourable terms. Later cohorts may pay more because the product improves, or less because competitors and model costs fall. Forecast assumptions should reflect the evidence rather than one published price.
Value capture can lag customer value. A startup may deliberately underprice to accelerate adoption. The valuation case should state the mechanism and evidence for future repricing, including renewal rights, procurement constraints and customer alternatives.
14. Reconcile product data to revenue
The revenue bridge should connect contract, billing, recognised revenue, deferred revenue, remaining obligations and collections with product usage. Consumption businesses need a clear cut-off, meter, price schedule and dispute treatment. Subscription businesses need seat, feature and service entitlement evidence.
Differences can reveal implementation delays, unused commitments, over-consumption, credits or accounting timing. They should be explained by cohort. Backlog or remaining performance obligations provide context and are not substitutes for cash collection or future margin.
Management metrics should retain their definitions. Annual recurring revenue based on a recent month can overstate durability when consumption is volatile. The team should show the annualisation method and sensitivity.
15. Map the full cost-to-serve
Direct cost can include model inference, cloud compute, vector databases, storage, data licensing, retrieval, observability, safety tooling, third-party APIs, support, customer success, human review and allocated operations. Promotional credits and founder labour should be shown separately so steady-state cost is visible.
Shared cost requires an allocation driver connected to workload. Tokens alone may not capture accelerator type, context length, latency, retries, caching, batch processing or reserved capacity. The method should be consistent and tested against invoices and infrastructure records.
Cost should be measured by customer, product, task and cohort. Aggregate gross margin can hide unprofitable large accounts or workloads. Cohort-level cost identifies where pricing, routing, product design or support must change.
16. Build the inference-cost waterfall
The waterfall begins with customer activity and translates it into model calls, input and output tokens, accelerator time or provider charges. It then adds orchestration, retrieval, storage, data, monitoring, failed attempts, human review and support. Caching, routing, batching and model choice reduce specific layers.
Unit cost should be shown per attempted task, successful task, accepted outcome and revenue unit. Cost per successful outcome is often more decision-useful because failures still consume resources. The model should retain provider minimums and committed capacity.
Market-level declines in compute cost do not automatically improve company margin. Usage intensity, model quality, latency targets, customer mix, provider contracts and competitive pass-through can offset savings. Scenario analysis should make these interactions visible.
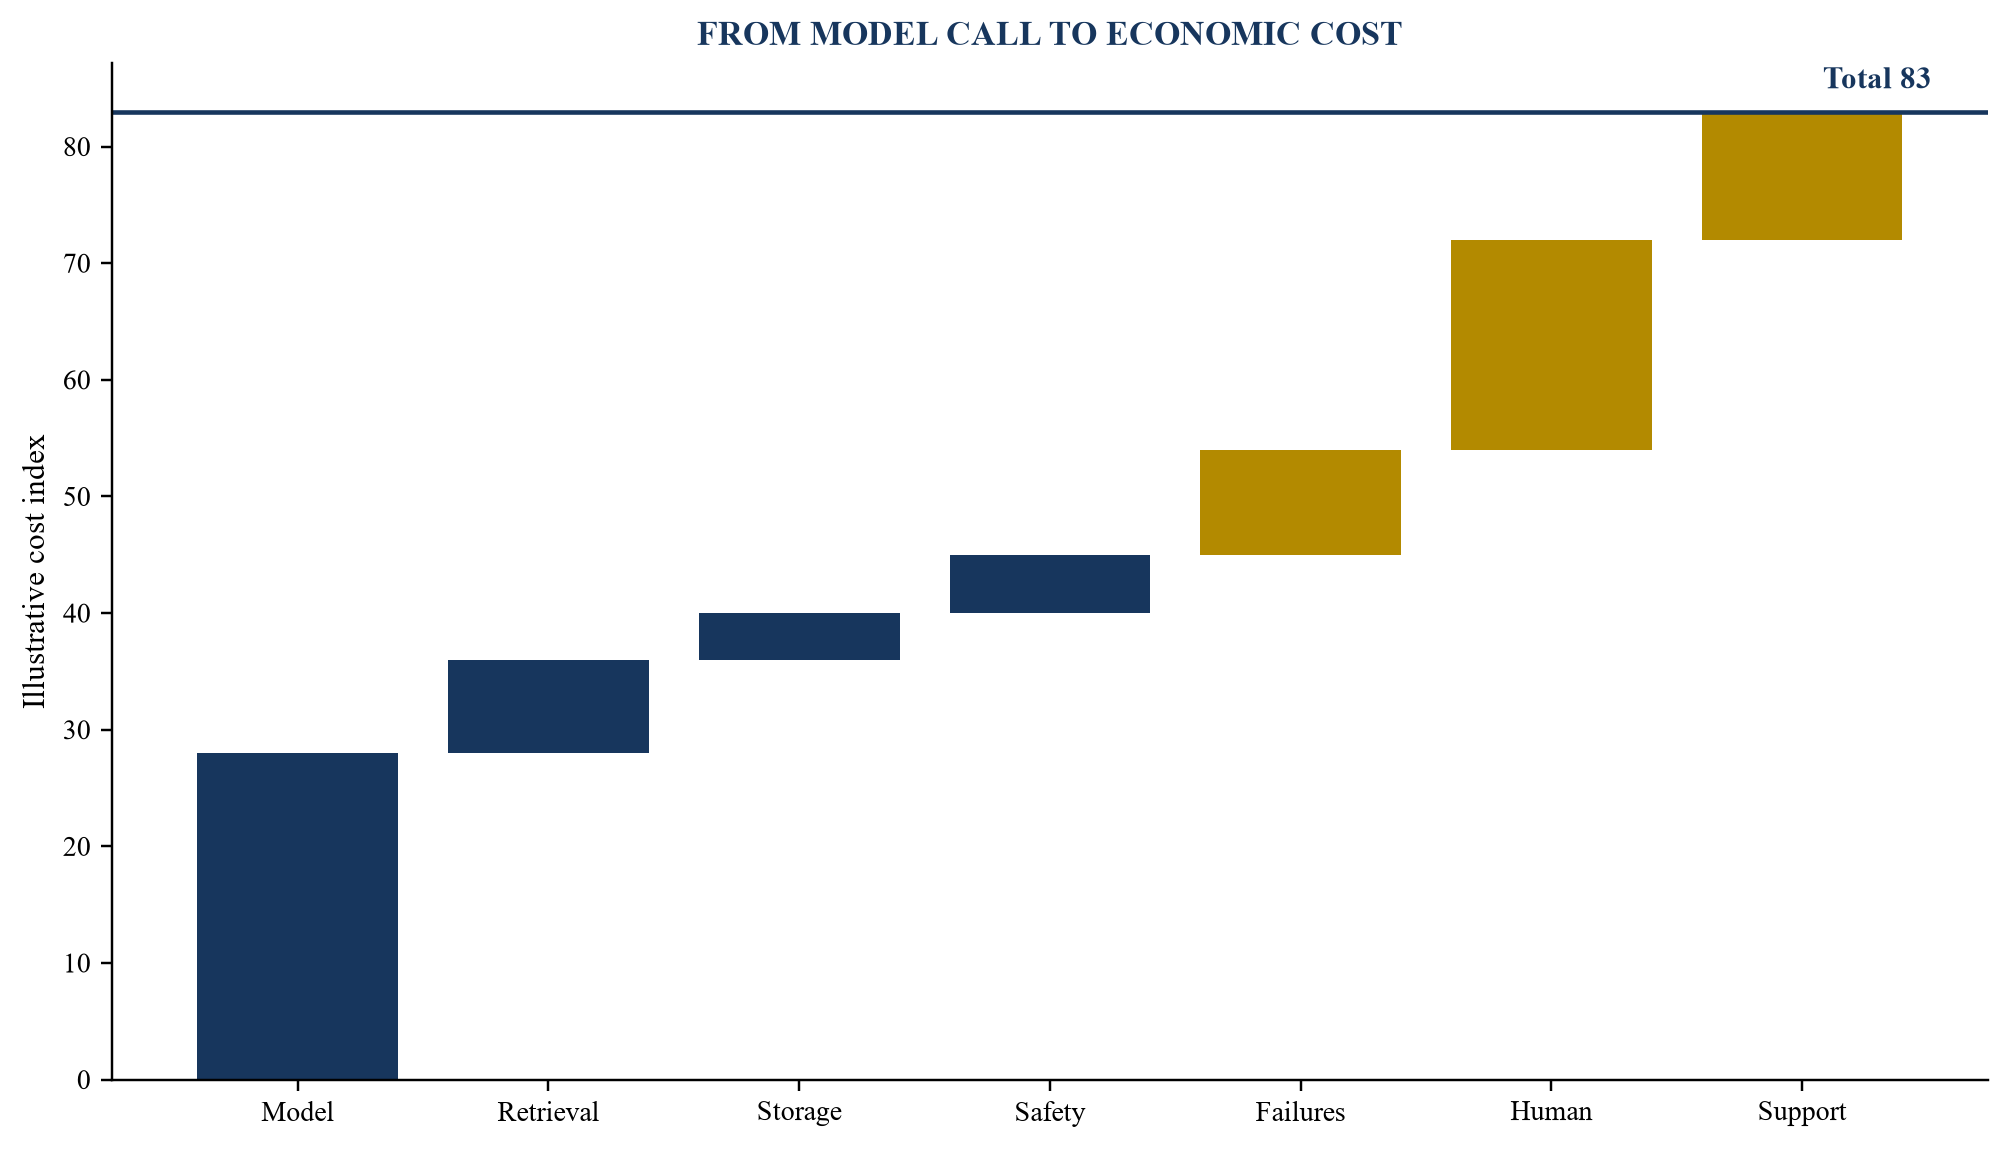
Illustrative values show how raw model cost can expand into economic cost per accepted task.
Table 3. Cost allocation controls
| Cost layer | Driver | Common omission | Decision use |
|---|---|---|---|
| model | calls, tokens, accelerator time | retries and premium routing | model and pricing choice |
| retrieval and data | queries, storage, licences | shared datasets | workload economics |
| reliability and safety | monitoring, evaluation, guardrails | pre-production testing | scalable delivery cost |
| human review | minutes by skill level | founder and specialist time | automation and margin |
| support | tickets, implementation, success | bundled services | segment pricing |
| capacity | reservation, minimum, idle resource | utilisation mismatch | capital and liquidity need |
Allocation should reconcile to provider invoices, payroll and the accounting perimeter.
17. Allocate human review and correction cost
Human review can be a product feature, control requirement or temporary workaround. The cohort model should identify who reviews, at what skill and cost, for which tasks and with what correction rate. Unrecorded founder or engineer intervention can make early gross margin appear stronger than economic reality.
The analysis should separate onboarding, implementation, routine review, exception handling and customer support. Some costs decline with product maturity; others rise as customers adopt higher-stakes workflows. Evidence from later cohorts and standard operating procedures supports scaling assumptions.
Automation should be assessed through outcome quality and cost together. Removing review may reduce expense and increase error, rework or churn. The forecast should model the control required for the actual use case.
18. Measure recurring contribution margin
Contribution margin should begin with revenue collected or recognised under the chosen analytical convention, then deduct variable model, data, infrastructure, support and service cost. The definition should be stated and reconciled to accounting gross profit. Product-development and go-to-market cost can be analysed separately.
The cohort table should show margin at acquisition, activation, early production, renewal and expansion. Negative initial margin can be rational when implementation creates durable revenue; the payback period and evidence should be explicit. Persistent negative margin under expansion can indicate mispricing or weak product economics.
Margin dispersion matters. Median, quartiles and largest accounts can reveal whether improvement is broad or driven by one contract. Valuation should reflect the repeatability of the observed curve.
19. Test the contribution-margin curve
The curve relates customer or workload maturity to contribution margin. Improvement can come from better activation, model routing, caching, automation, support efficiency, price, volume commitments and infrastructure utilisation. Deterioration can come from greater context, premium models, latency, complex integrations or service expectations.
The team should attribute margin changes to drivers rather than fit a smooth curve mechanically. A step change after a provider credit expires or customer expands into a regulated workflow may be economically meaningful. Cohorts should be compared at similar maturity.
The forecast should cap improvement at a level supported by technical and commercial constraints. Public-company margins provide context, while startup mix and scale can differ materially.
20. Examine customer acquisition and payback
Customer acquisition cost should include sales, marketing, solution engineering, pilots, implementation subsidies and partner economics. Founder-led selling should be normalised. Product-led channels can lower acquisition cost while increasing free-user infrastructure and support cost.
Payback uses contribution margin, not revenue. A high-growth account with low margin can repay acquisition cost slowly. The cohort view should show cash timing, contract prepayment, commissions and churn. It should also distinguish new-logo acquisition from expansion.
Valuation benefits from evidence that a repeatable channel acquires customers whose lifetime contribution exceeds acquisition cost with acceptable uncertainty. A ratio derived from immature cohorts requires sensitivity and should not be presented as settled economics.
21. Assess contract and revenue quality
Contract evidence should reconcile signed scope, service obligations, usage entitlements, minimum commitments, renewal rights, termination clauses, service credits and payment terms. Revenue recognised under the applicable accounting policy may differ from billings, cash receipts and contracted backlog. Valuation analysis should preserve those distinctions.
The review should identify pilots, cancellable arrangements, related-party revenue, reseller activity, pass-through compute, non-recurring implementation and customer-specific development. Each can be commercially valuable while carrying a different persistence, margin and working-capital profile. A customer that prepays for capacity can improve cash conversion; the corresponding delivery obligation and infrastructure commitment remain relevant.
Contract duration should be separated from economic commitment. A multi-year document can allow termination for convenience, contain annual volume elections or depend on customer acceptance. Conversely, a shorter agreement may sit inside an operational workflow with high switching cost and strong renewal evidence. The diligence file should record the enforceable minimum, expected usage and collected cash separately. Contracted annual recurring revenue should be reconciled to executed documents and adjusted for start dates, concessions, credit risk and delivery conditions.
Management reporting should bridge opening contracted value, new bookings, usage, renewals, expansion, contraction, churn, recognised revenue, receivables and cash. The forecast should use the measure that best represents the actual business model and disclose the bridge.
22. Measure concentration and cohort dependence
Concentration should be analysed by customer, sector, geography, channel, model provider, cloud provider, integration and use case. A startup can appear diversified by user count while relying on one enterprise contract, one distribution partner or one technical dependency. Cohort results should show both aggregate and customer-level dispersion.
The analyst should test the effect of losing the largest customer, delaying a renewal, repricing a provider contract or restricting a material data source. Concentration can support efficient early growth when a design partner accelerates learning. It can also create bargaining power, collection and forecast risk.
Concentration should be measured across time. A falling largest-customer share can result from genuine diversification, weaker use by the largest account or rapid low-quality additions. Cohort reporting should therefore show absolute revenue, successful workflows, contribution and contract status. Pipeline concentration also matters when a forecast depends on one procurement decision. The board can set evidence thresholds for when a prospective customer enters the reference case and keep less mature opportunities in an execution case.
Valuation scenarios should avoid treating concentration as a generic discount. The relevant adjustment may enter revenue probability, margin, working capital, capital need, discount rate or comparable-company selection. Double counting should be checked explicitly.
23. Evaluate model and infrastructure dependency
AI startups can combine proprietary software with third-party models, cloud services, accelerators, vector databases, observability tools and data licences. The dependency map should record contract term, price basis, capacity, service level, portability, switching effort, geographic availability, security and termination rights.
The forecast should distinguish technical optimisation from price decline. Model routing, quantisation, caching, smaller models and improved prompts can reduce consumption per successful task. Provider price reductions may lower cost while also reducing a perceived product moat. Capacity commitments can protect supply and create fixed-cost exposure.
An economically useful diligence test recalculates contribution margin under alternative model prices, workload intensity and migration timing. Enterprise value should reflect the startup's demonstrated ability to manage this stack, the legal and operational feasibility of switching, and the capital required to maintain performance.
Technical benchmarks should be run on representative workloads rather than generic public tests. The evidence pack can compare quality, latency, consumption, failure rate and human intervention across approved configurations. Migration plans should identify engineering work, customer validation, data movement, security review and contract consent. A nominally interchangeable provider may require material time and cost. These facts affect the duration and probability of forecast savings.
24. Review data, intellectual property and regulatory constraints
The product-data map should identify provenance, consent, permitted use, retention, localisation, customer ownership, confidential information, generated outputs and improvement rights. Technical evidence should show how access controls, evaluation, incident response and model governance operate. Qualified advisers should assess the actual legal and regulatory position.
The valuation model should translate identified constraints into operational consequences. A restriction may limit a customer segment, require a regional deployment, increase review cost, delay sales or require insurance. It may also create defensible capability when the startup can satisfy requirements that competitors cannot.
The diligence team should distinguish ownership from defensibility. A company may own application code while depending on generally available models and customer data. Defensibility can arise through workflow integration, proprietary evaluation, distribution, trusted implementation, accumulated permitted data or operational learning. Each proposition requires evidence. The forecast should avoid assigning a premium to an asserted moat without observing its effect on win rate, price, retention, task quality or cost.
Governance should be proportionate to the product and use case. The NIST AI Risk Management Framework provides a voluntary structure for governing, mapping, measuring and managing AI risk. A valuation process can use that structure as diligence organisation; it does not replace legal, technical or financial analysis.
25. Forecast by cohort rather than one growth rate
A cohort forecast begins with opening accounts and workloads, then models activation, successful use, conversion, renewal, expansion, contraction and churn. New cohorts should reflect channel capacity, sales cycle, implementation constraints and the evidence available at each maturity. Revenue follows price and billable units; cost follows workload and service design.
The model can maintain separate schedules for enterprise, mid-market, developer and partner-led customers when their economics differ. Enterprise accounts may carry larger contracts, longer procurement, implementation labour and stronger expansion. Developer cohorts may activate rapidly, generate variable consumption and churn more frequently. Combining them can produce an average customer that does not exist. Segment-level forecasts should reconcile to the consolidated income statement, cash flow and capacity plan.
Back-testing improves governance. Each reporting period, actual activation, success, conversion, retention, price, consumption and support should be compared with the prior forecast by cohort. Variance should be attributed to definition change, mix, execution, market conditions or model error. Persistent optimism in one driver should lead to recalibration. A documented back-test gives investors evidence about the reliability of management's operating model as well as the business itself.
The forecast should distinguish observed, contracted and assumed periods. Mature cohorts may support retention and margin assumptions. Recent cohorts may support activation and early use while remaining too young for renewal evidence. A weighted average can conceal the age distribution and should be supplemented by cohort detail.
Forecast granularity should match the decision. Monthly modelling can be appropriate for liquidity, activation and early retention; quarterly or annual views can support longer-term valuation. The underlying cohort identities should remain traceable. Seasonality, procurement calendars, usage resets and annual commitments can create patterns that a straight-line model misses. Foreign currency, indirect taxes, collection timing and reseller deductions should be included when material.
Scenario design should preserve logical relationships. Faster use can raise revenue and inference cost. Better task success can improve retention and lower support. Enterprise growth can lengthen implementation and improve contract value. The model should calculate these interactions rather than change each line independently.
26. Build coherent valuation scenarios
At least three scenarios can help expose the range of plausible outcomes. A reference case should use evidence-weighted assumptions. An execution case can reflect verified operational improvements. A stress case can test slower conversion, lower retention, higher consumption, customer loss, financing delay or provider repricing.
Every scenario should show revenue, contribution margin, operating expense, cash burn, financing requirement and dilution. Assumptions should be internally consistent and dated. The purpose is to communicate uncertainty and decision consequences, not to assign false precision.
Management initiatives should enter a scenario only with an owner, cost, timing and measurable mechanism. A planned model migration may lower cost after engineering and customer validation. A new enterprise tier may improve price and extend sales cycles. A partner channel may accelerate distribution and reduce control over customer data. Recording these dependencies prevents the execution case from becoming a collection of unrelated favourable assumptions.
The board should identify leading indicators that cause a scenario change. Examples include task-success thresholds, renewal cohorts, margin after cloud-credit expiry, enterprise deployment time, support hours per account and signed capacity. This turns valuation into a monitored operating thesis.
27. Apply the market approach carefully
Comparable-company analysis should select businesses with relevant product, customer, revenue, growth, margin, capital intensity and risk characteristics. A broad software multiple can misstate value when an AI startup has material compute cost, professional services, concentrated revenue or infrastructure commitments. Public-company disclosures can provide context without creating a direct match.
The analyst should normalise revenue definitions, fiscal periods, net cash, stock compensation, acquisitions and non-recurring items. Multiples should be observed at the measurement date. Growth and margin can be considered together, while business durability, governance and scale remain material.
Private financing evidence should be interpreted with equal care. A recent round may contain strategic rights, secondary shares, tranches, preferences or investor-specific considerations that are not visible in the headline valuation. Market transactions may occur at different dates and stages. The analyst should document the information available, comparability adjustments and reasons for weight. Unsupported precision in a comparable multiple can conceal greater uncertainty than a transparent range.
For early-stage companies, a forward revenue multiple may dominate discussion because cash flow is distant. The cohort framework tests whether that revenue is likely to recur and what economic margin it can produce. The selected multiple and metric should therefore be connected explicitly.
28. Normalise consumption and subscription comparables
Consumption businesses can report usage-driven revenue, remaining performance obligations, net revenue retention or customer cohorts differently from seat-based subscriptions. Snowflake describes a consumption model under which revenue is recognised as customers use resources. C3 AI reports subscription arrangements that may include usage-based runtime fees. These disclosures illustrate why billing mechanics and revenue recognition require company-specific reading.
Infrastructure-intensive AI businesses can carry long-term capacity commitments and customer concentration. CoreWeave's public filings describe committed contracts, infrastructure investment and concentration considerations. Microsoft reports that investment in AI infrastructure can affect cloud gross margin. These examples support diligence questions; they are not valuation benchmarks for an early-stage application company without adjustment.
Comparable analysis should separate product gross margin, contribution margin and corporate operating margin. The cohort model supplies the startup-specific bridge required to interpret those external reference points.
Net revenue retention requires definition. It can include expansion, exclude new customers, vary by currency treatment and apply to a selected customer population. Remaining performance obligations depend on contract structure and accounting policy. Customer counts can apply thresholds that exclude small users. The analyst should read the source disclosure, retain the original definition and avoid combining differently defined indicators in one synthetic benchmark.
29. Apply an income approach
A discounted cash-flow analysis should model the cash economics supported by the cohort forecast. Revenue, direct cost, operating expense, working capital, capital expenditure, taxes and financing needs should be explicit. Terminal value requires a sustainable growth and margin assumption consistent with competition and reinvestment.
The discount rate should reflect the cash-flow definition, currency, stage, concentration and risk already embedded in the forecast. Adjustments should avoid counting the same uncertainty in both cash flow and discount rate. Early-stage forecasts often produce a wide range; sensitivity is therefore part of the result.
The terminal case deserves particular scrutiny because it can account for a large share of calculated value. The company should demonstrate how revenue growth converges, how contribution margin translates into operating margin, which reinvestment remains necessary and how competition affects price. A terminal multiple should be consistent with the terminal financial profile. An exit assumption tied to today's premium without a path to comparable scale and economics requires a lower evidential weight.
When near-term cash flows are negative, the analysis should include the capital required to reach the forecast. Enterprise value before financing does not automatically accrue to current shareholders. Financing terms and dilution allocate that value.
30. Model capital need and dilution
AI startups can require capital for sales, product development, compute, data, security, customer implementation and working capital. The model should calculate monthly liquidity under each scenario, minimum cash, funding date and proceeds required. A delayed round or lower price can change ownership materially.
The cap table should include issued shares, options, warrants, convertibles, preferences and proposed pool expansion. Security rights should be valued or reflected through an appropriate allocation method. A post-money headline should not substitute for the economic waterfall.
Runway should be tested against operational milestones and transaction duration. A company seeking capital with limited runway may face execution and bargaining risk before a financing closes. The model can test bridge financing, staged spending, revenue acceleration and delayed investment. Each response has consequences for growth, value and ownership. The board should approve a liquidity plan that remains viable if the reference financing date slips.
Funding can also alter operating economics through cloud credits, strategic contracts or capacity commitments. Each benefit should be measured with its expiry, restrictions and contingent obligations. Valuation and financing analysis should be reconciled in one model.
31. Connect the operating model to valuation sensitivity
The most useful sensitivities trace a small number of operating levers through contribution margin, cash flow and value. Task success can influence retention and support. Model consumption can influence direct cost. Renewal and expansion can influence lifetime revenue. Financing timing can influence dilution.
Sensitivity ranges should come from evidence where possible. Observed cohort dispersion, contract outcomes, provider quotes, workload benchmarks and implementation history provide defensible bounds. Wider ranges are appropriate when data is sparse or the product has changed materially. Correlated downside should be tested because lower task quality may simultaneously reduce retention, increase support and delay financing. A one-variable table can supplement, rather than replace, coherent multi-variable scenarios.
Decision thresholds make the analysis actionable. The board can identify the minimum task success, renewal and recurring contribution margin required to support a financing plan. Management can then compare the cost and time of product, pricing and delivery interventions with their effect on runway and value. The output becomes a capital-allocation tool, with valuation serving as a summary of operating evidence rather than an isolated negotiation number.
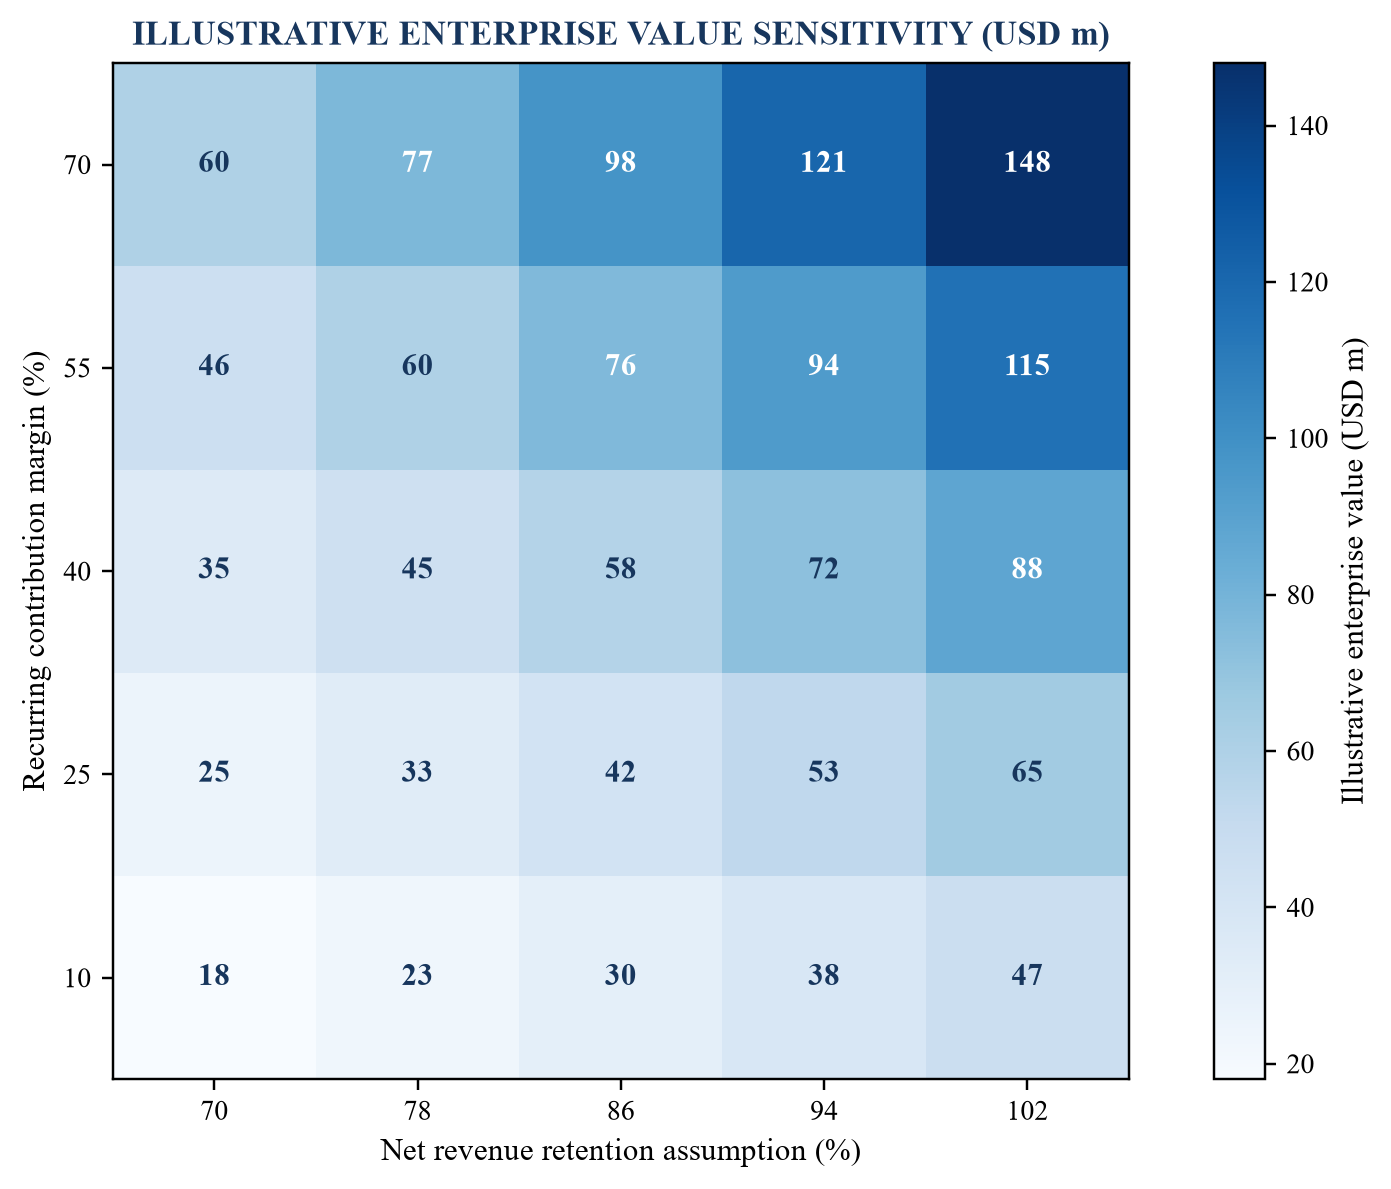
The grid is an illustrative model and does not represent an observed company or investment conclusion.
Table 4. Operating-to-valuation sensitivity map
| Lever | Evidence | Financial path | Valuation effect |
|---|---|---|---|
| task success | evaluated completed workflows | retention, support and price | revenue durability and margin |
| workflow frequency | recurring successful use | billable units and expansion | growth and lifetime value |
| model consumption | tokens, calls, hardware time | direct cost and capacity | contribution margin and capital need |
| human review | hours and escalation rate | service cost and scalability | margin and operating leverage |
| renewal | contract and cohort outcome | recurring revenue and cash | forecast risk and multiple |
| funding date | monthly liquidity forecast | dilution and security terms | current shareholder value |
Each lever should be supported by observed evidence and tested for interaction with other assumptions.
32. Define the hypothetical worked example
Consider a hypothetical enterprise AI workflow company selling annual platform contracts with usage allowances. It has twelve paid customers, three pilots and several free test accounts. The model assumes annual recurring revenue of USD 4.8 million at the measurement date, cash of USD 3.0 million and no debt. These figures are invented solely to demonstrate the framework.
The product handles document-intensive workflows. A successful task requires completion, accuracy above an approved threshold, latency within service expectations and no unresolved material exception. The company uses third-party models and human review for selected cases. The example assumes that cohorts are tracked by contract start quarter.
No conclusion in the worked example applies to an actual company. Customer rights, revenue recognition, tax, regulation, financing terms and valuation inputs require separate professional review.
33. Analyse the hypothetical cohorts
The model assumes that 72 per cent of eligible users activate within 30 days and that 64 per cent of activated users complete a successful task in the same period. Successful-task users show stronger 90-day retention than users measured only by login. Older enterprise cohorts expand, while two recent pilot cohorts remain immature.
The analysis treats registered users as a contextual metric. Paid-account renewal, recurring successful workflows and collected revenue carry greater weight. A large free cohort contributes product learning and direct cost without contractual revenue; its strategic value remains scenario-dependent.
The diligence conclusion would request direct reconciliation of event logs, evaluation records, contracts, invoices and the general ledger. The assumed pattern supports a framework demonstration, not evidence of a particular startup's performance.
34. Build the hypothetical margin waterfall
The example assumes USD 4.8 million recurring revenue, less USD 0.72 million of model and cloud consumption, USD 0.24 million of data and tooling, USD 0.48 million of implementation and support labour, USD 0.18 million of human review and USD 0.12 million of service credits and other direct costs. Recurring contribution margin is therefore assumed at USD 3.06 million, or 63.8 per cent.
The calculation includes economic labour cost and excludes promotional cloud credits from sustainable margin. A sensitivity raises model consumption by 50 per cent and lowers contribution margin to 56.3 per cent, before any retention effect. A second sensitivity assumes workflow optimisation and lower review effort, raising margin to 69.2 per cent.
The actual accounting gross margin may differ. The valuation model uses the defined recurring contribution measure because it aims to compare scalable recurring economics across cohorts.
35. Compare hypothetical scenarios
The stress case assumes slower activation, 74 per cent gross revenue retention, limited expansion and higher model cost. It requires a financing round within nine months. The reference case assumes stable task success, 86 per cent gross retention, measured expansion and gradual cost optimisation. The execution case assumes validated workflow improvements, 94 per cent gross retention and stronger margin.
The cases produce different revenue, cash burn, capital requirements and value ranges. The result should be presented as a matrix rather than a single point. Probability weighting may aid planning, while the individual scenarios should remain visible.
Table 5. Hypothetical scenario summary
| Metric | Stress | Reference | Execution |
|---|---|---|---|
| year-three revenue, USD m | 8.2 | 13.6 | 19.4 |
| recurring contribution margin | 38% | 57% | 68% |
| additional capital required, USD m | 8.0 | 5.0 | 3.0 |
| illustrative enterprise-value range, USD m | 22–34 | 48–72 | 82–118 |
| principal trigger | weak renewal | evidence-weighted delivery | verified expansion and efficiency |
All figures are invented for framework demonstration; values are enterprise-value indications before security allocation.
36. Evaluate financing terms and value allocation
An equity round can include liquidation preference, participation, anti-dilution, information rights, board rights, option-pool changes and milestone tranches. The economic value of each security can differ from the stated share price. Scenario proceeds should flow through the actual or proposed waterfall.
Convertible instruments add valuation caps, discounts, interest, maturity and seniority. Venture debt adds cash runway and fixed obligations, covenants, warrants and refinancing risk. The decision should compare ownership and downside under coherent operating scenarios.
The cohort analysis strengthens the financing discussion by showing which operational milestones can reduce uncertainty. A round sized to reach verified renewal and contribution-margin evidence may create a more defensible next financing point than a round tied only to user growth.
37. Triangulate the conclusion
The final range should reconcile market evidence, income value, recent financing, security rights and the operating evidence. Each method should use consistent definitions of debt, cash, dilution and measurement date. Differences between methods are diagnostic.
A market approach may place greater weight on near-term revenue and growth. An income approach may place greater weight on margin, capital need and terminal economics. Cohort evidence helps determine which forecast inputs and comparable characteristics deserve weight.
The conclusion should state the range, methods, key assumptions, evidence date, sensitivities, limitations and required professional reviews. A valuation committee should be able to reproduce the bridge from product event to security value.
38. Assemble an investment-committee evidence pack
The pack should include definitions, data lineage, cohort tables, task evaluations, revenue reconciliation, cost allocation, contracts, concentration, dependency map, forecast, cap table, financing terms and valuation output. Owners should sign off the data they control. Exceptions should remain visible.
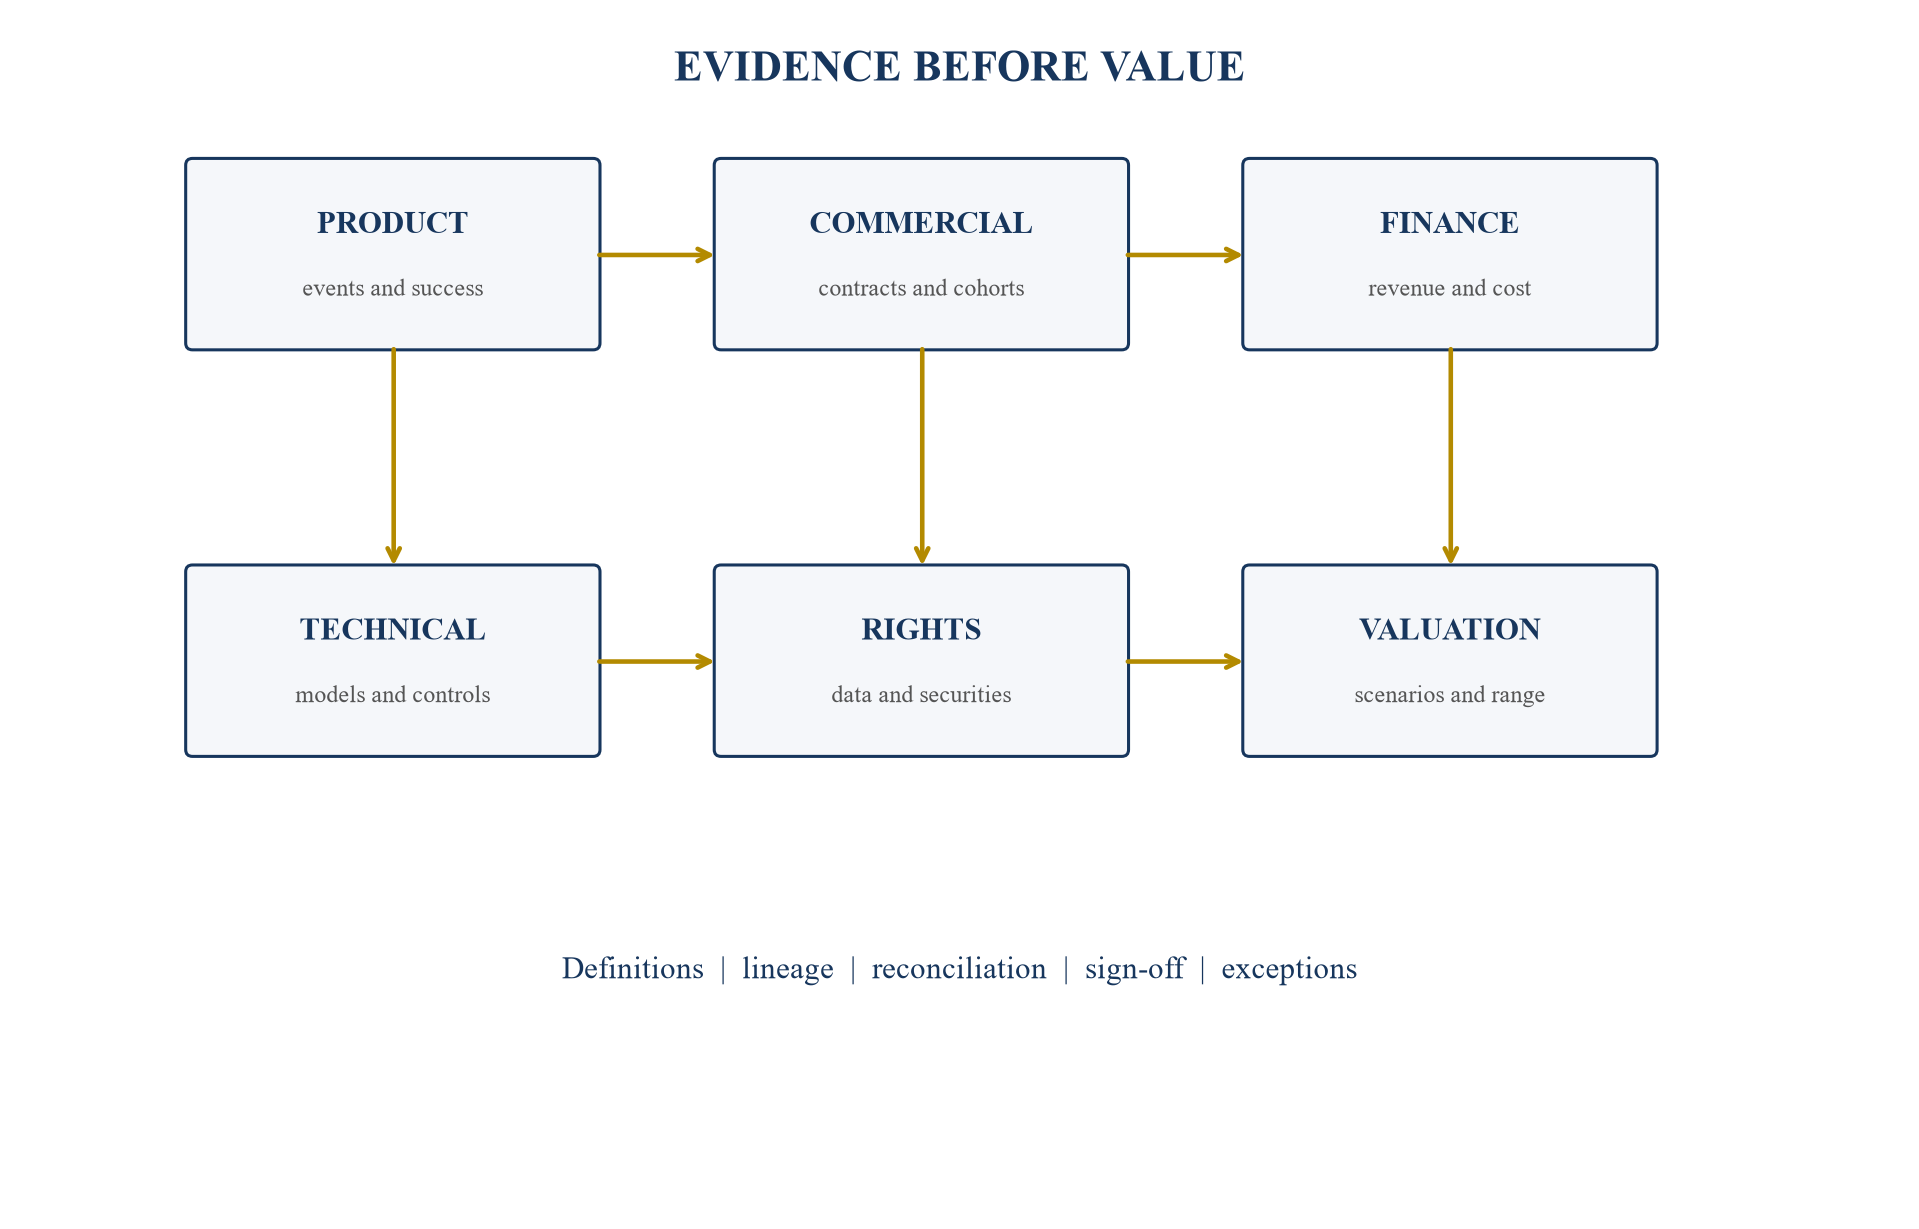
The architecture joins product, commercial, financial, technical and legal evidence before valuation approval.
39. Use a 90-day valuation-readiness plan
During days 1–30, management should approve metric definitions, reconcile product events to accounts and contracts, map direct costs, establish cohort baselines and identify data gaps. The objective is a controlled evidence perimeter.
During days 31–60, teams should test task success, retention, expansion, model routing, human review and support effort. Finance should reconcile recognised revenue, billings, cash and recurring contribution margin. Legal and technical specialists should review material rights and dependencies within their remit.
During days 61–90, management should build evidence-weighted scenarios, calculate capital need, review financing terms, select comparables, run valuation sensitivities and assemble the committee pack. The deliverable is a decision-ready range with an explicit operating thesis and monitored triggers.
40. Conclusion
AI startup valuation becomes more defensible when product activity is connected to successful customer outcomes, recurring use, paid contracts, economic cost and cash. Usage counts remain useful; their meaning depends on cohort, maturity, quality and monetisation.
The usage-to-margin framework provides that connection. It starts with definitions and data lineage, measures workflow success, allocates model and service cost, forecasts by cohort, preserves capital need and dilution, and triangulates market and income evidence. The result is a valuation range whose assumptions can be tested by boards, investors and transaction teams.
The framework also creates an operating agenda. Improving activation without task success, growth without retention, or revenue without recurring contribution margin may leave value fragile. Evidence-led improvements in workflow quality, repeat use, cost control and contract durability can support both financing execution and sustainable enterprise value.
References
- IFRS Foundation, IFRS 13 Fair Value Measurement, standard overview and supporting materials, https://www.ifrs.org/issued-standards/list-of-standards/ifrs-13-fair-value-measurement/
- IFRS Foundation, IFRS 13 educational material on measuring unquoted equity instruments, https://www.ifrs.org/content/dam/ifrs/supporting-implementation/ifrs-13/education-ifrs-13-eng.pdf
- IFRS Foundation, IFRS 15 Revenue from Contracts with Customers, https://www.ifrs.org/issued-standards/list-of-standards/ifrs-15-revenue-from-contracts-with-customers/
- IFRS Foundation, IAS 36 Impairment of Assets, https://www.ifrs.org/issued-standards/list-of-standards/ias-36-impairment-of-assets/
- International Valuation Standards Council, International Valuation Standards, https://www.ivsc.org/standards/
- National Institute of Standards and Technology, Artificial Intelligence Risk Management Framework, https://www.nist.gov/itl/ai-risk-management-framework
- National Institute of Standards and Technology, AI RMF 1.0, https://nvlpubs.nist.gov/nistpubs/ai/NIST.AI.100-1.pdf
- U.S. Securities and Exchange Commission, AI Roundtable remarks, 27 March 2025, https://www.sec.gov/newsroom/speeches-statements/crenshaw-remarks-ai-roundtable-032725
- Snowflake Inc., Annual Report on Form 10-K for fiscal 2026, https://www.sec.gov/edgar/browse/?CIK=1640147&owner=exclude
- Snowflake Inc., fiscal 2026 results and investor materials, https://investors.snowflake.com/
- C3.ai Inc., Annual Report on Form 10-K for fiscal 2026, https://www.sec.gov/edgar/browse/?CIK=1577526&owner=exclude
- C3.ai Inc., investor relations financial information, https://ir.c3.ai/
- CoreWeave Inc., Annual Report on Form 10-K for 2025, https://www.sec.gov/edgar/browse/?CIK=1769628&owner=exclude
- CoreWeave Inc., investor relations financial information, https://investors.coreweave.com/
- Microsoft Corporation, Annual Report on Form 10-K for fiscal 2026, https://www.sec.gov/edgar/browse/?CIK=789019&owner=exclude
- Microsoft Corporation, annual reports, https://www.microsoft.com/en-us/Investor/annual-reports.aspx
- Amplitude Inc., Annual Report on Form 10-K for 2025, https://www.sec.gov/edgar/browse/?CIK=1866692&owner=exclude
- Amplitude Inc., investor relations financial information, https://investors.amplitude.com/
- NVIDIA Corporation, Annual Report on Form 10-K for fiscal 2026, https://www.sec.gov/edgar/browse/?CIK=1045810&owner=exclude
- NVIDIA Corporation, financial reports, https://investor.nvidia.com/financial-info/financial-reports-and-sec-filings/default.aspx
- Financial Accounting Standards Board, Accounting Standards Codification Topic 606 overview, https://asc.fasb.org/topic&trid=2129938
- U.S. Securities and Exchange Commission, EDGAR company filings database, https://www.sec.gov/edgar/search/
- Bank for International Settlements, AI and finance publications, https://www.bis.org/topic/artificial_intelligence.htm
- Organisation for Economic Co-operation and Development, OECD AI Principles, https://oecd.ai/en/ai-principles
- European Commission, regulatory framework for artificial intelligence, https://digital-strategy.ec.europa.eu/en/policies/regulatory-framework-ai
- International Organization for Standardization, ISO/IEC 42001 artificial intelligence management systems, https://www.iso.org/standard/81230.html
