

1. Define the equity decision
The work should begin with the decision facing the board. A primary equity raise, strategic investment, secondary sale or acquisition requires an explicit amount, use of proceeds, runway, valuation range, operating milestone and decision date. The model-governance review should serve that decision rather than become a detached technical exercise.
The central equity question is whether the lender can originate and manage profitable credit at larger scale without losing control of selection, pricing, losses, customers, liquidity or compliance. The investment case should show which model capabilities are deployed, independently validated and reflected in realised cash outcomes. Roadmap capabilities should be separately costed, timed and risk-adjusted. The transaction model should include the funding needed to season new cohorts before their economics can be observed.
2. Establish the legal and economic perimeter
The perimeter should identify the lender, originator, servicer, broker, platform, funding vehicle and data processor for each product and geography. It should show which entity owns the receivable, bears credit risk, controls underwriting, collects cash and holds the relevant licence. Intercompany and off-balance-sheet arrangements require explicit mapping.
Equity value depends on where economics and obligations reside. A platform that earns an origination fee without retaining loans differs from a lender that funds assets and absorbs expected and unexpected loss. First-loss commitments, guarantees, repurchase obligations, warehouse covenants and risk-sharing terms can return exposure to an apparently asset-light business. Contracts, accounting and actual conduct should be reconciled before the operating model is valued.
3. Build the source-controlled evidence ledger
The evidence base should include product terms, applications, bureau and alternative data, decision records, model versions, score outputs, overrides, offers, accepted loans, disbursements, schedules, payments, delinquencies, modifications, defaults, recoveries, complaints, funding and ledger records. Every observation should retain a stable customer, facility and event identifier.
Table 1. Lending evidence ledger
| Field | Primary evidence | Control question |
|---|---|---|
| applicant and facility | application, identity and contract | can the decision be reproduced? |
| model input and output | versioned feature and score record | were data available at decision time? |
| offer and acceptance | pricing and customer election | which applicants self-selected? |
| performance | payment, delinquency and default ledger | have outcomes matured consistently? |
| recovery | collections and cash records | are timing and cost included? |
| funding and loss | facility, reserve and ledger | who bears cash and credit exposure? |
Evidence requirements should be adapted to the product, legal entity, accounting framework and regulatory perimeter.
Derived data should retain its calculation, source timestamp, owner and quality status. Manual corrections and missing outcomes should remain visible. A dashboard extract without record-level lineage is insufficient for transaction diligence because population changes and outcome exclusions can materially alter apparent model performance.
The ledger should support two-way reconciliation. Starting from the general ledger, reviewers should trace revenue, receivables, provisions and write-offs into facilities and cohorts. Starting from the facility population, they should rebuild contractual cash, payment status, default and recovery into accounting totals. Differences caused by cut-off, currency, status mapping or system migration should be quantified and resolved. This controlled population becomes the common denominator for model validation, unit economics, funding compliance and investor reporting. Without it, different teams may present internally consistent results based on different loan universes.
4. Map the lending economics
The operating map should connect applications, approvals, acceptance, disbursement, receivable, interest and fee income, funding cost, fraud, expected credit loss, servicing, collections, compliance, capital and cash. Each step should identify the entity, system, owner and accounting treatment.
This map prevents approval growth from being treated as value before the consequences are observed. A higher approval rate can increase originations and revenue while producing worse loss, liquidity and collection workload. Conversely, a model may improve risk-adjusted contribution by declining weak loans even when headline volume slows. Investors should see the complete bridge rather than one performance statistic.
The map should also distinguish asset ownership and service economics over time. An originated loan may be retained, sold, participated, securitised or transferred under a forward-flow arrangement. Fee recognition, recourse, servicing obligations and residual risk can change at each step. The company should calculate economics from the perspective of both the operating company and any funding vehicle. Consolidated value can otherwise be overstated by counting an origination fee while ignoring the first-loss capital or repurchase exposure that supports it.
5. Govern data provenance
Data provenance answers where an input originated, when it was observed, why it may be used, how it was transformed and whether it remains available in production. Sources may include customer submissions, bureaus, bank transactions, device signals, invoices, open banking and internal repayment history. Legal and consent requirements are fact-specific.
The training dataset should distinguish raw fields, derived features and labels. Point-in-time controls are critical: information created after the underwriting decision must not leak into training features. Vendor data should retain version, coverage, refresh and contractual rights. Provenance limitations should flow into validation, model-use conditions and the valuation case because a model cannot scale reliably on data that is unstable, unavailable or unlawful to use.
Feature lineage should be reproducible from production code rather than reconstructed after the event. Transformations should define units, missing-value treatment, outliers, aggregation windows and time zones. When a bank-transaction feature uses the prior ninety days, the system should demonstrate that only data available before decision time entered the calculation. Data corrections should create a new version and preserve the original decision record. The review should compare development and production feature distributions, including the proportion supplied by each vendor, so dependencies and silent schema changes are visible.
6. Define the observation window
Credit outcomes mature over time. The performance window should match product tenor, payment frequency, cure behaviour and loss emergence. A three-month observation may be suitable for an early delinquency indicator and inadequate for lifetime default or recovery. Recent cohorts should not be compared with seasoned cohorts without adjustment.
The model should record application date, decision date, disbursement, scheduled payments, delinquency milestones, default, cure, modification, write-off and recovery. Reporting should state the proportion of each cohort that has reached the relevant maturity. Equity forecasts should include uncertainty for unseasoned balances and should avoid treating early repayment performance as a complete loss conclusion.
Outcome lag should be translated into an evidence ladder. Application fraud and first-payment default may emerge quickly; twelve-month default, lifetime loss and recovery require longer observation. Each metric should therefore state its maturity horizon and percentage of exposure observed. When a company changes underwriting rapidly, the evidence for recent growth may be limited to leading indicators. Investors should see how those indicators historically predicted mature outcomes and the range of error. The funding plan should allow enough liquidity to observe the next cohort before assuming its economics can support further acceleration.
7. Specify the target and decision use
A model needs a precise target: probability of default, first-payment default, fraud, loss, affordability, prepayment or another outcome. The target should state horizon, event definition, cure, modification, exposure and exclusions. Its relationship to the actual credit decision should be documented.
One score may support ranking, while policies determine approval, limit and price. Diligence should distinguish model prediction from business rules, manual review and funding constraints. If the model is trained on one target and marketed as another, the economic claim requires challenge. The board should approve intended use, prohibited use and performance limits before model output is included in an equity story.
Target construction should address ambiguity. A borrower may miss payments because of operational error, enter hardship, refinance, cure or default after the observation window. Excluding modified or sold loans can improve apparent performance while removing economically relevant outcomes. The target-development paper should show inclusion, exclusion and sensitivity to alternative definitions. Where loss severity matters, a binary default target may be complemented by exposure and recovery models. The combined decision objective should remain understandable to credit, finance and governance teams.
8. Construct the data-to-loss chain
The data-to-loss chain links information available at application to model output, credit policy, customer acceptance, servicing and realised cash loss. It shows where economic outcomes can diverge from predictive performance. Each transition should retain owner, evidence and exception handling.
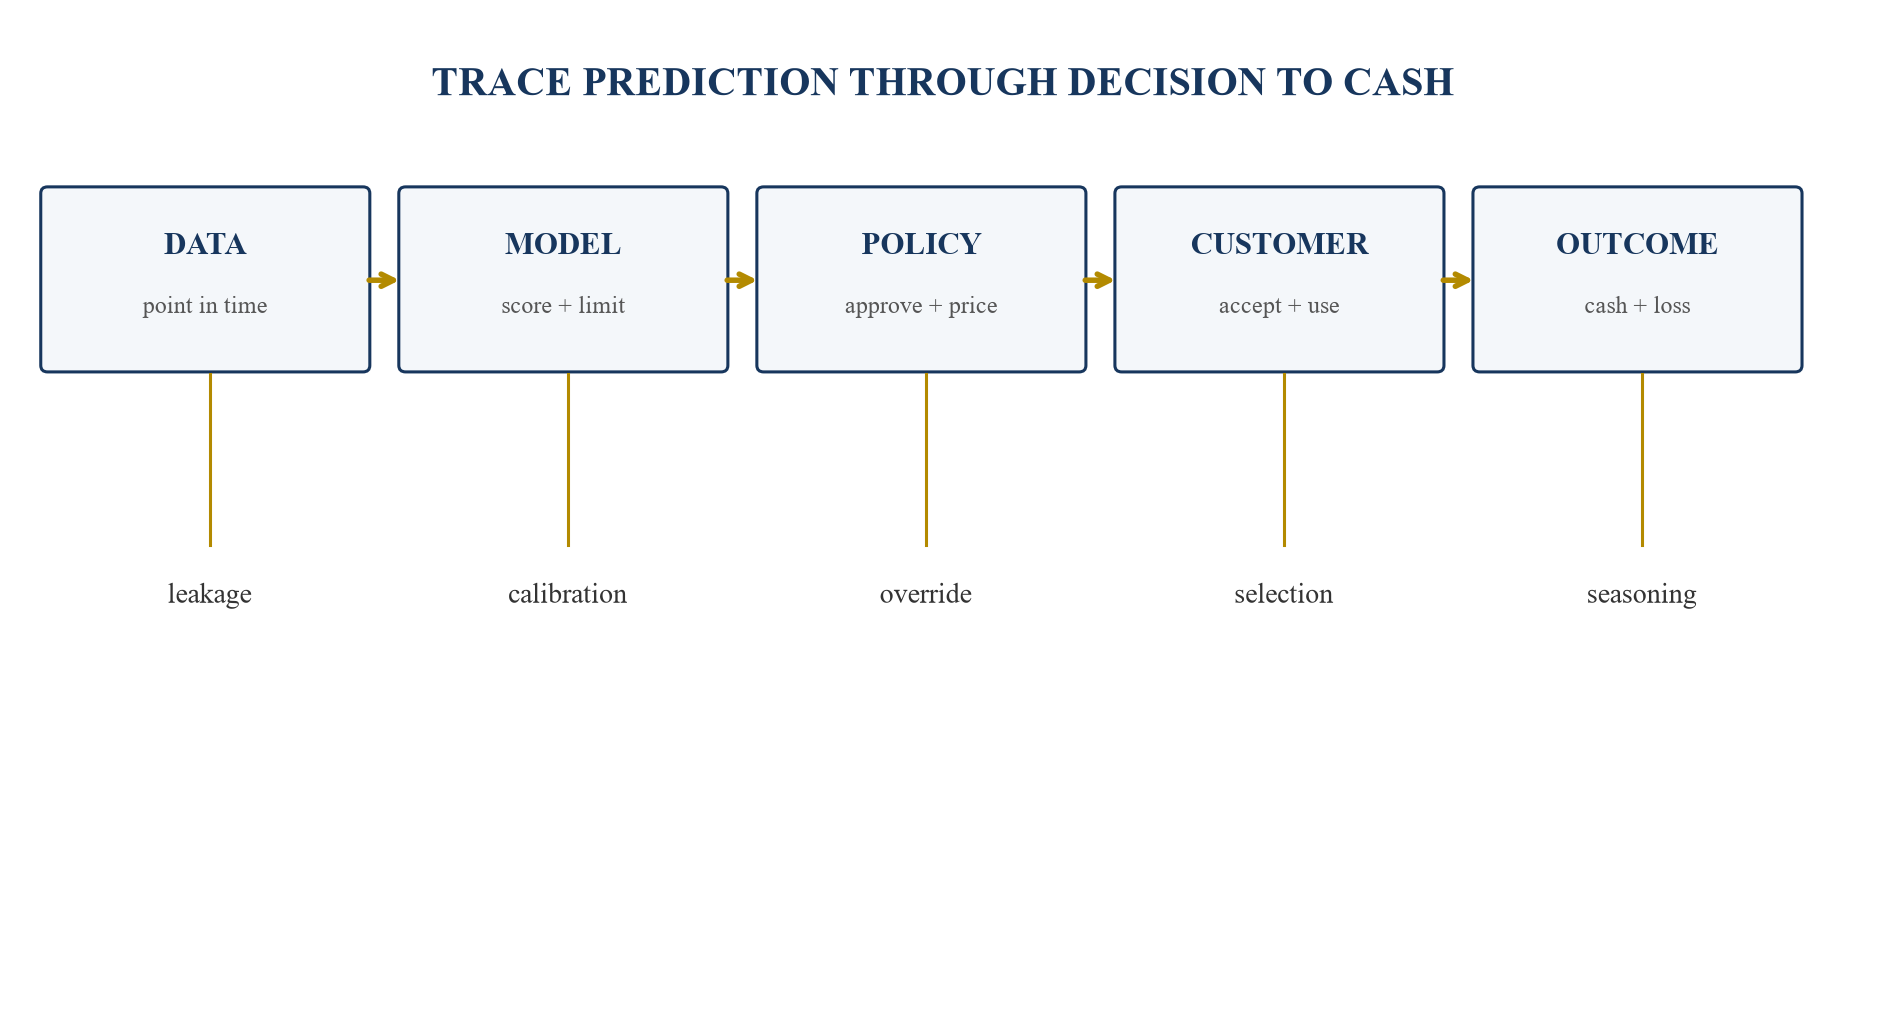
The chain should be populated with company-specific data, decisions and realised outcomes.
The chain should reconcile counts and values at every stage. Missing joins between score and facility performance should be quantified. A model benefit claim should fail the transaction gate when the chain cannot reproduce the reported population and cash outcome.
Reconciliation should identify attrition between stages. Applications can disappear through duplicate removal, incomplete identity checks, policy declines, expired offers and funding failures. A company may calculate model lift on scored applications while presenting loss on funded loans, producing inconsistent denominators. The chain should retain a waterfall of population and exposure at each transition, with reasons for exclusion. It should also identify which stages changed during the comparison period. This enables investors to separate model effect from policy, operations, funding and customer-choice effects.
9. Define the development population
The development population should represent the intended borrowers, products, channels, geographies and economic conditions. Exclusions should be documented and justified. Rejects create a particular challenge because their repayment outcome is generally unobserved; assumptions about them can create selection bias.
Training, validation and test samples should preserve time ordering where conditions change. Random splits can leak repeat borrowers or related facilities across samples. The review should test customer-level separation, temporal holdout and performance on recent production data. External datasets may expand coverage but require evidence of comparability, rights and point-in-time integrity.
Population analysis should compare development, validation, application, approved and booked distributions. The company should show coverage by score, income, tenure, industry, geography and acquisition channel, subject to lawful data use. Thin or absent segments should have explicit exposure limits until evidence develops. Repeat borrowers require a decision on whether the unit is customer, facility or event. Related applicants and merchants can create hidden dependence between observations. Sample weighting and reject inference assumptions should be documented and sensitivity-tested rather than embedded invisibly.
10. Measure approval and adverse selection
Approval rate should be measured by score band, policy rule, channel, product, geography and customer segment. Acceptance rate should then show which approved borrowers take the offered price and limit. Better risks may decline expensive offers, leaving the booked portfolio weaker than the approved population.
The analysis should compare applications, approvals, offers, accepted loans and funded balances. Pricing experiments and policy changes should be recorded. Adverse selection can appear through worsening default at a given score or through take-up concentrated among high-risk borrowers. The equity model should use booked and funded economics rather than assume the approved population converts uniformly.
Elasticity should be tested where sufficient controlled evidence exists. A price change can alter take-up, prepayment, repeat use and risk mix. Raising price to cover expected loss may cause lower-risk applicants to leave and can worsen realised margin. Similarly, increasing limits can attract stronger customers or increase exposure among vulnerable ones. The operating model should compare offer cells using consistent eligibility and should include customer-outcome constraints. Management estimates should be labelled when experiments are incomplete or selection prevents causal interpretation.
11. Measure predictive lift
Discrimination metrics assess whether a model ranks risk; calibration assesses whether predicted probabilities match realised outcomes. Common statistics can include area under the receiver operating characteristic curve, Gini, precision, recall and lift by score band. Metric selection should follow model purpose and base rates.
Lift should be evaluated against a credible benchmark such as the prior model or approved policy. Development-sample improvement is weak evidence without out-of-time and production results. Statistical uncertainty, sample size and missing outcomes should be disclosed. A small lift may create substantial value at scale, while impressive lift can create little cash value if pricing, acceptance, funding or collections fail.
Metric choice should be tied to the operating decision. Ranking metrics may support review prioritisation; calibration supports pricing and expected loss; precision at a fixed approval rate can support a specific policy trade-off. Performance should be shown across the range in which decisions occur rather than only as a global average. Confidence intervals and bootstrap or other suitable uncertainty analysis can prevent small samples from appearing precise. The review should also test a simple benchmark. Complexity creates value only when it improves out-of-time outcomes enough to cover governance and operating cost.
12. Build the lift-versus-loss matrix
The matrix should connect ranking improvement with realised net loss and approval. It should show whether a model improves separation, changes the approved mix and produces better seasoned cash outcomes. Results should be segmented so aggregate improvement does not conceal a weak product or customer group.
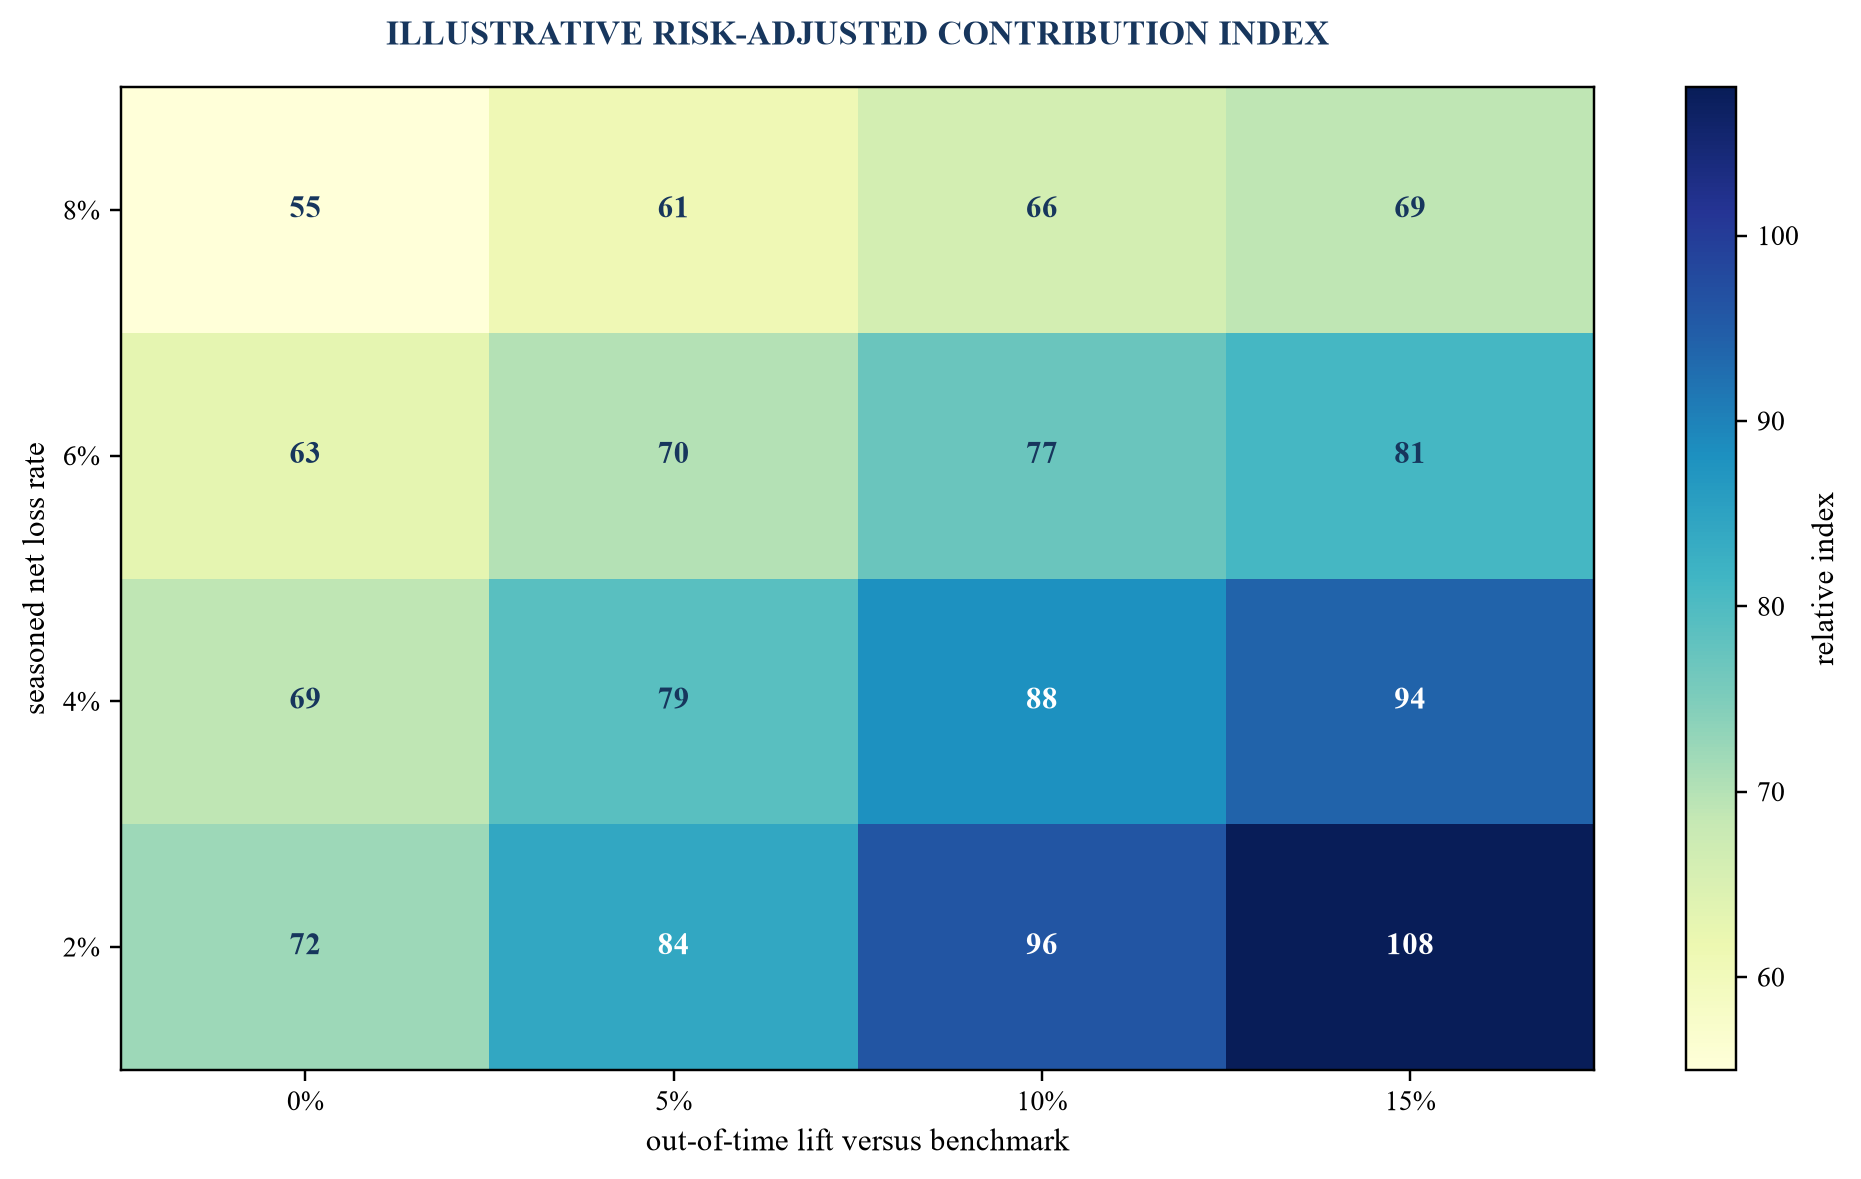
Values are illustrative and do not represent a company, market benchmark or investment conclusion.
The model should avoid attributing all improvement to AI when credit conditions, policy, funding and customer mix changed concurrently. A controlled champion-challenger or phased deployment can provide stronger evidence, subject to customer and risk safeguards.
The matrix can be expanded into four decision quadrants. Higher lift with lower seasoned loss supports further controlled scaling; higher lift with unchanged loss requires investigation of approval, price and selection; lower lift with lower loss may reflect tighter policy; and higher loss with any lift requires remediation. Each cell should show exposure, maturity and uncertainty. A model can appear favourable in counts and adverse in value when a small number of large defaults dominates loss. Counts, balances and cash should therefore be considered together.
13. Test calibration
Calibration compares predicted and observed risk. The review should examine predicted probability against realised default or loss by score band, time, product and segment. A model can rank borrowers well and systematically understate or overstate absolute risk.
Pricing, limits, expected loss and capital may depend on calibrated probabilities. Calibration should therefore be tested on the booked portfolio and under recent conditions. Overlays and recalibrations need approval, effective dates and outcome monitoring. Forecasts should not assume a historic calibration remains valid after rapid product, data, geography or macroeconomic change.
Calibration plots should show both predicted probability and observed outcome with exposure and confidence. Portfolio-level agreement can conceal underprediction in one segment and overprediction in another. Back-testing should respect outcome maturity and should not mix different default definitions. When models feed accounting or capital processes, mapping and conservatism should be separately governed. A temporary overlay can address uncertainty while data develops, but repeated overlays may indicate the model or its usage needs redesign. The valuation model should include the cost and growth constraint created by persistent uncertainty.
14. Connect score to pricing and limit
The decision engine should show how score, affordability, exposure, policy and customer terms determine approval, limit, tenor, price and collateral. Every major rule should have an owner, rationale, version and testing evidence. The effect of promotions and partner subsidies should be separate.
Risk-based pricing should cover funding cost, expected loss, servicing, collections, compliance, capital and target return within legal and customer-outcome constraints. A higher nominal yield can accompany worse selection and lower recovery. Diligence should compare offered, accepted and realised annualised economics after arrears, waivers and modification.
Pricing governance should identify which components respond to score and which are fixed by product or regulation. The model should distinguish nominal interest, effective yield, fees, promotional discounts, late charges and expected waiver. Affordability and suitability controls should remain independent of the return target. The forecast should test whether price changes alter customer behaviour and collections workload. Where partners fund incentives or loss protection, the contract term and renewal risk should be visible rather than treated as permanent economics.
15. Build cohort vintages
Cohort vintages should group facilities by origination month or quarter and track balance, delinquency, default, write-off, recovery, income and cash over months on book. Product, score, channel, geography and policy version should remain available for segmentation.
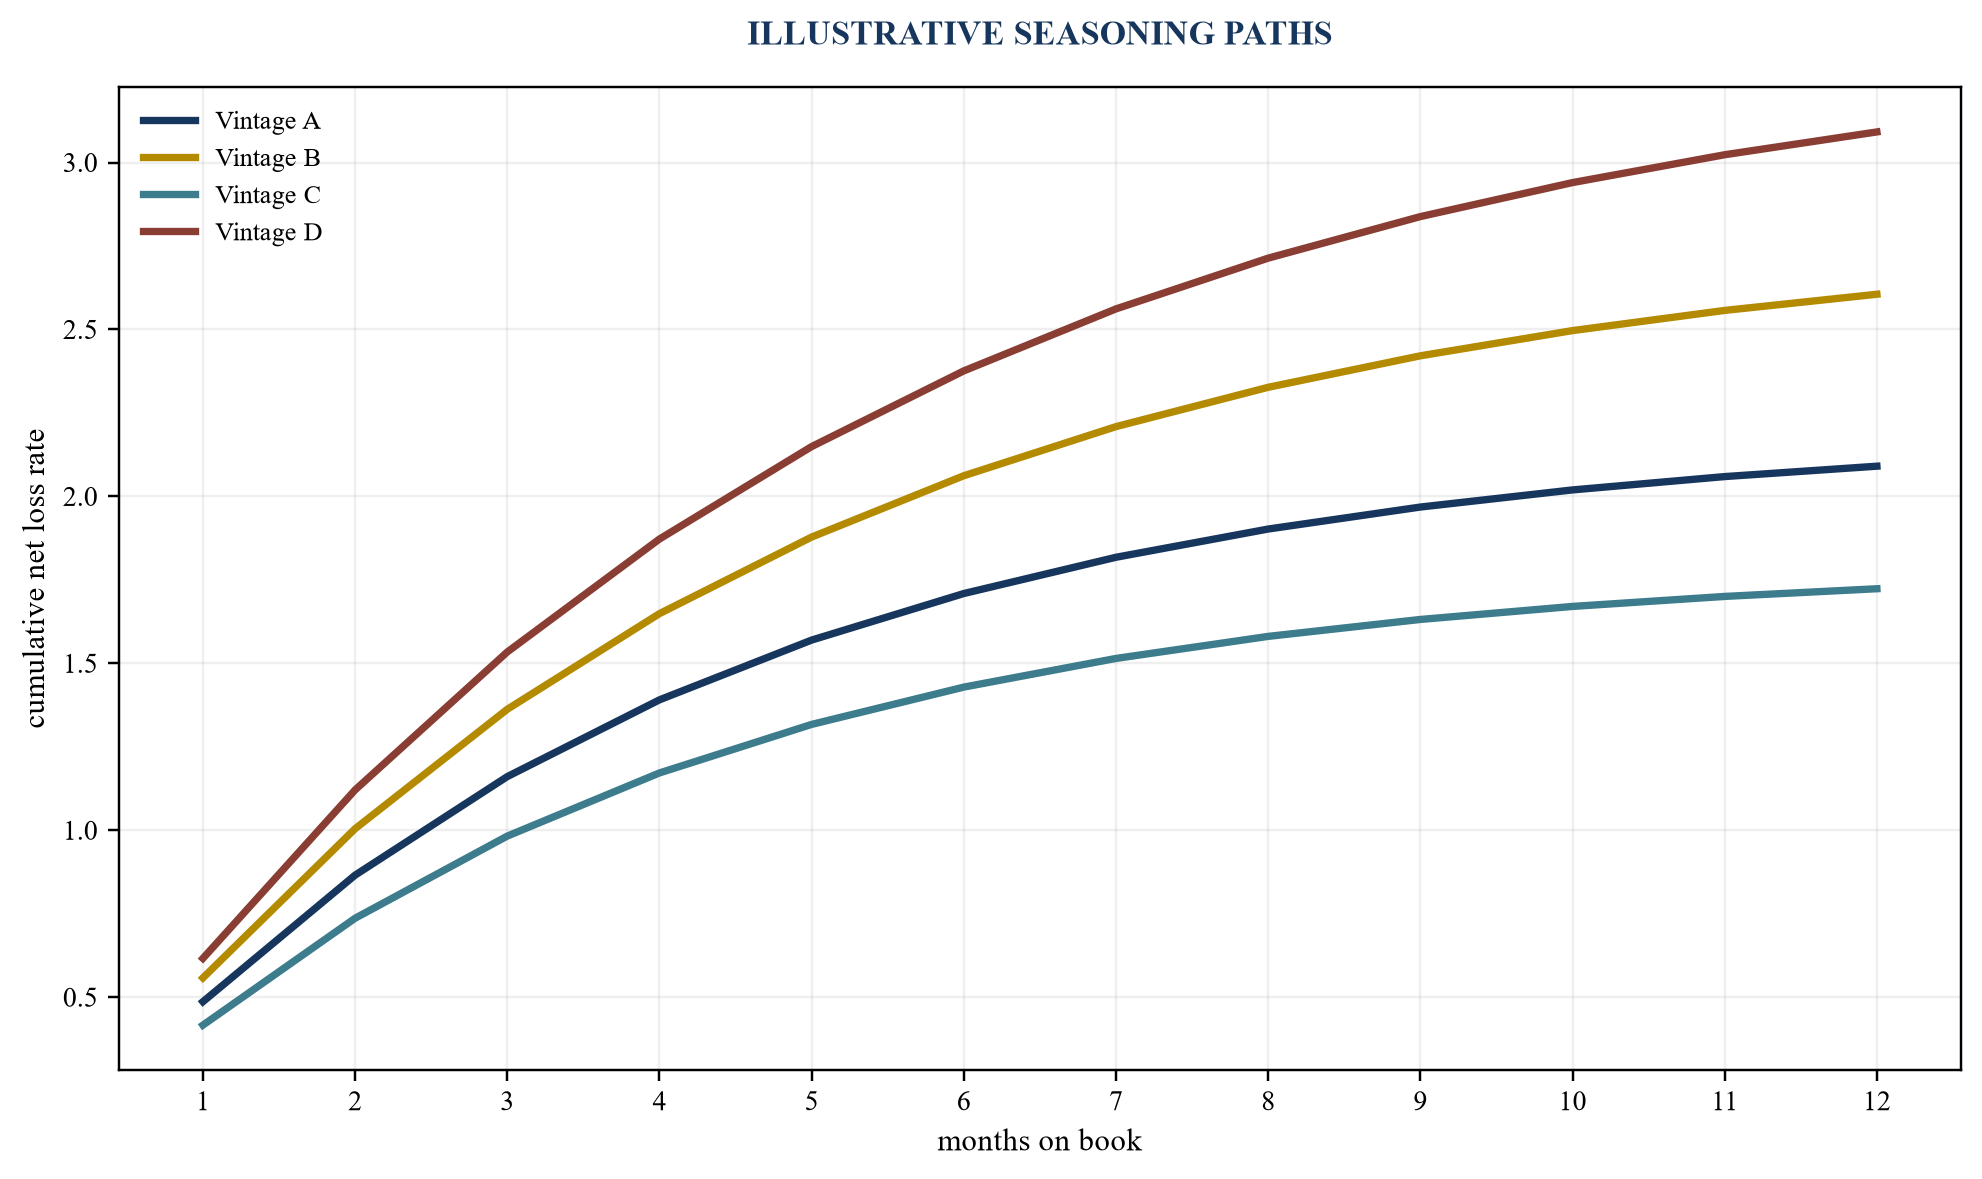
Values are illustrative; company conclusions require complete and seasoned facility-level evidence.
Vintage curves expose deterioration hidden by aggregate growth. New originations can reduce the reported portfolio loss rate because they have not seasoned. The transaction model should compare cohorts at the same months on book and should state uncertainty for incomplete periods.
Vintage reporting should include cumulative gross loss, net loss, cash yield, prepayment, modification and contribution. A cohort with low default may still underperform because it prepays before acquisition cost is recovered or requires intensive servicing. Policy version and model version should allow a precise comparison around changes. Exposure-weighted and facility-count views should both be retained. Cohort performance should reconcile to the current balance sheet after sales, write-offs and recoveries so the historical evidence does not lose facilities when their accounting status changes.
16. Analyse delinquency and cure
Delinquency should use stable definitions for days past due, technical arrears, hardship, modification and cure. Roll-rate analysis follows balances from current through arrears, default, cure and write-off. Both facility counts and exposure values should be retained.
Collections policy can change observed outcomes. A more aggressive contact strategy may improve cure and increase complaints or cost. Payment holidays and restructures can delay default recognition. The diligence review should reconcile contractual schedules, cash receipts, status transitions and accounting classification. Early delinquency can support monitoring, while lifetime economics still require mature loss and recovery evidence.
Roll-rate matrices should be produced for comparable cohorts and stable definitions. Cure should require sustained performance rather than a single payment if that reflects the product’s economics. Broken payment arrangements and repeated modifications should remain visible. The analysis should identify whether AI prioritisation changes contact allocation and whether measured benefit survives staffing, seasonality and borrower mix. Collection strategies should be assessed for lawful and fair customer outcomes. The cost of escalation, field work, litigation and specialist agents belongs in net recovery and unit economics.
17. Measure recoveries and loss given default
Recovery analysis should include timing, amount, cost, channel and legal or collateral pathway. Gross recovery can overstate value when collection fees, litigation, repossession, sale discounts and long delays are excluded. Net present cash is the relevant economic measure.
Loss given default should be segmented by product, collateral, seniority, geography, cohort and default state. A model may improve default incidence while booked loans become less recoverable. Equity forecasts should include recovery capacity and cost at the larger portfolio size. Data should preserve recoveries after write-off so historic cohorts are not truncated.
Recovery timing matters because warehouse facilities and operating cash may require repayment before collection concludes. The model should discount future cash and should distinguish contractual claim from expected collection. Collateral values need valuation date, condition, legal enforceability and disposal cost. Third-party collection promises should be reconciled to remittances. If a forward-flow buyer bears recovery risk, the pricing and recourse terms should show how that benefit is shared or returned to the platform.
18. Model exposure at default
For revolving or limit-based products, exposure can grow between decision and default. The model should track approved limit, drawn balance, future utilisation, fees, accrued interest and credit conversion. Policy changes that raise limits may increase loss even when probability of default is unchanged.
Exposure at default should connect to funding need and concentration. A borrower-level view should aggregate related facilities and guarantees where relevant. Undrawn commitments and settlement obligations may consume liquidity under stress. The transaction forecast should reconcile facility limits, expected utilisation, funding availability and covenant headroom.
Limit management should respond to new information under controlled policy. Automatic increases based on usage can create rapid exposure before adverse performance appears. Reductions can affect customers and may require notice or explanation. The model should test utilisation by score band, cohort and macro condition, including drawdown before stress. Fraud and credit exposure should remain distinct where controls and recoveries differ. Scenario analysis should include correlated utilisation and default, since stressed customers may draw more as their repayment capacity weakens.
19. Reconcile expected credit loss
IFRS 9 expected credit losses use probability-weighted cash shortfalls, time value of money and reasonable and supportable information, subject to the standard and professional judgement. The lending FinTech should reconcile underwriting models with accounting models without assuming they have identical purpose or calibration.
Stage allocation, significant increase in credit risk, probability of default, loss given default, exposure at default, scenarios and management overlays should be documented and governed. Historical information remains an anchor while current and forward-looking conditions may require adjustment. Qualified accountants and auditors should determine the applicable treatment. The equity model should bridge reported provisions to economic loss and cash.
The reconciliation should explain differences between underwriting loss, accounting expected credit loss, regulatory provision and transaction-case economic loss. They may use different horizons, definitions, scenarios and conservatism. Investors should not combine them or select the lowest result. Management overlays should have rationale, evidence, approval, allocation and release criteria. Changes in stage distribution can provide an early warning even before write-off. The forecast should link provision, income recognition, capital and funding consequences consistently across the financial statements.
20. Build risk-adjusted unit economics
Unit economics should begin with contractual yield and fees, then deduct funding cost, expected loss, fraud, servicing, collections, payment processing, compliance, data, model, customer support and directly attributable acquisition cost. Timing should be reflected through cash flows and duration.
Table 2. Risk-adjusted lending economics
| Bridge item | Analytical question | Evidence |
|---|---|---|
| yield and fees | what cash is contractually and actually collected? | contract, schedule and receipt |
| funding | what facility and capital cost supports the asset? | lender statement and allocation |
| credit and fraud | what loss remains after recoveries? | cohort and incident ledger |
| servicing and collections | what workload follows each facility? | cases, capacity and payroll |
| data and model | what production cost scales with decisions? | usage and vendor invoice |
| acquisition | what cost creates a funded retained borrower? | channel and cohort match |
Classification and allocation should reconcile to company accounting, funding and cash records.
The result should be shown by cohort, score band, product and channel. Blended profitability can conceal growth concentrated in negative-contribution loans. Corporate overhead and development investment should remain visible outside the unit bridge.
Lifetime value should be calculated from expected cash under a survival and loss curve, not from contractual yield multiplied by tenor. Repeat borrowing can add value only when subsequent facilities are observed and their acquisition, loss and funding are included. Customer acquisition cost should match funded borrowers and should distinguish organic, partner and paid channels. A model improvement can create value through better approval, lower loss or lower review cost; the bridge should prevent the same benefit from being counted in several lines.
21. Reconcile contribution to cash
Interest and fee income should be reconciled to billed and collected cash, including arrears, waivers, modifications and write-offs. Funding draw, repayment, interest, reserves and collateral should be bridged to the lender’s cash position. Restricted or customer funds should not be treated as unrestricted liquidity.
Rapid growth can create a cash deficit before accounting loss emerges. Originations consume funding, while income and recoveries arrive later. Warehouse advance rates, eligibility, concentration limits and reserves can tighten as performance weakens. Weekly liquidity and covenant forecasts should complement the equity valuation model.
Cash reconciliation should show principal collections, interest, fees, prepayments, recoveries, servicing remittances, funding draws and repayments by account. Suspense, unapplied cash and settlement balances should be aged. Stress scenarios should include delayed collections and facility draw restrictions. Equity proceeds should be allocated between operating runway, first-loss capital, reserves and growth investment, with double use prevented. This enables the board to determine whether the requested raise funds a measured model advantage or merely covers hidden portfolio and funding shortfalls.
22. Test fairness and customer outcomes
The organisation should evaluate approval, price, limit, false-positive, delinquency treatment, modification, complaint and remediation outcomes across relevant customer groups within lawful data boundaries. Missing attributes and small samples should be disclosed. Fairness involves policy, legal and statistical judgement rather than a single metric.
Customer outcomes should be connected to appeals and human review. Data proxies can create unequal effects even when protected attributes are excluded. The board should approve testing, thresholds, escalation and remediation. Potential restitution, supervisory action and trust damage belong in downside analysis when material weaknesses are identified.
Fairness testing should be designed before results are interpreted. Metrics can conflict, and the appropriate analysis depends on decision purpose, law and data. The company should compare model, policy and final decision because overrides or affordability rules can change outcomes. Sample sizes, missing attributes and proxy methods should be disclosed. Adverse findings should lead to root-cause analysis, exposure assessment, correction and monitoring. The transaction data room should include governance and remediation evidence without exposing unnecessary personal data.
23. Produce decision explanations
Applicants and reviewers may require understandable reasons for a credit decision. Explanations should reflect the actual principal factors used by the model and policy. Generic reason codes that do not correspond to the decision weaken customer protection and control.
The explanation method should be validated for fidelity, stability and usability. Local explanations can vary around similar cases; feature interactions can make simple rankings misleading. The organisation should map model factors to approved reason codes, test them on production decisions and provide an effective correction pathway. Applicability depends on jurisdiction and product, requiring legal and regulatory review.
Operational testing should sample approvals, declines, price changes and limit reductions. Reviewers should confirm that the stated reasons were material to the actual outcome, use understandable language and remain consistent across system versions. Where a vendor supplies reason codes, the lender should validate them against its configuration and policies. Explanation quality should be measured through errors, appeals, complaints and remediation. A complex model that cannot support required decisions may need constrained use even when its predictive statistics are strong.
24. Govern overrides
Overrides occur when a user changes an input, score, approval, price or limit. Each override should record reason, evidence, authority, direction, magnitude and outcome. Policy should define permitted circumstances and limits.
Override analysis should compare default, loss, approval and customer outcomes with non-overridden decisions. Frequent or material overrides can indicate missing data, model weakness, policy conflict or incentives. CBUAE’s Model Management Standards require robust governance of model input and output overrides for covered institutions. FinTech applicability and contractual responsibilities should be assessed factually.
Direction matters. Positive overrides may increase approval and loss; negative overrides may reduce access and create inconsistency. Review should compare reviewer, branch, channel and reason. Outcome analysis should account for selection because overridden cases differ from automatic decisions. Override limits should trigger escalation and possible recalibration. If business users routinely work around the model, the equity narrative should not present model performance as the final decision engine. Remediation cost and growth constraints should enter forecasts until usage becomes controlled.
25. Design accountable human decisions
Human review should have a defined purpose. Reviewers may assess information outside the model, correct data or apply policy. They need training, authority, evidence and quality assurance. A nominal human click does not create meaningful oversight when the reviewer cannot understand or challenge the output.
Decision queues should be measured for volume, handling time, ageing, approval, consistency and outcomes. Automation may release capacity while complex cases increase. Staffing forecasts should include supervision and quality review. Customer appeals and complaints should inform policy and model monitoring through a controlled feedback loop.
Reviewer authority should be separated from model development incentives where appropriate. Quality assurance should sample both accepted and declined decisions, with findings tracked to training, policy or model change. Workflow design should prevent unsupported edits and should retain evidence considered. Capacity models should include peak demand and service-level commitments. If growth depends on reducing manual review, the company should show which cases can safely move to automation and which remain subject to human judgement or regulatory expectation.
26. Maintain the model inventory
The inventory should record purpose, owner, developer, validator, version, methodology, data, target, population, materiality, use, dependencies, limitations, deployment, monitoring, validation and retirement. Rules, vendor scores and overlays should be included where they materially affect credit decisions.
Materiality should reflect financial, customer, regulatory and operational consequence. Inventory completeness can be tested against code repositories, decision systems, vendor invoices and product maps. Undocumented models create transaction risk because their outcomes, ownership and remediation cost cannot be assessed reliably.
The inventory should distinguish models from deterministic rules while preserving the complete decision chain. A policy table can create material model-like risk even if it falls outside a formal definition. Version history should show development, validation, approval, deployment and retirement dates. Dependencies should identify data, software, hardware and downstream reports. The board should receive an inventory view focused on material changes, overdue actions and breached limits. Transaction diligence should sample inventory entries against live production to test completeness and accuracy.
27. Build the governance map
The governance map should connect board risk appetite, senior management, model ownership, development, independent validation, data ownership, users, compliance, internal audit and change approval. Decision rights should be clear across the model lifecycle.
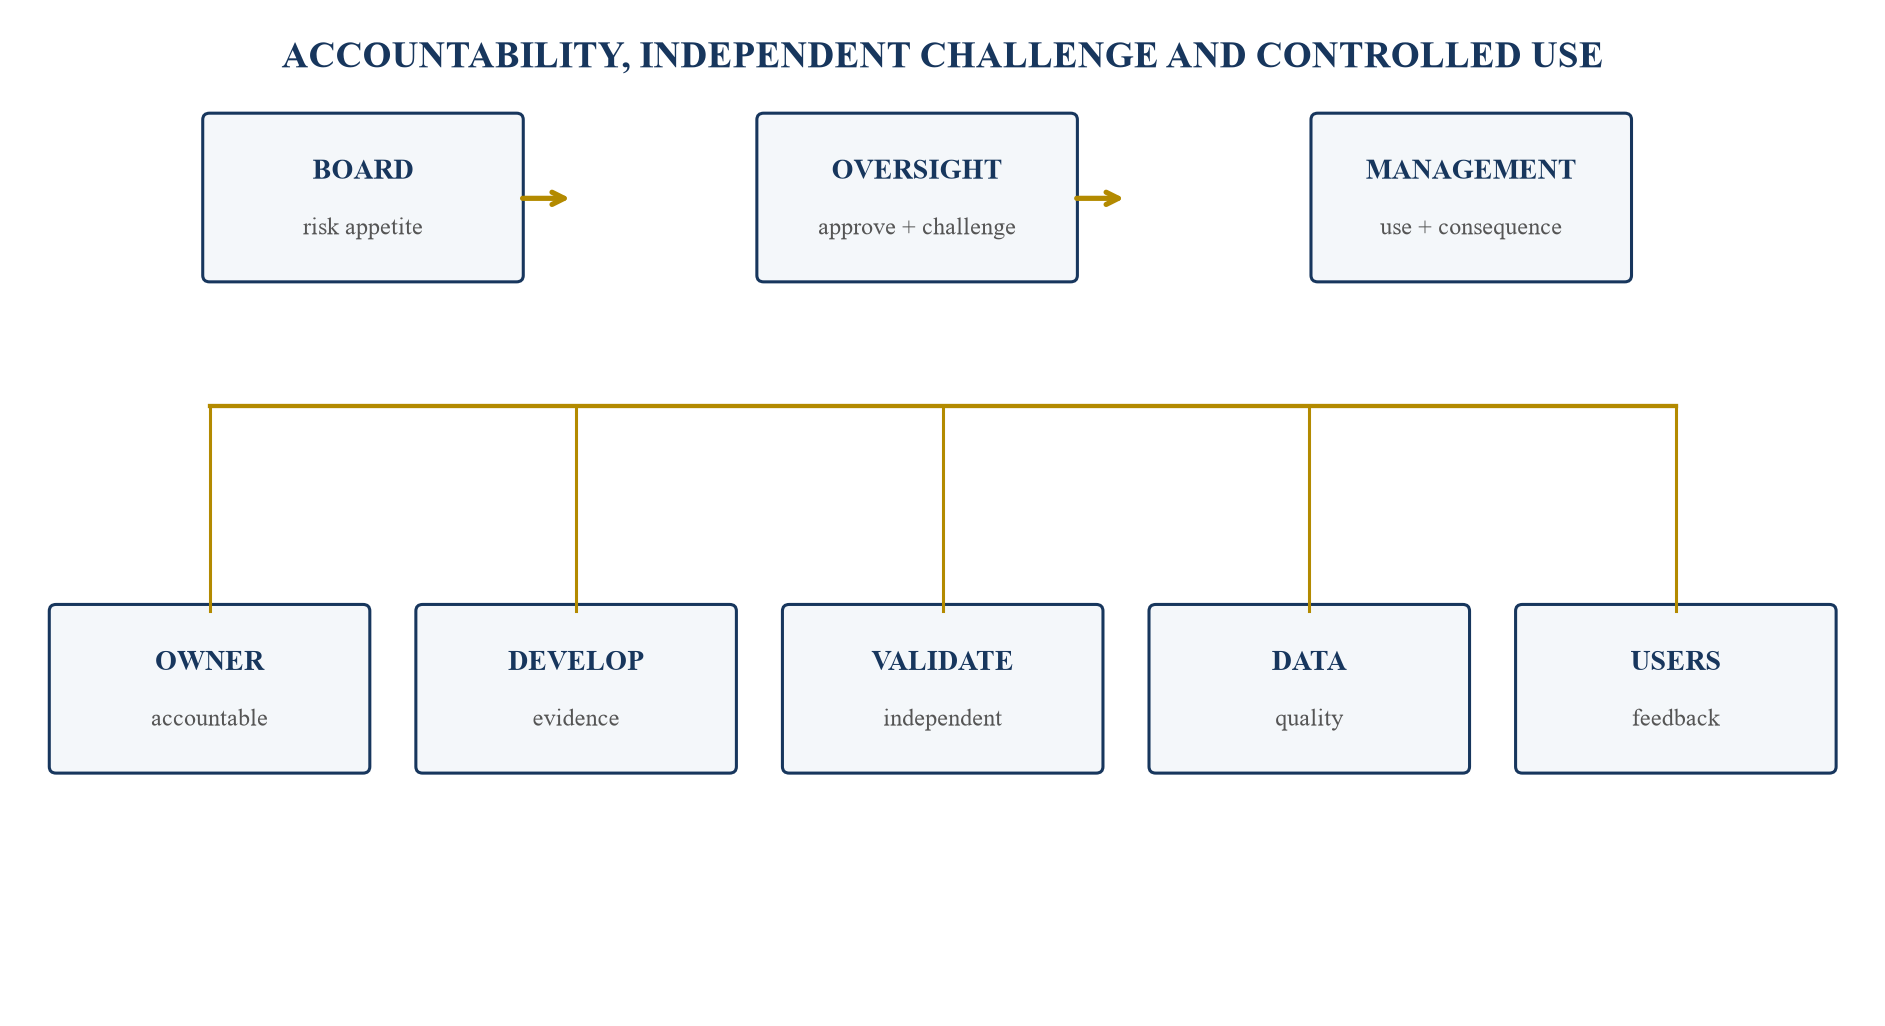
Roles and independence should be adapted to the institution, materiality and applicable requirements.
The map should include escalation for performance breaches, incidents and overdue validation. Third-party development does not transfer accountability for decisions and consequences under relevant frameworks.
Committee minutes should record evidence, challenge, conflicts, conditions and decisions. Approval should identify the exact model and use rather than a broad technology programme. Development and validation independence should be proportionate and credible, with validators able to restrict use. Data owners should be accountable for quality, while business users own adherence to policy. Internal audit should assess the framework and control environment within its mandate without replacing independent model validation. The transaction review should identify vacancies or role conflicts that make governance dependent on a few individuals.
28. Perform independent validation
Validation should challenge conceptual soundness, data, implementation, performance, limitations and intended use. It should include outcome analysis, benchmarking, sensitivity and stress testing appropriate to model materiality. Validation findings should have severity, owner, deadline and use restriction.
Table 3. Independent validation programme
| Validation area | Core test | Failure response |
|---|---|---|
| concept | purpose, assumptions and alternatives | revise design or restrict use |
| data | provenance, representativeness and leakage | rebuild sample or add limitation |
| implementation | code and decision reproduction | block release and correct |
| performance | discrimination, calibration and outcomes | recalibrate, redevelop or overlay |
| stability | drift, sensitivity and stress | tighten monitoring or limits |
| use | policy, overrides and explanations | retrain, control or suspend |
Scope and frequency should reflect model purpose, materiality, methodology, change and applicable supervisory expectations.
Independence requires authority and competence, with reporting to appropriate oversight. A validation completed before deployment should be followed by production monitoring and periodic review.
Findings should distinguish defects, limitations and recommendations. A limitation may permit use within defined boundaries, while a defect may require correction or suspension. Compensating controls should be specific, monitored and time-limited. Validation should reproduce key results from controlled data and code, test benchmark alternatives and review sensitivity to features and thresholds. Vendor documentation can inform the review but should not replace testing on the company population. Closure requires evidence and independent confirmation appropriate to severity.
29. Monitor drift and performance
Monitoring should cover input distribution, missingness, score distribution, approval, acceptance, calibration, early delinquency, default, recovery, overrides, explanations, fairness and complaints. Thresholds should state the action triggered by a breach.
Drift can result from economy, product, channel, fraud, collections, policy or data changes. The response may include investigation, increased review, threshold adjustment, overlay, recalibration, rollback or suspension. Outcome delay means leading indicators and mature results should be reported separately. Backlogs in investigation and remediation should be visible to investors.
Monitoring should distinguish statistical change from economic consequence. A feature distribution can move without harming decisions, while a small change near an approval threshold can materially affect borrowers and loss. Thresholds should therefore combine quantitative and business measures. Data-feed health and decision volumes should be monitored because missing data may look like improved stability. Reports should show breaches, duration, exposure, action and owner. Repeat breaches should inform model materiality and capital or valuation sensitivities.
30. Assess vendor and third-party dependency
Vendor models, data, cloud services, bureaus and decision platforms require contracts and technical diligence. The organisation should understand methodology, development population, performance, limitations, change process, service levels, data rights, security, audit access, portability and termination.
The company should validate vendor output on its own borrowers and monitor production outcomes. A high-performing external score can deteriorate when portfolio, geography or acquisition channel differs. Exit planning should estimate replacement, parallel run, validation, regulatory notice and customer impact. Concentration and supplier repricing should enter funding and valuation sensitivities.
Contracts should address access to documentation and performance evidence, not merely service availability. Change notification is important when features, model or bureau logic evolves. The lender should test fallbacks for outage and degraded data, including the risk of applying stale scores. Fourth-party dependencies should be mapped where critical. If migration would take longer than liquidity runway or regulatory approval, substitutability is weak. Investors should see the cost and timetable to reduce material dependency.
31. Govern privacy, security and resilience
Lending data can include sensitive identity, financial, device and behavioural information. Collection, use, access, retention, transfer and deletion should follow applicable law, consent and purpose. Security-by-design and privacy-by-design should be evidenced through architecture, controls and testing.
The decision system should have availability, recovery, incident and rollback plans. A model or data outage can halt originations or create uncontrolled decisions. Cyber events can corrupt inputs, expose customer data or manipulate outputs. Resilience tests should include third parties and should connect to financial and customer consequences.
Access should follow least privilege with segregation between development, approval and production deployment. Model artefacts, code and features should have integrity controls. Logging should support reconstruction of material decisions without retaining data beyond lawful need. Incident response should cover erroneous approvals and declines, customer notification, regulatory reporting, remediation and financial exposure. Backup and rollback should be tested against a known model version and decision policy. Resilience expenditure should be included in scale economics.
32. Map the regulatory perimeter
The product map should identify lending, broking, servicing, payments, data, consumer protection, credit reporting, outsourcing and AI obligations by entity and geography. The applicable regulator and licence should be linked to each material activity. Legal advice is required for specific conclusions.
CBUAE’s model-management and 2026 responsible-AI materials provide important UAE anchors for covered institutions and consumer-impacting uses. EBA loan-origination guidance, United States model-risk guidance and adverse-action requirements provide other jurisdictional examples. The equity case should avoid importing a rule without establishing applicability.
The obligation register should record source, entity, product, control, evidence, owner, testing and breach route. It should be updated before new data, models, funding structures or markets are introduced. The company should reconcile legal analysis with actual system operation. A policy that promises human review or explanation is weak evidence if workflow and logs cannot demonstrate it. Historic supervisory findings, complaints and remediation should be linked to root cause and closure. Forecast revenue should begin only when legal and operational readiness supports launch.
33. Test transfer across products and geographies
A model trained on one product or market may not transfer to another. Income stability, bureau coverage, payment behaviour, legal recovery, macroeconomy and customer selection can differ. Performance should be tested before deployment and monitored after launch.
Expansion forecasts should include local data acquisition, policy design, validation, regulatory readiness, funding and collections capacity. A pilot should define exposure limits and stop conditions. Investor materials should distinguish proven production economics from expected transfer benefit.
Transfer testing should compare input coverage, score distribution, calibration and outcomes before treating the model as portable. Local macroeconomic and legal recovery conditions may require recalibration or a different target. Partnerships can change applicant selection and data quality. A controlled launch should cap originations by time and exposure, preserve a benchmark and schedule formal review after sufficient outcome maturity. The valuation case should probability-weight expansion and include the capital needed to learn safely.
34. Build the operating forecast
The forecast should model applications, approvals, acceptance, originations, average balance, yield, delinquency, default, recovery, funding, servicing, compliance, headcount, capital and cash by cohort. Drivers should reconcile to historical evidence and approved actions.
Base, downside and upside cases should move coherent assumptions. A downside may include weaker applicant mix, lower acceptance, calibration drift, higher loss, slower recovery, tighter warehouse eligibility, compliance step-up and delayed equity. The minimum cash point and covenant headroom should be visible. Management responses should be tested for feasibility.
The forecast should use vintage mechanics rather than a single portfolio loss percentage. New originations should enter their own seasoning curves, with income, funding and loss recognised consistently. Model changes should affect approval and risk mix through explicit assumptions. Headcount and technology should reflect application, review, servicing and collection volumes. Balance sheet, income statement and cash flow should reconcile. Assumption owners should update actual-versus-plan each month, preserving the original financing case for accountability.
35. Model capital, funding and liquidity
Credit growth requires funding before collections arrive. The model should map equity, warehouse facilities, forward-flow arrangements, securitisation, deposits where applicable, reserves and retained cash. Advance rates, borrowing bases, concentration, performance triggers and margin calls should be reflected.
Model error can affect liquidity as well as loss. Deteriorating cohorts may become ineligible, increase reserves or reduce investor appetite. Stress testing should connect underwriting, servicing and recovery outcomes with funding capacity. Regulatory capital and liquidity requirements require fact-specific analysis for the entity.
Funding diversification should be measured by usable capacity under downside conditions, not signed headline commitments alone. The model should show maturity, renewal, pricing, collateral, covenants, advance rate, eligibility and concentration for each facility. Forward-flow buyers may pause or reprice new purchases, returning originations to the balance sheet. Equity allocation should preserve a contingency for delayed funding and loss development. A board-approved stop-originating trigger can protect liquidity when performance or facility headroom deteriorates.
36. Construct the valuation bridge
The valuation bridge should connect model advantage to measurable operating drivers: approval at constant loss, loss at constant approval, pricing, funding, servicing, compliance, growth duration and cash need. Deployed and validated effects should be separated from roadmap benefits.
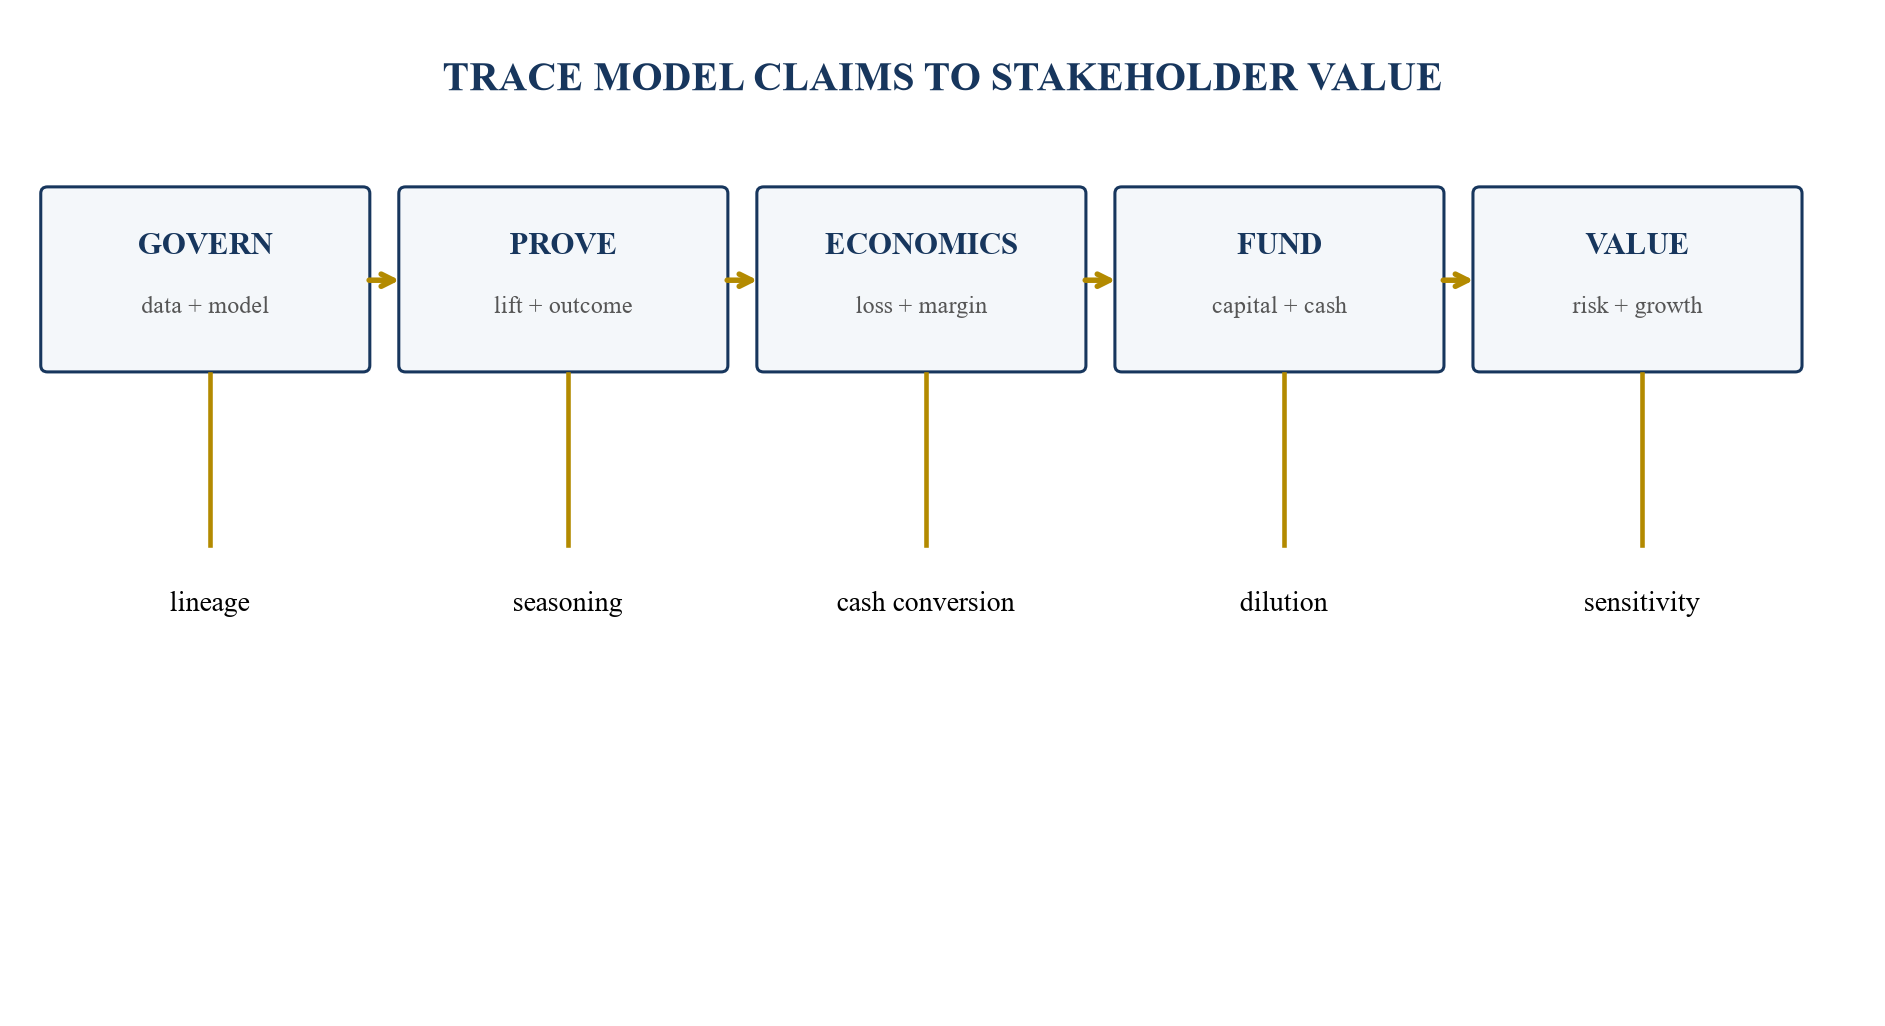
The bridge is analytical; company-specific valuation requires evidence, market inputs and professional judgement.
Revenue multiples should be interpreted with loss, funding, concentration, retention and governance. Discounted cash flow requires supportable cohort and funding assumptions. Capital structure, preferences, debt and dilution determine equity value allocation.
The bridge should avoid double counting model benefit. Improved calibration can lower loss and support funding, but the same effect should not also justify an unrelated multiple uplift without evidence. Scenario analysis should show enterprise value, net debt or funding obligations, restricted cash, fresh capital and fully diluted ownership. Reverse stress testing can identify the loss, funding and growth combination that exhausts liquidity or breaches investor return. The transaction structure can then address uncertainty through tranche milestones, conditions, governance or valuation range.
37. Score equity readiness
The scorecard should organise evidence across data, model, decision, portfolio, funding, governance and forecast. Scores should link to underlying records and should not replace investment judgement. Material unresolved findings should cap the relevant score.
Table 4. AI-native lender equity-readiness scorecard
| Dimension | Strong evidence | Warning signal |
|---|---|---|
| data | point-in-time lineage and complete outcomes | leakage or missing joins |
| model | out-of-time lift and calibrated results | development metrics only |
| portfolio | seasoned cohorts and net recoveries | unseasoned growth masks loss |
| governance | owner, validation and controlled change | undocumented model or override |
| funding | downside liquidity and covenant headroom | growth depends on fragile eligibility |
| value | benefits reconcile to cash and dilution | roadmap uplift treated as current |
Weighting should reflect the company, product, transaction and evidence maturity.
The investment committee should receive the score changes, evidence exceptions and remediation cost. Weaknesses should route additional diligence or change price, structure, conditions, funding amount or the decision to proceed.
Scoring guidance should define the evidence required for each grade. A recent validation with unresolved high-severity findings should not receive the same score as clean production evidence. The scorecard should retain dissent and identify which assumptions depend on management estimates. Its purpose is to direct attention and transaction consequences. Data weakness may require an escrowed remediation budget, funding weakness may reduce the affordable growth plan, and unseasoned cohorts may support staged capital rather than a single valuation conclusion.
38. Prepare the transaction data room
The data room should include corporate and licence records, products, funding, accounting, application and facility data, model inventory, documentation, validation, monitoring, overrides, policies, cohorts, losses, recoveries, complaints, vendors, cybersecurity, forecasts, valuation and board materials.
Files should be indexed, dated, access-controlled and reconciled to the operating model. Sensitive customer and security data should be minimised and handled under agreed legal protocols. Redaction should preserve required analytical facts. Management responses should identify owner, evidence and resolution rather than provide unsupported narrative.
39. Run the ninety-day equity-readiness sprint
The first thirty days should reconcile perimeter, data, decisions and portfolio. Days thirty-one to sixty should validate lift, calibration, cohorts, unit economics, governance, funding and forecasts. Days sixty-one to ninety should resolve material exceptions, approve the valuation bridge and prepare controlled investor materials.
Table 5. Ninety-day lending equity-readiness plan
| Period | Core work | Board output |
|---|---|---|
| days 1 to 30 | evidence ledger, model inventory and cohort baseline | approved fact base |
| days 31 to 60 | validation, loss, economics, funding and scenarios | tested investment model |
| days 61 to 90 | remediation, valuation, materials and data room | launch, revise or defer |
| ongoing | monitoring, validation and issue closure | current equity evidence |
Timing depends on data availability, portfolio seasoning, issue severity and transaction requirements.
The sprint should end with an explicit decision and exception register. Issues that cannot be resolved before launch should be disclosed, mitigated and reflected in transaction terms.
40. Conclusion
AI-native lending value emerges when a controlled model improves realised risk-adjusted cash economics across complete and seasoned cohorts. Predictive lift is one link in a longer chain connecting point-in-time data, policy, customer selection, pricing, funding, servicing, default, recovery and liquidity.
Boards and investors should require reproducible evidence, accountable ownership, independent validation, controlled overrides, customer-outcome testing and downside funding analysis. The data-to-loss chain, lift-versus-loss matrix, cohort vintages, governance map and valuation bridge convert model claims into a decision framework. They also show where fresh equity can fund the next independently verifiable milestone.
References
- Central Bank of the UAE, Model Management Standards, https://rulebook.centralbank.ae/en/rulebook/model-management-standards
- Central Bank of the UAE, Model Management Guidance, https://www.centralbank.ae/media/22nps2k1/model-management-guidance-attach-to-notice-5052-2022.pdf
- Central Bank of the UAE, Credit Risk Management Standards, https://rulebook.centralbank.ae/en/rulebook/credit-risk-management-standards
- Central Bank of the UAE, Article 13: Credit Risk Models, https://rulebook.centralbank.ae/en/rulebook/article-13-credit-risk-models-0
- Central Bank of the UAE, Guidance Note on Consumer Protection and Responsible Adoption and Use of Artificial Intelligence and Machine Learning, https://rulebook.centralbank.ae/en/rulebook/guidance-note-consumer-protection-and-responsible-adoption-and-use-artificial-intelligence
- Dubai Financial Services Authority, AI Survey 2025, https://www.dfsa.ae/news/new-dfsa-ai-survey-generative-ai-adoption-has-nearly-tripled-within-difc-last-12-months-governance-continues-develop
- European Banking Authority, Guidelines on Loan Origination and Monitoring, https://www.eba.europa.eu/regulation-and-policy/credit-risk/guidelines-loan-origination-and-monitoring
- European Banking Authority, Report on machine learning for IRB models, https://www.eba.europa.eu/sites/default/files/document_library/Publications/Reports/2021/1025438/Report%20on%20machine%20learning%20for%20IRB%20models.pdf
- Board of Governors of the Federal Reserve System, Revised Guidance on Model Risk Management SR 26-2, https://www.federalreserve.gov/supervisionreg/srletters/SR2602.htm
- Consumer Financial Protection Bureau, Circular 2022-03 on adverse action and complex algorithms, https://www.consumerfinance.gov/compliance/circulars/circular-2022-03-adverse-action-notification-requirements-in-connection-with-credit-decisions-based-on-complex-algorithms/
- IFRS Foundation, IFRS 9 Financial Instruments, https://www.ifrs.org/issued-standards/list-of-standards/ifrs-9-financial-instruments/
- IFRS Foundation, IFRS 7 Financial Instruments Disclosures, https://www.ifrs.org/issued-standards/list-of-standards/ifrs-7-financial-instruments-disclosures/
- Basel Committee on Banking Supervision, Principles for the Management of Credit Risk, https://www.bis.org/publ/bcbs75.htm
- Basel Committee on Banking Supervision, Sound Practices: Implications of fintech developments for banks and bank supervisors, https://www.bis.org/bcbs/publ/d431.htm
- Bank for International Settlements, Intelligent financial system: how AI is transforming finance, https://www.bis.org/publ/work1194.htm
- Bank for International Settlements Innovation Hub, Project Noor, https://www.bis.org/project/noor
- World Bank, Disruptive Technologies in the Credit Information Sharing Industry, https://documents1.worldbank.org/curated/en/587611557814694439/pdf/Disruptive-Technologies-in-the-Credit-Information-Sharing-Industry-Developments-and-Implications.pdf
- World Bank, General Principles for Credit Reporting, https://www.worldbank.org/en/topic/financialinclusion/publication/general-principles-for-credit-reporting
- National Institute of Standards and Technology, AI Risk Management Framework, https://www.nist.gov/itl/ai-risk-management-framework
- International Organization for Standardization, ISO/IEC 42001 Artificial intelligence management systems, https://www.iso.org/standard/81230.html
- OECD, OECD AI Principles, https://oecd.ai/en/ai-principles
- European Union, Artificial Intelligence Act, https://eur-lex.europa.eu/eli/reg/2024/1689/oj
- UK Information Commissioner's Office, Guidance on AI and data protection, https://ico.org.uk/for-organisations/uk-gdpr-guidance-and-resources/artificial-intelligence/
- UK Financial Conduct Authority, AI and financial services, https://www.fca.org.uk/firms/innovation/artificial-intelligence
- International Valuation Standards Council, International Valuation Standards, https://www.ivsc.org/standards/
- Financial Stability Board, The Financial Stability Implications of Artificial Intelligence, https://www.fsb.org/2024/11/the-financial-stability-implications-of-artificial-intelligence/
