

Introduction
AI ventures often file patents while products, markets and business models are still changing. The portfolio may contain applications directed to model architecture, training, inference, compression, safety, data processing, hardware acceleration, user interaction or a sector-specific technical application. A buyer can therefore encounter a large filing estate with little revenue and limited evidence that customers will pay for the claimed inventions.
The commercial question is narrower than whether the science is interesting. A buyer needs to know which claims may be enforceable, what conduct those claims may cover, whether a planned product practices them, which competing products may be constrained, what third-party rights may block the buyer, and how ownership changes future cash. A patent grants an exclusionary right within a territory and term. It does not by itself establish freedom to operate, product feasibility, market demand or an ability to collect money [1-4].
AI increases the difficulty. Claim language can sit close to mathematical methods, abstract ideas or computer-implemented inventions. Patentability and inventive-step analysis differs by jurisdiction. EPO guidance focuses on technical character and technical effect for AI and machine-learning inventions [10-12]. USPTO guidance addresses subject-matter eligibility and requires human inventorship, including for AI-assisted inventions [13-17]. UKIPO practice applies its own statutory and case-law framework [18-20]. A portfolio that looks coherent at the research level can therefore have materially different claim strength across target markets.
Early portfolios also create information asymmetry. Patent applications can remain unpublished for a period. Examination outcomes are uncertain. Competitor products may be opaque. Product architecture changes faster than prosecution. Founders can describe a broad strategic moat while granted claims cover one implementation. A disciplined valuation should make these uncertainties explicit and identify which new evidence can change the answer.
This paper is designed for boards, founders, investors, corporate-development teams, lenders, valuation specialists, patent counsel and technology executives. It provides a transaction decision system. It does not provide legal, accounting, tax, regulatory, technical or valuation advice. Qualified specialists should assess the particular claims, prosecution files, products, jurisdictions and transaction purpose.
1 Define the portfolio as enforceable rights, pending options and know-how
A patent schedule is an index, not an economic asset map. The first task is to group records into families and identify each priority chain, applicant, inventor, jurisdiction, filing status, grant status, claim set, opposition or challenge, maintenance position and remaining term. Continuations, divisionals and national phases should be connected to the underlying inventive concepts. Duplicate counts should be removed before any portfolio metric is calculated.
The economic unit may be smaller or larger than a family. One independent claim can cover a central product function while dozens of dependent claims add little incremental exclusion. Several families can operate together as a stack covering data preparation, model training, inference control and hardware execution. Know-how, code, data, trade secrets and inventor expertise can be necessary to practise the invention even though the patent documents disclose the claimed subject matter.
Ownership should be proved from the inventors through every assignment and corporate transfer to the current owner. Employment terms, contractor agreements, university rights, joint-development agreements, funding conditions and security interests require review. The buyer should test whether assignments were executed, recorded where relevant and broad enough to cover continuations and foreign rights. AI-assisted invention records should evidence the human contribution required by applicable inventorship rules [13-16].
The portfolio should then be classified by role. A core family may cover a revenue-critical product function. A blocking family may constrain competitors without being used in the owner's product. A defensive family may support cross-licensing. A signalling family may help investors understand technical direction. A future-option family may support a product that has not been built. Each role can have value, yet each requires different evidence and a different cash-flow link.
| Component | Evidence to inspect | Economic role | Valuation question |
|---|---|---|---|
| granted claims | grant documents, current claims, legal status and term | potential exclusion in named territories | what product conduct could the claims cover today |
| pending claims | applications, search reports, office actions and amendments | option to obtain future scope | which claim scope can reasonably survive examination |
| priority and family chain | priority documents, continuations, divisionals and national phases | preserves date and jurisdictional reach | are chain defects or gaps capable of reducing protection |
| ownership chain | assignments, employment, contractor and collaboration records | establishes control and transferability | can the seller transfer every material right at closing |
| prosecution record | cited art, arguments, amendments and estoppel-relevant statements | shapes construction and validity risk | what scope was surrendered to obtain allowance |
| implementation assets | source code, models, data, designs and technical documentation | turns rights into product capability | can the buyer practise and improve the invention |
| know-how and people | laboratory records, tacit methods and inventor availability | supports execution and future filings | what capability leaves if key people do not transfer |
Proposed diligence record; legal conclusions require jurisdiction-specific counsel.
This map prevents two common errors. The first is valuing expenditure as though it were protection. The second is valuing claims without the implementation system needed to generate benefit. The transaction perimeter should identify which legal rights, technical assets, people and contracts transfer together.
2 Read the claims before reading the pitch deck
The claims define the legal boundary that matters to exclusion. Titles, abstracts, diagrams and product descriptions assist understanding and can overstate or understate the operative scope. Diligence should therefore begin with independent claims, then examine dependent claims, specifications, prosecution history and relevant legal status. WIPO's freedom-to-operate materials emphasise claim scope, territory, legal status and time [5-7].
A claim chart should decompose each independent claim into limitations and map each limitation to the target's product, a buyer roadmap and observable competitor implementations. The chart should distinguish direct evidence, engineering inference requiring confirmation and missing evidence. It should identify whether one difficult-to-prove limitation controls the entire infringement case. It should also record potential equivalents, construction disputes and steps performed by different actors or jurisdictions.
Breadth should be assessed relative to the technical problem and prior art. A short claim is not automatically broad or valuable. A claim can use functional language that attracts construction or enablement risk. A narrow implementation claim can be valuable when it covers a high-volume architecture that competitors cannot economically avoid. The analysis should therefore combine scope, detectability, design-around cost and commercial relevance.
The prosecution record can change the apparent meaning. Amendments and arguments may distinguish cited art by narrowing the invention to a particular data structure, hardware arrangement, training step or technical effect. A buyer should compare the original commercial thesis with the surviving claims. If the portfolio's strongest story depends on subject matter removed during examination, that story should not drive value.
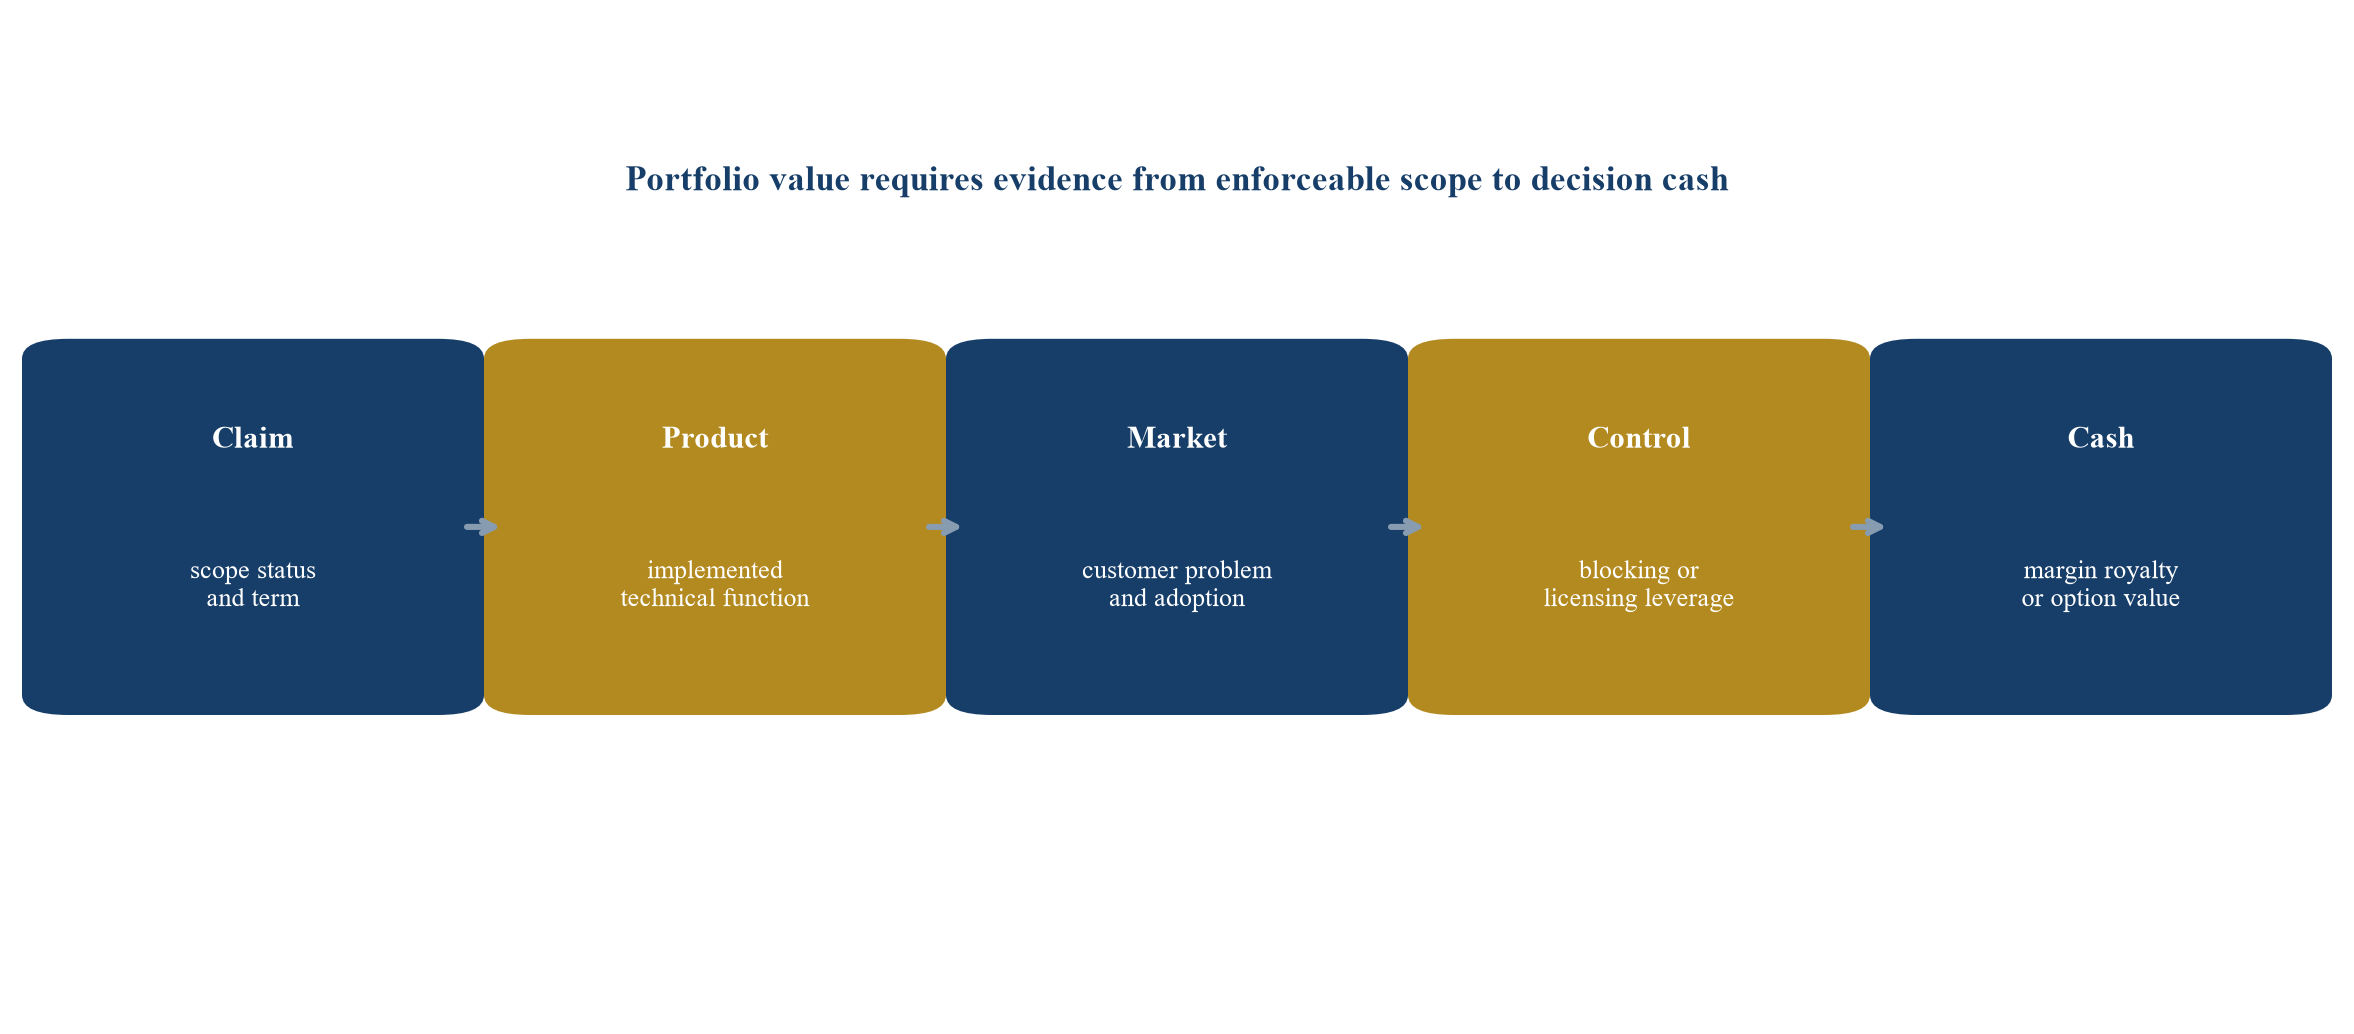
Proposed transaction framework; every connection requires portfolio-specific evidence.
| Dimension | Weak evidence | Strong evidence | Transaction use |
|---|---|---|---|
| legal status | lapsed, unclear or early application | maintained grant with verified chain | probability-weight enforceable life |
| claim scope | narrow, ambiguous or easily avoided | covers an economically important architecture | estimate protected cash-flow perimeter |
| prior-art resilience | material uncited art or adverse search | favourable search and reasoned validity review | set challenge and survival scenarios |
| detectability | infringement hidden inside inaccessible process | limitation observable in product or documentation | estimate enforcement feasibility |
| product mapping | research narrative without implementation | version-controlled claim chart to shipped function | connect rights to roadmap and revenue |
| design-around burden | inexpensive substitution | material cost, delay or performance sacrifice | estimate competitive leverage |
| territorial relevance | filings outside target markets | grants in revenue, production and competitor markets | align value with geographic cash flows |
Proposed assessment scale; scores organise evidence and do not determine legal validity or price.
Claim review should produce a small number of decision-relevant clusters. Portfolio averages conceal concentration. A single family can account for most value. The buyer should know the value attributable to the top family, top three families and remaining estate, then test the effect of losing each cluster.
3 Test AI patentability, eligibility and inventorship by jurisdiction
AI claim strength cannot be assumed from a grant in another jurisdiction. At the EPO, an AI or machine-learning claim may have technical character when directed to technical means, while the contribution to inventive step depends on a technical purpose or technical implementation [10-12]. A claim to abstract classification or a business outcome can receive different treatment from a claim tied to control of a physical system, image processing or efficient computer operation.
In the United States, eligibility analysis applies the relevant statutory and judicial framework for abstract ideas and practical applications. USPTO materials provide examination guidance and examples, while court decisions remain controlling [17,21-23]. Separate requirements govern novelty, non-obviousness, written description, enablement and definiteness. The buyer should avoid treating an eligibility allowance as evidence that every other validity requirement is strong.
Inventorship requires a specific factual record. USPTO guidance states that AI-assisted inventions are not categorically unpatentable and focuses on significant human contribution [13-16]. The diligence team should identify who conceived each claimed invention, how AI tools were used, who selected or refined outputs, and whether named inventors match the legal test. Laboratory notebooks, design records, source-control history, prompts where relevant, test results and witness evidence can support this analysis.
UK and European practice should be analysed separately. A global filing strategy can use common specifications and still face different exclusions, technical-effect tests, amendment constraints and procedural outcomes [10-12,18-20]. The valuation model should assign value by jurisdiction and claim status rather than apply one global survival probability.
Disclosure sufficiency is especially important where the claimed technical effect depends on training data, model architecture or parameter choices. EPO guidance states that characteristics needed to reproduce a technical effect should be disclosed when the skilled person cannot determine them without undue burden [10]. The buyer should ask whether the specification supports the commercial breadth claimed and whether future products remain within the disclosed teaching.
Jurisdictional work should result in a claim-survival matrix. Each material independent claim receives scenarios for current scope, plausible amended scope and failure. Probabilities are management assumptions informed by counsel, examination history and evidence. They should not be described as legal conclusions.
4 Separate patent value from freedom to operate
Ownership of a patent does not give an affirmative right to commercialise the invention. A broader third-party claim can cover the target's product even when the target owns a narrower improvement patent. Freedom to operate therefore requires a separate search and legal analysis focused on the planned product, relevant acts, territories and time [5-7].
The FTO perimeter should reflect the transaction plan. A buyer acquiring an AI inference engine for deployment in the United States, United Kingdom, European Union and selected Asian markets requires searches tailored to product versions, hosting arrangements, training locations, hardware and customer use. A general landscape search identifies themes and competitors; it does not answer infringement risk.
The team should map blocking rights to product modules and potential responses. Responses can include non-infringement positions, validity challenges, design-arounds, licences, cross-licences, acquisitions, territorial changes and delayed launch. Each response has cost, timing and performance consequences. Those consequences belong in the product forecast and transaction terms.
| Blocking-right condition | Operational response | Valuation effect | Transaction protection |
|---|---|---|---|
| credible claim maps to core function | licence, redesign or acquisition | royalty, delay and margin reduction | price adjustment and closing condition |
| claim may be invalid | opinion, opposition or challenge | legal cost and uncertain launch | escrow and risk-sharing covenant |
| infringement depends on architecture | preserve evidence and redesign option | engineering cost and performance trade-off | funded remediation plan |
| risk limited to one territory | alter deployment or market sequence | geographic revenue deferral | territory-specific milestone |
| seller owns cross-licensing leverage | negotiate portfolio licence | reduced expected cash outflow | transfer cooperation and control rights |
| issue arises from third-party component | supplier indemnity or replacement | recovery uncertainty and switching cost | assignment of claims and vendor covenant |
Proposed planning framework; counsel should determine legal risk and available remedies.
FTO work also tests the seller's own portfolio story. If competitors can avoid the target's claims through the same design-around that the target plans for third-party rights, claimed strategic breadth may be weak. Conversely, a dense blocking landscape can increase the value of a portfolio that supplies credible cross-licensing leverage.
5 Link each claim cluster to product architecture and customer value
The product map should connect claim limitations to software modules, model components, data flows, hardware, interfaces and operating steps. Engineering teams should identify the current version, planned version and alternative implementation. Product managers should identify the customer problem, workflow change, measurable benefit, buying authority and adoption dependency associated with each function.
This connection matters because a technically central invention may have limited economic effect. A novel training method can reduce internal compute cost without changing price or adoption. A safety control can unlock regulated customers and create substantial option value. A compression technique can enable edge deployment and open a new market. The valuation should identify the mechanism and evidence rather than apply a generic patent premium.
Pre-product-market proof requires staged evidence. Technical evidence can include benchmark design, reproducibility, ablation tests, latency, power, accuracy, robustness and failure modes. Product evidence can include design-partner commitments, paid pilots, integration progress, procurement gates and switching costs. Commercial evidence can include customer budgets, competitive alternatives, willingness-to-pay tests and contract terms. Each stage can change the probability and scale of cash flow.
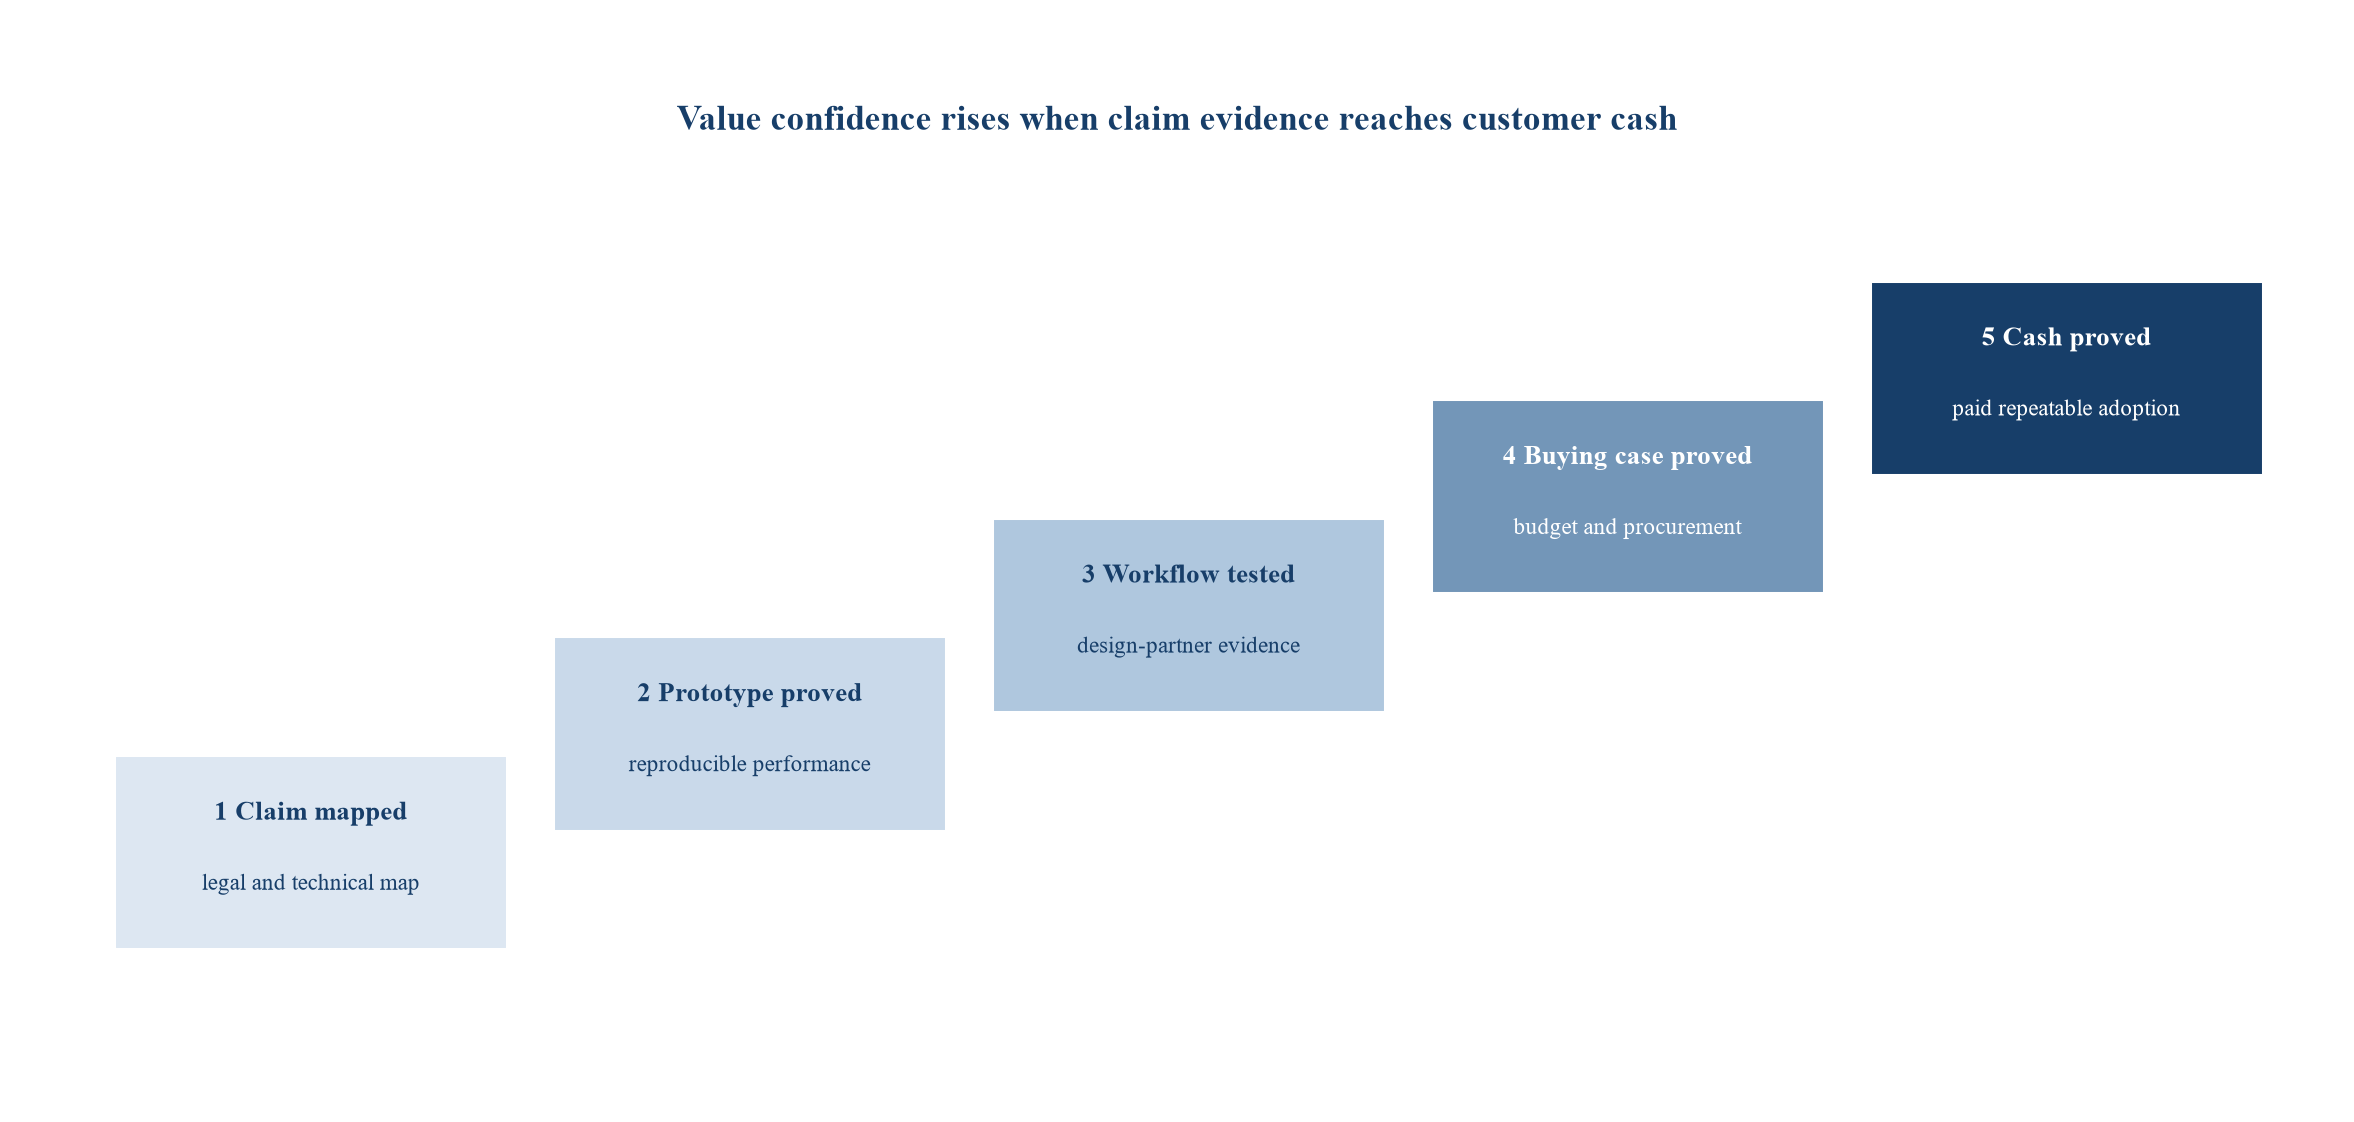
Proposed evidence ladder; progression requires documented gate evidence.
The buyer should distinguish a patent that protects the product from a patent that protects one implementation. The latter can still be valuable when alternatives reduce performance or increase cost. The design-around analysis should estimate engineering time, compute, data, hardware, certification, customer migration and opportunity cost.
Claim-to-product mapping should be version controlled. A patent portfolio can drift away from the roadmap as engineering teams adopt open-source components, foundation models or third-party platforms. Prosecution decisions should reflect current and plausible future architecture. A quarterly map can identify new filing opportunities, abandoned concepts and claims that no longer justify maintenance.
6 Use patent indicators as evidence, not valuation shortcuts
Forward citations, family size, claim count, grant rate, remaining life, oppositions and geographic coverage can help triage a portfolio. EPO and OECD materials describe several indicators and their limitations [8-9,24-26]. Indicators can correlate with technological importance or applicant expectations and remain noisy, field-dependent and affected by patent-office practice.
Citation counts require age and field normalisation. Older patents have more time to accumulate citations. Some offices and examiners add citations. Dense technical fields cite differently from emerging fields. Self-citations can show cumulative innovation or portfolio-building strategy. A buyer should examine who cites the patent, which claims are relevant and whether the citation relates to the commercial thesis.
Family size can indicate that an applicant expected value and paid for geographic reach. It can also reflect a filing policy established before market evidence. Claim count can indicate coverage or drafting style. Maintenance can indicate continuing belief or administrative inertia. Opposition survival can strengthen confidence while remaining specific to the challenged claims and grounds.
| Indicator | Potential signal | Distortion risk | Required follow-up |
|---|---|---|---|
| forward citations | later technical relevance | age, field and examiner effects | inspect citing claims and commercial actors |
| family size | expected market reach | filing policy and sunk-cost bias | compare jurisdictions with revenue plan |
| independent claims | multiple exclusion routes | drafting style and overlap | chart economically distinct scope |
| remaining term | potential duration | earlier obsolescence | test technical and commercial life |
| grants and allowances | examination progress | narrow surviving scope | compare allowed claims with product |
| opposition or challenge outcome | tested resilience | issue-specific result | review surviving claim construction |
| maintenance behaviour | owner commitment | administrative routine | reconcile with roadmap and licensing |
Indicators support triage and evidence review; they are not standalone valuation multiples.
Machine scoring can improve consistency and create false precision. A model trained on transaction data may inherit selection bias, confidential-data gaps and differences in deal structure. The score should remain explainable at claim level. Human counsel, engineering and commercial leaders should challenge the inputs and the interpretation.
7 Build commercial scenarios before choosing a valuation method
The portfolio can create value through several channels. It may protect product margin, delay entry, reduce expected licence payments, support licensing revenue, improve negotiating leverage, open a regulated market, support financing or preserve an option to develop a new product. The buyer should select channels supported by the claims and transaction plan.
The base case should avoid double counting. If patent protection is already reflected in product revenue and margin, adding a separate relief-from-royalty value for the same benefit can overstate enterprise value. A purchase-price allocation can require separate intangible-asset analysis for accounting purposes, while the transaction decision still needs one coherent enterprise cash-flow model [27-32].
Pre-market scenarios should use decision gates. A product can require technical validation, claim survival, regulatory approval, customer integration, procurement and scale-up. Each gate has a cost, timing and conditional probability. The model should show the value of continuing, pausing, licensing, redesigning or abandoning as evidence develops.
The forecast period should use the shorter of legal life and economic life for the relevant benefit. Fast-moving AI implementations can become obsolete before patent expiry. Follow-on filings, trade secrets and data advantages can extend business value beyond one claim set. Those assets should be identified separately.
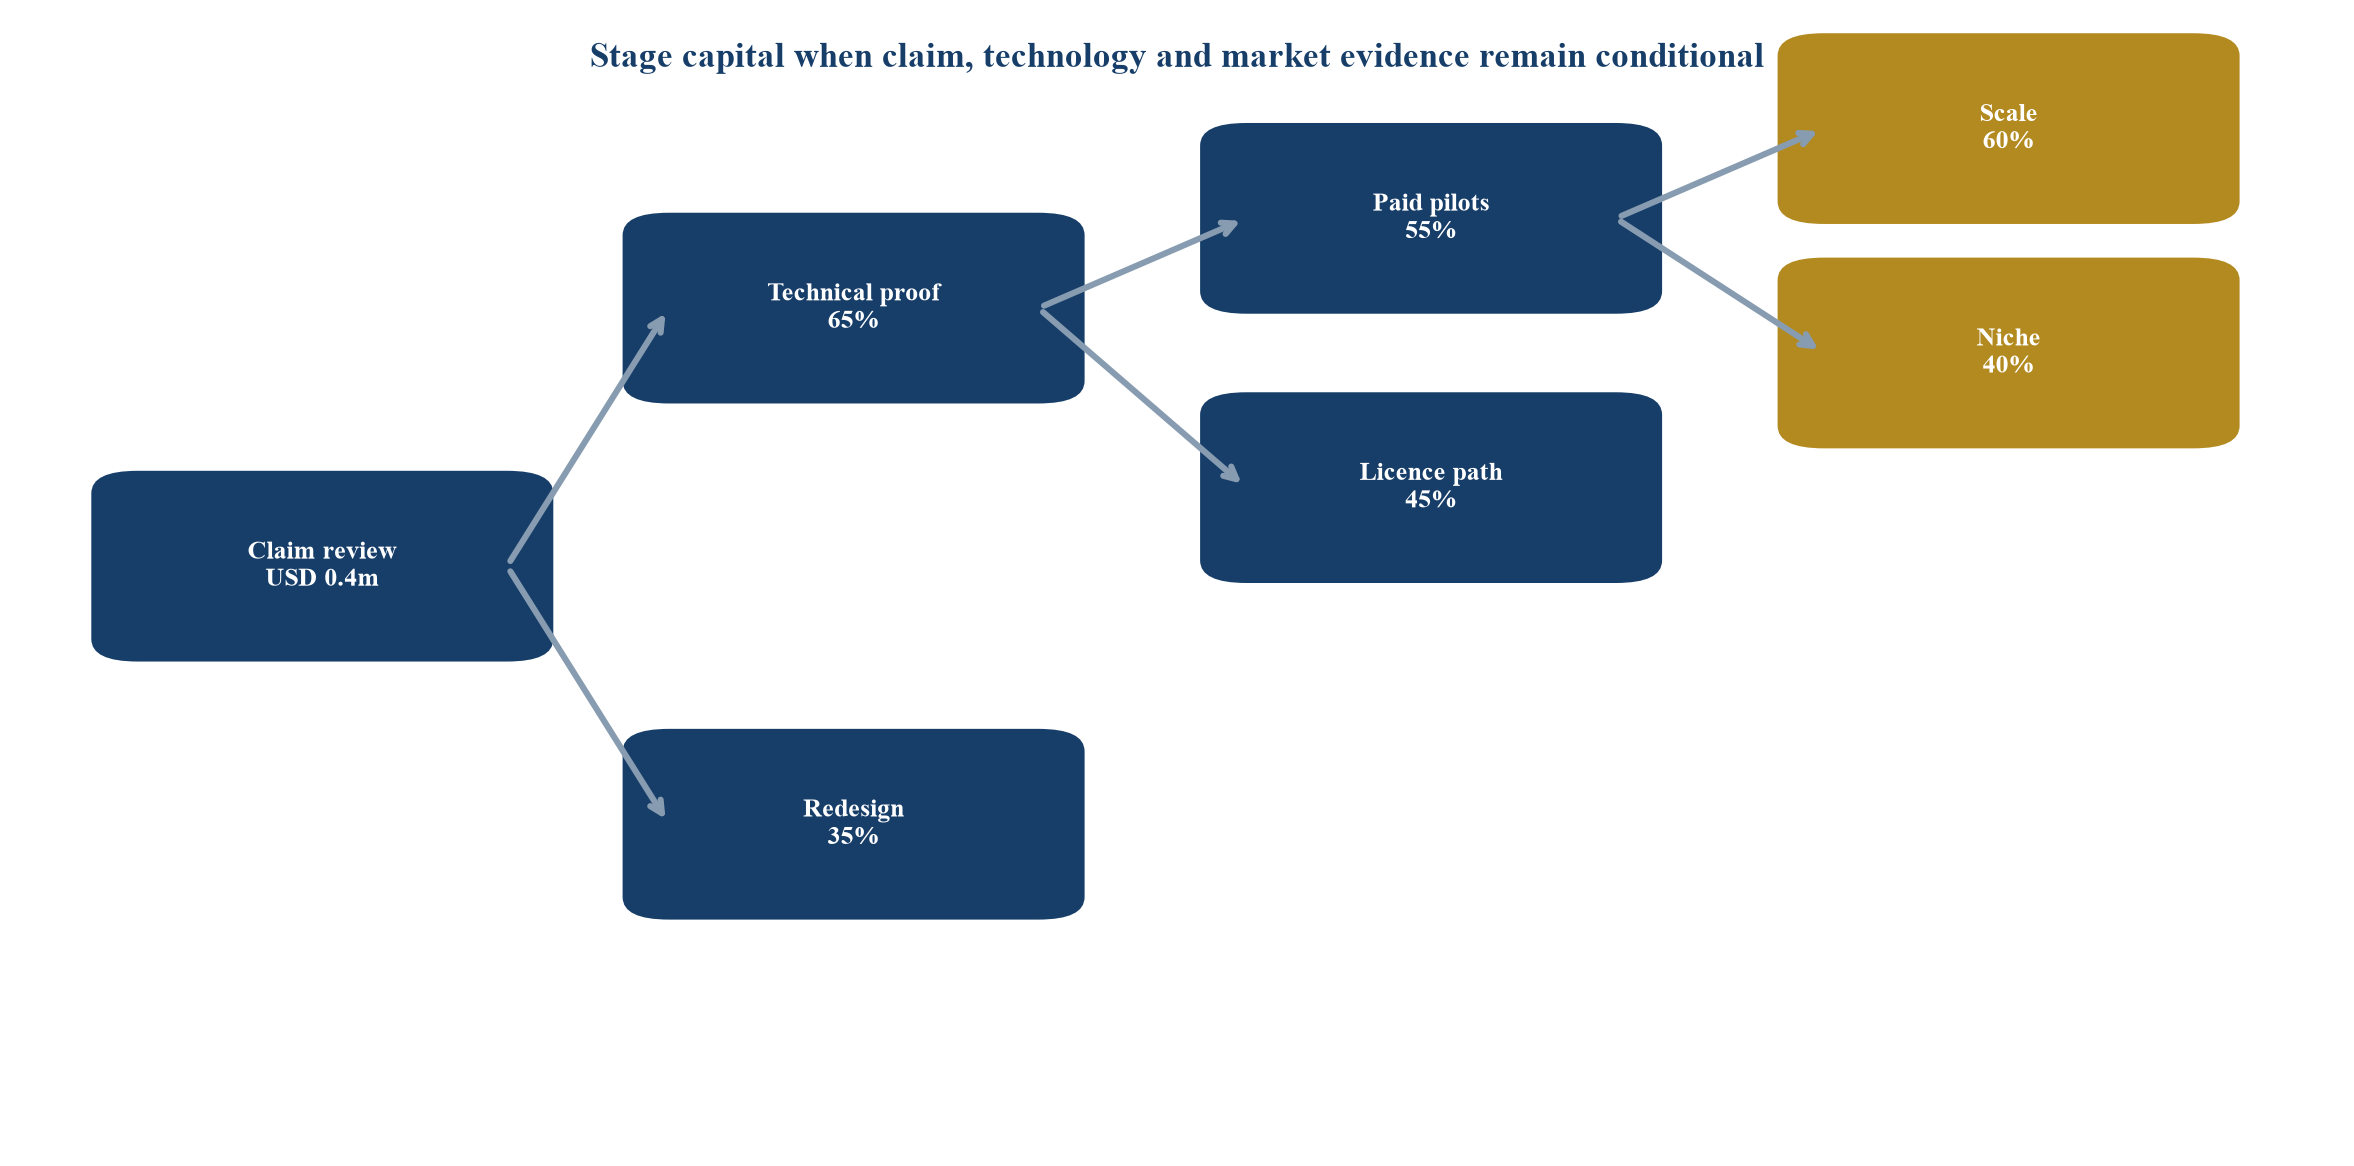
All probabilities and amounts are management assumptions solely for method demonstration.
Scenario ownership should be explicit. Counsel supplies claim and legal-status assessments. Engineering supplies architecture, feasibility and redesign estimates. Commercial leaders supply customer, pricing and adoption evidence. Finance reconciles cash flows and prevents double counting. The board approves the management assumptions used for the transaction.
8 Develop a replacement-cost indication without rewarding waste
Replacement cost estimates the current expenditure and time required to create an asset with comparable utility. For an AI patent portfolio, relevant costs can include technical research, experiments, inventor and engineering time, patent landscape work, drafting, filing, prosecution, translation, validation, portfolio management and the opportunity cost of delay. WIPO describes cost, market, income and option methods for early-stage IP valuation [33-38].
Historical spend is evidence of effort and does not establish value. Failed experiments, abandoned jurisdictions, duplicated filings and inefficient prosecution should not be rewarded. The model should use current efficient replacement cost, then adjust for functional obsolescence, economic obsolescence, legal defects and the time required to rebuild the evidence base.
Time can be more important than cash. A buyer may be able to hire engineers and counsel, yet lose a priority date, learning curve or market window. Replacement analysis should therefore separate reproducible work from irreproducible position. The legal priority cannot simply be recreated after disclosure or competitor filing. A granted claim with useful remaining life can embody an option unavailable to a new entrant.
| Cost component | Gross cost | Adjustment | Adjusted indication |
|---|---|---|---|
| technical research and experiments | 4.2 | 45% obsolete or unsuccessful | 2.3 |
| engineering documentation and prototypes | 2.1 | 30% reusable | 1.5 |
| drafting, filing and prosecution | 2.4 | 25% non-core or duplicated | 1.8 |
| patent analytics and freedom-to-operate work | 0.8 | 20% requires refresh | 0.6 |
| current portfolio management systems | 0.4 | 15% remediation | 0.3 |
| replacement-cost indication | 9.9 | combined adjustments | 6.5 |
Management assumptions solely for method demonstration; USD millions.
The illustrative table produces USD 6.5 million, slightly above the USD 5.6 million amount used in the acquisition reconciliation because management separately deducts ownership and inventorship remediation. Both values are assumptions for method demonstration. A real model should show the bridge transparently and avoid hiding risk in a single percentage.
Replacement cost is most useful as a reasonableness indication and negotiation floor when the buyer genuinely needs comparable capability. It can be misleading when the technology has no plausible market, the claims are weak or a better open alternative exists. The buyer should compare cost with the decision value of building, licensing, partnering or proceeding without the portfolio.
9 Build risk-adjusted income and relief-from-royalty indications
The income approach values expected cash attributable to the portfolio. Relevant cash can include incremental product margin protected by claims, avoided licence fees, licensing receipts, reduced redesign cost and acceleration. The model should deduct continuing prosecution, maintenance, enforcement, monitoring, product-development and commercialisation costs. WIPO's income-method guidance emphasises technology, market, legal, timing and useful-life risks [34-38].
Relief from royalty estimates the present value of hypothetical royalties avoided through ownership. The royalty base must match the covered product or function. The rate should reflect comparable rights, exclusivity, territory, remaining term, development stage and the allocation of supporting assets. A headline rate from an unrelated sector or mature licence is weak evidence for an early AI portfolio.
The royalty base should be apportioned when claims cover only one component. If a patent covers inference scheduling within a larger platform, applying a royalty to total platform revenue can overstate value. The model should identify the smallest economically coherent base and test whether comparable licences use a similar base.
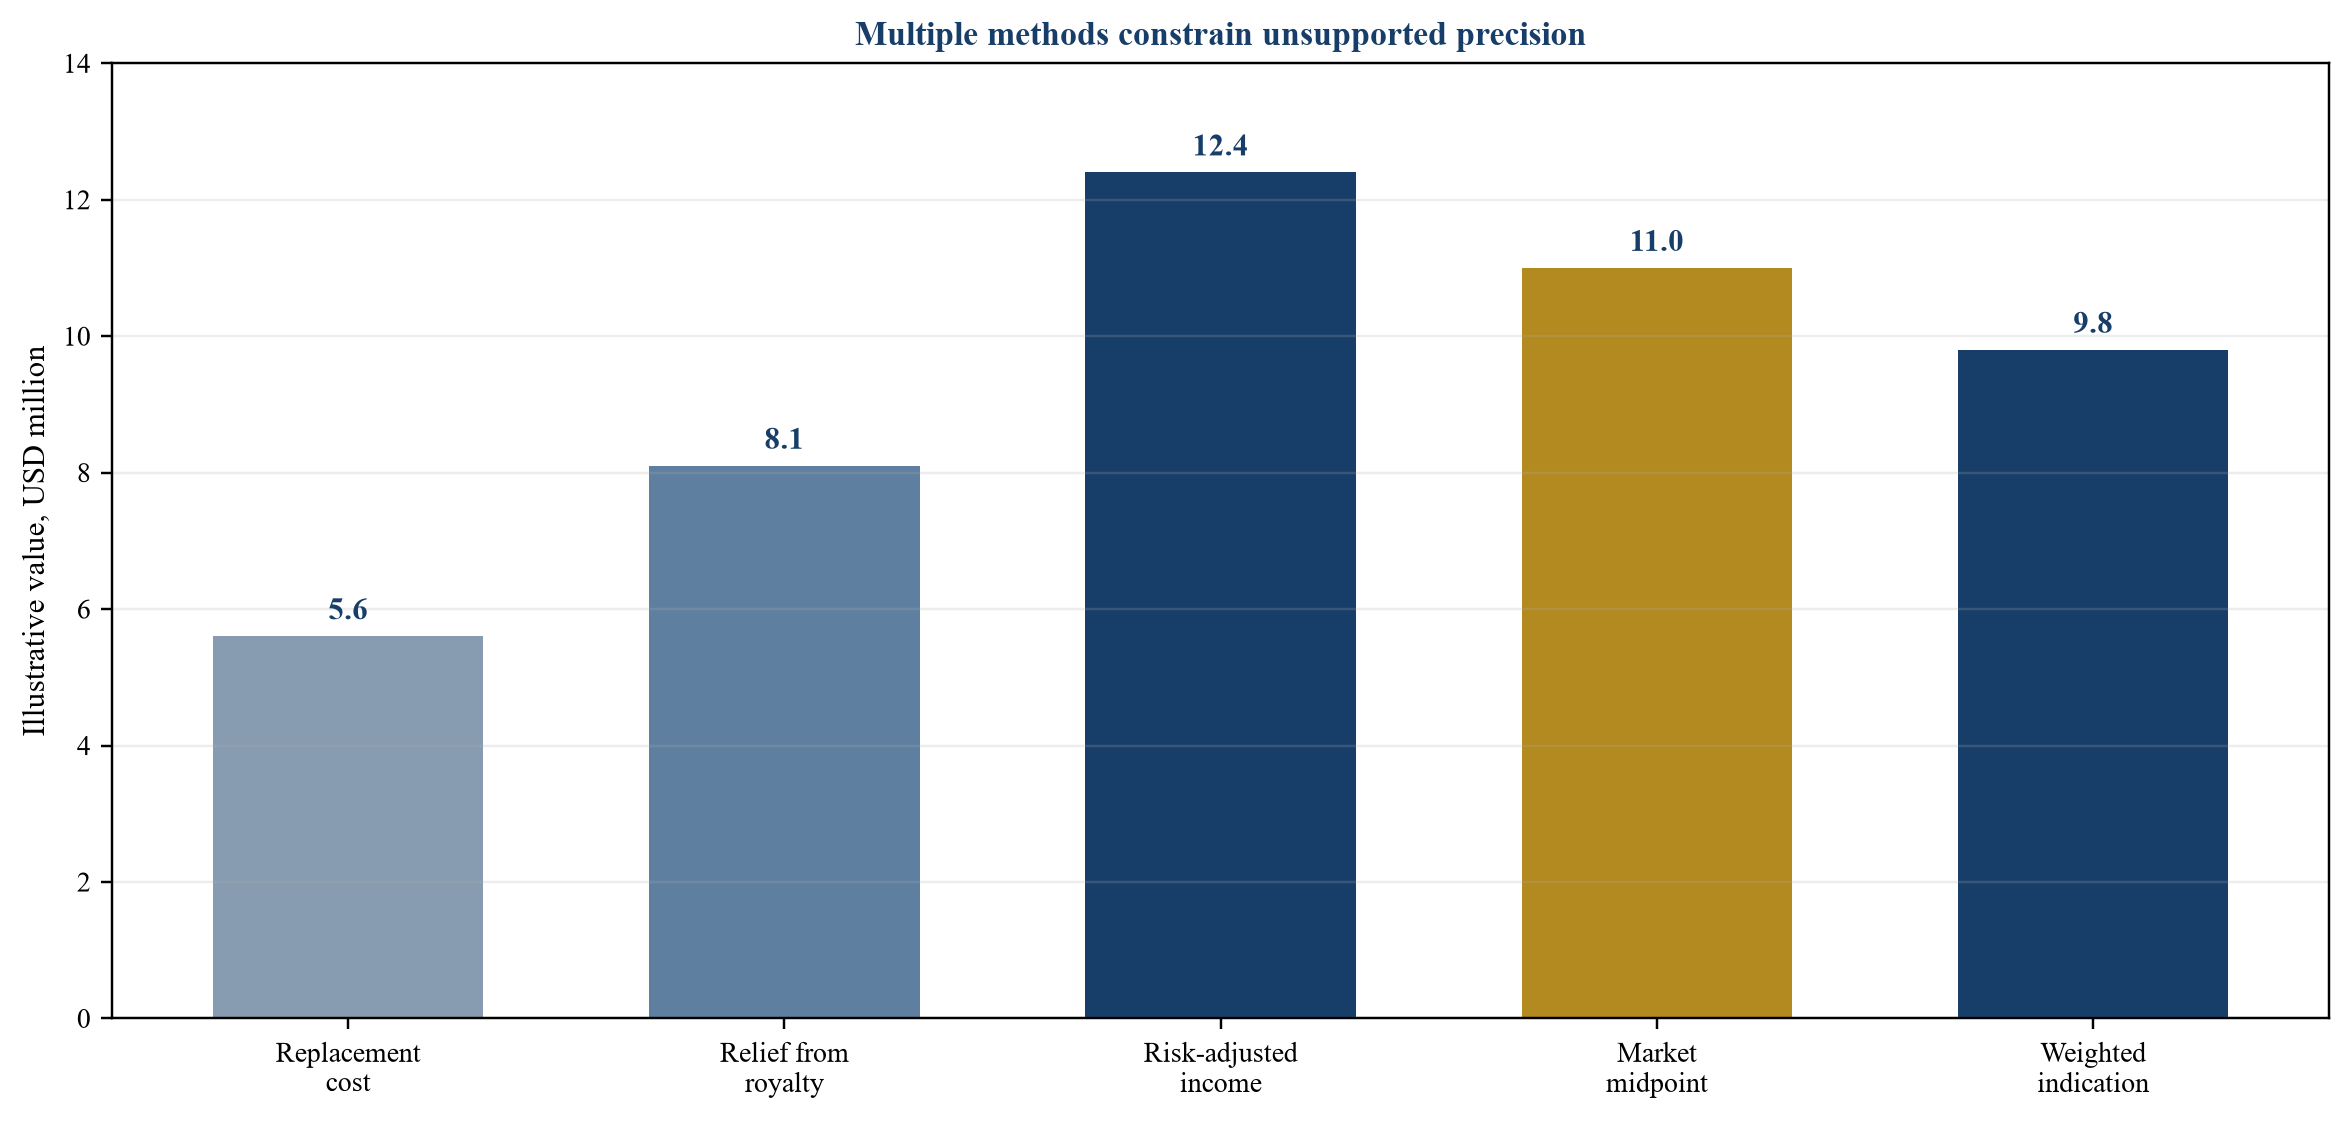
All amounts are management assumptions solely for method demonstration; USD millions.
Risk can be represented through scenarios and conditional probabilities. A model can assign claim-survival, technical-proof, adoption and scale outcomes at explicit gates. The discount rate should address time and systematic risk without duplicating risks already reflected in probability-weighted cash flows. Finance should document the treatment and test sensitivity.
The illustrative acquisition assumes risk-adjusted incremental cash flows with a present value of USD 12.4 million. Relief from royalty produces USD 8.1 million. These amounts rely on assumed product revenue, claim coverage, apportionment, royalty rate, useful life, tax and discount rate. They are not observable market benchmarks.
Income analysis should also test downside asymmetry. An invalid claim may reduce the protection value to zero while the product retains ordinary business value. An adverse FTO outcome can create redesign cost, delay or licence obligations beyond the value assigned to owned patents. The acquisition model should therefore include both asset value and associated exposure.
10 Use market evidence with disciplined comparability
Market transactions can provide ranges for royalty rates, milestone structures and prices. Patent deals are often confidential, bundled with know-how, litigation settlements, products, people or cross-licences. Announced consideration can include contingent payments and strategic terms. Comparability requires adjustment for technology, claim scope, legal status, territory, exclusivity, development stage, remaining life and transaction purpose.
Public company filings, court records, competition decisions, technology-transfer disclosures and patent-pool terms can provide evidence. The evidence should be traced to original documents where possible. Secondary databases can identify candidates and may omit definitions, side terms or failed deals. The model should record source quality and every adjustment.
An auction for a distressed portfolio may reflect seller liquidity rather than strategic value. A litigation settlement can reflect avoided legal cost and uncertainty. A university licence can include sponsored research and equity. A mature standard-essential portfolio has a different royalty context from an unproven AI workflow patent. These distinctions should be explicit.
The illustrative market corridor of USD 6 million to USD 16 million is a management assumption. The wide range reflects incomplete comparability. Its midpoint does not become fair value automatically. It serves as a boundary check against cost and income indications.
| Comparability factor | Evidence required | Direction of adjustment | Key caution |
|---|---|---|---|
| claim status and scope | granted claims and claim charts | stronger or broader supported scope may increase value | avoid counting application breadth as granted scope |
| development stage | technical, product and revenue milestones | greater proof may increase value | stage can interact with buyer-specific capability |
| legal life and territory | maintenance and target-market coverage | longer relevant life may increase value | economic life can remain shorter |
| exclusivity and field | licence restrictions and retained rights | broader exclusivity may increase price | exclusivity can reduce licensor options |
| bundled assets | know-how, code, data and people | remove value of non-patent assets | deal consideration may be indivisible |
| strategic context | litigation, distress or cross-licence | context-specific | observed price may settle several disputes |
| payment structure | upfront, milestone, royalty and earn-out | convert to expected present value | headline maximum can overstate expected value |
Proposed comparability analysis; adjustments require documented transaction evidence.
Market evidence becomes stronger when several independent transactions support a consistent range and the adjustments are modest. When evidence is sparse, the board should accept a wider range and rely on transaction protections rather than manufacture precision.
11 Reconcile methods and expose concentration
Reconciliation should weight evidence quality, not average methods mechanically. Replacement cost can be useful where the buyer needs comparable capability. Income methods can be strongest when claim-to-product mapping and commercial scenarios are credible. Market evidence can constrain the result when comparables are genuinely similar. Real options can illuminate staged decisions before product-market proof [33-38].
The illustrative reconciliation uses USD 5.6 million replacement cost, USD 8.1 million relief from royalty, USD 12.4 million risk-adjusted income and an USD 11 million market midpoint. Management assigns the greatest weight to income and royalty analyses because they connect to a defined product roadmap, while retaining cost as a downside reference. The resulting USD 9.8 million is an evidence-weighted indication, not a mathematical certainty.
Concentration should be shown separately. Management assumes that three families account for 62% of indicated value. One family covers a planned inference-control function; one supports deployment on constrained hardware; and one provides cross-licensing leverage. If the first family loses material scope, the portfolio indication falls by an assumed USD 2.7 million. The board should see this dependency before approving price.
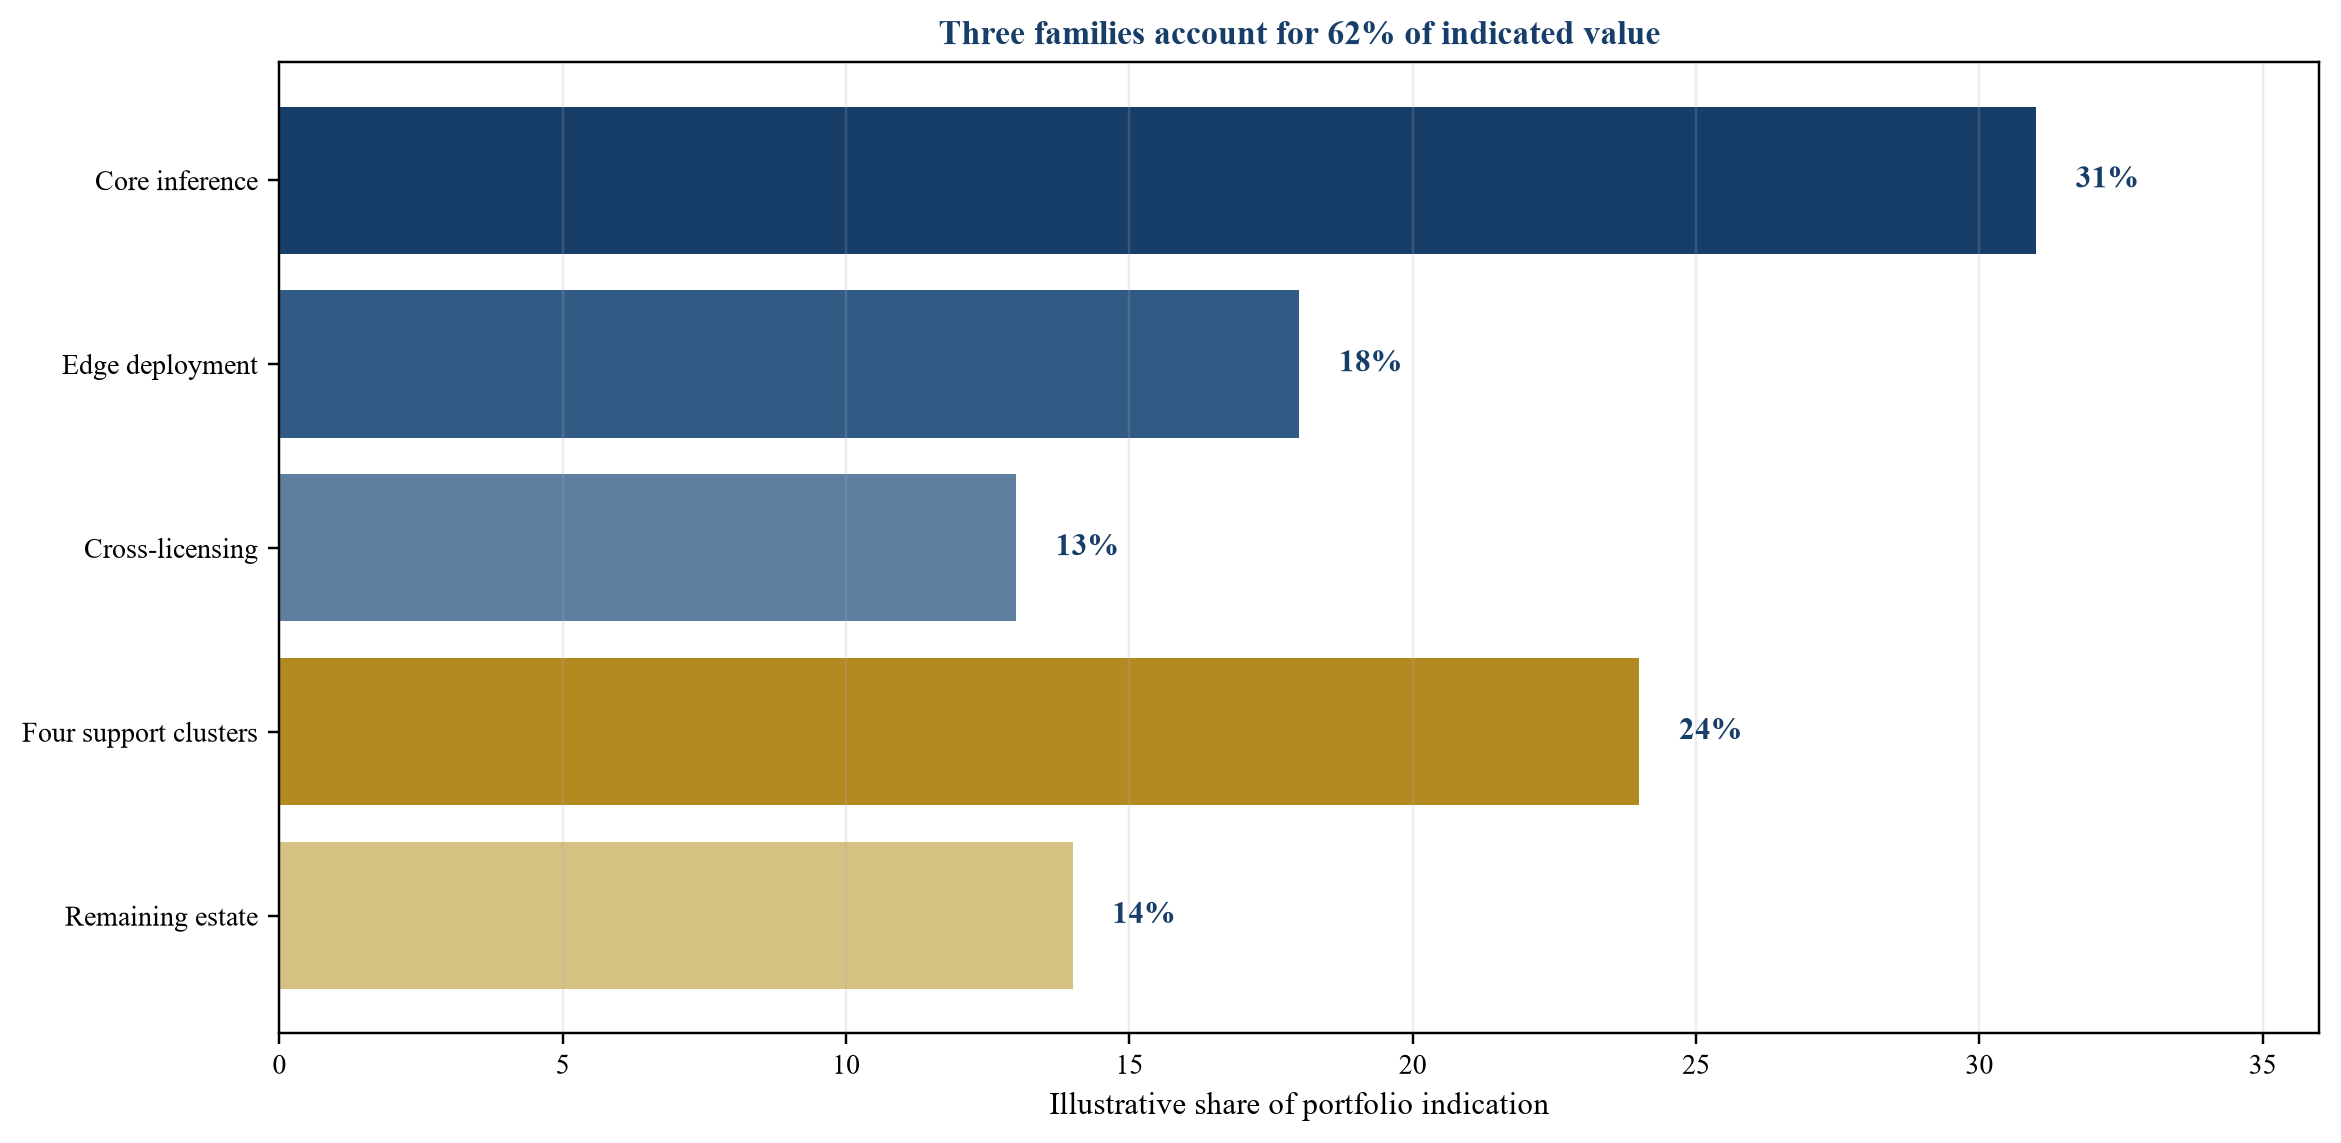
All percentages and amounts are management assumptions solely for method demonstration.
The reconciliation should state the valuation date, purpose, premise, standard, unit of account, currency, tax treatment and buyer-specific assumptions. Fair value, investment value and negotiated price can differ. Accounting recognition under IAS 38, IFRS 3 and IFRS 13 follows specific requirements and should not be equated with the board's acquisition decision [27-32].
12 Convert uncertainty into transaction structure
Uncertainty can be allocated through price and terms. A buyer can pay less upfront and use milestones linked to claim allowance, opposition outcome, technical performance, paid deployment or licensing receipts. The milestone should be observable, within a defined period and protected against manipulation. It should specify who controls prosecution, product choices and settlement.
Representations should address ownership, inventorship, assignments, maintenance, disclosed challenges, licences, encumbrances, government or university rights, employee and contractor obligations, open-source use, source-code control and material FTO work. The seller's knowledge qualifiers and disclosure schedule should match the evidence. Indemnities, escrow and retention should be tailored to identified exposures.
Prosecution control matters when value depends on pending claims. The buyer should define responsibility for responses, amendments, continuations, foreign filings, abandonment, fees and settlement before closing and during any earn-out. A seller should not be judged on a milestone while the buyer can unilaterally narrow the claim or stop prosecution without agreed consequences.
Licensing rights can bridge valuation gaps. The buyer may acquire core fields and territories while the seller retains other applications. A call option can cover future fields. A licence-back can preserve the seller's existing products. A cross-licence can solve FTO constraints. Each structure requires careful scope, improvements, enforcement, sublicensing, audit, change-of-control and termination provisions.
| Identified uncertainty | Economic effect | Potential transaction term | Verification event |
|---|---|---|---|
| pending core claims | scope may narrow or fail | allowance milestone and deferred price | specified allowed claim language |
| inventorship or ownership gap | transfer and enforceability risk | remediation condition, escrow and indemnity | executed assignment and counsel confirmation |
| unproven technical performance | product cash may not emerge | technical milestone and funded validation | agreed independent benchmark |
| limited customer proof | adoption and pricing uncertainty | revenue or paid-deployment earn-out | collected cash under defined contracts |
| third-party blocking right | licence, redesign or delay | closing condition and price adjustment | licence, opinion or completed redesign |
| value concentration | one adverse event can impair portfolio | retention and family-specific protection | survival or replacement of named claim cluster |
| continuing prosecution dependence | buyer actions affect outcome | prosecution covenant and joint committee | documented decisions and deadlines |
Proposed transaction architecture; counsel should draft terms for the specific facts and law.
Transaction terms should preserve operating speed. An earn-out that requires disputes over patent quality or hypothetical value can damage integration. Milestones tied to objective claim events and collected revenue are generally easier to administer. The board should compare the expected cost of complexity with the valuation gap being bridged.
13 Govern the portfolio after closing
Post-close governance should connect patents to product and capital allocation. A portfolio committee can include patent counsel, engineering, product, finance, security and commercial leaders. It should review claim maps, roadmap changes, competitor products, FTO developments, prosecution decisions, maintenance costs, licensing opportunities and evidence quality.
The first 100 days should reconcile the official register, docket, ownership records and payment instructions. Core files should move to controlled repositories. Inventor and technical interviews should capture tacit knowledge. Product teams should validate claim charts against current code and architecture. Identified ownership or inventorship remediation should be completed promptly.
The committee should assign a role to every material family. Core protection, blocking, defensive, licensing, option and exit candidates require different actions. Maintenance should be justified by forward value rather than sunk cost. Abandonment decisions should consider public disclosure, competitor benefit, contractual obligations and continuation strategy.
Evidence should be refreshed. Competitor products change, claims issue or narrow, and customer priorities move. A quarterly review can track legal status, product mapping and commercial proof. A deeper annual valuation can support impairment, tax, licensing, financing or portfolio strategy where required. The review should retain a record of assumptions and decisions.
Enforcement readiness should be proportionate. The owner should preserve claim charts, product evidence, notice procedures and decision authority. Litigation is one path among licensing, business resolution, cross-licensing and design response. The expected return should include cost, timing, discovery, counterclaims, reputational effects and management attention.
Portfolio governance should also generate new inventions. Engineering retrospectives, customer deployment problems and architecture changes can reveal patentable technical contributions. Disclosure review should occur before public release. Inventorship records should be created during development, including the role of AI tools where relevant. This discipline improves future diligence even when the company decides to protect an innovation as a trade secret.
14 Board decision framework and conclusion
The board should receive a decision paper that separates verified facts, management assumptions, specialist opinions and unresolved items. It should include the family map, ownership chain, claim charts, jurisdictional status, FTO analysis, product linkage, evidence ladder, method calculations, concentration and proposed transaction protections.
Five questions should govern the decision. First, which claims and jurisdictions can affect the buyer's planned products? Second, what evidence supports validity, ownership, inventorship and enforceability? Third, what cash flow or strategic option changes because the buyer owns the portfolio? Fourth, what third-party rights and design-arounds affect the net position? Fifth, which price and terms remain acceptable under downside scenarios?
The approval should record the valuation purpose and date, the supported range, the assumed operating plan, the dependencies that could change value and the responsible owners for remediation. It should state the maximum upfront consideration, contingent consideration, required protections and walk-away conditions. A single headline value without this record is insufficient for capital allocation.
An AI patent portfolio before product-market proof is a set of conditional rights and options. Value rises when claims are legally coherent, technically relevant, observable in products, difficult to avoid and connected to a plausible route to customer cash. Value falls when ownership is incomplete, scope is narrow, proof is absent, blocking rights exist or the roadmap has moved away from the inventions.
The appropriate response is disciplined uncertainty. Claim-level diligence, jurisdictional analysis, product mapping, FTO work and staged commercial evidence create a defensible range. Multiple valuation methods test the result from different directions. Transaction structure allocates risks that cannot be resolved before closing. Post-close governance protects the assets and keeps them connected to engineering and commercial decisions.
For the illustrative acquisition, management's evidence-weighted indication is USD 9.8 million. That figure is useful only within the stated assumptions. A real buyer should replace every assumption with portfolio-specific evidence and retain qualified legal, technical, tax, accounting and valuation advisers.
Sources
- WIPO, Frequently Asked Questions: Patents. Read the primary source
- WIPO, Inventing the Future: An Introduction to Patents for Small and Medium-sized Enterprises. Read the primary source
- WIPO, PATENTSCOPE Glossary. Read the primary source
- WIPO, WIPO INSPIRE. Read the primary source
- WIPO, Identifying Inventions in the Public Domain. Read the primary source
- WIPO, Identifying Inventions in the Public Domain: A Guide for Inventors and Entrepreneurs. Read the primary source
- WIPO, TISC Toolkit: Freedom to Operate. Read the primary source
- EPO, What are good indicators of patent value? Read the primary source
- OECD, Measuring Patent Quality. Read the primary source
- EPO, Guidelines for Examination 2025: Artificial Intelligence and Machine Learning. Read the primary source
- EPO, Guidelines for Examination 2025: Patentability. Read the primary source
- EPO, Guidelines for Examination in the European Patent Office 2025. Read the primary source
- USPTO, Inventorship Guidance for AI-Assisted Inventions. Read the primary source
- USPTO, FAQs on Inventorship Guidance for AI-Assisted Inventions. Read the primary source
- USPTO, AI-Assisted Inventorship Guidance and Examples. Read the primary source
- United States Court of Appeals for the Federal Circuit, Thaler v Vidal opinion. Read the primary source
- USPTO, Subject Matter Eligibility. Read the primary source
- UK Intellectual Property Office, Manual of Patent Practice: Section 1 Patentability. Read the primary source
- UK Intellectual Property Office, Artificial Intelligence: A Worldwide Overview of AI Patents. Read the primary source
- UK Intellectual Property Office, Manual of Patent Practice. Read the primary source
- United States Code, Title 35, Section 101. Read the primary source
- United States Code, Title 35, Section 112. Read the primary source
- USPTO, Manual of Patent Examining Procedure. Read the primary source
- OECD, Patent Quality and Research Productivity: Measuring Innovation with Multiple Indicators. Read the primary source
- OECD, OECD Patent Statistics Manual. Read the primary source
- EPO, PATSTAT. Read the primary source
- IFRS Foundation, IAS 38 Intangible Assets. Read the primary source
- IFRS Foundation, IAS 38 issued standard. Read the primary source
- IFRS Foundation, IFRS 3 Business Combinations. Read the primary source
- IFRS Foundation, IFRS 13 Fair Value Measurement. Read the primary source
- IFRS Foundation, IAS 36 Impairment of Assets. Read the primary source
- IFRS Foundation, IAS 37 Provisions Contingent Liabilities and Contingent Assets. Read the primary source
- WIPO, Valuing Intellectual Property Assets. Read the primary source
- WIPO, Intellectual Property Valuation Basics for Technology Transfer Professionals. Read the primary source
- WIPO, IP Valuation Methods. Read the primary source
- WIPO, The Cost Method. Read the primary source
- WIPO, The Income Approach. Read the primary source
- WIPO, Valuation Basics for Technology Transfer Professionals. Read the primary source
- WIPO, Patent Landscape Report: Generative Artificial Intelligence. Read the primary source
- WIPO, Generative AI Patent Landscape Report. Read the primary source
- WIPO, GenAI Patent Trends in Models. Read the primary source
- WIPO, SPARK Patent Trends Update in GenAI. Read the primary source
- WIPO, Technology Trends: Artificial Intelligence. Read the primary source
- European Commission, Standard Essential Patents. Read the primary source
- European Commission, Guidelines on Technology Transfer Agreements. Read the primary source
- United States Department of Justice and Federal Trade Commission, Antitrust Guidelines for the Licensing of Intellectual Property. Read the primary source
- European Patent Office, Espacenet. Read the primary source
- USPTO, Patent Center. Read the primary source
- WIPO, PCT International Patent System. Read the primary source
- WIPO, List of Documents on IP Valuation. Read the primary source
