

1. The AI value problem is an evidence problem
Boards can approve an AI strategy while remaining unable to answer a simpler question: what has changed in the economics of the business? The gap usually appears because technology, operations and finance measure different objects. A technology team measures accuracy, latency, throughput or token cost. An operating team measures cycle time, exception volume or employee adoption. Finance measures revenue, payroll, supplier expense, working capital, provisions and cash. The board needs a controlled bridge across all three views.
An AI use case creates value only through a business mechanism. A document model can reduce manual extraction; the financial effect depends on volume, error correction, employee capacity, service-level commitments and the decision management makes about released time. A sales assistant can increase relevant outreach; the financial effect depends on conversion, gross margin, sales capacity, customer quality and displacement of other activity. A predictive-maintenance system can improve warning time; the cash effect depends on avoided downtime, maintenance choices, inventory, contractual penalties and the reliability of the comparison baseline.
The AI Value Office is a management control that follows the mechanism from intervention to cash. It does not claim that every effect is precisely measurable. It requires each estimate to state what is observed, what is calculated, what is assumed, who approved the method, and what evidence could disconfirm it. A board can then distinguish realised value, evidence-supported run-rate value, conditional potential and strategic option value.
The office also controls portfolio waste. A weak initiative can consume model licences, integration capacity, data work, user training, change management, security review and executive attention long after its original sponsor has moved on. A single portfolio register exposes duplicative systems, hidden experimentation, overlapping vendors and initiatives with no accountable benefit owner. Retirement becomes an ordinary capital-allocation decision.
The operating objective is auditable management evidence. Auditability here means that a competent reviewer can trace the claimed effect to controlled source data, reproduce the calculation, inspect key assumptions and identify the responsible approvers. External assurance and statutory-audit conclusions require the relevant qualified professionals and applicable standards.
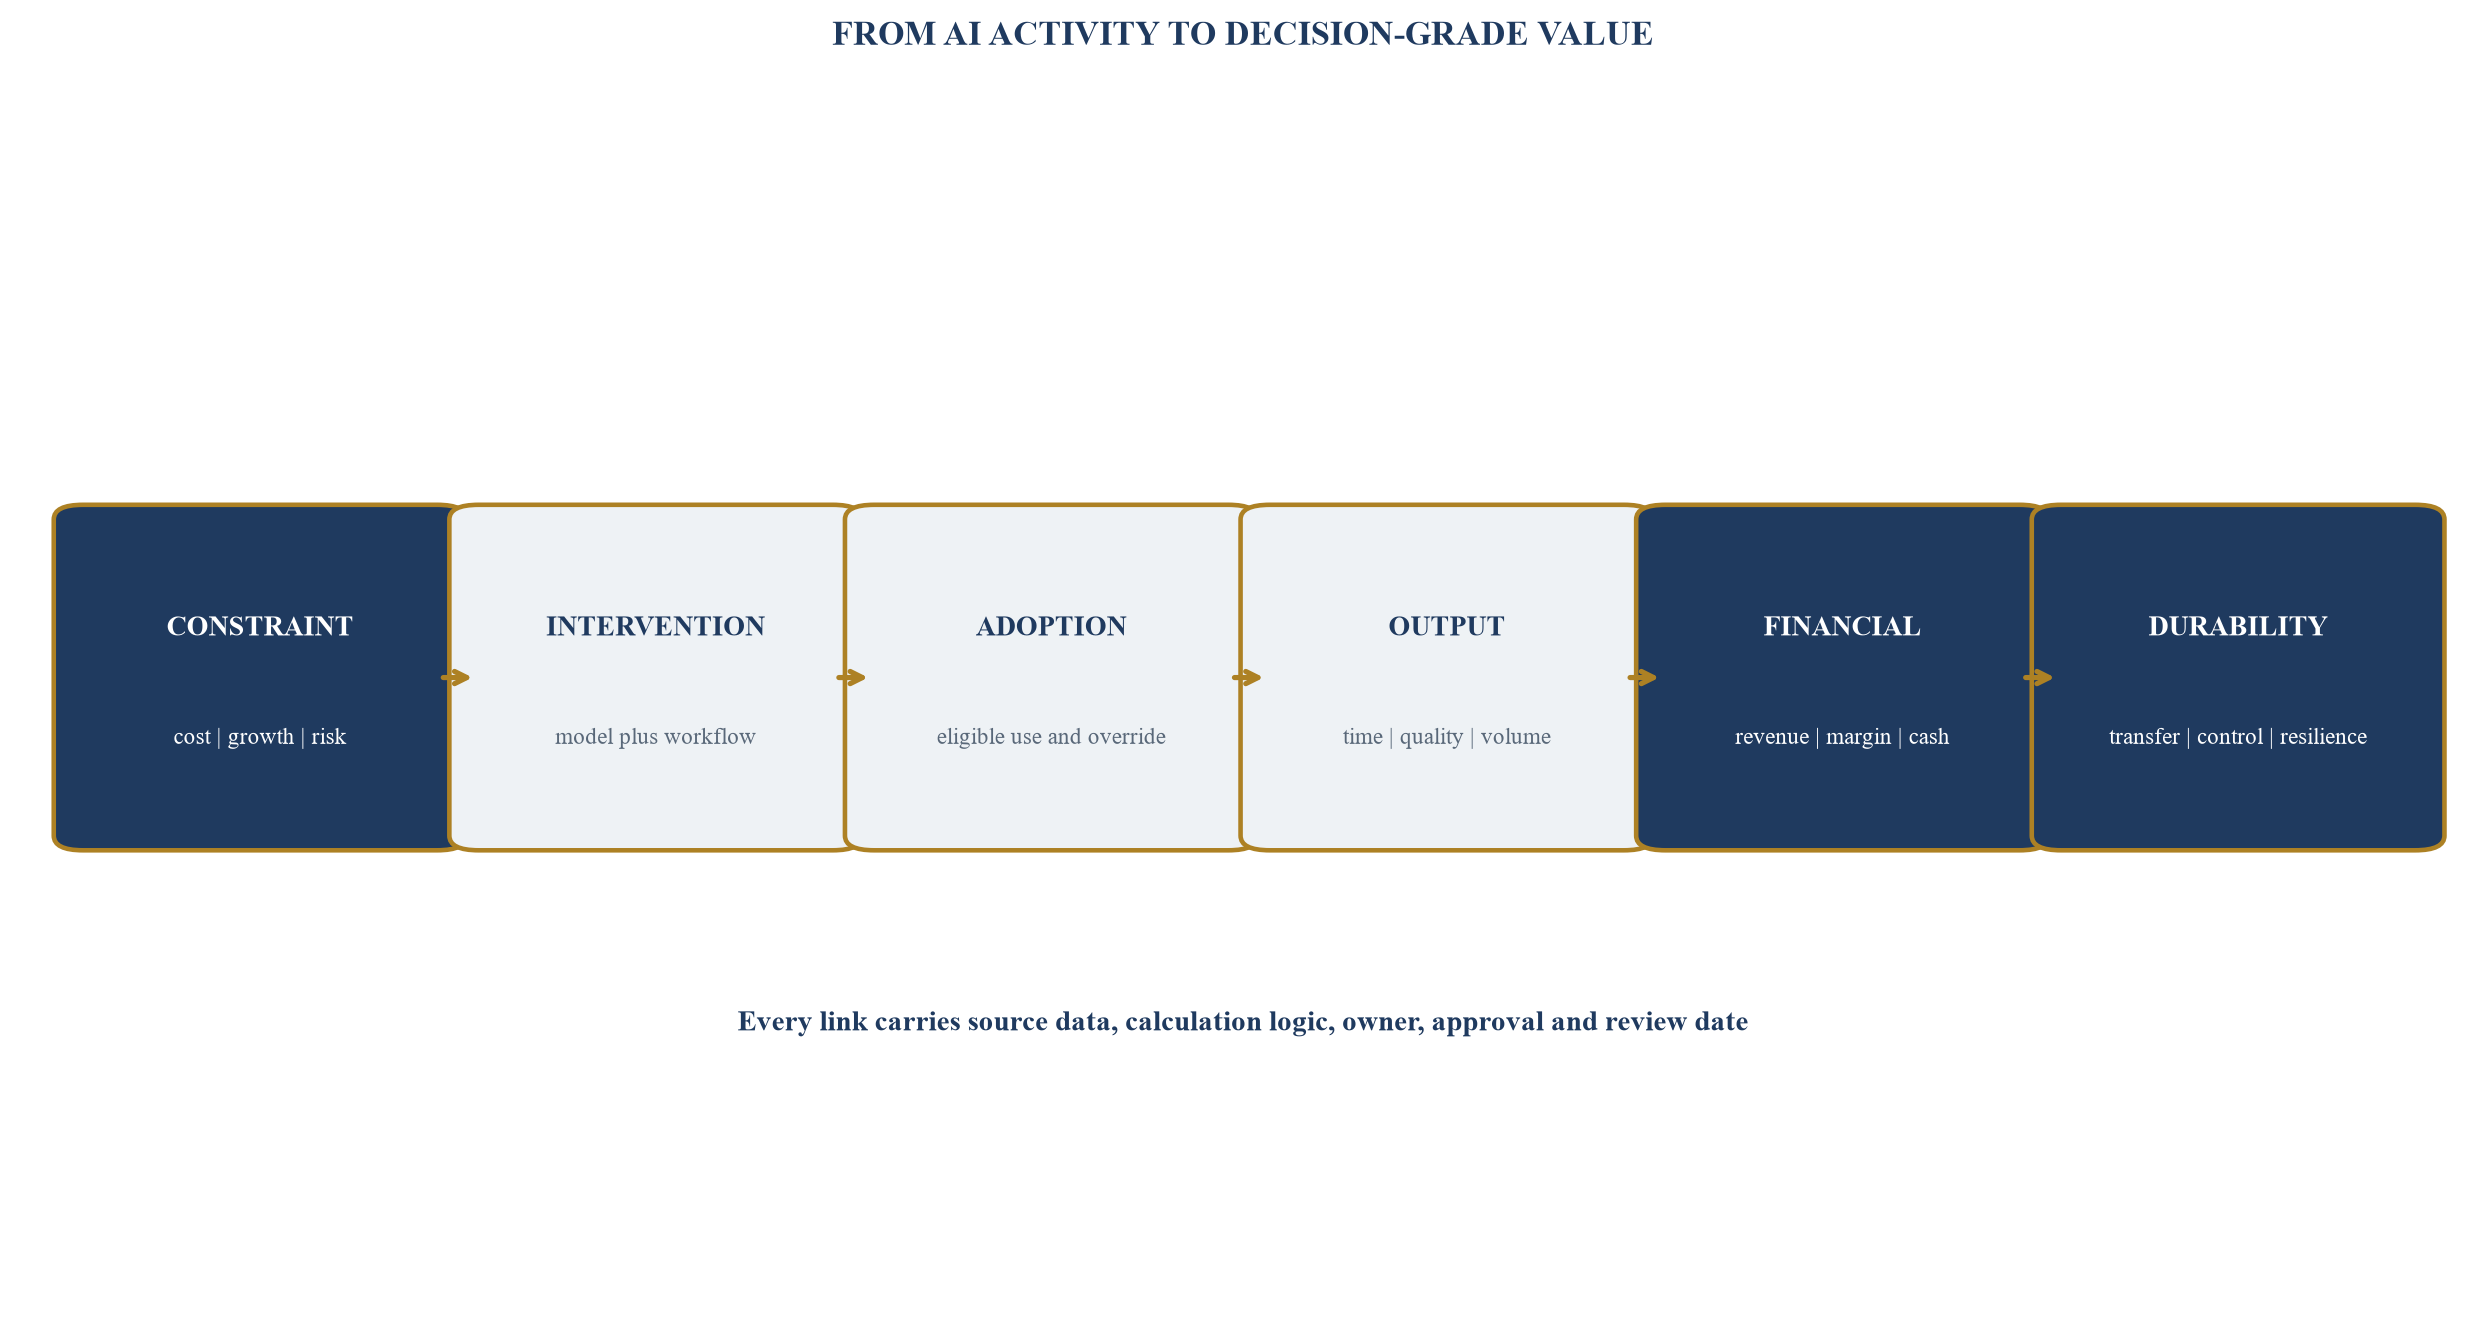
Value reaches the board only when technical output is connected to a controlled financial consequence and an explicit durability assessment.
2. Establish the mandate and decision rights
The AI Value Office needs a board-approved mandate because it arbitrates between attractive narratives and scarce capital. Its scope should include material AI systems developed internally, purchased from vendors, embedded in software, introduced through an acquisition, and used through employee-controlled tools. Materiality can reflect financial exposure, customer impact, regulatory consequence, operational criticality, data sensitivity and reputational risk.
The CFO should own benefit policy, portfolio economics and the connection to budgeting, forecasting, accounting and investment approval. The COO or relevant business executive should own the changed process and realised operating outcome. The CIO, CTO, chief data officer or AI leader should own architecture, technical performance, data and technology delivery. Risk, compliance, legal, privacy, cybersecurity and model-risk functions should document their conclusions within their mandates. Internal audit can assess whether the governance and evidence system operates as designed; it should retain organisational independence.
Decision rights must be specific. The office defines which use cases enter the portfolio, which evidence is required at each gate, who approves a baseline, who can authorise production deployment, who signs off a benefit, who accepts residual risk, and who can retire a system. A steering committee without explicit decisions can become a reporting forum that leaves ownership dispersed.
The office should remain small. It needs a portfolio lead, finance controller, benefits analyst, data or measurement specialist and access to relevant risk and technology expertise. Initiative teams remain responsible for delivery. The office supplies policy, challenge, comparability and an evidence repository. A central team that tries to operate every system will create a bottleneck and weaken business ownership.
Regulatory and standard-setting materials support lifecycle accountability. NIST's AI Risk Management Framework organises activity around govern, map, measure and manage. The OECD AI Principles emphasise traceability, systematic risk management and accountability according to role and context. GAO's accountability framework uses governance, data, performance and monitoring. These frameworks do not determine a company's accounting treatment or investment return; they support the design of documented oversight.
Table 1. AI Value Office decision rights
| Decision | Accountable owner | Required evidence | Independent challenge | Escalation trigger |
|---|---|---|---|---|
| enter portfolio | business sponsor | defined constraint, users, workflow, data and intended outcome | value-office portfolio lead | duplicate capability, prohibited use or no accountable owner |
| approve baseline | finance controller | metric definition, source, period, segmentation and known changes | data or measurement specialist | unavailable source data or unstable process definition |
| approve pilot | business and technology executives | design, controls, cost envelope, success and stop conditions | risk, legal, privacy and security according to scope | customer impact, sensitive data or material automation |
| recognise benefit | CFO delegate | observed outcome, counterfactual, cost stack, attribution and sign-off | controller or internal assurance | material estimate, double counting or unsupported assumption |
| approve scale | investment committee | repeatability, capacity plan, unit economics, resilience and control status | finance and risk challenge | concentration, model drift or unresolved material finding |
| retire or replace | accountable business executive | declining value, cost, dependency, transition and record-retention plan | technology, finance and control functions | critical service, contractual dependence or data-transfer issue |
Titles vary by organisation. The control objective is an explicit owner for each decision and a preserved evidence trail.
3. Build one portfolio register
The portfolio register is the authoritative map of initiatives and systems. Each row needs a unique identifier, sponsor, process owner, users, business constraint, intended decision, model or vendor, data sources, geography, customer exposure, regulatory relevance, stage, approved spend, recurring cost, expected benefit mechanism, benefit owner, control status and next gate date. The register should connect to technical inventories and risk records without duplicating their detailed content.
Scope should extend beyond projects labelled AI. The Bank of England and FCA reported that firms expected risk from embedded or hidden models to increase. An application may introduce AI through a software update, workflow automation or third-party feature without a new capital request. Procurement, architecture and business owners therefore need a route to identify embedded systems and record their use.
The register should group initiatives by business mechanism rather than by fashionable technology. Useful groups include revenue quality, pricing, customer acquisition, service delivery, working capital, risk loss, compliance, employee capacity and strategic capability. This makes competing proposals comparable. Two different models that address the same collections bottleneck should compete for the same outcome rather than appear as separate innovation successes.
Dependencies belong in the portfolio view. Several initiatives may rely on one foundation-model provider, one data source, one orchestration platform or one small internal team. The Bank of England and FCA survey reported material concentration among external cloud, model and data providers. Concentration can turn a set of apparently diversified benefits into one operational and commercial exposure.
The register should also record rejected and retired initiatives. A portfolio that shows only active work conceals the quality of capital allocation. Rejection reasons help improve future proposals. Retirement data reveal whether a use case failed because of low adoption, poor data, unacceptable risk, weak economics, vendor change, process redesign or a better alternative. The evidence becomes an institutional learning asset.
4. Use six gates matched to six decisions
The first gate, define, asks whether the business constraint is important and whether AI is an appropriate intervention. The team states the current process, affected population, decision frequency, loss or opportunity, alternatives and accountable owner. A simple rules engine, workflow redesign or data-quality repair may solve the problem with lower lifecycle cost and risk.
The second gate, baseline, establishes how the current process performs. The baseline has a metric dictionary, source system, observation period, segmentation, volume, variance, exception profile and known external changes. A sales conversion baseline should distinguish product, channel, region, cohort and sales capacity. A service-cost baseline should distinguish total payroll from activity that can actually be changed or redeployed.
The third gate, pilot, tests technical and workflow feasibility within a bounded population. The design specifies eligible users, data, model version, human oversight, comparison group, success criteria, stop conditions, incident path and cost ceiling. A pilot should be large enough to test the mechanism and small enough to contain operational consequences.
The fourth gate, prove, asks whether the observed change is attributable, repeatable and economically positive after full cost. The team tests alternative explanations, reconciles data, quantifies uncertainty and documents risk-adjusted downside. Finance signs the benefit classification. The fifth gate, industrialise, addresses integration, reliability, support, vendor terms, change management, data pipelines, controls and operating ownership.
The sixth gate, scale or retire, allocates further capital based on marginal economics and durability. Scale can mean more users, geographies, decisions, data or automation. Each extension changes risk and may change regulation, control needs and unit cost. Retirement remains an affirmative option when the evidence weakens.
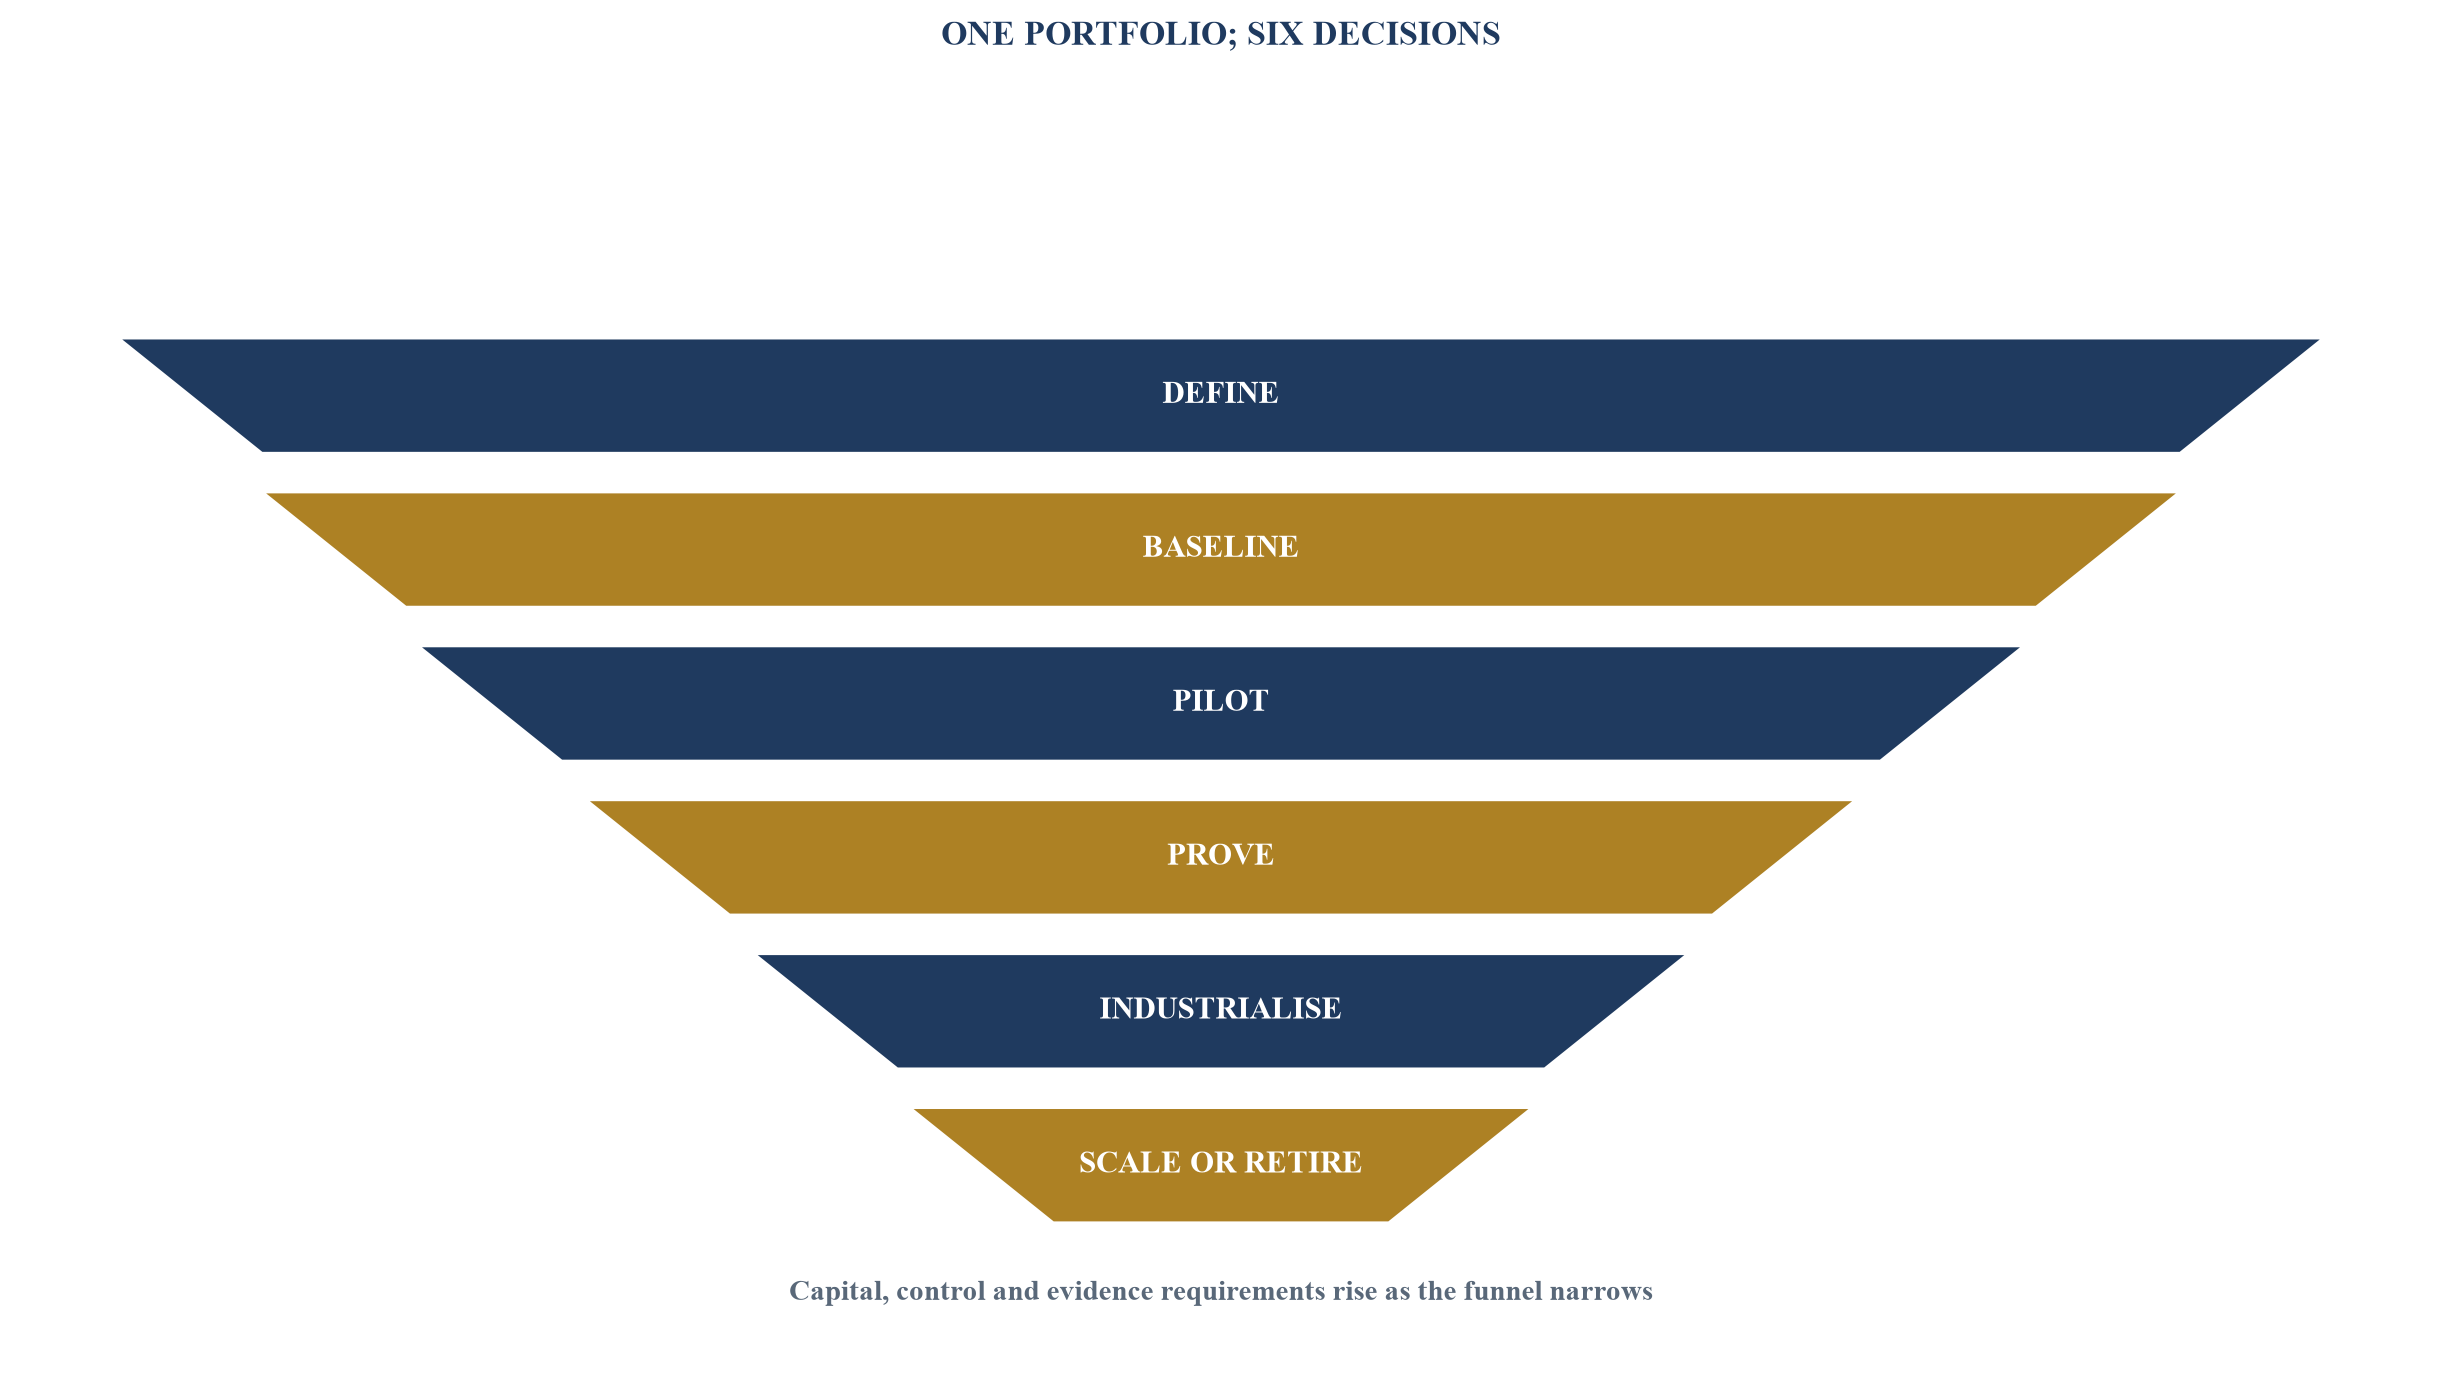
Each gate answers a different decision. Advancement requires evidence proportionate to capital, customer impact and risk.
5. Define benefits before measuring them
Benefit categories should correspond to financial statements and cash decisions. Revenue benefits include incremental volume, price, conversion, retention or product mix. Gross-margin benefits include reduced variable input, service effort, error correction or fulfilment cost. Operating-expense benefits include removed external spend, avoided hiring, redeployed internal capacity or eliminated activity. Working-capital benefits include faster billing, collections, inventory release or better payment timing. Risk benefits include reduced expected loss, control failures, fraud, downtime or regulatory remediation.
Each category requires a recognition rule. Incremental revenue should be measured net of cannibalisation, discounts, returns, commissions, fulfilment cost and capacity constraints. Cost savings should distinguish cash removed, spend avoided, capacity released and capacity redeployed. Hours saved are an operational output. They become a financial benefit through a management action such as lower overtime, avoided contractor spend, reduced hiring, higher productive volume or a documented service-level improvement.
Risk reduction needs expected-value discipline. Management can state exposure, event frequency or probability range, severity, control effect and residual uncertainty. A rare-event estimate should remain separate from recurring realised P&L. Avoided losses should not be added mechanically to revenue and cost savings. The board needs a distinct risk-value view and clear assumptions.
Strategic option value also belongs outside realised benefit. A governed data platform, reusable model capability or new customer proposition may create future choices. The office can record milestones, addressable decisions and evidence still required. A strategic option should not be presented as current revenue or cash.
Benefit definitions should remain stable across the portfolio. If every initiative creates its own language, finance cannot rank them or detect overlap. A shared taxonomy also helps the company explain why a technically successful system may have limited financial effect and why a modest model embedded in a high-volume process may create greater value.
Table 2. Benefit-recognition protocol
| Benefit class | Operational evidence | Financial bridge | Recognition boundary | Common overstatement |
|---|---|---|---|---|
| incremental revenue | eligible population, offers, conversion, retention and cohort performance | volume times net price less variable delivery and acquisition cost | observed incremental contribution with controlled comparison | attributing market growth or channel shift to the model |
| cash cost removed | supplier termination, payroll change, overtime or consumption reduction | ledger expense and cash payment before and after intervention | realised reduction net of transition and recurring AI cost | counting a negotiated saving and the same invoice reduction twice |
| spend avoided | approved demand, capacity plan and displaced purchase or hiring event | forecast cost with and without intervention | separately reported management estimate with evidence | treating an unapproved plan as committed expenditure |
| capacity redeployed | measured hours, workflow volume and new productive use | output, service or revenue created by the released capacity | recognised only when redeployment is evidenced | valuing every saved hour at loaded salary |
| working-capital release | billing, collection, inventory or payment-cycle change | cash conversion and balance movement | one-time release separated from recurring P&L | annualising a balance-sheet release as profit |
| risk reduction | exposure, event path, control performance and residual risk | expected-loss or scenario range | separate risk-value register unless an accounting effect is established | reporting gross exposure as realised annual benefit |
Accounting presentation and assurance conclusions require applicable standards and professional judgement. The table is a management-evidence protocol.
6. Build the counterfactual hierarchy
Attribution asks what would probably have happened without the intervention. The strongest practical design depends on context. Randomised controlled trials can compare eligible units assigned to different treatments when ethics, operations and sample size permit. Phased rollouts create contemporaneous comparison groups. Matched cohorts compare similar customers, employees, assets or cases. Difference-in-differences designs compare changes across affected and unaffected groups. Interrupted time series can test a stable process before and after deployment while accounting for trend and seasonality.
A simple before-and-after comparison is weaker when pricing, staffing, demand, product, policy or season changed at the same time. The office should preserve a change log and test whether those factors explain part of the outcome. Management judgement remains useful; it should be visible rather than embedded silently in a spreadsheet.
The measurement unit must match the mechanism. A customer-level recommendation requires customer or opportunity cohorts. A document-processing intervention requires comparable document types and complexity. Predictive maintenance requires equipment, duty cycle and environment. A global average can hide improvement in one segment and deterioration in another.
Adoption is part of the counterfactual. A tool available to one thousand employees may be used meaningfully by one hundred. The denominator should identify eligible decisions, actual use, accepted output, overrides, exceptions and abandoned sessions. Benefits should be attributed to the decisions in which the intervention operated, then scaled only through evidenced adoption assumptions.
The office should pre-register the important elements of material pilots: objective, primary metric, secondary metrics, eligible population, comparison method, observation window, exclusions, stop conditions and decision rule. Pre-registration reduces the temptation to select favourable metrics after results are visible. It also gives finance and control teams a clear basis for challenge.
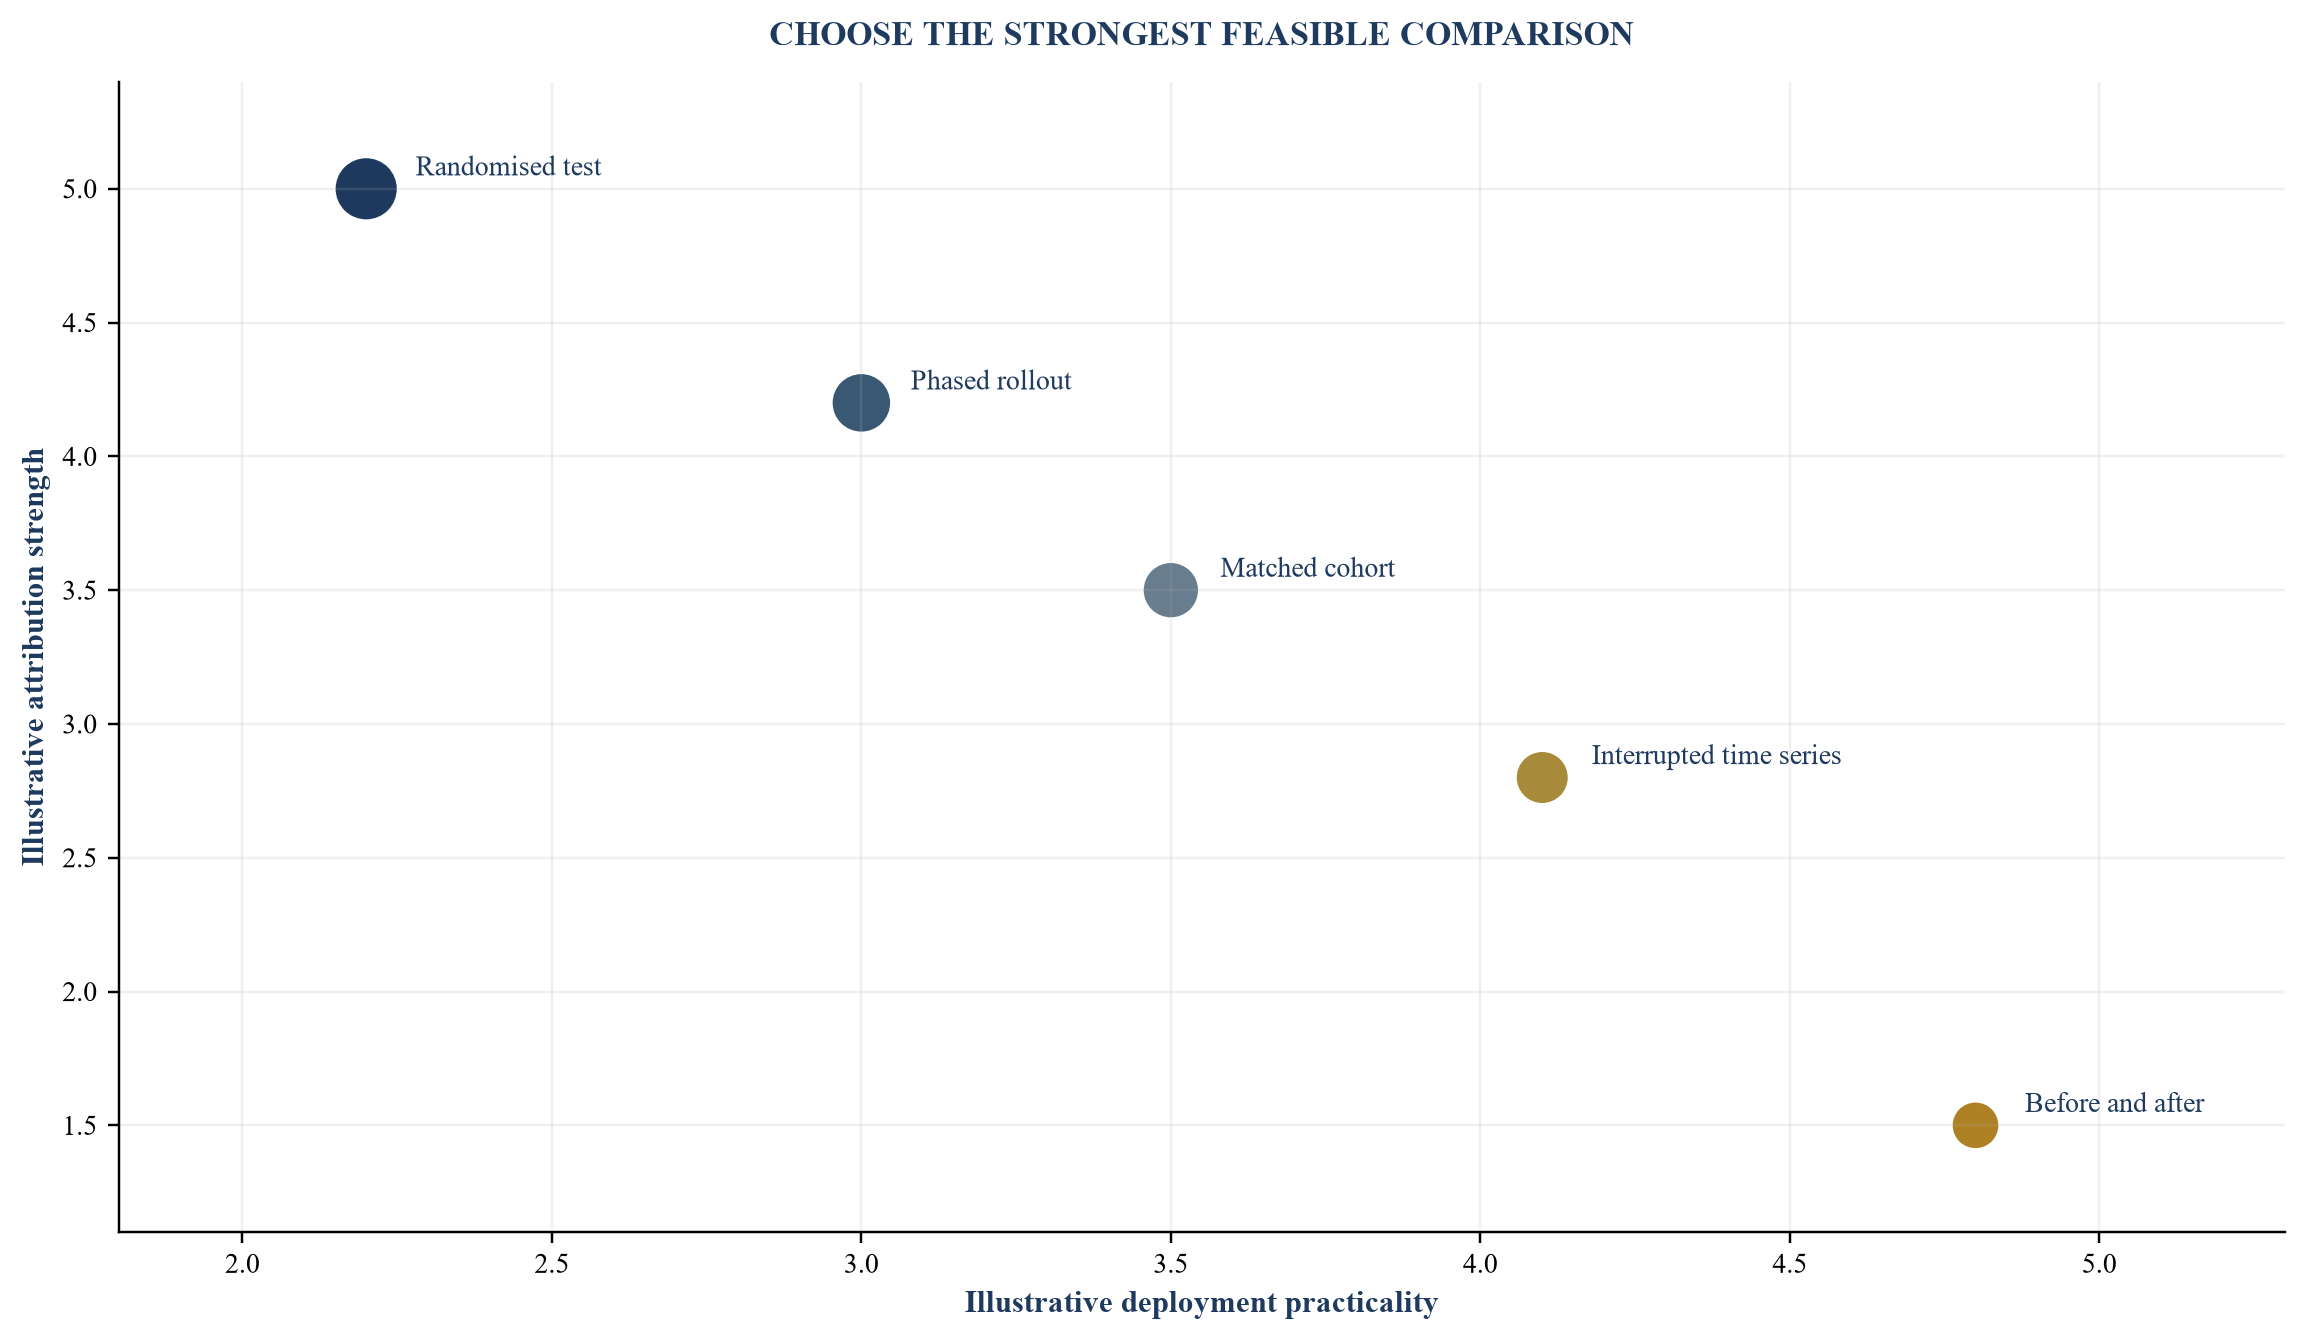
The method should fit the decision. Stronger designs can require more preparation, data and operational control.
7. Load the full cost of AI
AI business cases often begin with a vendor licence or expected model-usage charge. The fully loaded cost includes discovery, data acquisition, labelling, cleansing, integration, development, testing, security, privacy, legal review, change management, training, human oversight, monitoring, incident response, model evaluation, vendor management, infrastructure and retirement. Internal employee time is a scarce resource even when it does not create an incremental cash payment.
Costs have different behaviours. Model inference can vary with queries, tokens, context length, modality, latency and routing. Data costs can vary with records, sources and refresh frequency. Human review can vary with exceptions and risk tier. Platform licences may be fixed within bands. Integration and transition are often front-loaded. Monitoring and assurance continue throughout the life of the system.
Unit economics should use the business decision as denominator. Examples include cost per approved case, completed document, qualified opportunity, resolved service request, monitored asset or decision supported. A falling cost per model call can coexist with a rising cost per completed business outcome when review, rework or abandonment increases.
The business case should include failure and concentration scenarios. A provider price change, model deprecation, data-source loss, latency increase, outage, jurisdictional restriction or new control requirement can change economics. Multi-provider design can add resilience and cost. A single-provider design can reduce complexity and increase dependency. The choice should be visible in the capital decision.
Accounting follows applicable standards and facts. IAS 38 sets criteria for recognition of development expenditure as an intangible asset and requires research expenditure to be recognised as incurred. Management should maintain project stages, time records, technical-feasibility evidence and expenditure attribution where relevant. Qualified accounting advisers and auditors determine the appropriate treatment.
Table 3. Fully loaded AI cost stack
| Cost layer | Typical driver | Evidence source | Decision question |
|---|---|---|---|
| model and platform | usage, licence tier, reserved capacity, modality and provider | contract, invoice, telemetry and pricing schedule | how does cost change with adoption, context and service level? |
| data | acquisition, preparation, labelling, quality and refresh | supplier terms, data pipeline and labour records | which data costs recur and which are shared across initiatives? |
| build and integration | engineering, process redesign, testing and interfaces | project ledger, time records, release record and architecture | what is the cost to reach production rather than demonstration? |
| human control | review, exception handling, approval and remediation | workflow log, staffing plan and quality record | does automation reduce work or move it into higher-cost review? |
| governance and assurance | risk, legal, privacy, security, validation and audit support | control plan, adviser invoice and review calendar | which controls are initial and which repeat throughout the lifecycle? |
| transition and retirement | migration, parallel run, contract exit, archival and retraining | transition plan, vendor terms and resource estimate | what must be paid when the system changes or stops? |
Cost behaviour is use-case specific. The office should reconcile management cost models to procurement, payroll, cloud and accounting records.
8. Reconcile benefit to P&L and cash
The benefit ledger should begin with the observed operating movement and end with accounting and cash consequences. For revenue, it reconciles eligible volume, incremental conversion or retention, net price, discounts, refunds, commissions, variable fulfilment and collection. For cost, it reconciles activity reduction to supplier invoices, payroll actions, overtime, hiring and productive redeployment. For working capital, it separates balance release from recurring earnings.
Timing matters. A pilot can show an operational effect before commercial contracts, staffing or supplier commitments can change. The office should report realised benefit, committed benefit, evidenced run rate and conditional potential separately. This prevents a future capacity action from appearing as current savings.
Double counting requires portfolio-level controls. A collections model and a finance workflow may both claim the same reduction in days sales outstanding. A pricing tool and sales assistant may both claim the same gross-margin change. Each financial line should have one primary benefit owner and a contribution map from supporting initiatives. Finance resolves overlaps before the portfolio reaches the board.
The ledger should maintain a bridge from gross claimed benefit to risk-adjusted net value. Deductions include recurring technology cost, human review, operating support, control cost, implementation amortisation for management analysis, customer remediation, transition and expected downside. Accounting presentation can differ from this management bridge.
Cash conversion completes the analysis. Revenue recognised without collection, cost avoided without a changed commitment, and released capacity without productive use can improve narrative before cash. The board should see when the benefit enters revenue, expense, working capital, capital expenditure and cash.
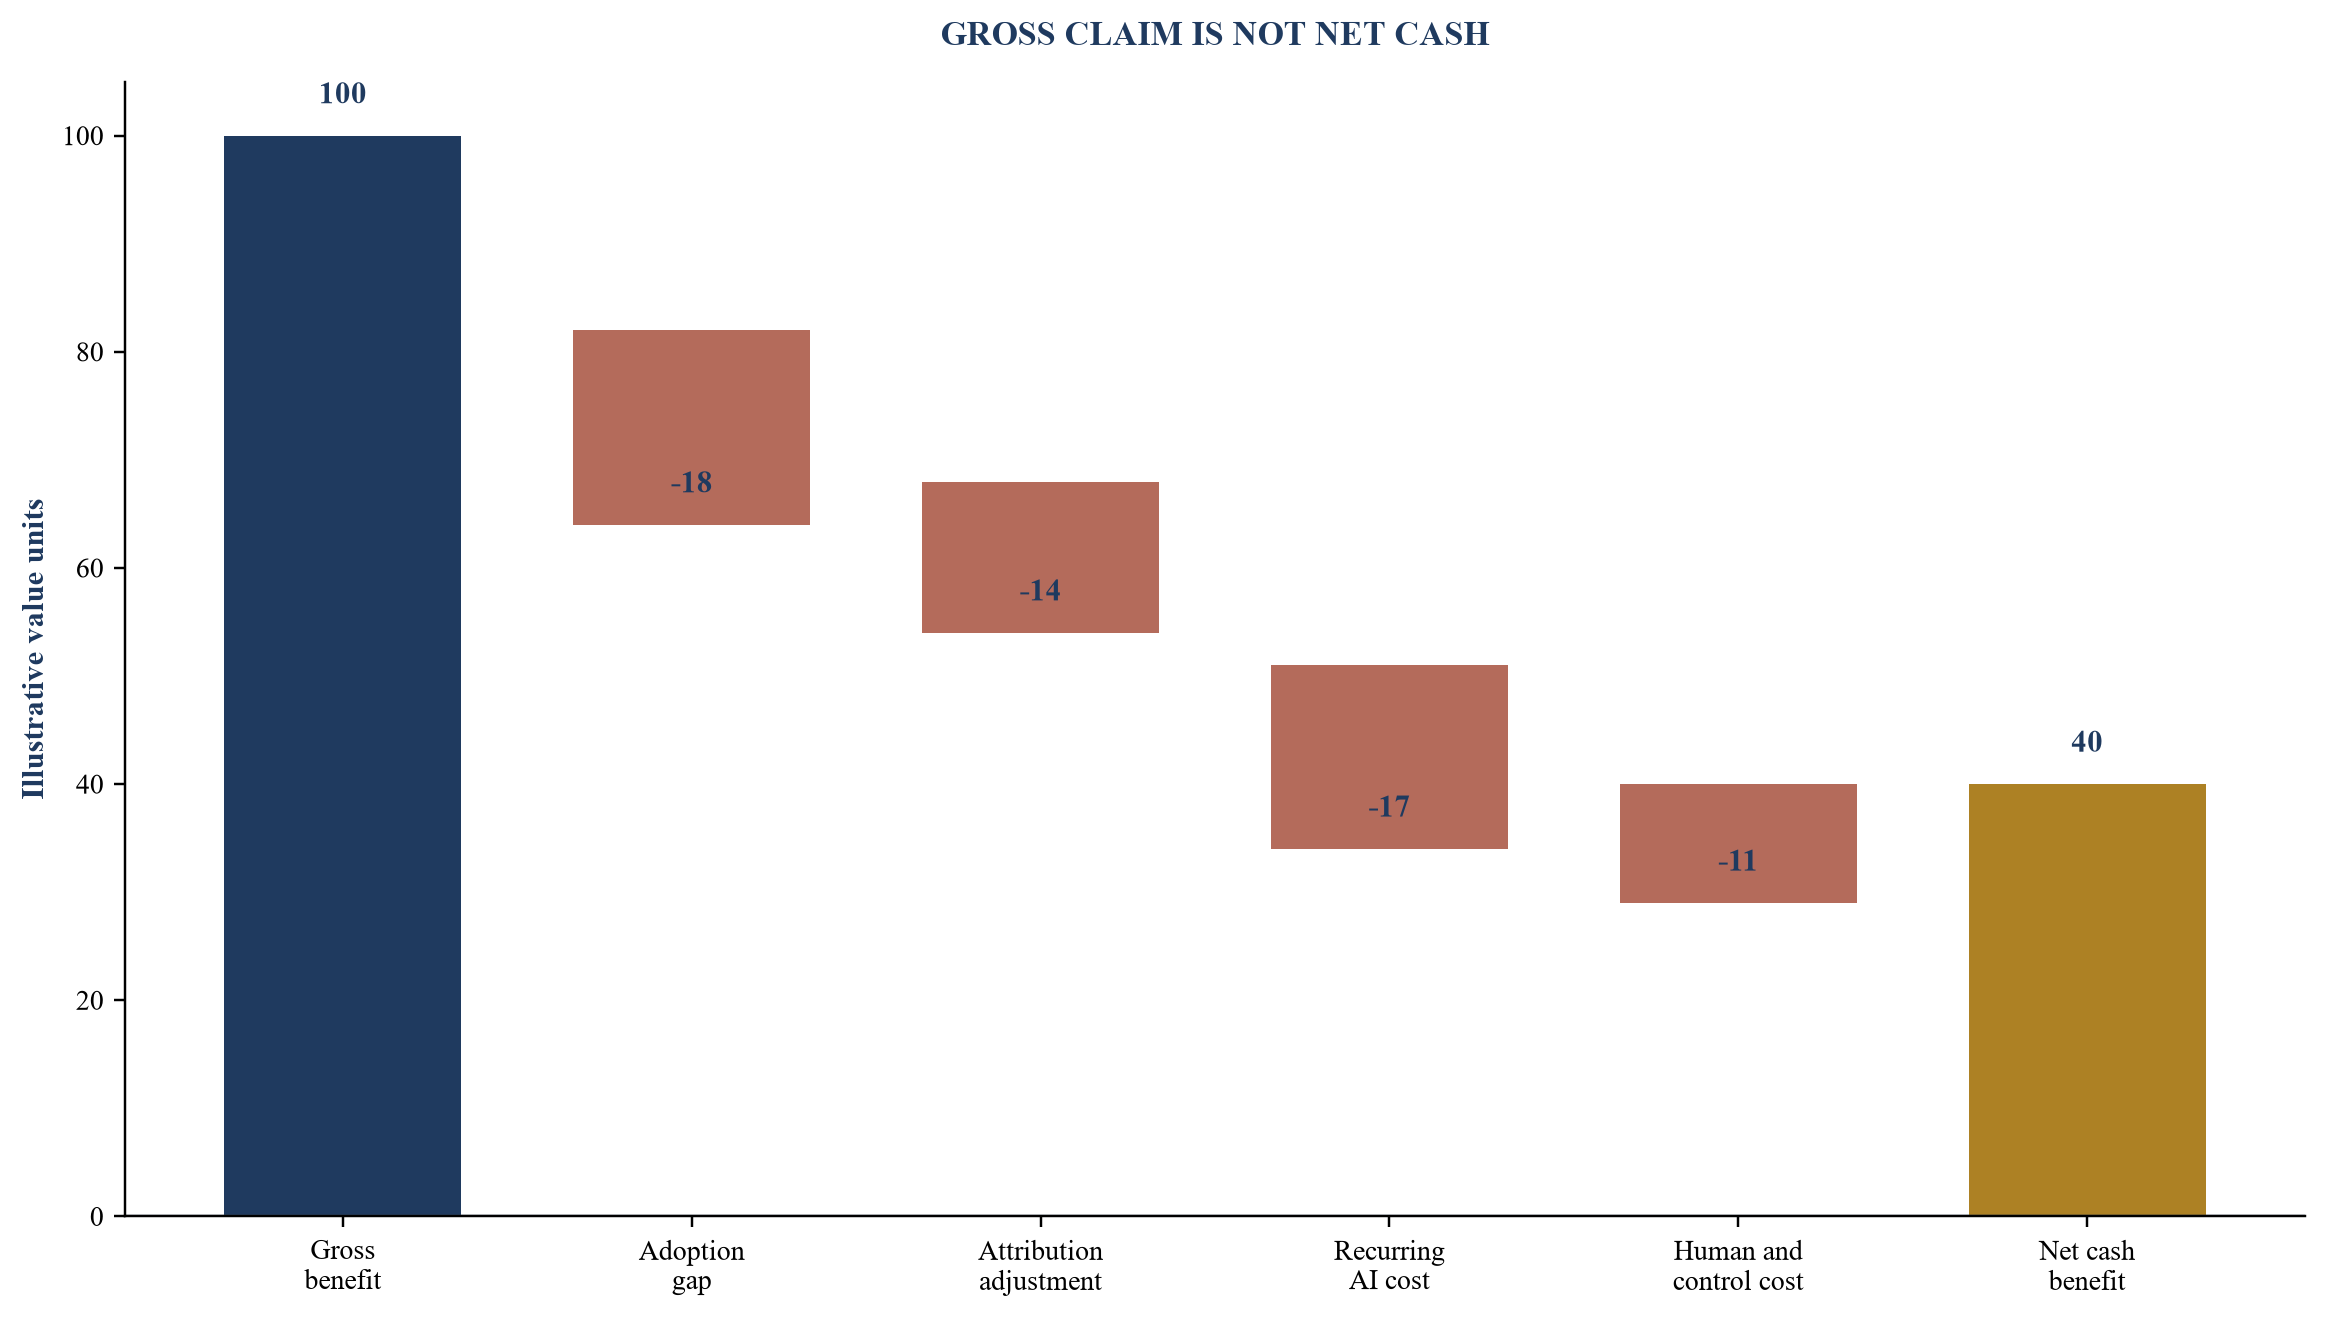
Values are management assumptions for framework demonstration. They are not benchmarks, forecasts or observations about a company.
9. Govern model, data and human performance together
Value controls and risk controls use the same operating evidence. Model drift can reduce conversion or increase manual review. Data-quality failure can distort decisions and increase remediation. Poor explainability can slow approval and customer resolution. A third-party outage can stop the process that generated the benefit. These are economic events as well as control events.
The production record should identify model and prompt version, data sources, retrieval configuration, workflow rules, eligible use, human decision rights, override path, evaluation set, thresholds, monitoring, incidents and change approvals. NIST's Generative AI Profile highlights governance, content provenance, pre-deployment testing and incident disclosure. Its suggested actions include system inventory, human oversight roles and information about underlying models, versions and access modes.
The control standard should follow the decision, not the model label. A summarisation assistant for public material has a different consequence from a system that influences credit, hiring, pricing, trading, medical or safety decisions. Materiality should reflect scale, reversibility, affected people, legal duties, customer exposure and operational dependence.
Human oversight needs measurement. The office should record when review occurs, reviewer competence, time, acceptance, modification, rejection and escalation. A nominal human in the loop can become a passive approver under time pressure. Override analysis can reveal model weakness, training gaps, inappropriate use or a threshold that produces excessive exceptions.
Incidents should connect to the benefit ledger. An outage, erroneous output, data leakage, customer complaint or control breach can create direct cost, lost revenue, remediation, delay and management distraction. The office records realised and scenario impacts without netting them invisibly against gross benefit.
10. Control third-party and embedded AI
Third-party systems can accelerate deployment and shift cost from development to subscription or consumption. They also create dependence on provider terms, models, data handling, service levels, change practices and financial viability. The Bank of England and FCA reported that one third of AI use cases in their 2024 survey were third-party implementations and that respondents expected third-party dependency risk to increase.
Procurement should obtain the information required for both control and economics: system purpose, model and data architecture, customer-data use, retention, location, subprocessors, intellectual-property terms, evaluation, security, incident notification, service levels, change notice, audit rights, price mechanics, export, transition and deletion. Some information may remain unavailable. The decision record should state the resulting uncertainty and compensating controls.
Embedded AI requires a software-change process. An established enterprise application can add an AI feature that uses new data, changes decisions or alters pricing. Business owners may activate it without a formal project. The portfolio register should receive signals from procurement, architecture, security review, vendor release management and expense analysis.
Vendor economics should be tested at portfolio level. Separate teams can buy overlapping copilots, retrieval systems, document models and automation platforms. Consolidation can lower spend and increase concentration. Diversification can improve resilience and raise integration and control cost. The office should present the trade-off as a deliberate decision.
Exit capability is part of value. The company should know how to export data, preserve records, reproduce critical logic, migrate workflow and continue service if a model or vendor changes. A system with strong current performance and no practical exit may carry a durability discount in internal capital allocation and transaction diligence.
Table 4. Third-party AI commercial and control diligence
| Domain | Evidence sought | Economic consequence | Control response |
|---|---|---|---|
| pricing | unit, tier, minimum, overage, indexation and bundled services | gross-margin sensitivity and scale break point | telemetry, budget alerts and renegotiation triggers |
| model change | version policy, notice, deprecation and evaluation support | re-testing, performance drift and transition cost | version inventory, regression tests and approval gate |
| data use | input, output, training, retention, location and subprocessors | restriction on use, customer promise and remediation exposure | minimisation, configuration, contract and monitoring |
| reliability | availability, latency, support, recovery and dependency chain | downtime, service credit, lost output and manual fallback | resilience design, fallback and incident exercise |
| intellectual property | rights in input, output, configuration and derivatives | ownership, licence, indemnity and transaction transfer | legal review, provenance and asset register |
| exit | export, deletion, transition support and continued access | switching cost, interruption and stranded integration | tested exit plan, archival and alternative provider path |
Contract rights and regulatory obligations vary. Relevant specialists should review the specific arrangement.
11. Allocate capital across a portfolio
The portfolio should be ranked on evidence and economics rather than sponsor seniority. A practical matrix uses benefit magnitude, evidence strength, time to cash, capital required, operational readiness, risk exposure, reuse and durability. Each score links to supporting evidence and a named reviewer. A critical risk or legal restriction can override the weighted average.
Initiatives fall into distinct capital classes. Core efficiency initiatives improve established processes and may have measurable baselines. Growth initiatives influence customer decisions and require careful attribution. Risk initiatives reduce expected loss and support resilience. Strategic capability initiatives create reusable data, platform or talent. Experiments test uncertain mechanisms within capped spend. Mixing these classes in one return ranking can penalise necessary controls and reward speculative revenue.
Capital should be released in tranches aligned with the six gates. Early money buys learning: data access, workflow mapping, evaluation and a bounded pilot. Later money buys production integration, reliability, change and scale. A project that cannot state the next evidence milestone should not receive a large undifferentiated budget.
Marginal economics matter at scale. The first business unit may have clean data and enthusiastic users. The next geography may require localisation, regulation, integration and training. The office should approve expansion using the incremental cost and benefit of the next cohort, not the average result from the easiest deployment.
The portfolio also needs a capacity constraint. Data engineers, security reviewers, business experts and change leaders are often scarcer than money. The office should show resource bottlenecks and the opportunity cost of keeping weak initiatives alive. Retirement can release more value than another pilot.
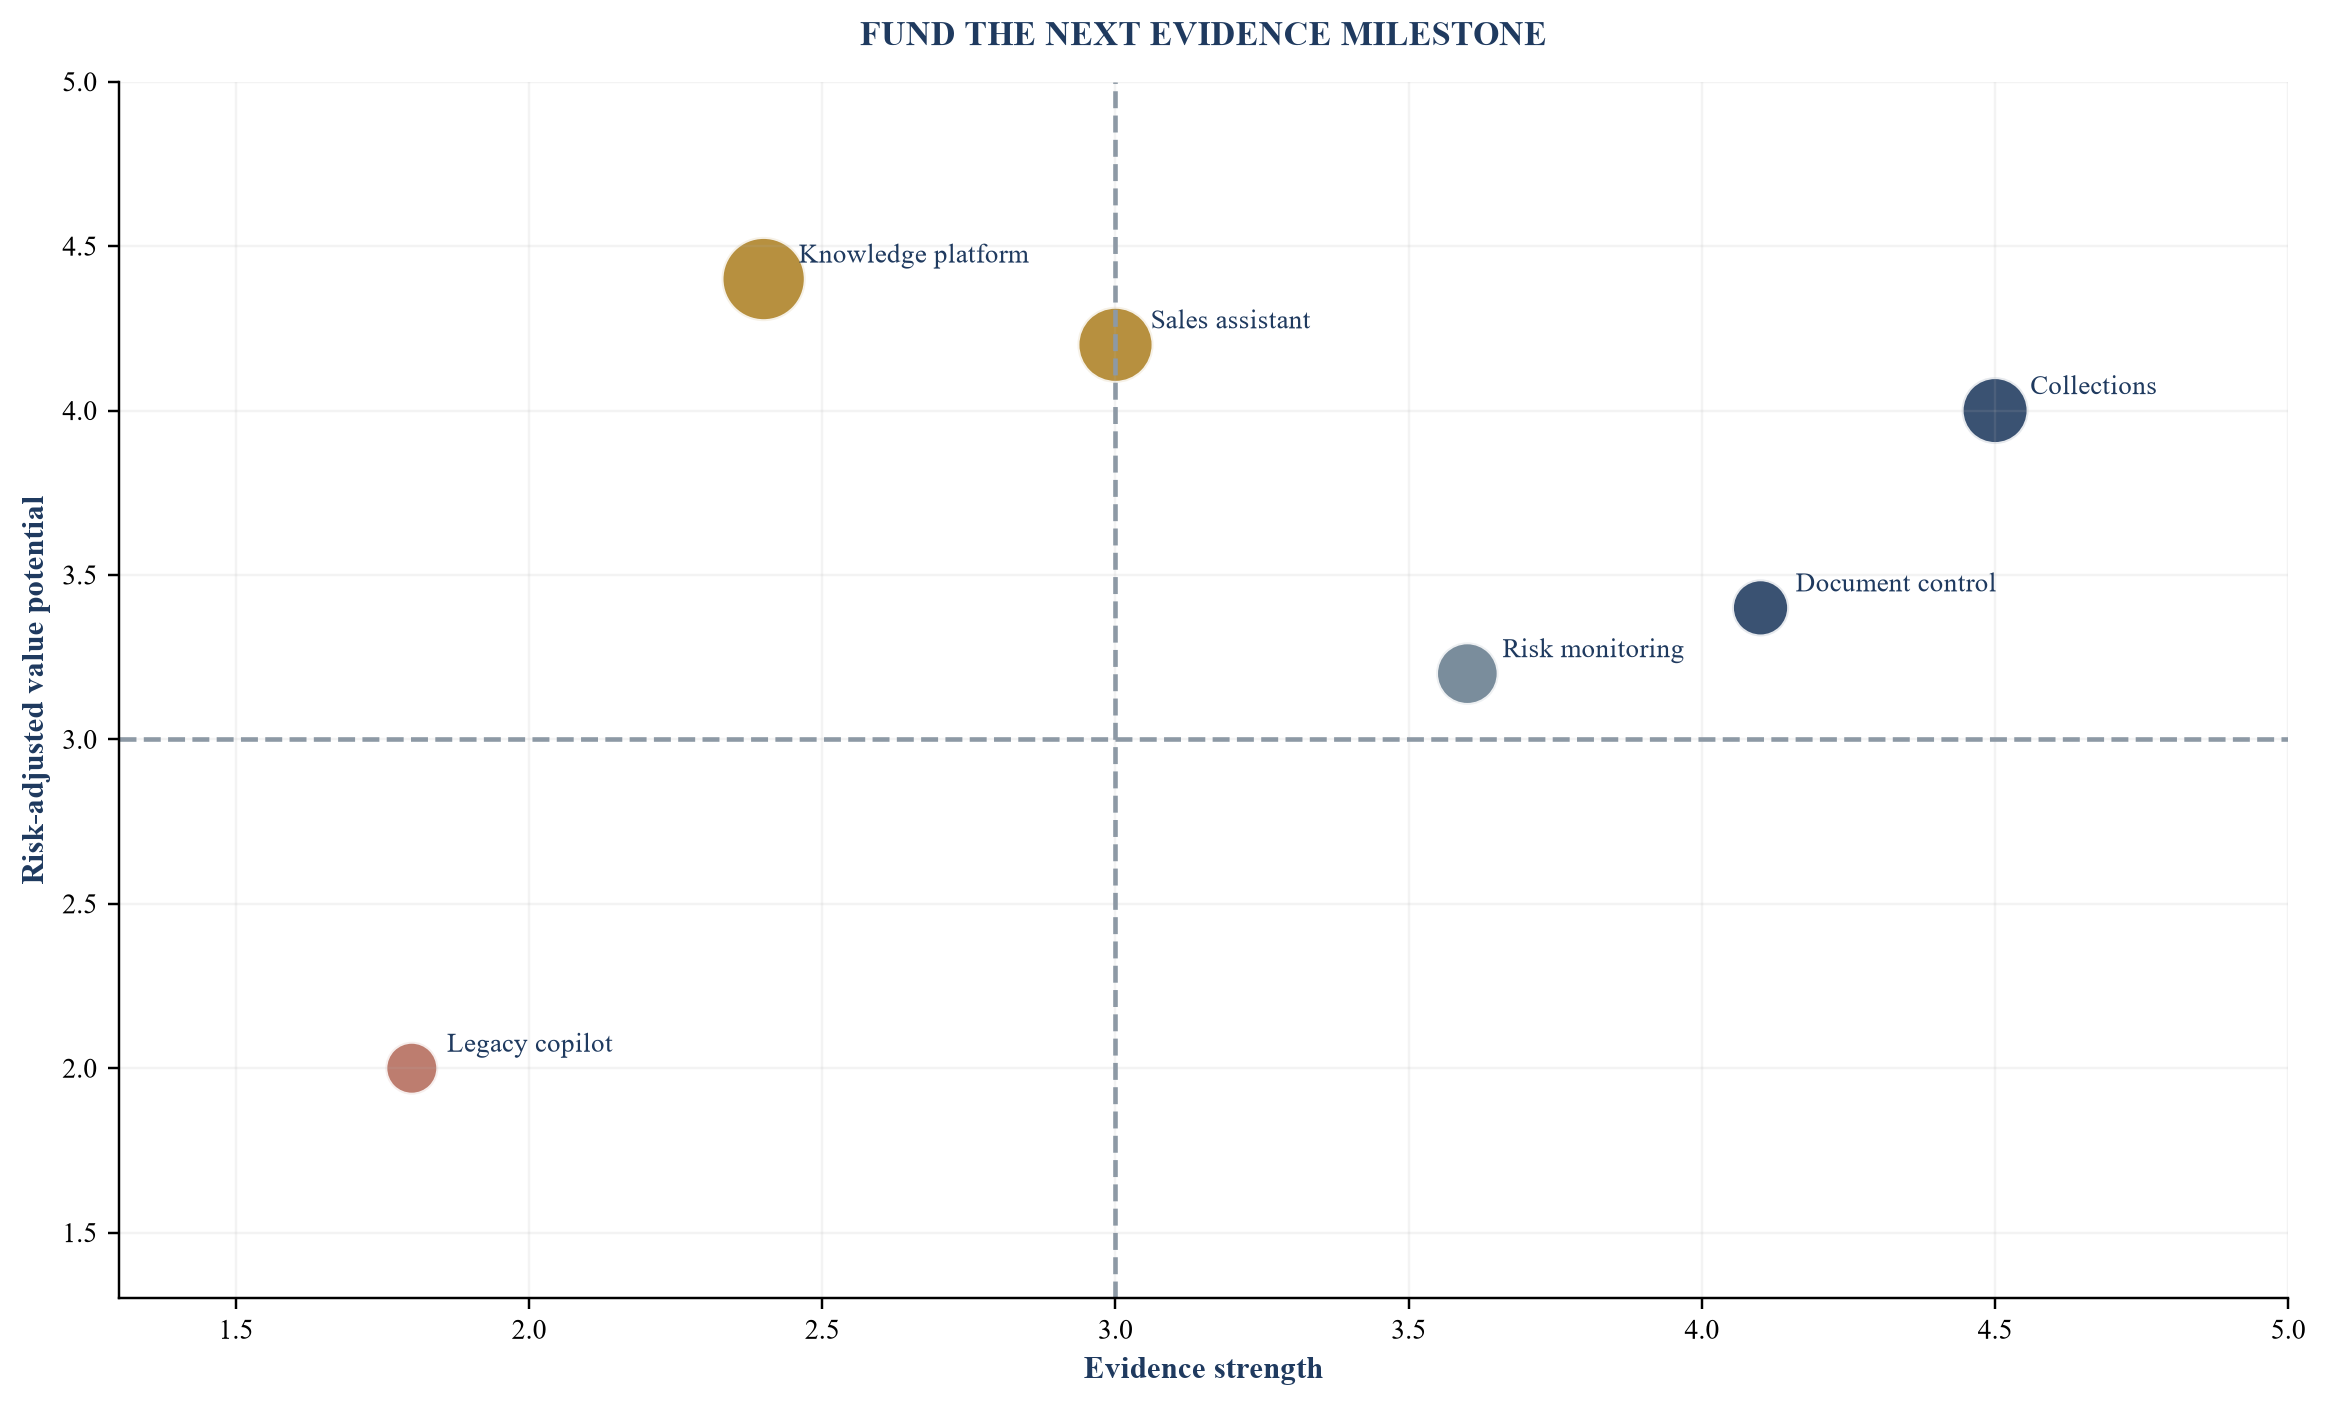
Scores are management assumptions for framework demonstration. Bubble size represents illustrative remaining capital required.
12. Connect value to financing and valuation
AI can affect financing and valuation through cash flow, growth, risk, capital intensity and strategic position. The evidence needs to identify which channel applies. A lower service cost can improve margin when cost is actually removed or productive output rises. A faster sales process can improve revenue when conversion and contribution are attributable. A controlled data platform can support new products when rights, demand and economics are evidenced.
Valuation analysis should separate current performance, credible plan and strategic option. Current performance belongs in historical financial evidence. A credible plan requires tested unit economics, adoption, capacity and implementation. Strategic option value requires milestones and uncertainty ranges. Combining all three into one uplift percentage hides risk.
Durability influences the bridge. A benefit dependent on one founder, one vendor, permissive temporary pricing or unreviewed customer data is less transferable than a benefit embedded in controlled workflow, documented data rights, repeatable evaluation, trained operators and resilient architecture. The office should maintain a durability score with evidence behind every component.
Financing counterparties will examine cash conversion and downside. A lender may give greater weight to realised recurring savings, contracted revenue and resilient operations than to a large potential pipeline. Equity investors may accept more uncertainty while requiring evidence of scalability and defensibility. Transaction buyers will test whether the system and its benefit survive change of control and integration.
No governance framework guarantees a valuation increase or financing outcome. The office provides a traceable basis for management, advisers and capital providers to assess the claim. Market conditions, competition, performance, buyer priorities, financing availability and negotiation remain material.
13. Prevent AI washing inside the company
External AI claims create legal and reputational exposure when they are unsupported. Internal claims also distort capital allocation. A project can be described as AI-enabled while the material outcome comes from process redesign, additional staff, vendor service or a conventional rules engine. The office should state the actual intervention and contribution of each component.
The US Securities and Exchange Commission charged two investment advisers in 2024 with making false and misleading statements about their use of AI. The enforcement action concerned investment-adviser representations; the broader management lesson is evidence discipline. Claims to boards, investors, lenders, customers and employees should have a reasonable and documented basis.
The claims register should capture public statements, investor materials, proposals, product descriptions, board papers and material management reporting. Each statement links to a definition, source, owner, review date and approved limitations. Marketing language should not run ahead of technical and operating evidence.
Benefit dashboards need the same control. Labels such as realised, validated, committed and potential should have stable definitions. Charts should show gross and net benefit, time period, cost basis, comparison method and confidence or uncertainty. Selective reporting of successful pilots can create a false portfolio view if failed and retired initiatives disappear.
The board should request reconciliation from headline value to ledger and cash. This question changes behaviour throughout the system. Sponsors understand that a promising result can still be presented, with its uncertainty, without being converted into a realised number.
14. Design the quarterly board dashboard
The board dashboard should answer five questions. Where is capital deployed? Which initiatives have passed their current evidence gate? What value has been realised and reconciled? Which risks and dependencies could change that value? Which decisions are required now?
Portfolio coverage shows initiatives by gate, business mechanism, geography, risk tier and sponsor. Capital coverage shows approved, committed and spent amounts, plus forecast recurring cost. Evidence coverage shows baselines approved, benefits signed off, controls complete, overdue reviews and systems with unknown ownership or vendor dependency.
Value reporting separates realised P&L, realised cash, evidenced run rate, working-capital release, risk value and strategic options. It shows gross-to-net deductions and double-counting adjustments. Trend matters: a benefit that declines after launch may indicate adoption, drift, process change or vendor performance.
Risk reporting identifies material incidents, overdue remediation, concentration, customer impact, legal or regulatory change, and systems approaching contract renewal or model deprecation. The dashboard should link each exception to an owner, decision date and financial exposure range where supportable.
Decision reporting keeps the meeting focused. The board may approve the next capital tranche, require remediation before scale, consolidate vendors, stop an initiative, change a benefit classification or request independent review. A dashboard that produces no decisions can become another reporting layer.
Table 5. Quarterly AI value dashboard
| View | Core measure | Evidence standard | Board decision |
|---|---|---|---|
| portfolio | initiatives by gate, mechanism, risk and sponsor | current register and gate approvals | rebalance, pause, accelerate or retire |
| capital | approved, committed, spent and recurring run rate | procurement, project ledger, payroll and cloud records | release next tranche or cap exposure |
| value | realised P&L, cash, run rate, working capital and risk value | benefit ledger, counterfactual and finance sign-off | accept classification, require challenge or revise plan |
| adoption | eligible decisions, use, acceptance, override and exception | workflow telemetry and user evidence | change design, training, process or scale assumption |
| control | material findings, incidents, reviews and vendor dependencies | risk and control records | remediate, accept, restrict or stop |
| durability | transferability, resilience, data rights, talent and exit capability | architecture, contract, skills and continuity evidence | strengthen operating model before financing or transaction |
Thresholds and colours should be approved by management for the organisation's risk, materiality and planning cycle.
15. Apply the model in three operating contexts
In a regulated financial institution, the office may begin with document processing, fraud detection, customer support and internal research. The value mechanism differs across use cases. A document system can improve cycle time and error rate. A fraud system influences expected loss and customer friction. A support assistant affects resolution, complaints and service capacity. Governance should reflect consumer duty, data, model, outsourcing and operational-resilience obligations. The DFSA's 2025 survey found rapid adoption among responding DIFC firms and continuing development of governance and accountability.
In a professional-services firm, the office may examine research, proposal creation, document review and knowledge retrieval. Hours saved do not equal cash benefit. The firm must decide whether capacity increases billable output, improves turnaround, reduces external spend, supports fixed-fee margin or creates a new service. Quality, confidentiality, client terms, professional responsibility and knowledge provenance remain material.
In an industrial business, the portfolio may include forecasting, quality inspection, maintenance and energy optimisation. The unit is a plant, line, asset or batch. Benefits connect to yield, scrap, downtime, inventory, energy, maintenance and contractual service. Physical safety, sensor quality, equipment condition and operating environment affect both technical performance and financial attribution.
Across all three contexts, the framework remains the same: define the constraint, approve the baseline, test a bounded intervention, prove the mechanism, load full cost, control the system, scale marginally and preserve evidence. The specific metrics and regulatory duties change.
Cross-geography deployment requires a new gate decision. Data rules, employment practice, consumer protection, financial regulation, language, infrastructure and vendor availability can change the mechanism. A use case proven in the UAE, United Kingdom or India should not be assumed to transfer unchanged. The office should preserve a jurisdictional decision record and current professional advice.
16. Execute a 180-day implementation programme
Days zero to thirty establish authority and inventory. The board approves mandate, materiality and decision rights. Management identifies existing initiatives, embedded systems, vendors, costs, sponsors and control records. Finance defines the benefit taxonomy and reporting labels. The office selects a small number of material initiatives for retrospective testing and one new initiative for prospective gate design.
Days thirty-one to sixty build baselines and the benefits ledger. Finance and operating teams define metrics, source systems, periods, segmentation and comparison methods. Technology teams connect telemetry. Procurement maps contracts and cost behaviour. Risk and legal functions define review triggers. The office identifies duplicate claims and initiatives with no accountable benefit owner.
Days sixty-one to ninety run evidence gates. Active pilots receive pre-registered measurement plans. Existing production systems receive benefit and control reviews. Management classifies realised, run-rate, conditional and strategic value. Weak evidence is reported as such. Initiatives that lack a viable mechanism or owner are paused or retired through approved governance.
Days ninety-one to one hundred and twenty integrate planning. Approved benefits enter budgets and forecasts according to finance policy. Resource plans show hiring, supplier and capacity actions. Vendor and cloud commitments are reconciled to adoption scenarios. The board receives the first portfolio dashboard and makes capital-reallocation decisions.
Days one hundred and twenty-one to one hundred and fifty strengthen durability. Teams test resilience, version change, data rights, human oversight, model drift, incident response and exit capability. A sample of benefit calculations is independently reproduced. Financing and transaction-readiness materials use only approved claims.
Days one hundred and fifty-one to one hundred and eighty embed the cycle. The office aligns gate reviews with budgeting, investment committee, procurement, architecture, risk and board calendars. Policies define refresh, exception and retirement. Management agrees the next portfolio priorities based on cash, strategy and evidence.
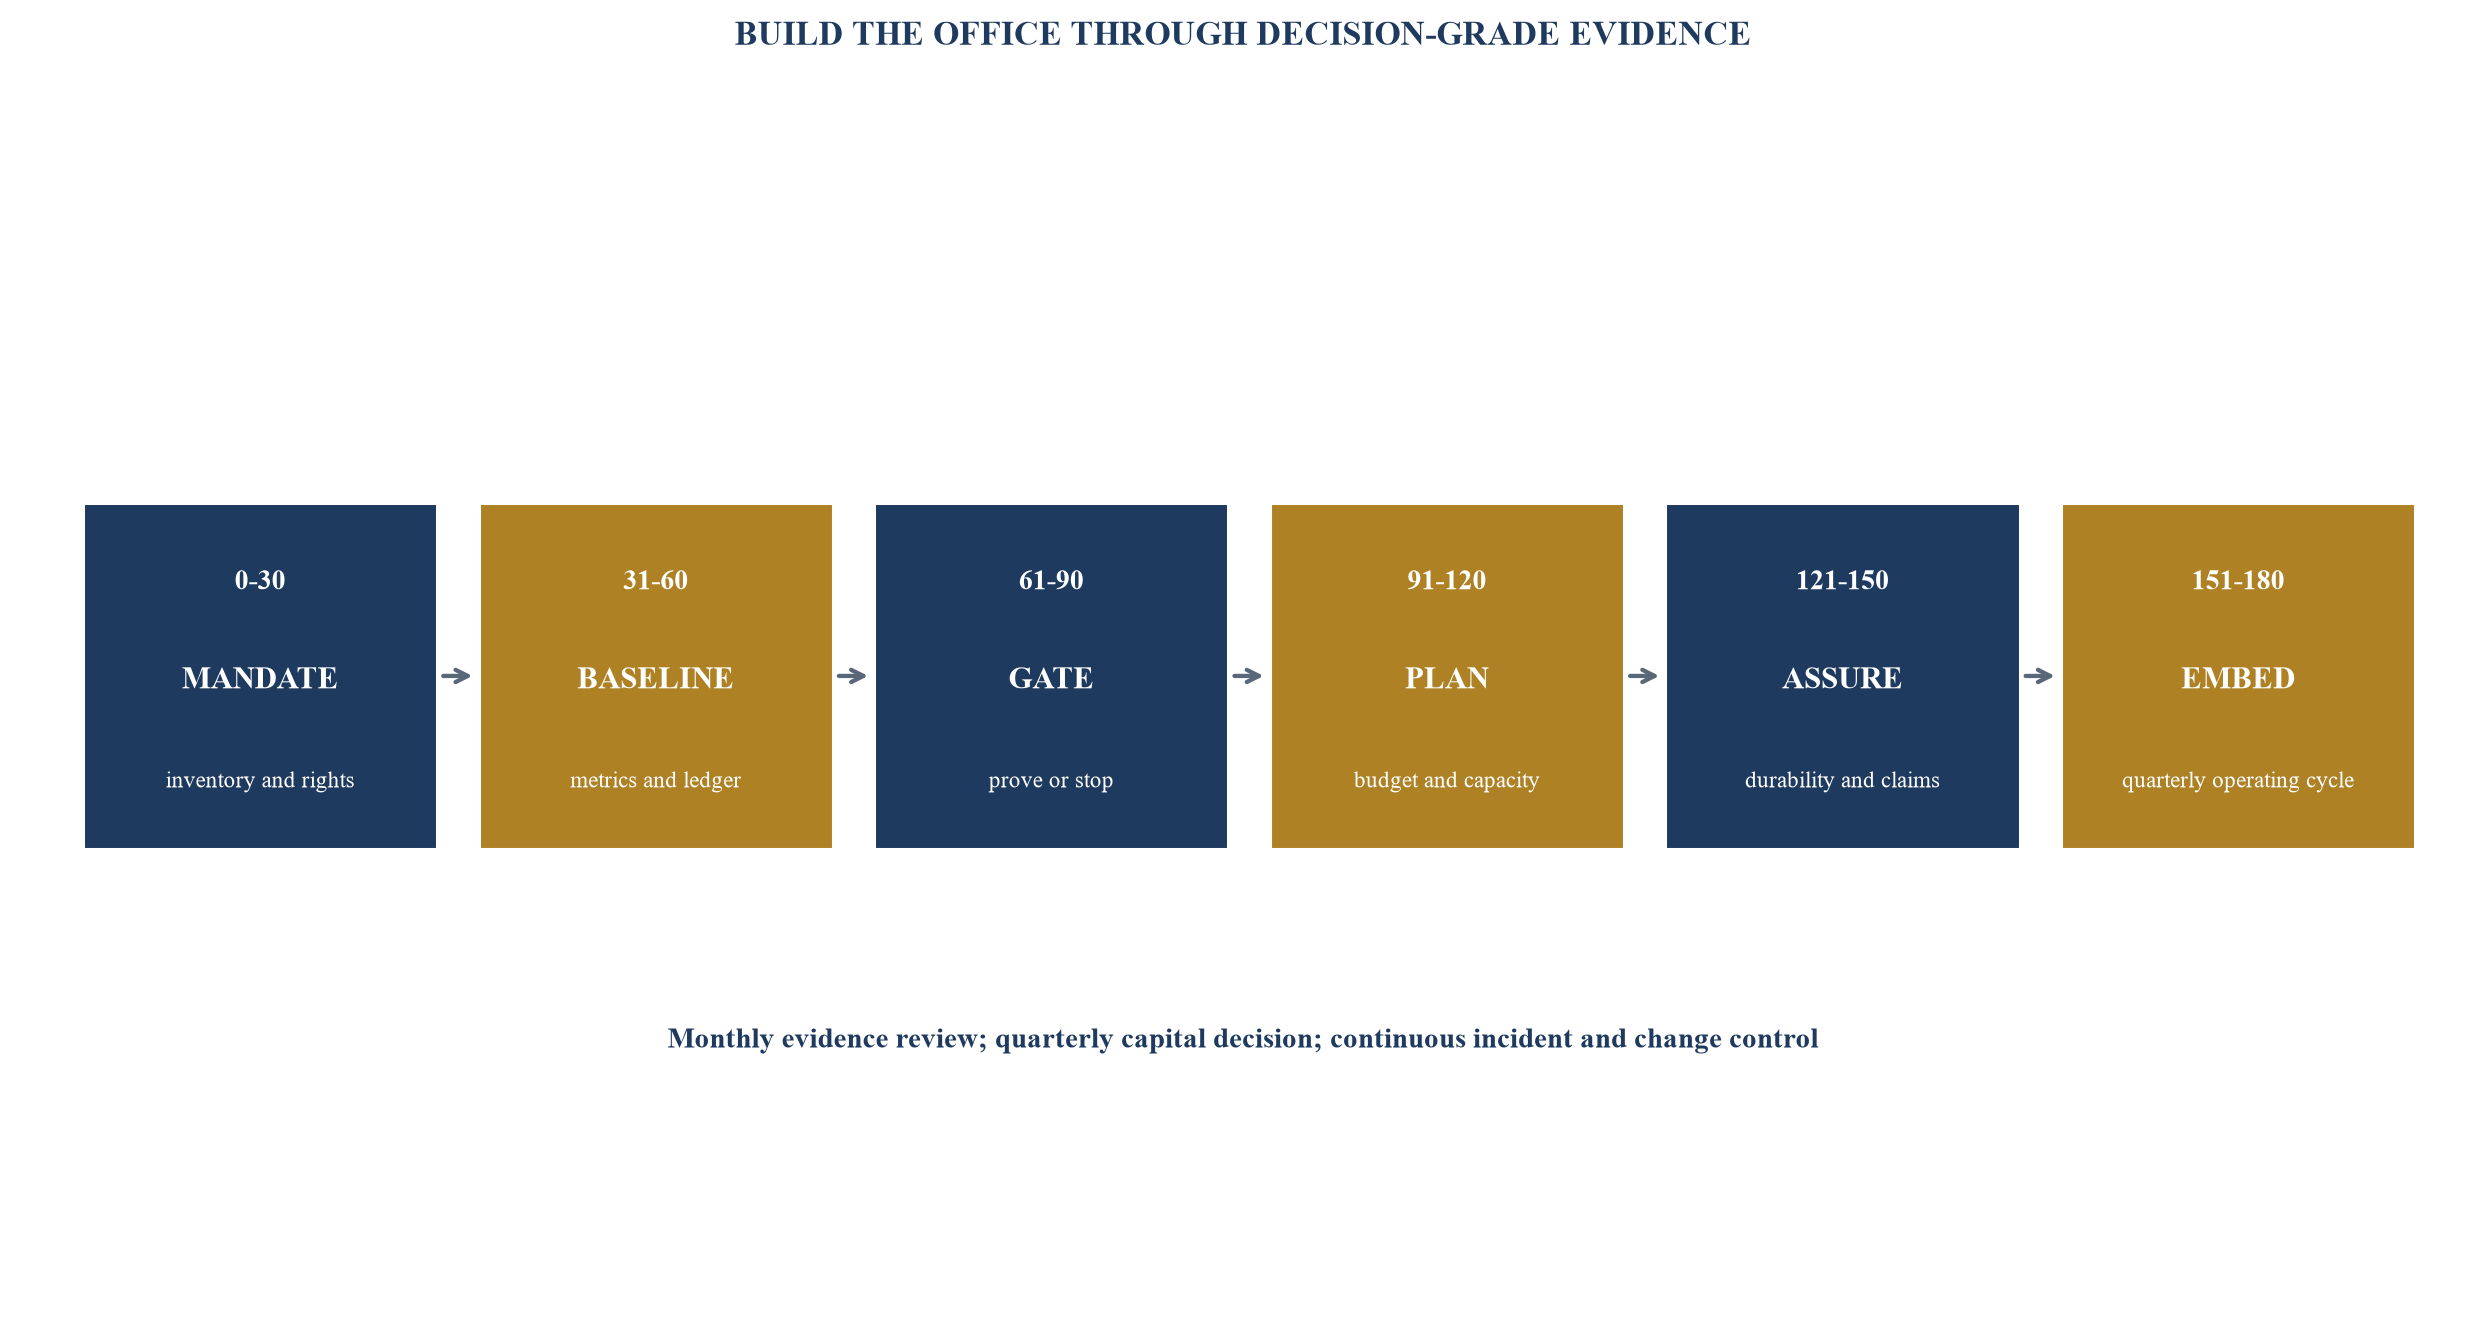
Timing is an illustrative management sequence. Actual scope depends on portfolio size, systems, data, regulation and organisational capacity.
17. Use an evidence-weighted value scorecard
A scorecard should direct decisions without creating false precision. Each initiative can be assessed across baseline quality, attribution strength, realised cash, unit economics, adoption, control completeness, resilience, transferability and owner accountability. The underlying evidence remains more important than the average.
Critical overrides prevent a strong score from concealing a material issue. Examples include prohibited use, unresolved customer harm, unsupported data rights, a critical security finding, an unmanageable single-provider dependency, inability to reproduce the benefit calculation, or absence of an accountable process owner. The initiative cannot progress until the relevant authority resolves or accepts the issue.
Uncertainty should be expressed through ranges and scenarios. A benefit can have a low, management and high case based on adoption, effect size, price, volume and cost. The office records correlations between assumptions. Several initiatives may rely on the same revenue forecast or hiring plan; their upside should not be summed as independent.
The scorecard should change as evidence accumulates. A pilot can have high potential and low evidence. A mature system can have moderate potential, high realised cash and emerging durability concerns. Capital follows the next decision, not a permanent label.
The board should review the weakest link for the highest-value initiatives and the highest capital commitment for the weakest evidence. These two views often identify the most important intervention.
Table 6. Evidence-weighted AI value scorecard
| Dimension | Evidence question | Example indicator | Gate use |
|---|---|---|---|
| baseline quality | can current performance be reproduced and segmented? | source completeness, metric stability and comparison coverage | baseline and pilot approval |
| attribution | can the observed change be separated from other causes? | design strength, change log and sensitivity range | benefit sign-off |
| net economics | does benefit exceed full recurring and transition cost? | net contribution, cash timing and break-even volume | prove and scale |
| adoption | does the system operate in eligible decisions with effective oversight? | use, acceptance, override, exception and abandonment | industrialisation |
| control | are data, model, legal, privacy, security and customer requirements addressed? | findings, review status, incidents and residual risk | production and scale |
| durability | can value survive vendor, model, staff, market and ownership change? | resilience, transfer, skills, documentation and exit test | financing, transaction and renewal |
Scores, weights and thresholds are company-designed management assumptions. Critical overrides require separate documented decisions.
18. Convert evidence into executive action
The AI Value Office should improve decisions within the first reporting cycle. It can stop duplicated pilots, expose unowned systems, correct inflated benefit categories, consolidate measurement and redirect scarce delivery capacity. These actions create value through management discipline even before a large AI benefit is recognised.
Executives should ask the same questions at every gate. What business decision changes? What is the baseline? What evidence will show causation or contribution? What is the full cost at current and scaled volume? What human action converts output into P&L or cash? Which risks can reverse the result? Who owns the process after the project team leaves? What evidence would cause management to stop?
The office also improves transaction readiness. A buyer, lender or investor can inspect a portfolio register, benefit ledger, cost model, control record and durability assessment. The company can explain AI contribution without relying on broad claims. Unsupported potential remains visible as potential.
External requirements will continue to change. The EU AI Act applies according to system, role, use and timing. Financial regulators are developing supervisory approaches. Technical standards and model capabilities evolve. The office should maintain current legal and regulatory advice and refresh material systems when rules, use or architecture changes.
The core discipline remains stable: connect each material AI investment to a business constraint, controlled baseline, tested intervention, financial bridge, full cost and accountable operating owner. A portfolio built on that evidence gives the board a clearer choice among scale, redesign, renegotiate, consolidate and retire. It also gives finance a defensible route from a use-case backlog to decision-grade P&L and cash.
Sources and further reading
- Central Bank of the UAE, Guidance Note on Consumer Protection and Responsible Adoption and Use of Artificial Intelligence Official source
- Dubai Financial Services Authority, AI Survey 2025 Official source
- Bank of England and Financial Conduct Authority, Artificial intelligence in UK financial services 2024 Official source
- National Institute of Standards and Technology, Artificial Intelligence Risk Management Framework 1.0 Official source
- National Institute of Standards and Technology, Generative Artificial Intelligence Profile, NIST AI 600-1 Official source
- National Institute of Standards and Technology, AI Resource Center Official source
- European Union, Regulation EU 2024/1689, Artificial Intelligence Act Official source
- European Commission, Regulatory framework for artificial intelligence Official source
- OECD, AI Principles Official source
- OECD, Accountability principle Official source
- OECD, Robustness, security and safety principle Official source
- U.S. Government Accountability Office, Artificial Intelligence Accountability Framework Official source
- Bank for International Settlements, Governance of AI adoption in central banks Official source
- Bank for International Settlements, The use of artificial intelligence for policy purposes Official source
- International Organization of Securities Commissions, AI Use Cases in Capital Markets Official source
- U.S. Securities and Exchange Commission, Charges against investment advisers concerning AI statements Official source
- U.S. Securities and Exchange Commission, AI washing statement Official source
- IFRS Foundation, IAS 38 Intangible Assets Official source
- IFRS Foundation, IAS 36 Impairment of Assets Official source
- IFRS Foundation, IFRS 3 Business Combinations Official source
- International Organization for Standardization, ISO/IEC 42001 AI management systems Official source
- International Organization for Standardization, ISO/IEC 23894 AI risk management Official source
- UK National Cyber Security Centre, Guidelines for secure AI system development Official source
- Cybersecurity and Infrastructure Security Agency, Secure by Design Official source
- Financial Conduct Authority, Artificial intelligence update Official source
- Monetary Authority of Singapore, Veritas Initiative Official source
- Australian Securities and Investments Commission, Report 798 Beware the gap: Governance arrangements in the face of AI innovation Official source
- Office of the Superintendent of Financial Institutions Canada, Guideline E-23 Model Risk Management Official source
- UAE Government, Data protection laws Official source
- Dubai International Financial Centre, Data Protection Official source
