

1. Choose a unit that connects cost to customer value
Inference economics should begin with a business output that a customer or operating process can recognise. Examples include an accepted case summary, resolved service request, approved document, completed diligence task or qualified exception. Tokens, calls and accelerator seconds remain essential technical measures, while they do not establish whether the product created a usable outcome.
The unit definition should state the workflow boundary, acceptance event, accountable user, relevant quality threshold and period. It should identify whether a rejected, retried or manually corrected output counts as completed. Stable definitions allow finance to compare price, cost and margin across customers, product versions and operating changes.
Several outputs may share one request chain. An agent can retrieve records, call tools and invoke multiple models before producing one accepted answer. Conversely, one model response can support several downstream decisions. The cost-allocation rule should follow observable causality and remain consistent enough for trend analysis.
The first management question is the cost and contribution per accepted output by cohort. Technical optimisation follows from that baseline. A lower cost per token can coexist with higher cost per accepted output when quality falls, output length rises, retries increase or more human review is required.
2. Map the complete inference service
The service map should follow the request from customer event to accepted outcome. It includes authentication, input preparation, policy checks, retrieval, embeddings, reranking, context assembly, model inference, tool execution, validation, storage, monitoring, human review and customer delivery. Every component can add cost, delay and failure exposure.
Ownership should be visible. Some services are supplied by a model or cloud provider. Others are developed internally, licensed, open source or operated by a specialist vendor. The map should identify the pricing unit, service level, location, version, capacity model and control owner for each component.
Shared infrastructure requires a transparent allocation method. Gateways, observability, databases, security and support teams may serve several products. Management should see both marginal workload cost and the allocated full cost. Marginal cost supports routing decisions; full cost supports pricing, portfolio and capacity decisions.
The map should connect configuration to financial records. Model name, deployment, prompt version, cache policy, router, retrieval configuration, tool set, region and customer cohort should be available in telemetry. This enables the enterprise to explain why cost or quality changed after a release.
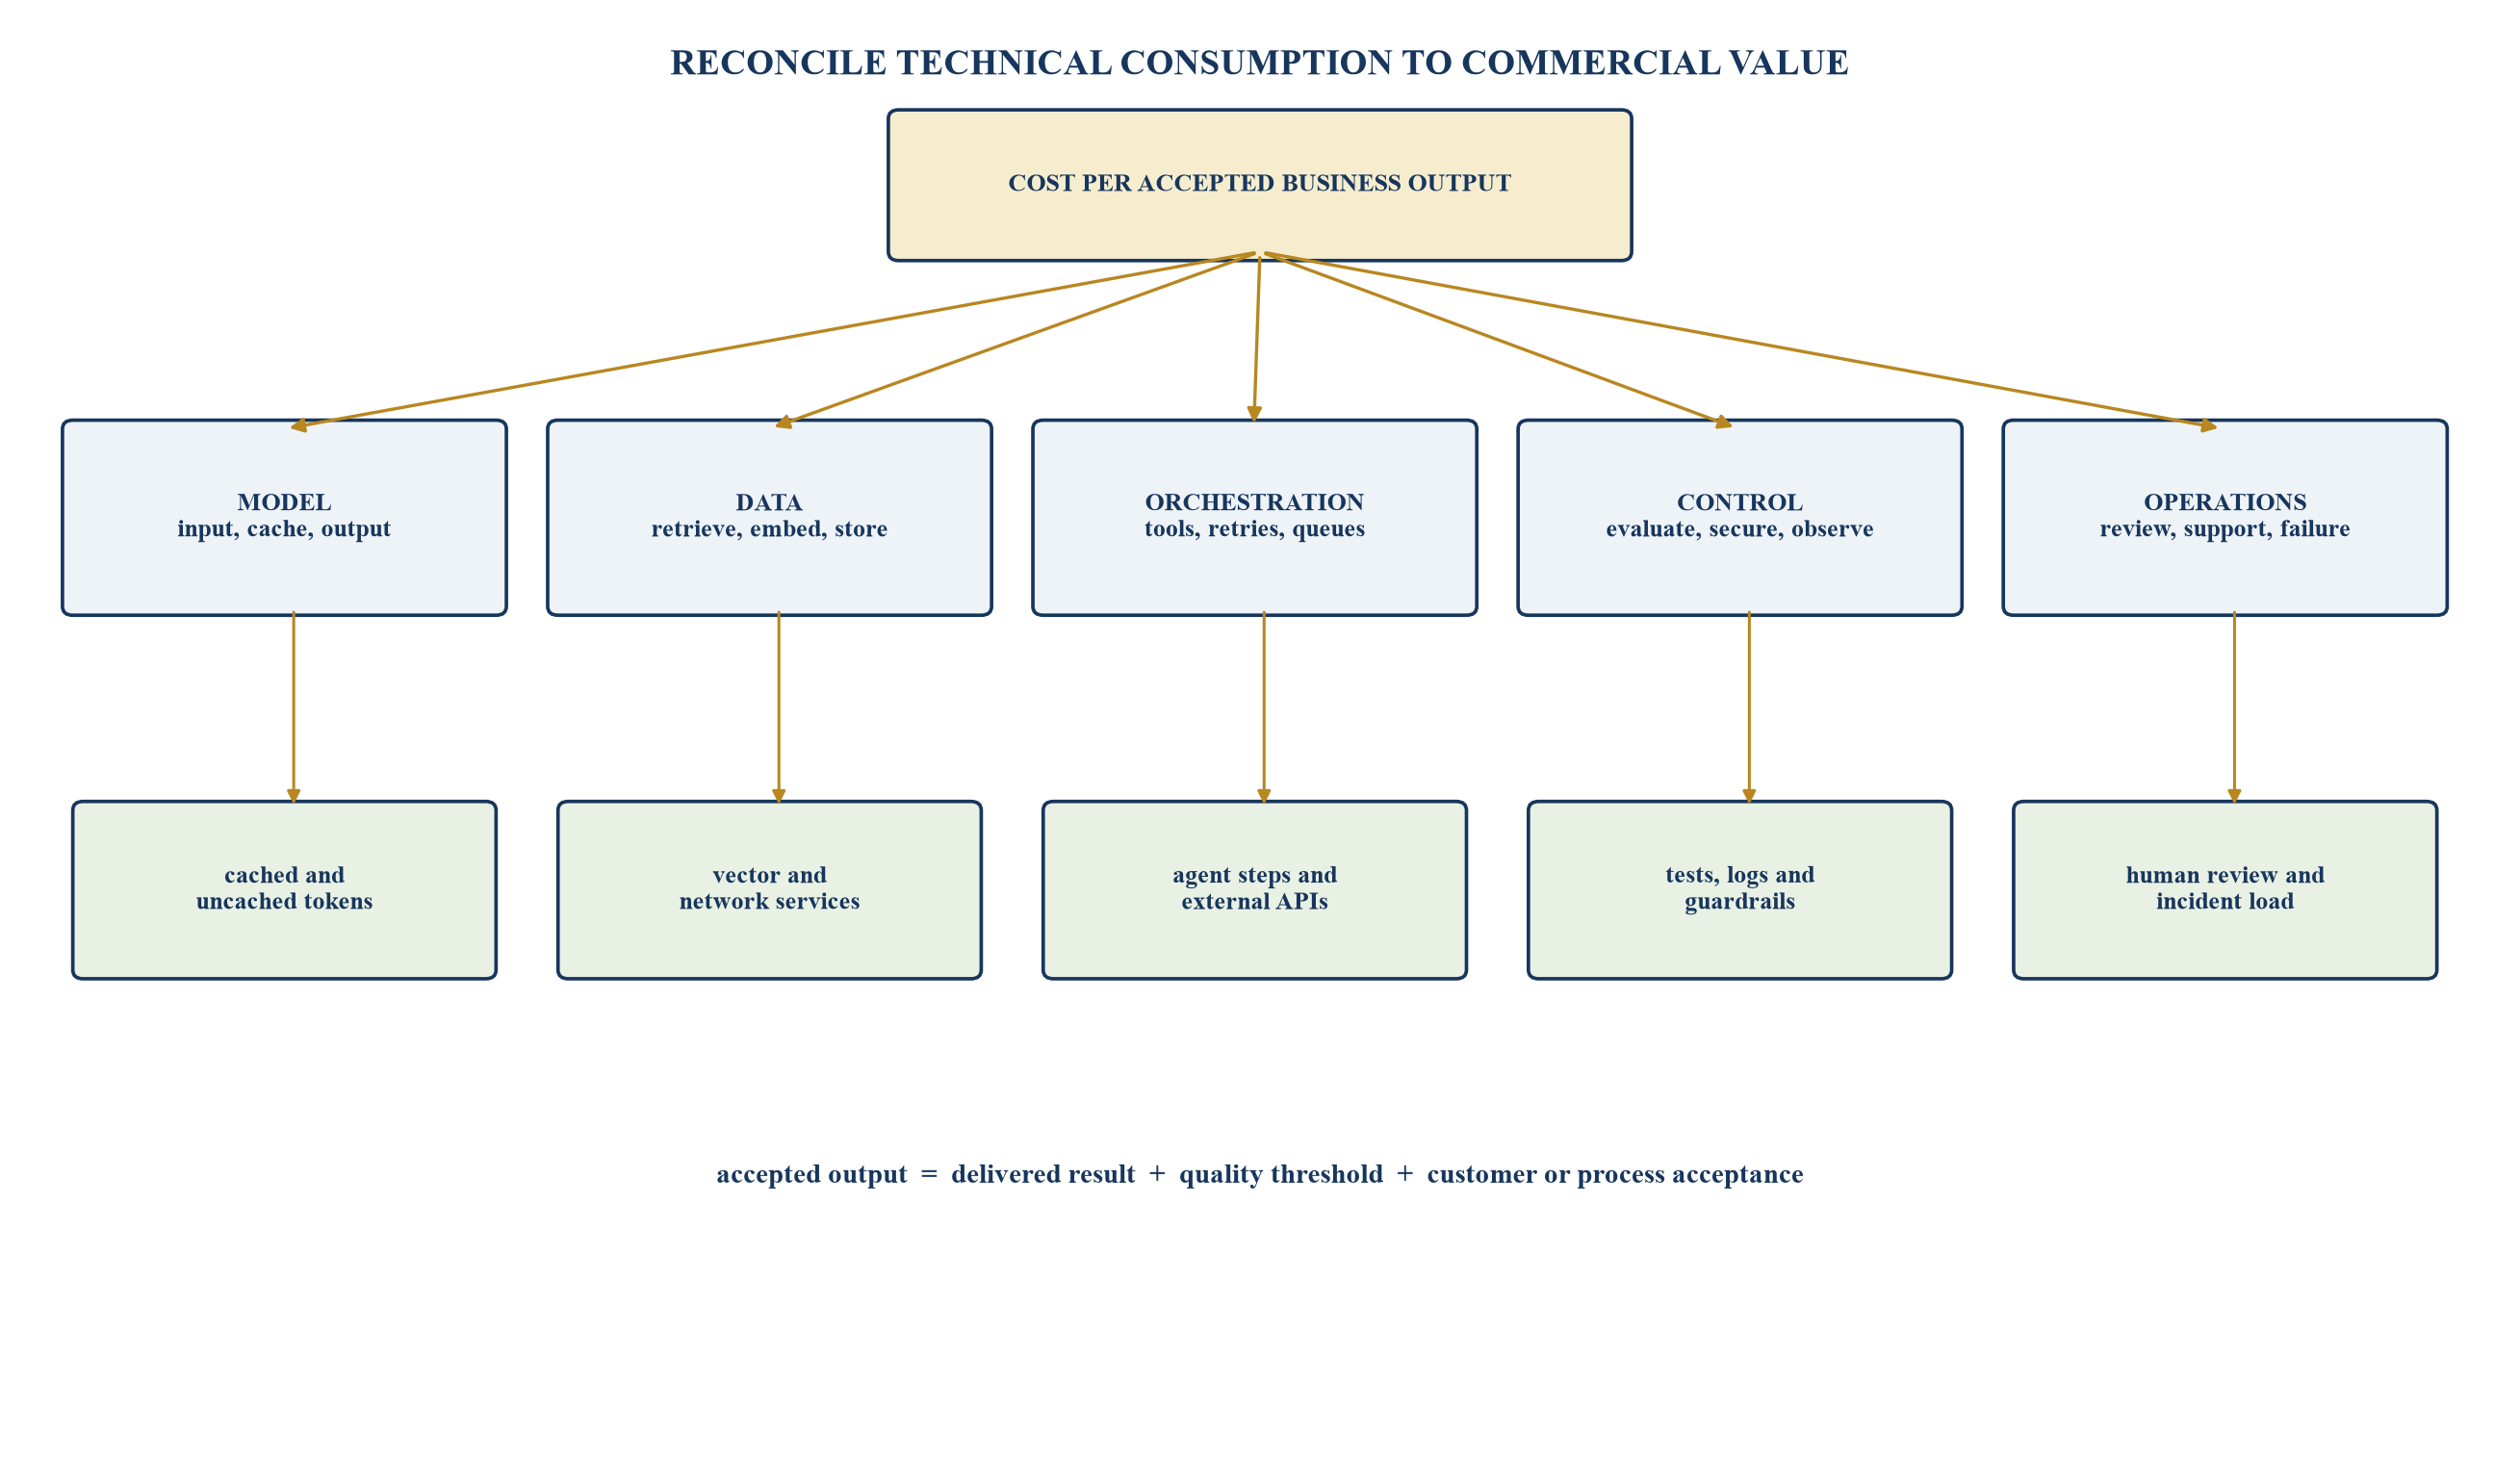
Provider tokens are one branch of the complete product cost.
Table 1. Inference cost and evidence register
| Cost domain | Technical evidence | Financial evidence | Allocation unit |
|---|---|---|---|
| model | input, cached, output and reasoning tokens | provider usage and invoice | request or accepted output |
| retrieval | documents, embeddings, queries and storage | cloud and data-service charges | retrieved or accepted output |
| orchestration | steps, tool calls, retries and queue time | API, compute and workflow cost | completed workflow |
| control | evaluation, guardrail, log and security events | tooling and specialist capacity | release or transaction |
| operations | review, support and incident time | payroll, vendor and service cost | customer or cohort |
| resilience | standby, multi-region and failover tests | reserved capacity and duplicate service | protected revenue or output |
Each cost is connected to a technical event, financial record and business unit.
3. Build request-level telemetry with financial lineage
Every production request should carry identifiers for product, customer, use case, workflow, release, model, provider, region and time. The record should capture token categories, cache reads and writes, latency, routing, retries, tool calls, errors, review and acceptance. Sensitive content can remain protected while operational metadata supports measurement.
Telemetry needs a data dictionary. Providers use different fields and billing units. The enterprise should define how input, cached input, output, reasoning, images, audio, batch, provisioned capacity and ancillary calls enter its internal model. Changes in provider reporting should be versioned.
Financial lineage connects usage to invoices and accruals. Provider usage can arrive sooner than final billing and may differ because of credits, tiers, commitments, currency, tax or adjustments. Finance should reconcile technical quantities, contractual rates and billed cost, retaining variances rather than forcing an artificial match.
The evidence chain ends at acceptance and revenue. A request that consumed tokens but failed before delivery is cost without output. A delivered output that required correction has different economics from an accepted first pass. These distinctions allow engineering work to target the events that affect contribution margin.
Event completeness should be tested. Streaming interruptions, asynchronous jobs and vendor timeouts can omit final usage records. The absence of a field does not establish zero consumption. The pipeline should identify incomplete traces, estimate exposure transparently where necessary and reconcile later provider data. Material estimation methods should be labelled and reviewed by finance.
Telemetry cost needs its own budget. Capturing every token, trace and payload can create storage and observability charges that rise with volume. The design should retain enough metadata for financial, operational and control purposes while limiting unnecessary sensitive content. Sampling, aggregation and retention should follow the consequence of the workload and applicable obligations.
The enterprise should also maintain clock and identifier consistency across systems. A request may cross gateway, retrieval, model, tool, review and billing platforms. Inconsistent timestamps or reused identifiers prevent reconstruction. A governed correlation identifier and timezone policy reduce close-period disputes and support incident analysis.
4. Separate request shape from request volume
Volume alone cannot predict cost or capacity. Request shape includes input length, repeated prefix, retrieved context, output length, reasoning effort, tool use, modality, concurrency, latency requirement and quality threshold. Two products with equal token totals can create different capacity and reliability demands.
The workload should be segmented into representative classes. A short classification task, a long-document review and an agentic research workflow should have separate distributions. Averages can conceal a heavy tail that drives output tokens, queueing, timeouts and customer complaints.
Time shape also matters. Daily peaks, month-end cycles, campaigns and customer launches affect provisioned capacity and cache reuse. The analysis should preserve arrival patterns instead of assuming uniform traffic. Burstiness determines whether reserved throughput is utilised and whether on-demand limits create retries.
Forecasts should connect customer or workflow drivers to request shape and volume. The model can then distinguish growth, product changes and technical efficiency. A variance caused by longer customer documents should not be reported as an unexplained engineering overrun.
Percentiles should accompany averages. Input length, output length, latency and agent steps can have skewed distributions. The highest-cost decile may be a distinct customer need, a data-quality problem, an uncontrolled loop or a legitimate complex cohort. Separating those explanations supports a targeted response instead of applying a blunt global cap.
Workload classification should be versioned with product changes. A new feature can move requests from a single inference to a retrieval or tool-enabled workflow. If the finance model retains the old class, observed cost growth appears as price deterioration. Release governance should therefore update the unit-economic taxonomy before production traffic is compared.
Scenario planning should preserve correlation. Peak customer demand can coincide with longer contexts, more retries and lower cache hits. Treating each driver independently can understate capacity and cash exposure. Stress cases should combine plausible workload events and show the operating response.
5. Measure every token and non-token cost
Input, cached input, output and reasoning tokens can carry different prices and capacity effects. Output often costs more per token and can dominate a verbose workflow. Some services also charge for cache writes, routing, embeddings, images, search, tools, storage or provisioned throughput.
The enterprise should record the rate effective at the transaction date. Public pricing pages can change, and negotiated terms can differ. Currency conversion, taxes, credits and commitments should be shown separately so the operating model remains comparable across periods.
Non-token cost can be material. Retrieval queries, vector storage, databases, network transfer, functions, containers, logging and monitoring accumulate across agent steps. External tools can charge per call or outcome. Human review and support can exceed provider inference cost in high-assurance workflows.
Engineering capacity spent designing, evaluating and operating optimisation should be measured. A complex router that saves small provider fees while creating permanent maintenance and assurance work can reduce total contribution. The business case should include the complete steady-state operating model.
Reasoning and tool use require careful attribution. Some models report reasoning tokens separately or price them through output. Tool calls can generate additional prompts and responses. The cost dictionary should map provider fields to internal categories without assuming that identically named fields across vendors have the same economic meaning.
Failed and cancelled requests should remain in the denominator analysis. A customer may abandon a slow response, or the system may cancel after a timeout while provider work has already occurred. Reporting cost only for successful calls can understate the resources required to produce each accepted output.
Rate comparisons should use representative complete tasks. A lower input price can be offset by greater output, repeated calls or weaker first-pass quality. Testing the same accepted task across candidates produces a more credible measure than multiplying list prices by one assumed token count.
6. Treat caching as an economic experiment
Prompt caching can avoid repeated processing of eligible context and reduce latency or input cost under provider-specific conditions. The opportunity depends on reusable prefix length, request frequency, expiry, routing, write price, read price and actual hit rate. Documentation should be checked for supported models and deployment types.
The workload should be analysed for stable prefixes. System instructions, tool definitions, policies, reference documents and conversation history may be reusable. Variable customer data should remain outside the stable boundary where architecture and data controls permit. A single change in an early prefix can eliminate a hit.
The experiment should compare uncached and cached cohorts on provider cost, total latency, quality, error, capacity and control outcomes. Cache-read and cache-write fields should be reconciled to usage. A configured cache with no measured reads creates complexity without evidence of benefit.
Security and data requirements remain part of the design. Management should understand what is cached, isolation, location, lifetime and deletion behaviour from current provider terms and architecture. The approved policy should correspond to the deployed configuration.
Cache keys and tenant boundaries should be tested. A shared prefix can improve reuse, while customer-specific or confidential content may require separation. The architecture should prove that economic optimisation does not create unintended access or disclosure. The test record should include the deployed provider, model, region and cache mode because support and behaviour can differ.
Prompt structure becomes a financial control. Moving stable instructions and schemas before variable content can increase eligible reuse. That change may also affect model behaviour, evaluation and release lineage. Product, engineering and control owners should therefore treat prefix changes as versioned product changes rather than informal formatting.
7. Calculate cache break-even and saturation
Cache economics begin with the extra cost of a write and the saving on each successful read. Break-even occurs when expected read savings exceed write, engineering and control costs within the cache lifetime. The formula should use current contractual rates and observed workload behaviour.
Hit rate is influenced by content stability, request clustering, routing and capacity. A high theoretical reuse ratio can produce low realised hits when requests are distributed across models or regions. Telemetry should distinguish eligible, attempted, written, read, expired and invalidated tokens where the provider exposes them.
Savings eventually saturate. Once most reusable tokens are served from cache, additional engineering can target a small residual population. The value curve should also include latency, throughput and customer effects where measured. A cache that improves speed can create value beyond token savings.
The decision should be revisited after prompt, model, router or traffic changes. A profitable cache policy for a high-volume stable workflow may be uneconomic for a low-frequency or highly personalised cohort. Product-level policy is stronger than one universal setting.
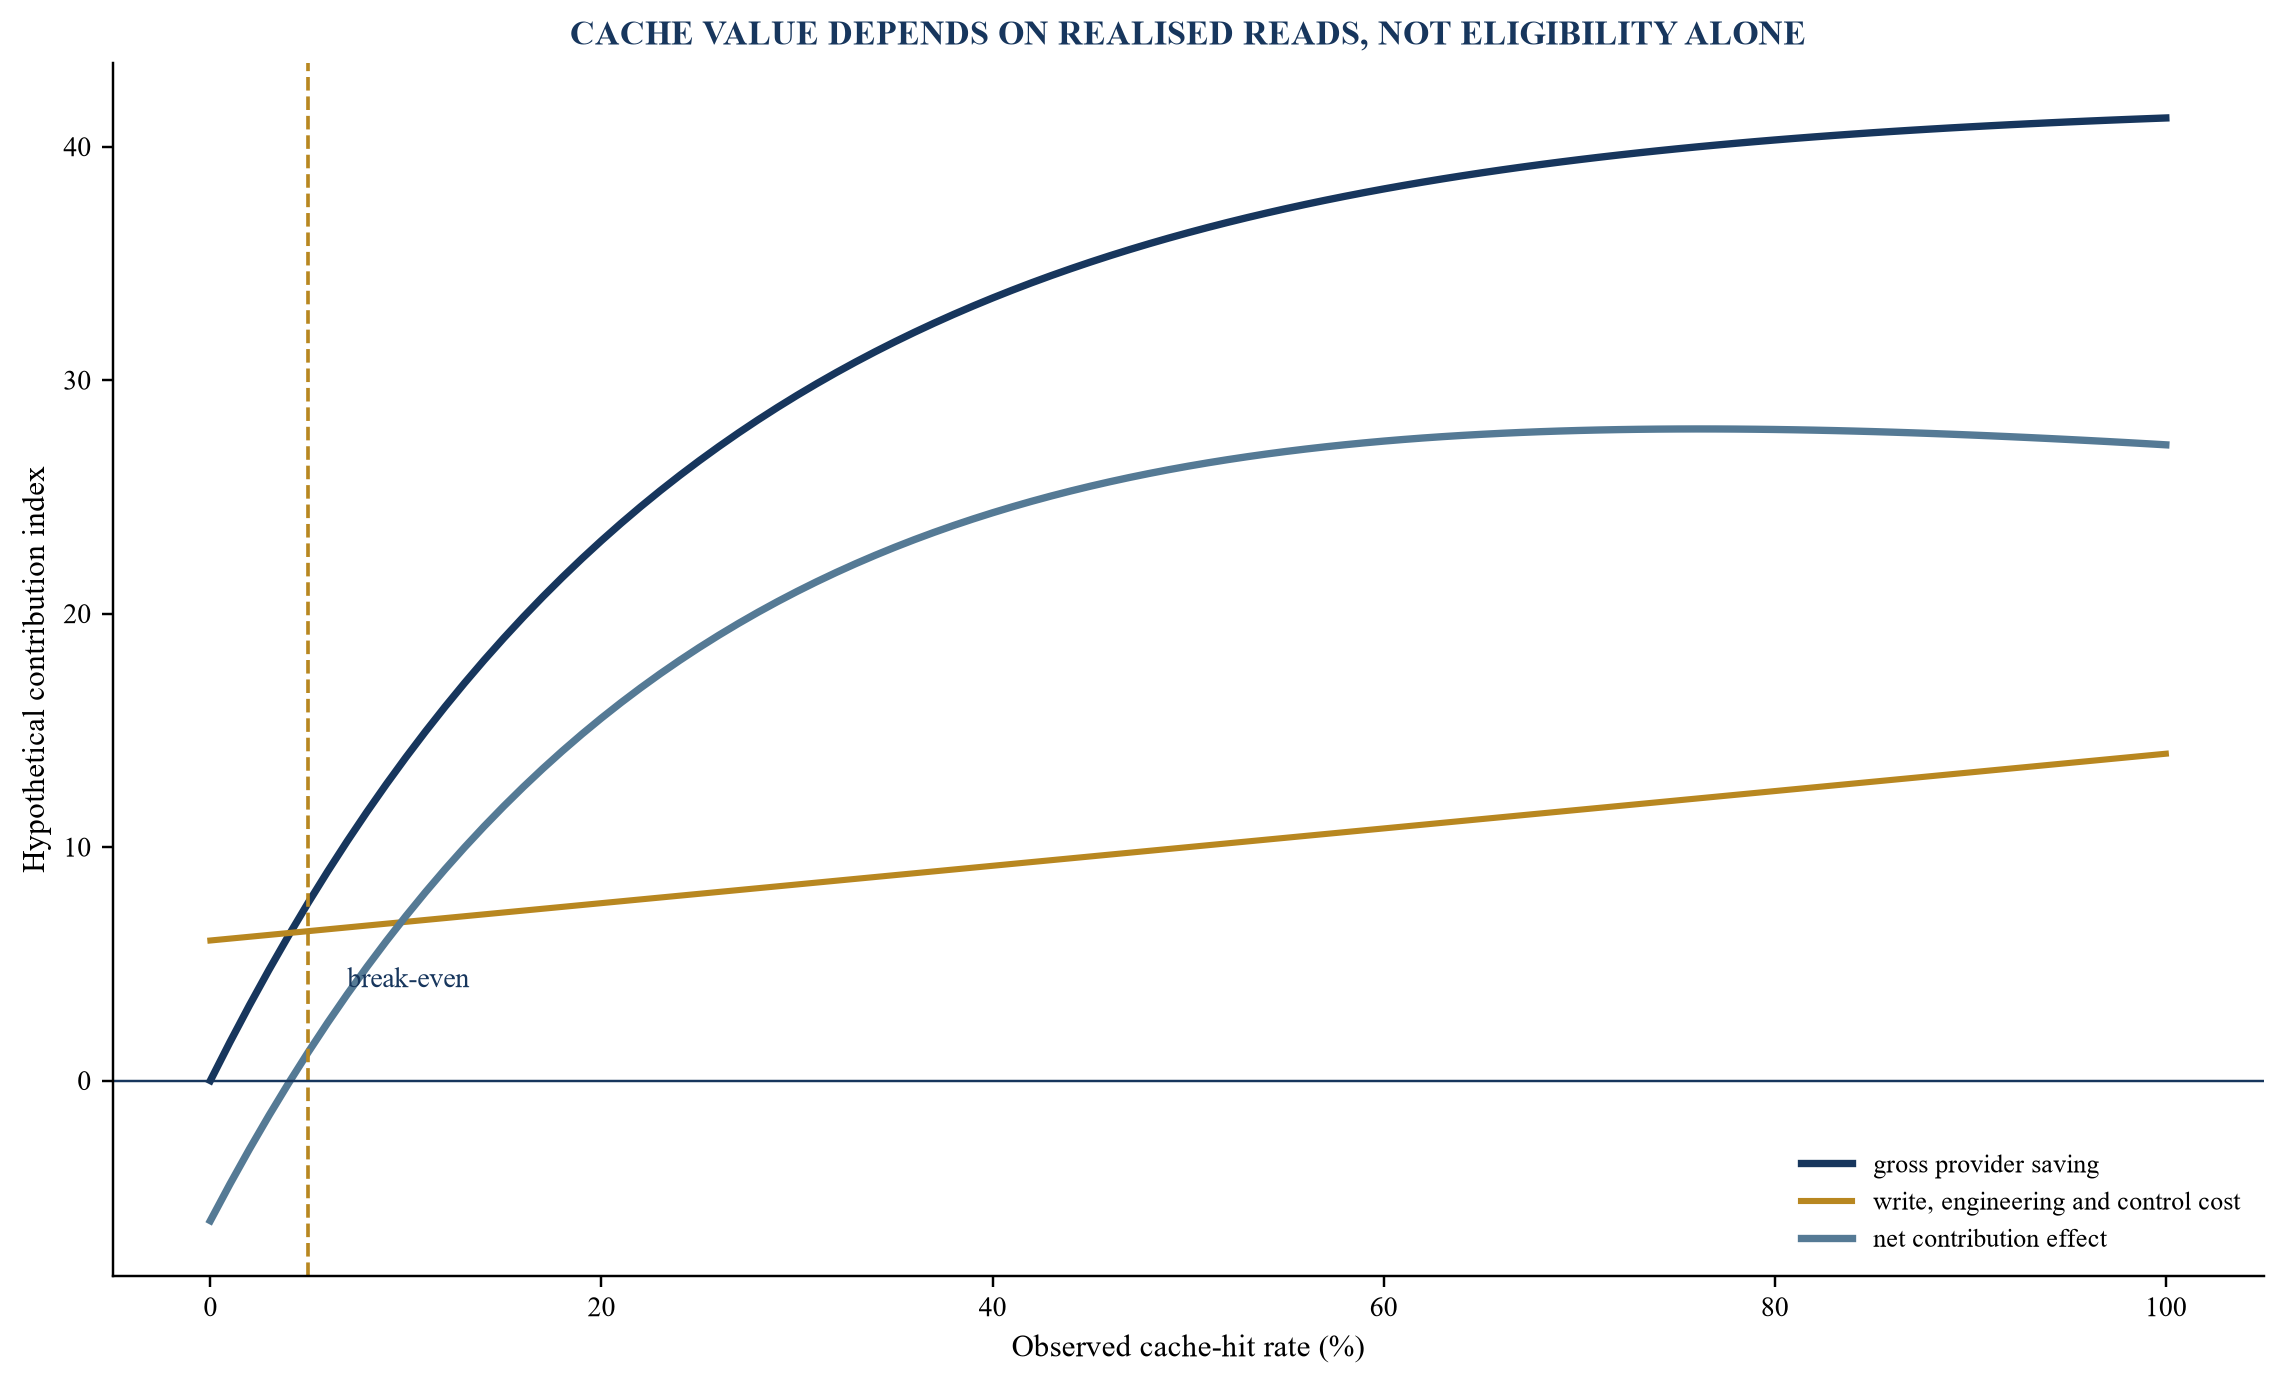
Hypothetical curves show savings increasing after break-even and flattening as addressable prefixes saturate.
8. Route by approved workload class
Routing can direct each request to a model, deployment or provider selected for cost, quality, latency, capacity, location and policy. Rules can be static, classifier-based or supplied by a managed router. Every route should remain inside an approved operating envelope.
The workload taxonomy should precede the router. Management can classify requests by complexity, consequence, modality, context, required tools, residency and latency. Each class receives a primary route, fallback and acceptance threshold. This supports interpretable economics and control.
The router creates its own cost and error. Classification consumes time and capacity. A request routed to an insufficient model may require retry, escalation, review or customer remediation. The economic comparison should include these downstream effects rather than the selected model price alone.
Routing decisions should be observable. Telemetry should record the route, reason or policy version, selected model, fallback, outcome and cost. A managed router can reduce implementation effort, while the enterprise still needs workload-level evaluation and monitoring after model-pool changes.
9. Validate the cost-quality frontier
Evaluation should use representative production tasks and accepted outcomes. Generic benchmarks can support context, while product decisions require the enterprise's workload, quality rubric, risk threshold and human baseline. MLCommons provides reproducible inference benchmarks for specified systems and scenarios; those results do not replace contextual product tests.
Each candidate model or route should be tested on quality, latency, cost, failure, review and customer outcome. Confidence intervals and difficult subgroups should be visible. A lower average cost can conceal failure in a high-consequence cohort.
The frontier consists of configurations for which no alternative improves one relevant dimension without weakening another. Management can then select within risk appetite. Configurations dominated on cost, quality and latency can be removed from the approved pool.
Evaluation must follow version changes. Providers can release new model snapshots, routers or safety behaviour. Prompt, retrieval and tool changes also affect results. The decision record should identify the tested configuration and revalidation triggers.
The evaluation set should reflect the revenue and risk mix. A router tuned on frequent easy tasks can produce an attractive average while weakening a smaller high-value segment. Weighting should be visible, and mandatory thresholds should remain separate from averages. Customer-specific commitments can require their own acceptance population.
Human evaluation should use a documented rubric, reviewer qualification and disagreement process. Model-based evaluation can expand coverage, while it introduces another model, prompt and cost into the system. The enterprise should validate the evaluator for the intended purpose and retain the cost of judging in the experiment.
Routing drift can emerge when traffic or the model pool changes. Monitoring should compare route distribution, accepted quality, retries and unit cost with the approved baseline. A favourable cost movement may reflect more easy requests rather than better routing. Cohort-adjusted reporting helps distinguish the two.
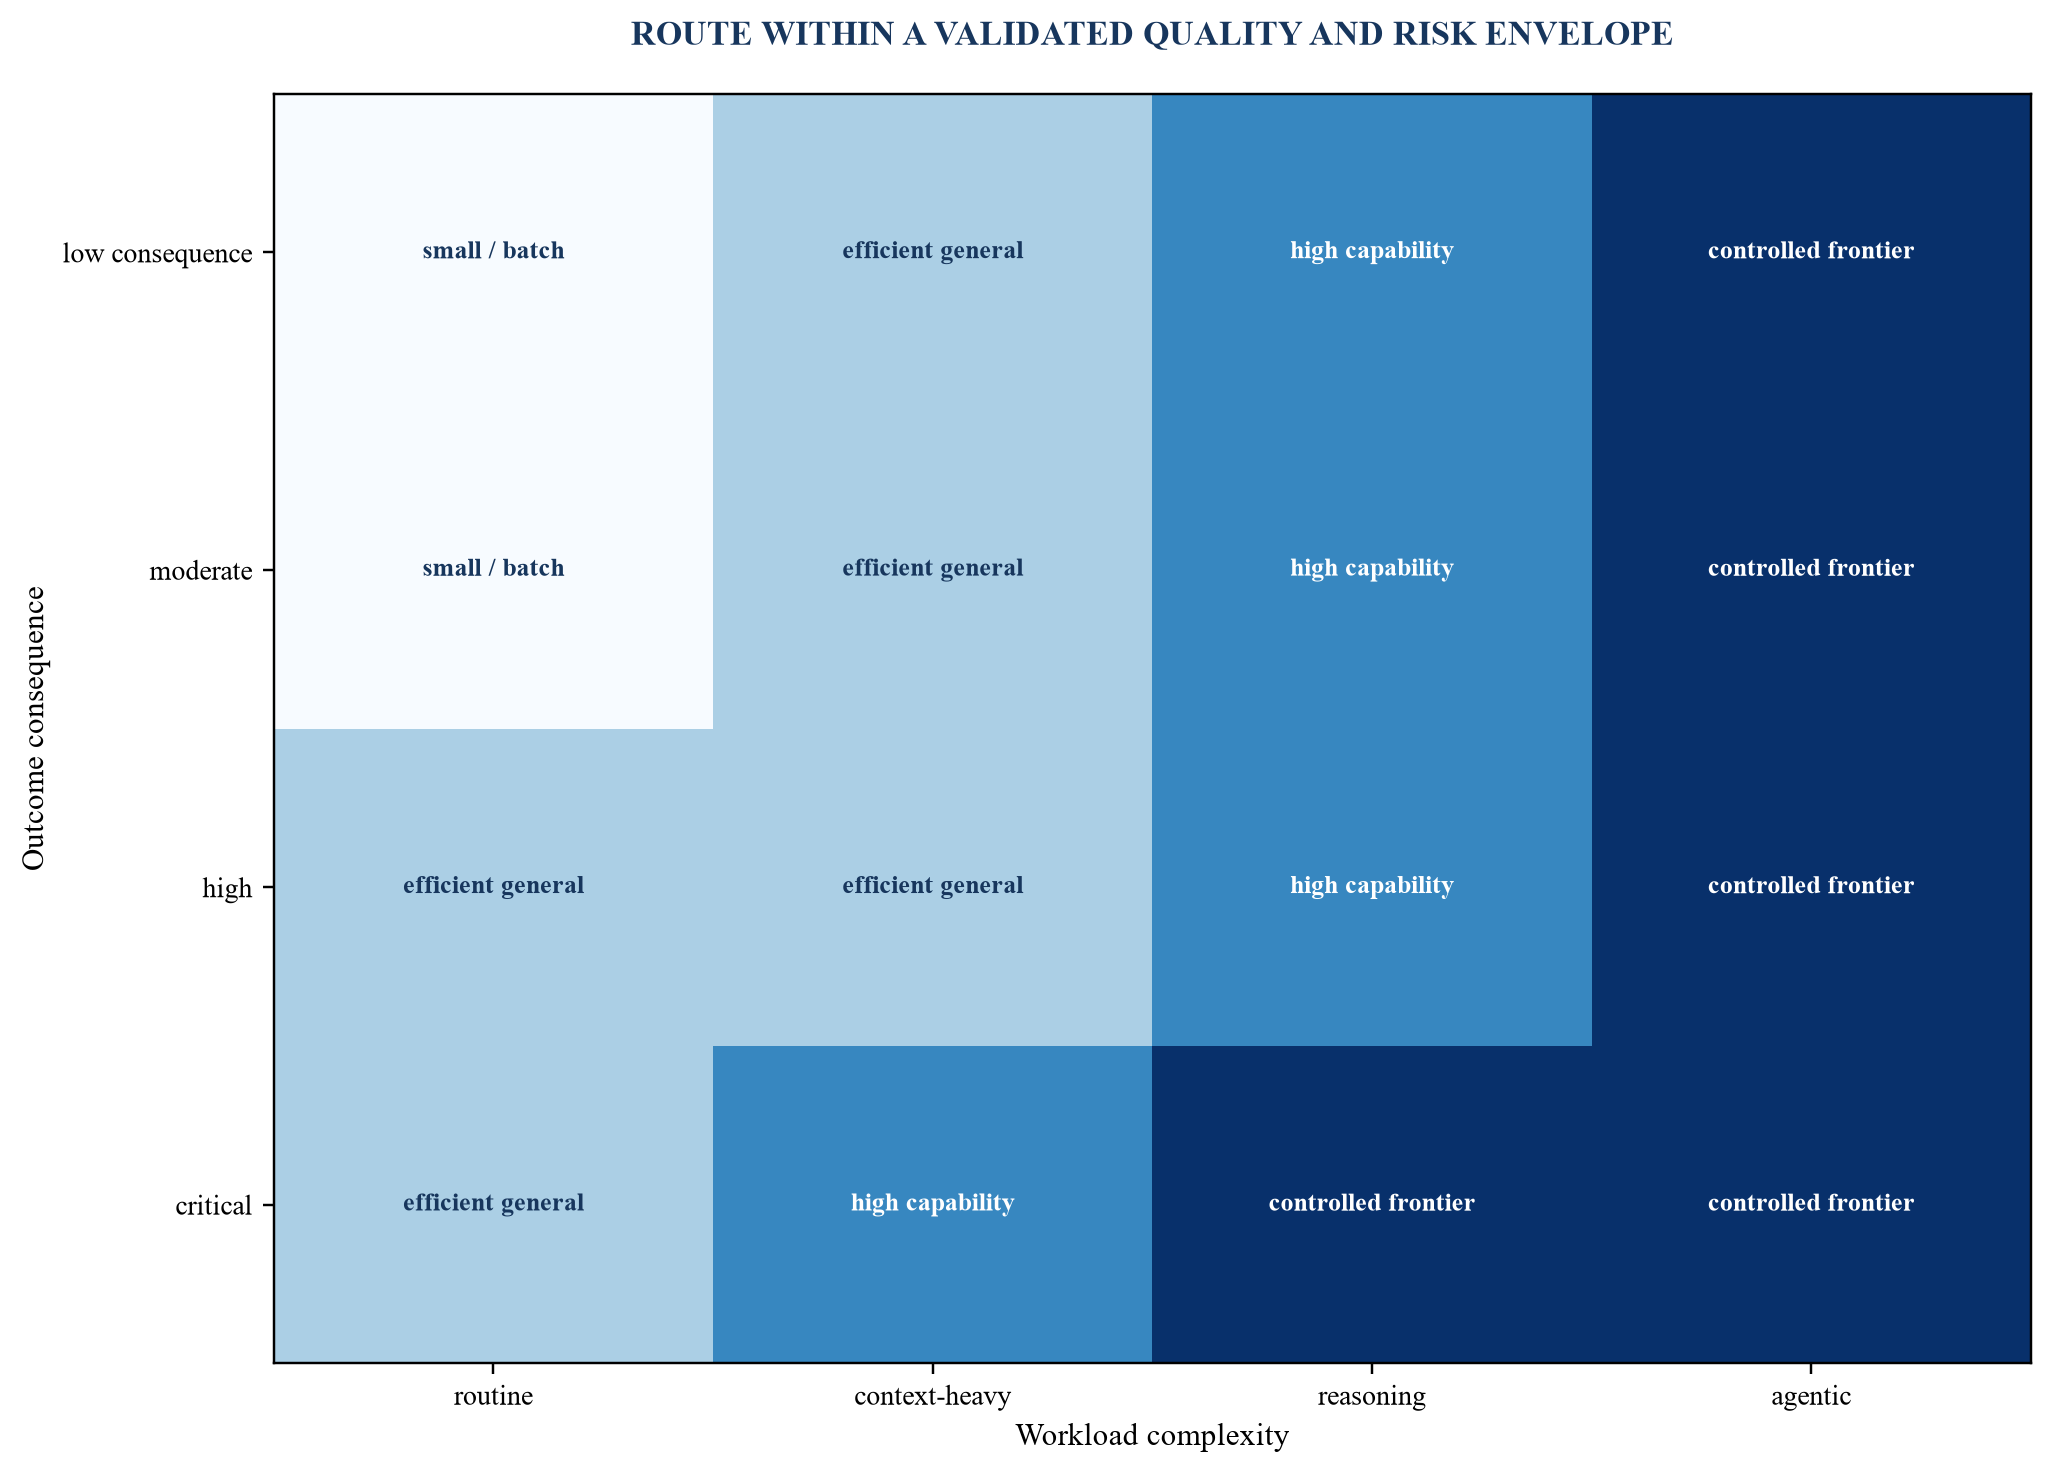
The approved route follows workload consequence and validated model capability.
Table 2. Routing policy and evidence matrix
| Workload class | Primary route | Required evidence | Escalation trigger |
|---|---|---|---|
| routine structured | efficient model or batch | acceptance, cost and latency | schema or quality failure |
| long repeated context | cached route | measured cache reads and quality | low hit rate or stale context |
| complex reasoning | high-capability model | contextual evaluation | low confidence or exception |
| agentic tool use | controlled model and tool set | tool accuracy and permission test | unsafe action or loop |
| critical outcome | approved frontier plus review | mandatory quality and oversight | any control exception |
| constrained region | eligible regional deployment | residency and capacity evidence | unavailable compliant route |
Routing policy combines economics with consequence and operating constraints.
10. Use batching when time has economic slack
Batch processing can lower provider cost or improve resource utilisation for workloads that tolerate delayed completion. Suitable tasks include document enrichment, evaluation, classification, embedding and back-office preparation with a defined completion window. Interactive customer requests usually require a different service path.
The batch case should include queueing, submission, storage, validation, error recovery and delayed value. Provider discounts can be attractive, while missed completion windows or large rework batches can harm operations. The unit remains an accepted output, not a submitted request.
Workload scheduling can improve cache or accelerator utilisation. Similar requests grouped in time may share context or fit provisioned capacity better. Scheduling rules should respect customer priority, data isolation and service commitments.
The enterprise should maintain a fallback for failed or incomplete batches. Reprocessing can change the effective discount and create capacity peaks. Finance should measure the first-pass completion rate and total cost after retries.
11. Choose between on-demand and provisioned capacity
On-demand services convert workload into variable cost and can suit uncertain or bursty demand. Provisioned throughput purchases capacity and predictable performance for a period. Its unit economics depend on committed price, usable throughput, utilisation, cache rate, request shape and service requirements.
Capacity sizing should use distributions, not only averages. Output-to-input ratios, concurrency, peaks and cache behaviour can affect throughput. Official provider sizing methods should be applied to the current deployment and verified through load tests.
Break-even compares the expected on-demand cost with the full provisioned commitment and operating effects. Underutilised capacity raises unit cost. Capacity shortages can create queueing, throttling, retries and revenue risk. Hybrid designs can use provisioned capacity for base load and on-demand routes for peaks where supported.
Commitment decisions should have review and exit dates. Forecast growth can support capacity purchase, while an unproven product should avoid converting speculative volume into fixed cost without downside headroom.
The capacity case should include service-level value. Predictable latency can improve customer experience, process throughput or contractual performance. That benefit should be measured where possible and separated from provider claims. A capacity premium can be economically rational when it protects material value.
Reservation granularity matters. A minimum commitment can exceed the needs of one product but be efficient across a portfolio. Shared capacity then needs priority rules, chargeback and peak coordination. The analysis should show product and enterprise views so one team does not appear efficient by consuming capacity paid for elsewhere.
Model lifecycle risk should enter the term decision. A long commitment tied to one snapshot can lose value if models, prices or product requirements change. Contract flexibility, transfer rights and upgrade conditions can be worth more than a small unit-rate reduction.
12. Manage utilisation, queueing and latency
High utilisation can improve direct infrastructure economics until queueing and tail latency deteriorate. Customer experience is often driven by the slowest relevant percentile rather than the mean. The service should measure time to first token, completion latency, queue time and end-to-end workflow duration.
Concurrency limits, rate limits and regional capacity can produce retries or fallback. These events add cost and may change model quality. The telemetry model should treat throttled and repeated calls as part of the original business output.
Latency has economic value when it changes conversion, staff time, process throughput or contractual performance. A faster response without measured workflow effect remains a technical improvement. The business case should connect speed to a defined outcome where possible.
Capacity policy can use admission control, priority queues, batch deferral, output limits and graceful degradation. These mechanisms should be tested under peak scenarios and reflected in customer service design.
13. Treat failover as a product capability
Failover protects the service when a model, deployment, region, provider or internal component becomes unavailable or unsuitable. It can involve an alternative model, region, provider, cached response, rules-based process or human fallback. The route should match the business consequence and data constraints.
Standby capacity, duplicate integrations, validation, data movement, testing and operating knowledge create ongoing cost. These costs belong to the products whose revenue and obligations they protect. Centralising them without allocation can overstate product margin.
Failover can change output behaviour. The alternative model may have different context, tools, latency, safety and quality. It should be validated for the permitted use and customer population. A technically successful response can remain commercially unacceptable.
The enterprise should record activation, duration, affected workload, outcome, incremental cost and recovery. Regular exercises reveal whether credentials, limits, data, prompts and runbooks remain current.
Failover routing should avoid uncontrolled recursion. An alternative that times out and returns to the original route can create duplicate spend and customer delay. The orchestration policy should set attempt limits, idempotency, timeout budgets and final abstention. The parent outcome record should include every failed route.
Recovery needs a decision separate from activation. Traffic may remain on the fallback after the incumbent returns until backlog, data consistency and stability are confirmed. The economic record should capture both directions and any period of duplicate operation. This helps management estimate the true cost of an incident and the value of resilience.
14. Price resilience against protected value
Resilience economics compare the annual or period cost of standby and testing with the revenue, service, customer and control consequence of disruption. Expected loss can support analysis, while intolerable outcomes may require controls independent of average probability.
Protection should be tiered. A critical decision service may require multi-region or multi-provider readiness. A low-consequence internal assistant may accept delay or manual fallback. Applying the highest standard to every workload can destroy contribution without corresponding value.
The frontier shows combinations of resilience cost and residual disruption exposure. Configurations that cost more and leave greater exposure are dominated. The selected point follows service obligations, impact tolerance and liquidity.
The case should avoid assuming independence between providers. Several routes can share cloud, networking, identity, model or data dependencies. Common points of failure reduce the diversification value of the fallback.
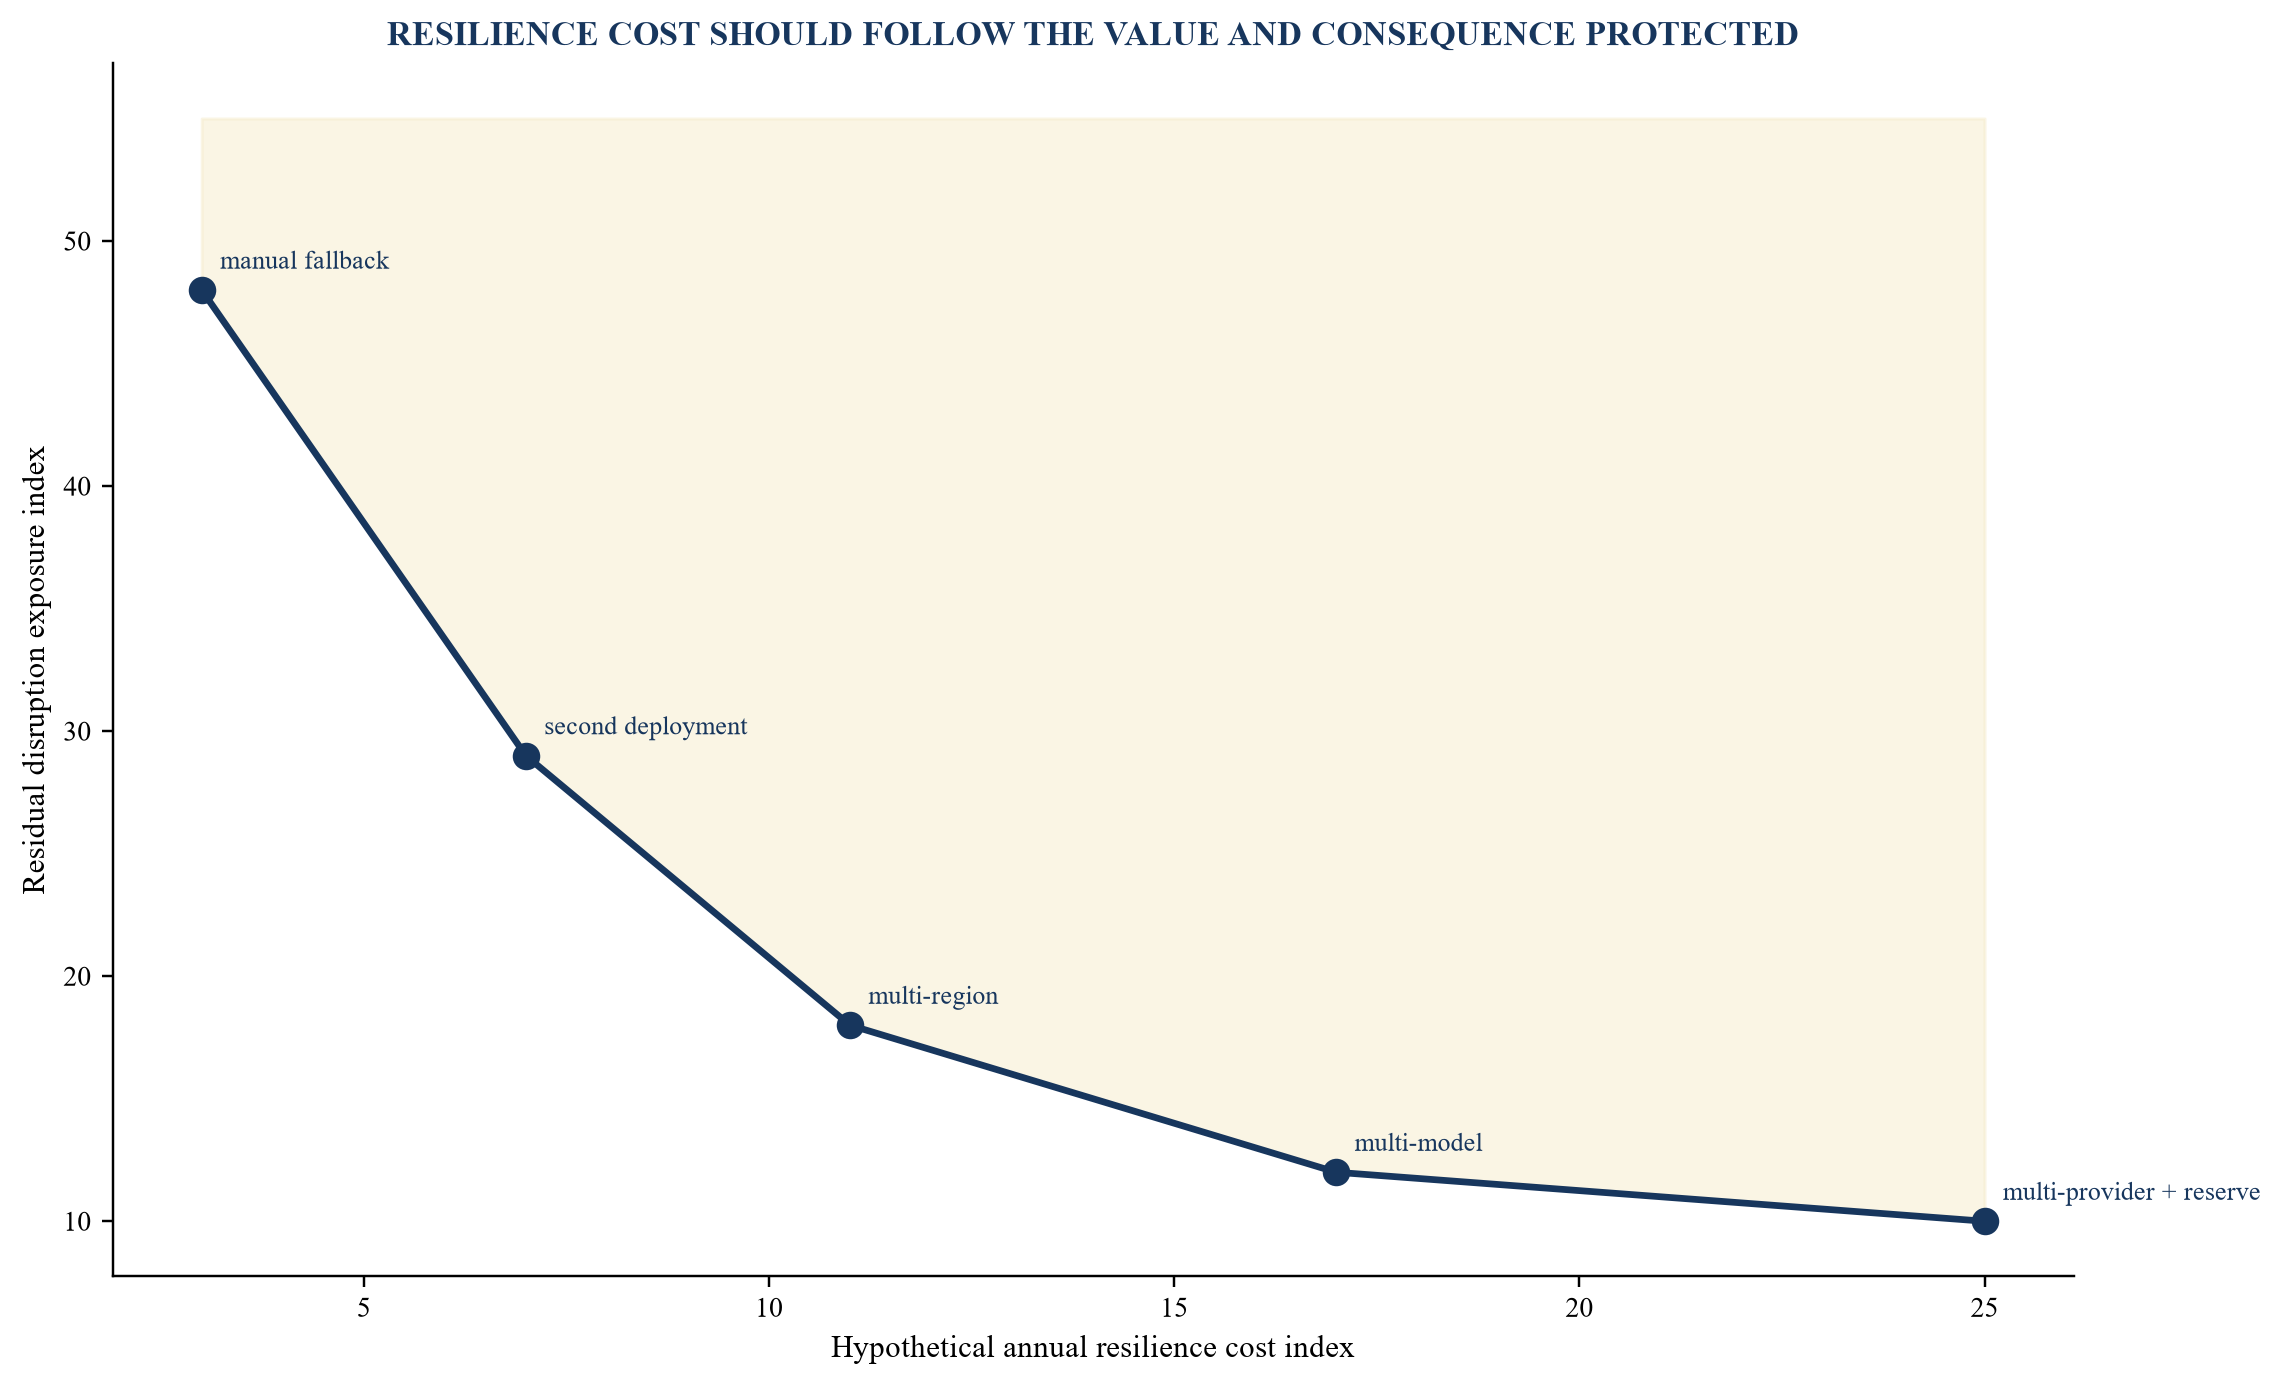
Hypothetical points compare annualised resilience cost with residual disruption exposure.
Table 3. Failover design and economic evidence
| Failure scope | Fallback | Cost evidence | Acceptance evidence |
|---|---|---|---|
| model | validated alternative model | route and evaluation cost | output threshold by cohort |
| deployment | secondary capacity | standby and usage commitment | load and recovery test |
| region | approved alternate region | duplicate services and transfer | residency and continuity |
| provider | independent stack | integration and operating team | full workflow rehearsal |
| retrieval or tool | contained workflow | degraded-service cost | safe completion or abstention |
| complete service | manual or delayed process | sustainable staff capacity | impact tolerance and controls |
Each fallback is tested as a complete service route.
15. Optimise retrieval before expanding context
Retrieval-augmented generation is a pipeline of ingestion, chunking, embedding, storage, retrieval, reranking, context assembly and generation. End-to-end economics should include each component and the quality effect. MLCommons introduced an end-to-end RAG benchmark that reflects this multi-stage structure.
Increasing retrieved context can raise input cost and latency while introducing irrelevant material. Retrieval quality, document freshness, access control and citation remain critical. The optimisation target is accepted grounded output per unit of total cost.
The product should measure documents retrieved, useful-context ratio, cache reuse, citation accuracy, abstention, review and outcome. A lower generation price can be outweighed by excessive retrieval and prompt length.
Indexing and embedding costs should be allocated over the outputs and period they support. High change rates can increase refresh cost. Customer-specific indexes may create different unit economics and gross margins.
16. Control agentic loops and tool expenditure
Agentic systems can make several inference and tool calls before completion. Loop count, planning steps, retries, searches, browser actions, code execution and external APIs can multiply cost. The final visible answer may conceal this chain.
The orchestration record should connect every child call to the parent outcome. It should capture stop reason, tool result, error and cost. Abandoned and timed-out workflows remain part of product economics.
Budgets can be expressed as maximum steps, tokens, time, tool calls or spend within a risk policy. The system can escalate, abstain or request human input when the limit is reached. Hard caps should be tested for their effect on accepted outcomes.
Optimisation can reduce unnecessary context, tool duplication and repeated reasoning. Changes should be evaluated on task completion, quality, control and total cost. A shorter trace that increases human correction may not improve contribution.
17. Allocate observability, evaluation and control cost
Logs, traces, metrics, evaluations, red-team tests, guardrails and security controls enable dependable operation. They consume storage, compute, licences and specialist time. Product economics should include an allocation that reflects workload and risk.
Sampling can reduce cost when designed appropriately. High-consequence events may require complete records, while low-risk routine traffic can use statistically useful samples. Retention and access should follow legal, customer and control requirements.
Evaluation cost includes test-data preparation, model judging, human review and release analysis. Continuous evaluation can detect drift and route degradation. The cost should be compared with the exposure it controls and the value of faster release decisions.
Control cost can decline with reusable evidence and shared platforms. The allocation model should avoid charging each product for the full shared capability while also avoiding a central pool that hides the cost of high-risk workloads.
18. Build the product gross-margin bridge
Revenue should be associated with the customer and period receiving the service. Usage-based, subscription, transaction and outcome pricing can create different relationships between volume and revenue. Discounts, service credits, refunds and implementation fees should be classified consistently.
Direct product cost includes provider inference, retrieval, tools, dedicated infrastructure, variable support, human review and allocated resilience required to deliver the service. Management can show contribution before and after shared platform and control allocations.
The bridge should explain movement from list price or contracted revenue to collected cash and contribution. Adoption, overage, underuse, failure, credits, customer-specific work and support can materially change realised economics.
Price should follow customer value and service economics. A token pass-through can be transparent but may misalign with accepted outcomes. A fixed subscription can protect simplicity while exposing the provider to workload mix. Pricing design needs guardrails and cohort monitoring.
The bridge should distinguish gross margin from contribution definitions used by management. Direct support, customer success, implementation and allocated shared platform cost can sit in different lines under different policies. The paper's framework requires consistency and reconciliation; it does not impose one accounting classification. External reporting should follow applicable standards and qualified advice.
Revenue recognition and cash collection remain separate from contracted price. Acceptance clauses, usage disputes, service credits and payment timing can weaken cash conversion. Product economics should show contracted revenue, recognised revenue, invoiced amount and collected cash where these distinctions affect decisions.
The gross-margin bridge should retain volume and mix. A margin percentage can improve while absolute contribution falls, or deteriorate during a strategically valuable customer ramp. Management should examine accepted outputs, contribution amount, rate and cash together.
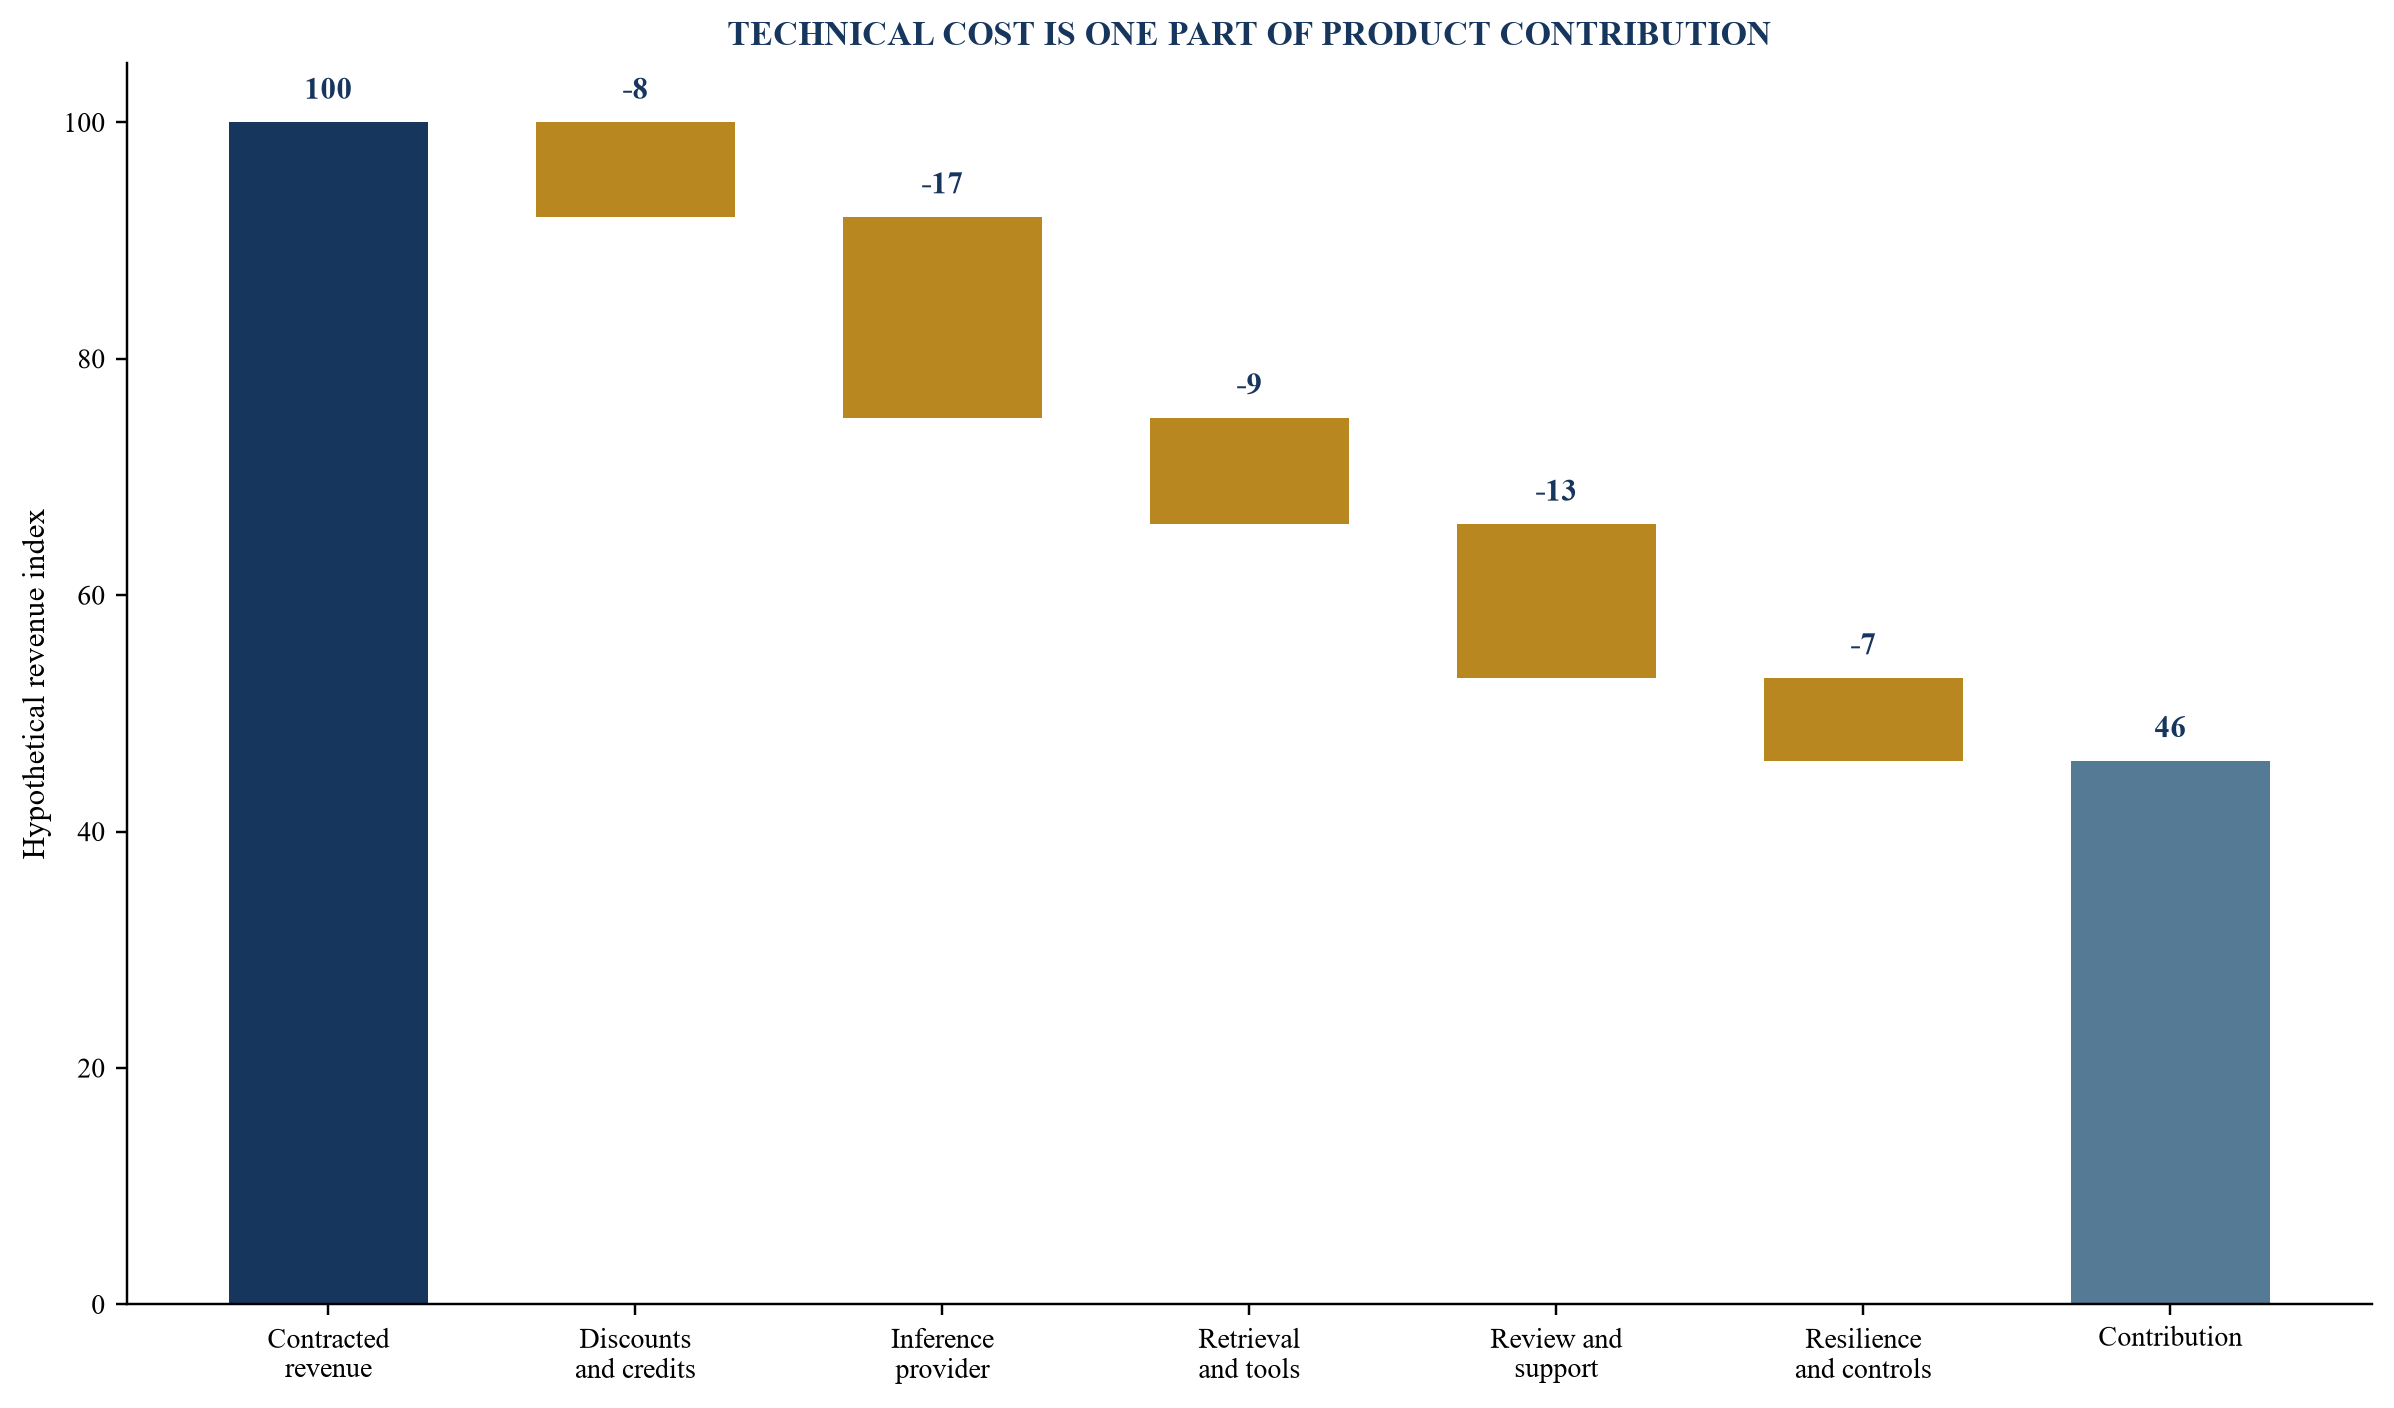
Hypothetical values show technical savings being reduced by delivery and resilience costs.
19. Reconstruct economics by customer cohort
Average product margin can conceal loss-making cohorts. Customer document length, language, integration, support, review, latency and usage shape can differ. The cohort design should follow material economic drivers and remain stable enough for comparison.
Each cohort should show accepted outputs, revenue, discounts, provider cost, retrieval, tools, review, support, resilience and allocated platform cost. Gross contribution and cash conversion should reconcile to finance records.
Contract terms can create nonlinear economics. Included volumes, overage, minimum commitments, service levels and bespoke obligations affect contribution. A high-volume customer can improve cache and capacity utilisation while also increasing concentration and peak exposure.
Cohort findings should drive pricing, product configuration and customer success. The objective is to improve the service and commercial model within agreed obligations. Unsupported reallocation of cost cannot create enterprise value.
Customer acquisition and implementation can be shown beside recurring contribution. A customer with positive steady-state margin may require substantial data preparation, integration and assurance before launch. Payback and cash exposure should be measured with the contract term, termination rights and implementation receipts. This prevents recurring gross margin from obscuring the capital needed to create it.
Retention analysis should connect economic and service cohorts. Customers with heavy review or support may also generate valuable data, references or expansion. Those benefits require evidence and governance. Management should not use a broad strategic label to conceal a cohort whose expected cash and operating burden remain unattractive.
20. Reconcile engineering metrics to the ledger
Engineering telemetry and financial systems operate on different timing and structures. Usage can occur in one period and be invoiced later. Credits, commitments and shared accounts can change billed cost. Finance should maintain a reconciliation rather than replacing one source with the other.
The process should compare technical quantity times contractual rate with provider invoice, accrued cost and cash. Variances can arise from tiering, rounding, currency, tax, free allowances, late adjustments or missing tags. Each material variance needs an owner and treatment.
Allocation keys should be governed. Customer, product, model, project and region tags can support direct attribution. Unallocated cost should be visible and reduced over time. Changing keys should be documented so historical trends remain interpretable.
The close pack should connect cost to accepted outputs and revenue. This creates product-level contribution evidence for management, investors, lenders and transaction diligence without requiring technical detail to be recreated manually.
Close controls should include duplicate, missing and late usage. Provider accounts may contain development, evaluation and production traffic. Tags and projects should separate these purposes, while finance also needs a residual account for unattributed spend. Material unexplained usage should remain visible until resolved.
Accrual methods should respond to data latency. Where current provider usage is available, quantity and contracted rate can support an estimate. Where it is incomplete, historical run rates and workload drivers may be used with an explicit uncertainty range. Subsequent invoice differences should true up the estimate and improve the method.
Benefits also need ledger discipline. Avoided cost does not create cash when a minimum commitment remains payable. Released engineer time creates value only when capacity is removed or redeployed to a measured priority. The value office should classify cash saving, cost avoidance, capacity release, revenue effect and risk reduction separately.
21. Prioritise the optimisation backlog by contribution
The backlog should state the current baseline, proposed mechanism, affected cohort, implementation cost, control requirement, expected contribution effect and experiment. Items can include prompt reduction, cache policy, model route, output limit, retrieval improvement, batch conversion, capacity commitment, retry control and support automation.
Priority should follow expected value, evidence quality, reversibility and time. A small change with clear telemetry can be tested before a large architecture programme. High-impact unknowns may justify a bounded discovery phase.
Savings should be measured after release using comparable workloads. Volume, mix and quality changes need adjustment. A provider-cost reduction should reconcile to invoice and product contribution before it is reported as realised value.
The backlog should also include reliability and customer value. An improvement that reduces incident load or review can create more contribution than a token discount. Finance and engineering should approve a common measure.
Table 5. Optimisation investment gate
| Proposed lever | Baseline evidence | Experiment | Release condition |
|---|---|---|---|
| caching | repeated prefixes, rates and current hit data | controlled cached cohort | positive net contribution and approved data treatment |
| routing | workload classes and candidate evaluations | shadow or bounded route | quality threshold and lower accepted-output cost |
| batching | completion-window tolerance and failure history | scheduled representative jobs | complete output inside service window |
| capacity | request distribution, peaks and forecast | load and utilisation test | funded downside and service value |
| failover | impact tolerance and common dependencies | full route rehearsal | accepted output and recovery evidence |
| retrieval | context cost and grounding quality | alternative retrieval configuration | improved grounded contribution |
Capital follows a testable contribution mechanism and defined control conditions.
22. Contract for measurable economic levers
Provider and cloud agreements can affect rates, commitments, credits, capacity, cache pricing, routing, service levels, regions, model changes and termination. The commercial team should connect each term to workload evidence and downside cases.
Commitments require credible demand. The case should show base utilisation, peak, growth, cache and routing assumptions, together with the cost of underuse. Flexibility can have value when model generations and product demand change quickly.
Usage reporting and auditability matter. The enterprise needs sufficient data to reconcile token categories, deployments, capacity and adjustments. Contractual support for transitions and model changes can protect product continuity.
Negotiated savings should enter the same unit-economic model as engineering changes. Credits and temporary concessions should be separated from permanent rate or structure changes. This prevents a short-term benefit from being presented as durable margin.
23. Govern cost optimisation within the risk envelope
Cost changes can affect quality, fairness, privacy, security, resilience and customer commitments. The approval route should follow the consequence of the use case. Low-risk prompt changes can use automated tests, while critical routing or fallback changes may need independent review.
The NIST AI Risk Management Framework and generative-AI profile provide structures for governing and monitoring AI risk. Secure-development guidance emphasises system security across design, development, deployment and operation. The economic framework should link to these controls rather than operate separately.
Release evidence should include workload, comparator, thresholds, failure modes, security, rollback and owner. Observed savings do not authorise use outside the validated operating envelope.
Post-release monitoring should detect cost, quality, route, cache, latency and incident changes. Triggers should define when to contain, revert or revalidate. This protects customer value while allowing controlled optimisation.
24. Run a worked hypothetical example
Consider a document-review product priced at a hypothetical revenue index of 100 for a customer cohort. The baseline direct cost is 62: model inference 24, retrieval and tools 10, human review and support 16, resilience and controls 8, and other delivery 4. Baseline contribution is therefore 38.
Engineering introduces prompt caching and a two-tier router. Assume provider inference falls by 9. Retrieval improves by 1. Router errors create 2 of retries and additional review. Cache and routing observability adds 1. Provisioned fallback capacity adds 2. Net direct cost falls from 62 to 57, producing a hypothetical contribution of 43.
The provider-cost dashboard would report a saving of 9, while the product bridge shows a contribution improvement of 5. Both figures are useful within their definitions. The difference protects management from pricing, forecasting or valuation decisions based on an incomplete cost line.
All amounts, volumes, hit rates and changes in this example are analytical assumptions. A real decision requires current contracts, representative workloads, evaluation, invoices, operating records and customer obligations.
25. Build the finance and engineering scorecard
The scorecard should present accepted outputs, revenue, contribution, request shape, provider usage, cache, routing, failures, latency, review and resilience. Measures need definitions, owners, sources, periods and thresholds.
Leading indicators include cache-read rate, router distribution, output length, retry, queue time, capacity utilisation and fallback readiness. Lagging indicators include accepted-output cost, gross contribution, cash, incidents, credits and customer retention.
The board or product committee should see current state, target, evidence quality and decisions required. A traffic-light summary should link to source records. Mandatory quality or control conditions should remain separate from weighted economic scores.
The decision record should state which changes were approved, expected contribution, capital required, downside, revalidation triggers and accountable owner. Realised outcomes should be reviewed against this record.
Table 4. Finance and engineering scorecard
| Domain | Measure | Evidence source | Decision use |
|---|---|---|---|
| value | accepted outputs and customer outcome | workflow and acceptance record | price and product fit |
| revenue | contract, usage, credits and cash | billing and ledger | commercial quality |
| inference | token categories and model route | provider and gateway telemetry | direct cost control |
| efficiency | cache, batch, latency and utilisation | traces and capacity records | engineering priority |
| quality | tests, retries, review and exceptions | evaluation and operations | operating envelope |
| resilience | failover readiness and activation | rehearsal and incident logs | protected value |
| contribution | revenue less complete direct cost | governed finance model | portfolio and capital |
The scorecard connects technical levers to accepted-output economics and controls.
26. Translate unit economics into transaction diligence
Investors, lenders and acquirers should examine whether reported AI gross margin includes the complete inference service. Diligence needs provider agreements, usage, telemetry, architecture, cohort economics, human review, support, resilience and shared-cost allocations.
Temporary credits, introductory rates, absorbed engineering and underallocated control can inflate early margin. Commitments and provisioned capacity can create future fixed cost. Renewal and model changes can alter unit economics. These items should be normalised with evidence.
Technical differentiation may create value through quality, cost, speed, data or customer adoption. The diligence pack should connect the claimed advantage to comparable cohorts and accepted outcomes. Model access alone may be broadly available.
Valuation and transaction conclusions require case-specific analysis and qualified advisers. The framework supplies a reproducible operating and financial evidence base for those decisions.
Carve-outs and integrations need special attention. Shared gateways, provider commitments, evaluation platforms and specialist teams may not transfer cleanly. A standalone cost model should include replacement capacity, new minimum commitments and transitional services. The integration plan should identify whether model routing or caching policies can be consolidated without weakening customer obligations.
Debt diligence should examine cash volatility and concentration. Usage-based inference creates variable cost, while provisioned commitments create fixed exposure. Provider concentration, renewal, rate limits and failover affect operating resilience and covenant headroom. Evidence from customer cohorts and downside cases can support a more credible financing assessment.
27. Operate a continuous inference value office
The value office brings product, engineering, finance, commercial, risk, security and operations into a common cadence. Weekly reviews can manage experiments, anomalies and service issues. Monthly reviews reconcile costs, accepted outputs, revenue, contribution and benefits.
The office should maintain the cost tree, workload taxonomy, rate card, router policy, cache policy, capacity plan, failover register and evidence dictionary. Version control connects releases to economic outcomes.
Optimisation should remain a portfolio. Some changes reduce provider cost, others improve quality, resilience, review or revenue. A common contribution measure supports priority while preserving mandatory controls.
The operating objective is durable product value. Caching, routing and failover become management levers when their technical events can be traced to customer outcomes, invoices, margin and cash. The evidence system should make that connection routine.
The office should maintain a controlled experiment register. It records hypothesis, workload, configuration, start and end, expected contribution, mandatory thresholds and decision. Simultaneous changes should be limited where they prevent attribution. Results that fail should remain in the record so the organisation does not repeat an uneconomic or unsafe optimisation.
Provider changes should enter the cadence quickly. New rates, models, cache rules, capacity, limits and retirement notices can alter the frontier. Commercial and engineering owners should assess the affected products, while finance updates scenarios only after the applicable terms and effective dates are verified.
The portfolio view should identify common leverage. A shared gateway, evaluation library or contract can improve several products. The value office should allocate investment and benefits transparently, protecting product accountability and avoiding duplicated work. Shared capability should still have service owners, operating cost and resilience evidence.
Management should review whether the chosen unit continues to reflect customer value. Products evolve from assistance to workflow completion or from pilot to contracted service. The unit definition, pricing and cost allocation may need to change together. A controlled transition preserves historical comparability and explains the new economic model.
Conclusion
Inference unit economics require a complete product view. Tokens and model rates remain important, together with retrieval, tools, retries, evaluation, review, observability, capacity, support and resilience. The accepted business output provides the bridge between technical consumption and customer value.
Caching creates contribution when measured reads exceed writes and operating cost within the actual workload. Routing creates contribution when a validated model mix lowers total cost inside an approved quality and risk envelope. Failover creates value by protecting revenue and obligations at a proportionate cost. Each lever needs current telemetry and controlled experiments.
The shared finance and engineering model reconciles requests, releases, provider usage, invoices, customer cohorts, accepted outputs and cash. It turns optimisation into a governed value programme and provides credible evidence for pricing, capital allocation, financing and transaction diligence.
Durable improvement requires precise definitions and repeatable evidence. Management should know which workload changed, which cost moved, which quality and control conditions remained satisfied, and how the result reached the ledger. This discipline allows rapid technical experimentation while preserving a dependable commercial record. It also makes the next decision clearer when providers, models, prices, customer demand or operating obligations change.
The resulting operating record supports product governance, customer assurance and external diligence. It shows the organisation can explain its AI economics from technical event to accepted outcome, rather than relying on a headline model rate or an unreconciled dashboard.
References
- MLCommons. MLPerf Inference benchmarks. https://mlcommons.org/working-groups/benchmarks/inference/
- MLCommons. MLPerf Inference documentation. https://docs.mlcommons.org/inference/
- MLCommons. End-to-End Retrieval-Augmented Generation Inference Benchmark. https://mlcommons.org/2026/08/endtoend-inference/
- FinOps Open Cost and Usage Specification. Calculate unit economics. https://focus.finops.org/docs/use-cases/v1-4/calculate-unit-economics/
- FinOps Foundation. FinOps Framework 2025. https://www.finops.org/wp-content/uploads/2025/05/English-FinOps-Framework-2025.pdf
- FinOps Open Cost and Usage Specification. FOCUS Specification. https://focus.finops.org/wp-content/uploads/2024/11/FOCUS-spec-v1_1.pdf
- Amazon Web Services. Prompt caching for faster model inference. https://docs.aws.amazon.com/bedrock/latest/userguide/prompt-caching.html
- Amazon Web Services. Understanding intelligent prompt routing in Amazon Bedrock. https://docs.aws.amazon.com/bedrock/latest/userguide/prompt-routing.html
- Amazon Web Services. Amazon Bedrock pricing. https://aws.amazon.com/bedrock/pricing/
- Amazon Web Services. Amazon Bedrock cost optimisation. https://aws.amazon.com/bedrock/cost-optimization/
- Amazon Web Services. Generative AI Lens, AWS Well-Architected Framework. https://docs.aws.amazon.com/pdfs/wellarchitected/latest/generative-ai-lens/generative-ai-lens.pdf
- Microsoft. Prompt caching with Azure OpenAI in Microsoft Foundry Models. https://learn.microsoft.com/en-us/azure/ai-services/openai/how-to/prompt-caching
- Microsoft. Provisioned throughput for Foundry Models. https://learn.microsoft.com/en-us/azure/foundry/openai/concepts/provisioned-throughput
- Microsoft. How model router works in Microsoft Foundry. https://learn.microsoft.com/en-us/azure/foundry/openai/concepts/model-router-how-it-works
- OpenAI. API model pricing and cached input. https://developers.openai.com/api/docs/models/gpt-4o
- OpenAI. Scale Tier for API customers. https://openai.com/api-scale-tier/
- OpenAI. Batch API reference. https://platform.openai.com/docs/api-reference/batch/object
- OpenAI. Reviewing API usage and costs. https://help.openai.com/en/articles/10478918-api-usage-dashboard
- National Institute of Standards and Technology. Artificial Intelligence Risk Management Framework. https://www.nist.gov/itl/ai-risk-management-framework
- National Institute of Standards and Technology. AI Risk Management Framework 1.0. https://nvlpubs.nist.gov/nistpubs/ai/NIST.AI.100-1.pdf
- National Institute of Standards and Technology. Generative Artificial Intelligence Profile. https://nvlpubs.nist.gov/nistpubs/ai/NIST.AI.600-1.pdf
- UK National Cyber Security Centre. Guidelines for Secure AI System Development. https://www.ncsc.gov.uk/collection/guidelines-secure-ai-system-development
- Central Bank of the United Arab Emirates. Guidance Note on Consumer Protection and Responsible Adoption and Use of Artificial Intelligence and Machine Learning. https://rulebook.centralbank.ae/en/rulebook/guidance-note-consumer-protection-and-responsible-adoption-and-use-artificial-intelligence
- Dubai Financial Services Authority. AI Survey 2025. https://www.dfsa.ae/news/new-dfsa-ai-survey-generative-ai-adoption-has-nearly-tripled-within-difc-last-12-months-governance-continues-develop
- Organisation for Economic Co-operation and Development. OECD AI Principles. https://oecd.ai/en/ai-principles
