

Introduction
Ancillary services can be the first commercial market available to a battery. Frequency regulation and operating reserves reward fast response, accurate control and availability. A battery can change output in milliseconds, provide upward and downward response, and avoid the fuel and start-up constraints of many conventional generators. Early entrants may therefore earn high revenue from a market whose required volume is small relative to the future storage pipeline.
That revenue can compress quickly. System operators procure a defined quantity of regulation, contingency response or reserve. Battery developers can add qualified supply faster than the requirement expands. Competitive clearing then moves toward the opportunity cost of the marginal provider. The first project may have entered when supply was scarce; the tenth project may bid into a market with several times the required capability. The asset remains technically useful, but the relevant revenue pool is shared across more megawatts.
Official evidence already records this pattern. California ISO reported that battery capacity grew faster than ancillary-service requirements for six years through 2024. Batteries offered many times the regulation requirement and supplied nearly 84% of balancing-area regulation in 2024 [3]. The Australian Energy Regulator reported total National Electricity Market frequency-control ancillary-service costs of AUD 9.2 million in the second quarter of 2026, the lowest quarterly cost since at least 2016, after additional predominantly battery participants entered [8]. ERCOT's July 2025 monthly report described increasing competition, declining revenues and greater price volatility for batteries in ancillary services [12].
This paper asks how an investment committee should recognise saturation before it appears in historical revenue. The analysis covers market definition, supply qualification, bid behaviour, co-optimisation, revenue migration, degradation, project finance, valuation and governance. It distinguishes observed public data from author modelling assumptions. It does not estimate the value of a named asset.
1 Define the service before measuring saturation
Ancillary service is a broad label. A market may procure regulation, primary response, contingency reserve, spinning reserve, non-spinning reserve, replacement reserve, ramping, voltage support, inertia, restoration or another operating capability. Each product has its own response time, duration, telemetry, accuracy, availability and activation requirements. Saturation should therefore be measured by product rather than by battery capacity alone.
Frequency regulation usually requires continuous movement around a base point. Contingency response activates after a defined disturbance. Reserve products can require sustained output for minutes or hours. Some markets procure symmetric upward and downward capability; others procure separate directions. State-of-charge management and energy settlement determine whether a battery can offer its full nameplate power throughout the service window.
The procurement design matters. Pay-as-clear and pay-as-bid auctions create different incentives. Day-ahead auctions expose providers to later energy prices. Real-time co-optimisation can substitute energy and reserve based on current opportunity cost. Administrative procurement volumes, price caps and minimum offer sizes shape market depth. A project model should reproduce the actual product and settlement rather than apply one generic ancillary-service price.
FERC Order No. 841 required US regional grid operators to establish participation models that permit storage to provide the capacity, energy and ancillary services it is technically capable of providing [18]. Market access expands the eligible supply set. It does not create an unlimited requirement. The commercial question is how much qualified supply will compete for each procured megawatt during the project life.
2 Measure market depth with qualified supply
Installed battery capacity is a weak saturation measure because some assets lack qualification, telemetry, state-of-charge capability or commercial intent for a given service. A stronger metric compares qualified offerable capacity with the system operator's requirement in the same product, direction, location and time block.
Define the service depth ratio as qualified offerable megawatts divided by procured megawatts. A ratio below one indicates insufficient qualified supply. A ratio modestly above one can still support scarcity pricing when outages, charging needs or opportunity cost remove capacity. A large ratio means many providers can meet the requirement, subject to concentration and bidding conduct. The ratio should be calculated for every settlement interval or procurement block because solar conditions, energy spreads and local constraints change opportunity cost.
Offerable capacity should reflect physical and contractual limits. A 100 MW battery that reserves 20 MW for a capacity obligation, faces a 70 MW connection limit and needs 15 MW of state-of-charge protection cannot offer 100 MW to every ancillary product. Simultaneous-product rules can also cap the combined offer. Great Britain's Enduring Auction Capability platform applies validation rules to prevent battery overbidding and permits co-optimised offers across dynamic response and reserve products [15].
The investment model should forecast the numerator and denominator separately. The numerator depends on commissioned projects, qualification timing, bidding strategy and competing technologies. The denominator depends on system size, largest credible loss, inertia, renewable variability, load, procurement policy and new product definitions. Saturation occurs when offerable supply grows faster than the requirement and competition reaches the intervals that mattered to the base case.
3 Recognise the early-market revenue pattern
Early ancillary markets often contain a temporary combination of low qualified supply, new technical requirements and cautious procurement. Prices can remain near caps or above long-run opportunity cost until additional providers qualify. Historical revenue earned in this phase can overstate the sustainable return for projects that commission later.
Great Britain's Dynamic Containment service illustrates the sequence. The system operator launched the service in 2020 and initially procured from a small battery fleet. A historical NESO study reported early prices near the market cap before supply increased and prices began to fluctuate lower [17]. The current market procures Dynamic Containment, Dynamic Moderation and Dynamic Regulation through competitive auctions with defined technical requirements [14]. The relevant forward case now depends on auction liquidity, product interaction and changing system need.
Australia provides another example. AEMO reported that new battery and demand-response entry contributed to a 57% reduction in FCAS costs between the fourth quarter of 2017 and the first quarter of 2018 [6]. Battery FCAS market share later reached 39% by volume in the third quarter of 2022 [7]. By the second quarter of 2026, the AER recorded further participant entry and the lowest quarterly FCAS cost since at least 2016 [8].
These observations do not imply a smooth decline. Transmission outages, regional separation, generator outages and changing requirements can create spikes. A saturated national market can contain valuable local intervals. Underwriting should preserve this distinction and avoid treating a few scarcity events as evidence of a stable annual revenue floor.
4 Distinguish price compression from revenue dilution
Price compression occurs when competition lowers the clearing or accepted price for a service. Revenue dilution occurs when a battery wins fewer megawatts or fewer intervals because more providers compete. The effects can occur together or separately.
A project can retain a high win rate while price falls if its bid remains below competitors. It can also face lower utilisation while the clearing price remains stable if the operator reduces procurement or another resource type displaces its offers. Co-optimisation can redirect the battery into energy when the opportunity cost of reserve becomes too high. The revenue line then falls even if the service price has not changed materially.
Historical reporting should therefore be decomposed into awarded megawatts, service hours, clearing price, activation energy, performance adjustment and settlement cost. Annual revenue divided by installed megawatts conceals changes in participation and market rules. A lender needs the cash receipt generated by an enforceable offer strategy, net of charging, degradation, imbalance, penalties and operating cost.
The California ISO battery report shows that the share of battery capacity scheduled for ancillary services declined as the fleet grew, while batteries supplied most regulation in 2024 [3]. This is a revenue-allocation signal. More storage capacity had to find value in energy shifting, other reserve products or capacity arrangements because the regulation requirement did not expand at the same rate.
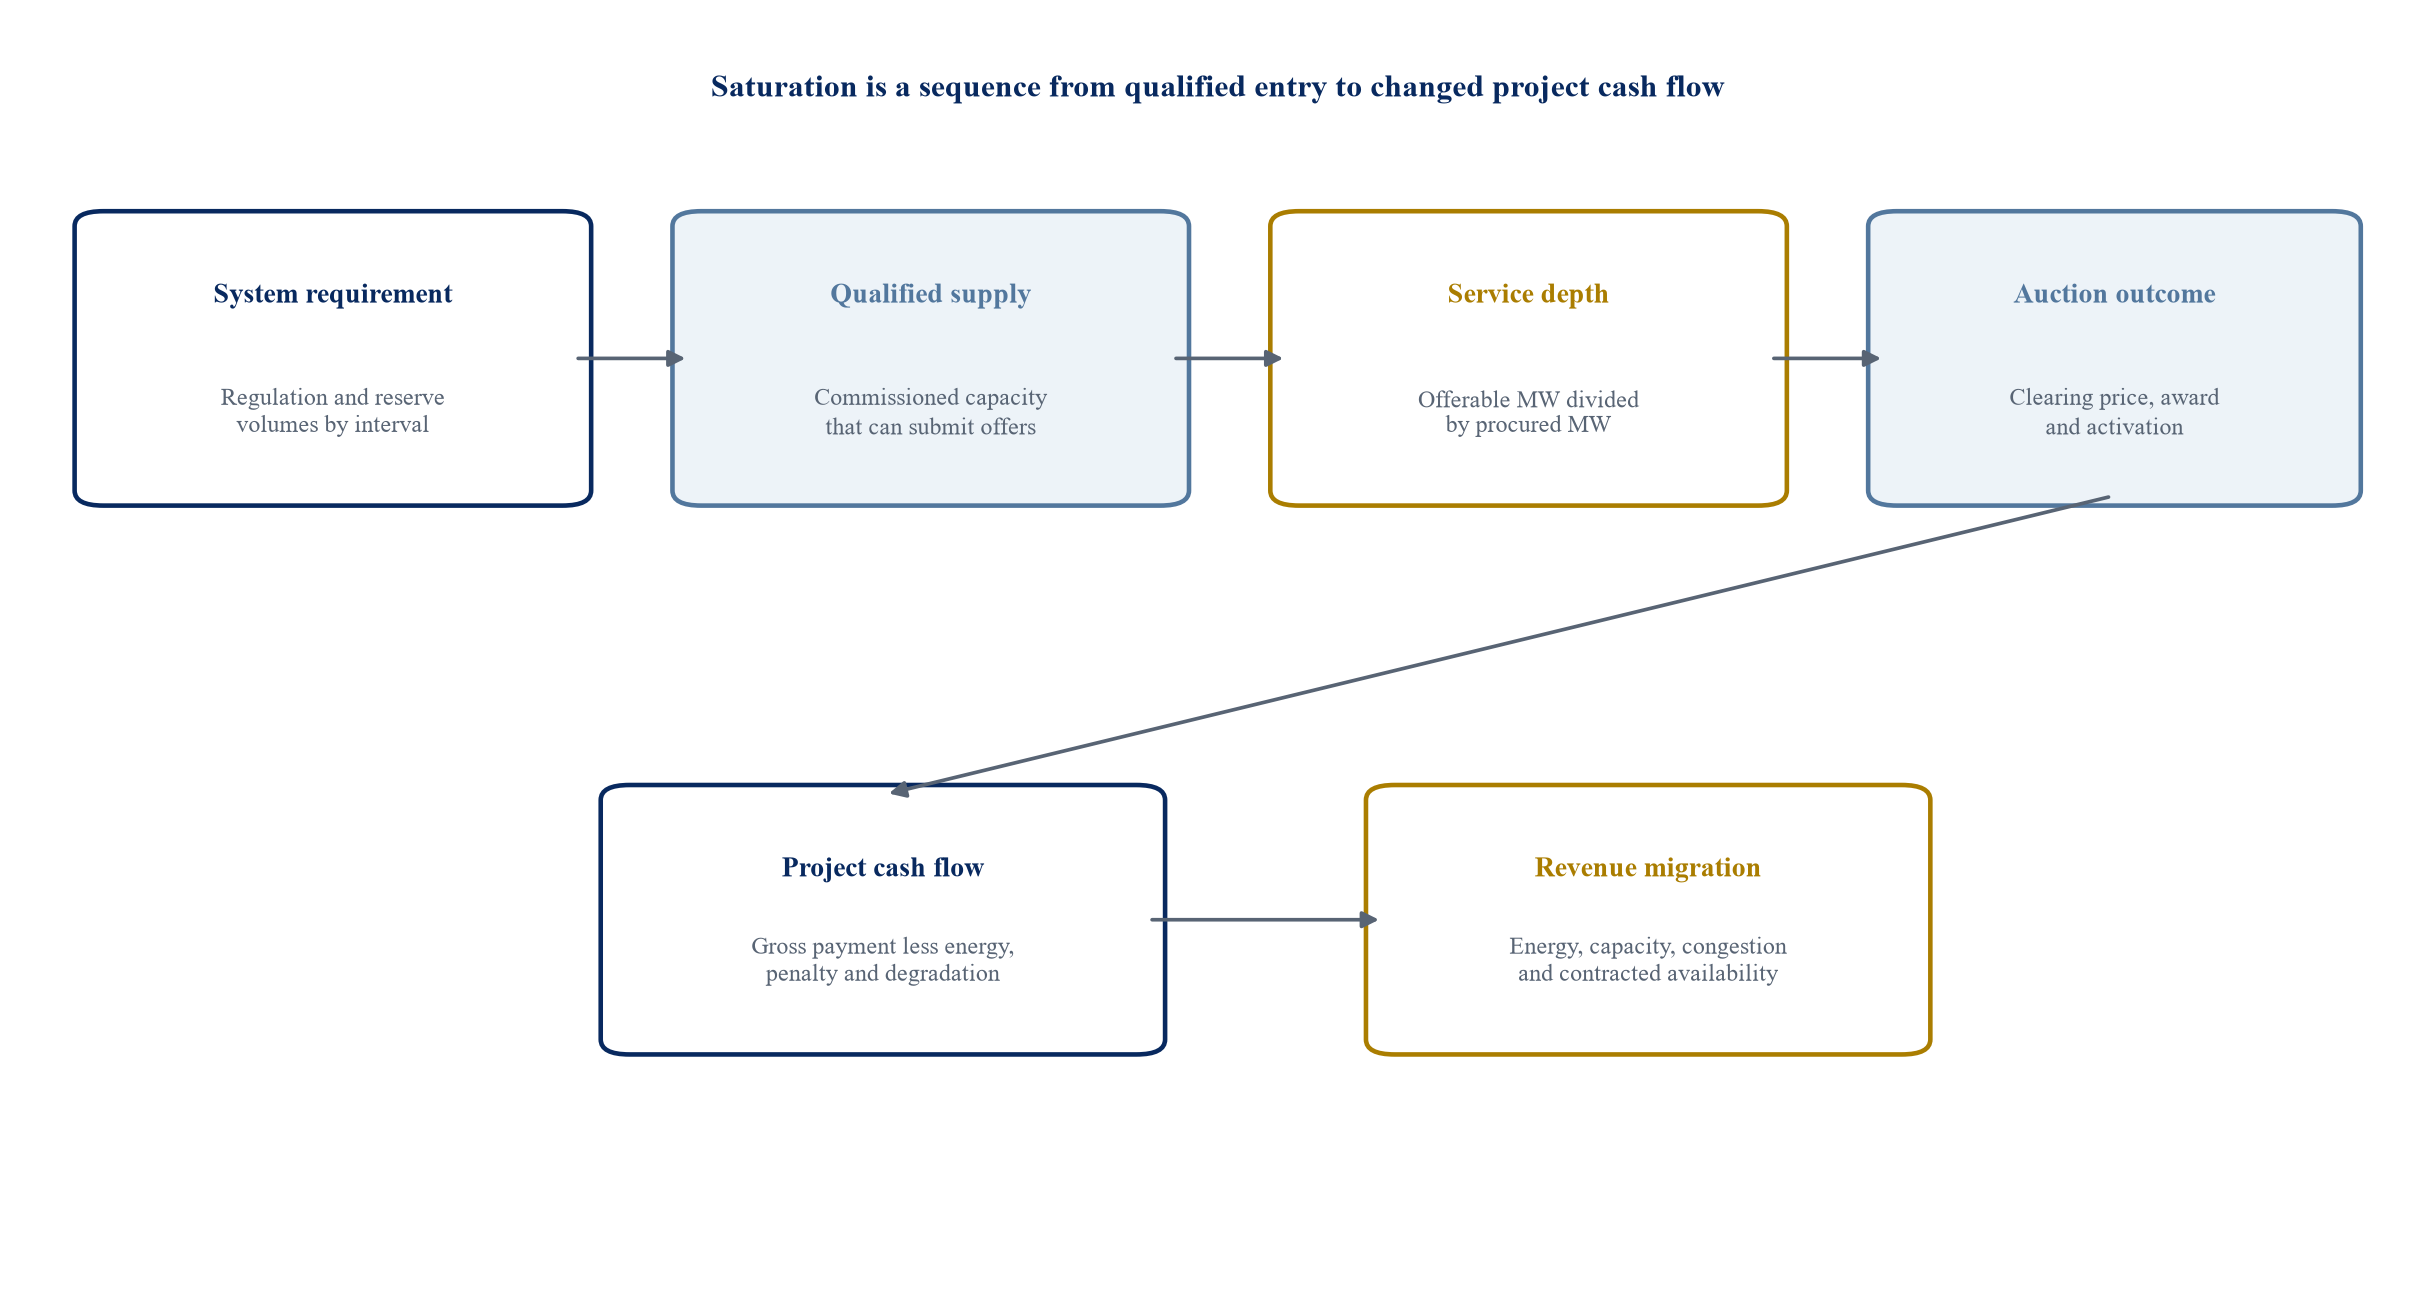
The diagram separates requirement, qualified supply, bid competition and the resulting migration of project revenue.
5 Build a product-specific saturation dashboard
A saturation dashboard should combine current market evidence with the forward pipeline. At minimum it should track procurement requirement, qualified capacity, offered capacity, concentration, award share, clearing price distribution, activation, negative or zero bids, and the proportion of hours in which opportunity cost from energy determines the marginal offer.
Pipeline data should be converted into probability-weighted commissioning. Interconnection queues contain projects that may never proceed. Each project requires a scheduled commercial operation date, construction status, connection milestone, equipment evidence, financing status and qualification path. The probability should be governed and updated as evidence changes. A large queue still matters because even partial conversion can exceed a shallow service requirement.
The dashboard should also map competing technologies. Hydro, flexible generation, demand response, synchronous condensers, flywheels and aggregated distributed resources may offer the same or adjacent products. Market reforms can expand eligibility or change minimum bid sizes. FERC Order No. 2222 enables distributed-energy-resource aggregations to participate in US regional wholesale markets under approved implementation rules [19]. Additional eligible supply can change price formation without appearing in a utility-scale battery pipeline.
The decision threshold should be explicit. An investor might require the base case to assume compression once qualified supply reaches a defined multiple of procurement. A lender might exclude uncontracted ancillary revenue above a conservative share of debt service. The exact threshold is a policy choice supported by market evidence; it should not be copied across jurisdictions.
6 Use four market states rather than one price forecast
A single annual ancillary-service price creates false precision. A more defensible model uses four states: scarcity, balanced competition, saturated competition and resegmented need. Each state has different supply, bidding and revenue characteristics.
Scarcity exists when qualified supply is close to or below the requirement. Prices may reflect caps, risk and limited competition. Balanced competition exists when several providers can meet the requirement and opportunity cost becomes important. Saturated competition exists when offerable supply is many times the requirement and low marginal cost providers determine price. Resegmented need arises when the operator creates a faster, longer, local or otherwise differentiated product that opens a new revenue pool.
Transition probabilities should respond to observable variables. Commissioning, qualification, rule changes and requirement revisions move the market between states. Scarcity events can occur inside an otherwise saturated market when transmission separates a region or a common-mode outage removes supply. The model should preserve both structural state and event risk.
The state framework supports debt sizing. Contracted revenue can be modelled separately. Merchant ancillary revenue can be stressed under the saturated state. Scarcity upside can sit outside the lender case unless supported by a minimum payment or robust history. A valuation can weight the four states without describing one number as certain.
Table 1. Evidence required for an ancillary-service saturation dashboard
| Measure | Current evidence | Forward evidence | Decision use |
|---|---|---|---|
| Procurement depth | Required MW and service hours | Operator methodology and system forecast | Defines addressable volume |
| Qualified supply | Registered and tested MW | Qualification pipeline and rule changes | Measures competitive entry |
| Offerable supply | Offers adjusted for state of charge and commitments | Dispatch simulation and competing obligations | Estimates effective competition |
| Price formation | Clearing prices, accepted bids and caps | Opportunity cost and bidding scenarios | Forecasts compression |
| Award dilution | Project and fleet award share | Entry timing and merit order | Forecasts service hours |
| Activation | Energy instructed and settlement | Event frequency and product redesign | Measures cycling and energy cost |
| Concentration | Supplier and technology shares | New entry and aggregation | Tests market-power assumptions |
| Replacement revenue | Energy, capacity and network earnings | Spread, adequacy and congestion forecasts | Rebuilds the revenue stack |
Each measure should be collected for the exact product, direction, location and procurement interval used in the project model.
7 Compare Great Britain through auction liquidity
Great Britain procures Dynamic Containment, Dynamic Moderation and Dynamic Regulation through the Enduring Auction Capability platform. The products differ in trigger and response time. Current service documentation requires sub-second initiation for Dynamic Containment and Dynamic Moderation and two-second initiation for Dynamic Regulation, with full delivery requirements of one second, one second and ten seconds respectively [14].
The auction platform permits simultaneous offers across services and can accept additional supply when the clearing algorithm finds that outcome efficient. It also permits negative sell prices, meaning a provider can offer to pay for the right to provide a service when the associated energy or portfolio value supports that behaviour [16]. Negative bidding is a strong sign that gross service price alone does not describe the commercial decision.
For a project, the forward model should use auction-level distributions and service-specific requirements. It should test the effect of new validation rules, co-optimisation and linked service windows. State-of-charge policy, overbidding controls and simultaneous-product constraints determine the battery's feasible offer set. The system operator's monthly balancing-service summaries provide evidence on volume and cost but require reconciliation with project awards and energy settlement [13].
The strategic implication is that a battery should be designed for several market routes. Connection location, duration, Balancing Mechanism capability, capacity-market eligibility and trading infrastructure can support the transition from a narrow response product to energy and reserve optimisation.
8 Compare Australia through FCAS entry and regional scarcity
Australia's National Electricity Market procures regulation and contingency FCAS across multiple response speeds and directions. Batteries have gained substantial share because they can respond quickly and accurately. The first large battery and demand-response entrants contributed to lower FCAS costs in early 2018 [6]. Battery FCAS share reached 39% by volume in the third quarter of 2022 [7].
The market continued to evolve. AEMO's first-quarter 2026 report estimated grid-scale battery revenue of AUD 96.9 million, with AUD 93.9 million from energy arbitrage. The increase from the prior year was driven primarily by energy arbitrage rather than FCAS [9]. This reported composition provides direct evidence of revenue migration as the fleet and energy-spread opportunity grew.
The AER reported that five predominantly battery participants entered FCAS in the second quarter of 2026 and total FCAS costs fell to AUD 9.2 million [8]. Regional events still matter. The AER also recorded material FCAS price spikes in Tasmania during the first quarter of 2026 [10]. Interconnector conditions, local requirements and network outages can create temporary scarcity inside a competitive national fleet.
An Australian model should therefore combine ordinary interval compression with regional event analysis. It should also reflect registration, verification and performance requirements. AEMO updated its BESS guide to contingency FCAS registration in September 2026 to improve testing, simulation and assessment consistency [11]. Qualification timing and verified capability remain part of commercial supply.
9 Compare California through declining ancillary allocation
California provides a clear fleet-level example. CAISO reported that battery capacity grew faster than ancillary-service requirements for six years through 2024. Batteries consistently offered many times the regulation requirement and supplied nearly 84% of balancing-area regulation in 2024 [3]. The proportion of total battery capacity scheduled for ancillary services fell as installed capacity increased.
The fleet moved toward energy shifting. CAISO reported average five-minute battery output peaking at about 5,700 MW in hour ending 19 during 2024, compared with about 2,700 MW in 2023. Midday charging also increased substantially [3]. This operating pattern responds to California's solar-driven price shape and evening net-load ramp.
Daily CAISO energy-storage reports provide preliminary bid-in capacity, awards, state of charge and ancillary-service procurement [4]. These data can support a project-specific replay, subject to the warning that they are not settlement quality. The investment model should pair them with final market prices, outage information and asset constraints.
The California case shows why service saturation should be analysed as part of the whole market. A lower share of battery capacity in ancillary services does not mean the fleet has lost system value. It means that the marginal battery increasingly earns from charging and discharging across time, capacity arrangements and resource-adequacy obligations. Duration, charging access and evening deliverability become more important as the revenue stack changes.
10 Compare ERCOT through queue growth and co-optimisation
ERCOT has added storage rapidly in a market with volatile energy prices and several ancillary products. Its July 2025 monthly report stated that batteries faced increasing competition, declining revenues and greater price volatility in ancillary services. Battery projects represented 177,929 MW of the 420,381 MW generation interconnection queue as of June 2025, the largest technology category [12]. Queue capacity is not a commissioning forecast, but partial delivery can materially expand supply.
ERCOT introduced Real-Time Co-optimization Plus Batteries in December 2025. The change jointly optimises energy and ancillary services in real time and improves visibility of storage capability [20]. Co-optimisation can reduce inefficient reserve withholding and make opportunity cost more explicit. It can also change historical revenue relationships because the dispatch engine chooses among energy and services using current conditions.
A project model should represent the operational state submitted to ERCOT, charge and discharge limits, ancillary commitments, energy prices and real-time awards. Historical average ancillary prices from the prior design should not be extended mechanically across the reform date. Model validation should compare simulated awards with the new market's observed outcomes.
The forward case also needs an energy-scarcity view. ERCOT batteries may earn material revenue during tight intervals even when routine ancillary prices compress. The project should be tested against lower volatility, transmission congestion, changing scarcity-price rules and a fleet that shifts the net-load profile.
11 Compare PJM through regulation design and settlement
PJM was an early market for short-duration storage providing frequency regulation. Market rules and settlement design have changed over time as the operator addressed performance, energy neutrality and procurement. The current economics depend on capability price, performance price, performance score, mileage, energy settlement and the amount of regulation procured.
Monitoring Analytics' 2025 State of the Market report reviews regulation and reserve outcomes and identifies settlement features that affected battery clearing and customer charges [23]. Independent monitoring is important because a market can appear competitive while a settlement rule creates uneconomic awards or compensation.
For underwriting, the PJM case reinforces two controls. First, the project model should reproduce the current tariff and settlement calculation, including performance. Second, a base case should not assume that a temporary settlement or disputed rule persists through the debt tenor. Revenue linked to a specific waiver, transition or litigation outcome needs separate treatment.
Short-duration storage also faces a design tradeoff. Maintaining a narrow state-of-charge band can support regulation performance while limiting energy value. As regulation revenue falls, the operator may need a broader dispatch strategy, greater duration or a different interconnection and capacity configuration. Modification cost and qualification should enter the valuation.
12 Model bidding through opportunity cost
A battery's rational ancillary-service offer should include the value it gives up elsewhere, expected activation energy, degradation, efficiency loss, imbalance exposure and risk. In a saturated market, the clearing price can approach this opportunity cost for the marginal provider.
Opportunity cost changes by interval. A battery may bid low for downward regulation during a period when it wants to charge. It may require a high price for upward reserve before an expected evening energy spike because reserving headroom prevents discharge. A long-duration asset and a short-duration asset can therefore bid differently even when their power rating is identical.
The model should jointly optimise energy and every eligible service. Sequential modelling can double count capacity or assume incompatible awards. It should enforce power and energy limits, state-of-charge continuity, round-trip efficiency, outages, degradation and contracted obligations. The dispatch should use the actual settlement granularity and service duration.
Bid behaviour also depends on portfolio strategy. A utility, merchant trader, renewable hybrid and tolling asset may have different objectives and risk limits. A contracted battery may submit offers under dispatch instructions. A merchant project may preserve optionality. The valuation should reflect the governing commercial agreement rather than one assumed universal bid curve.
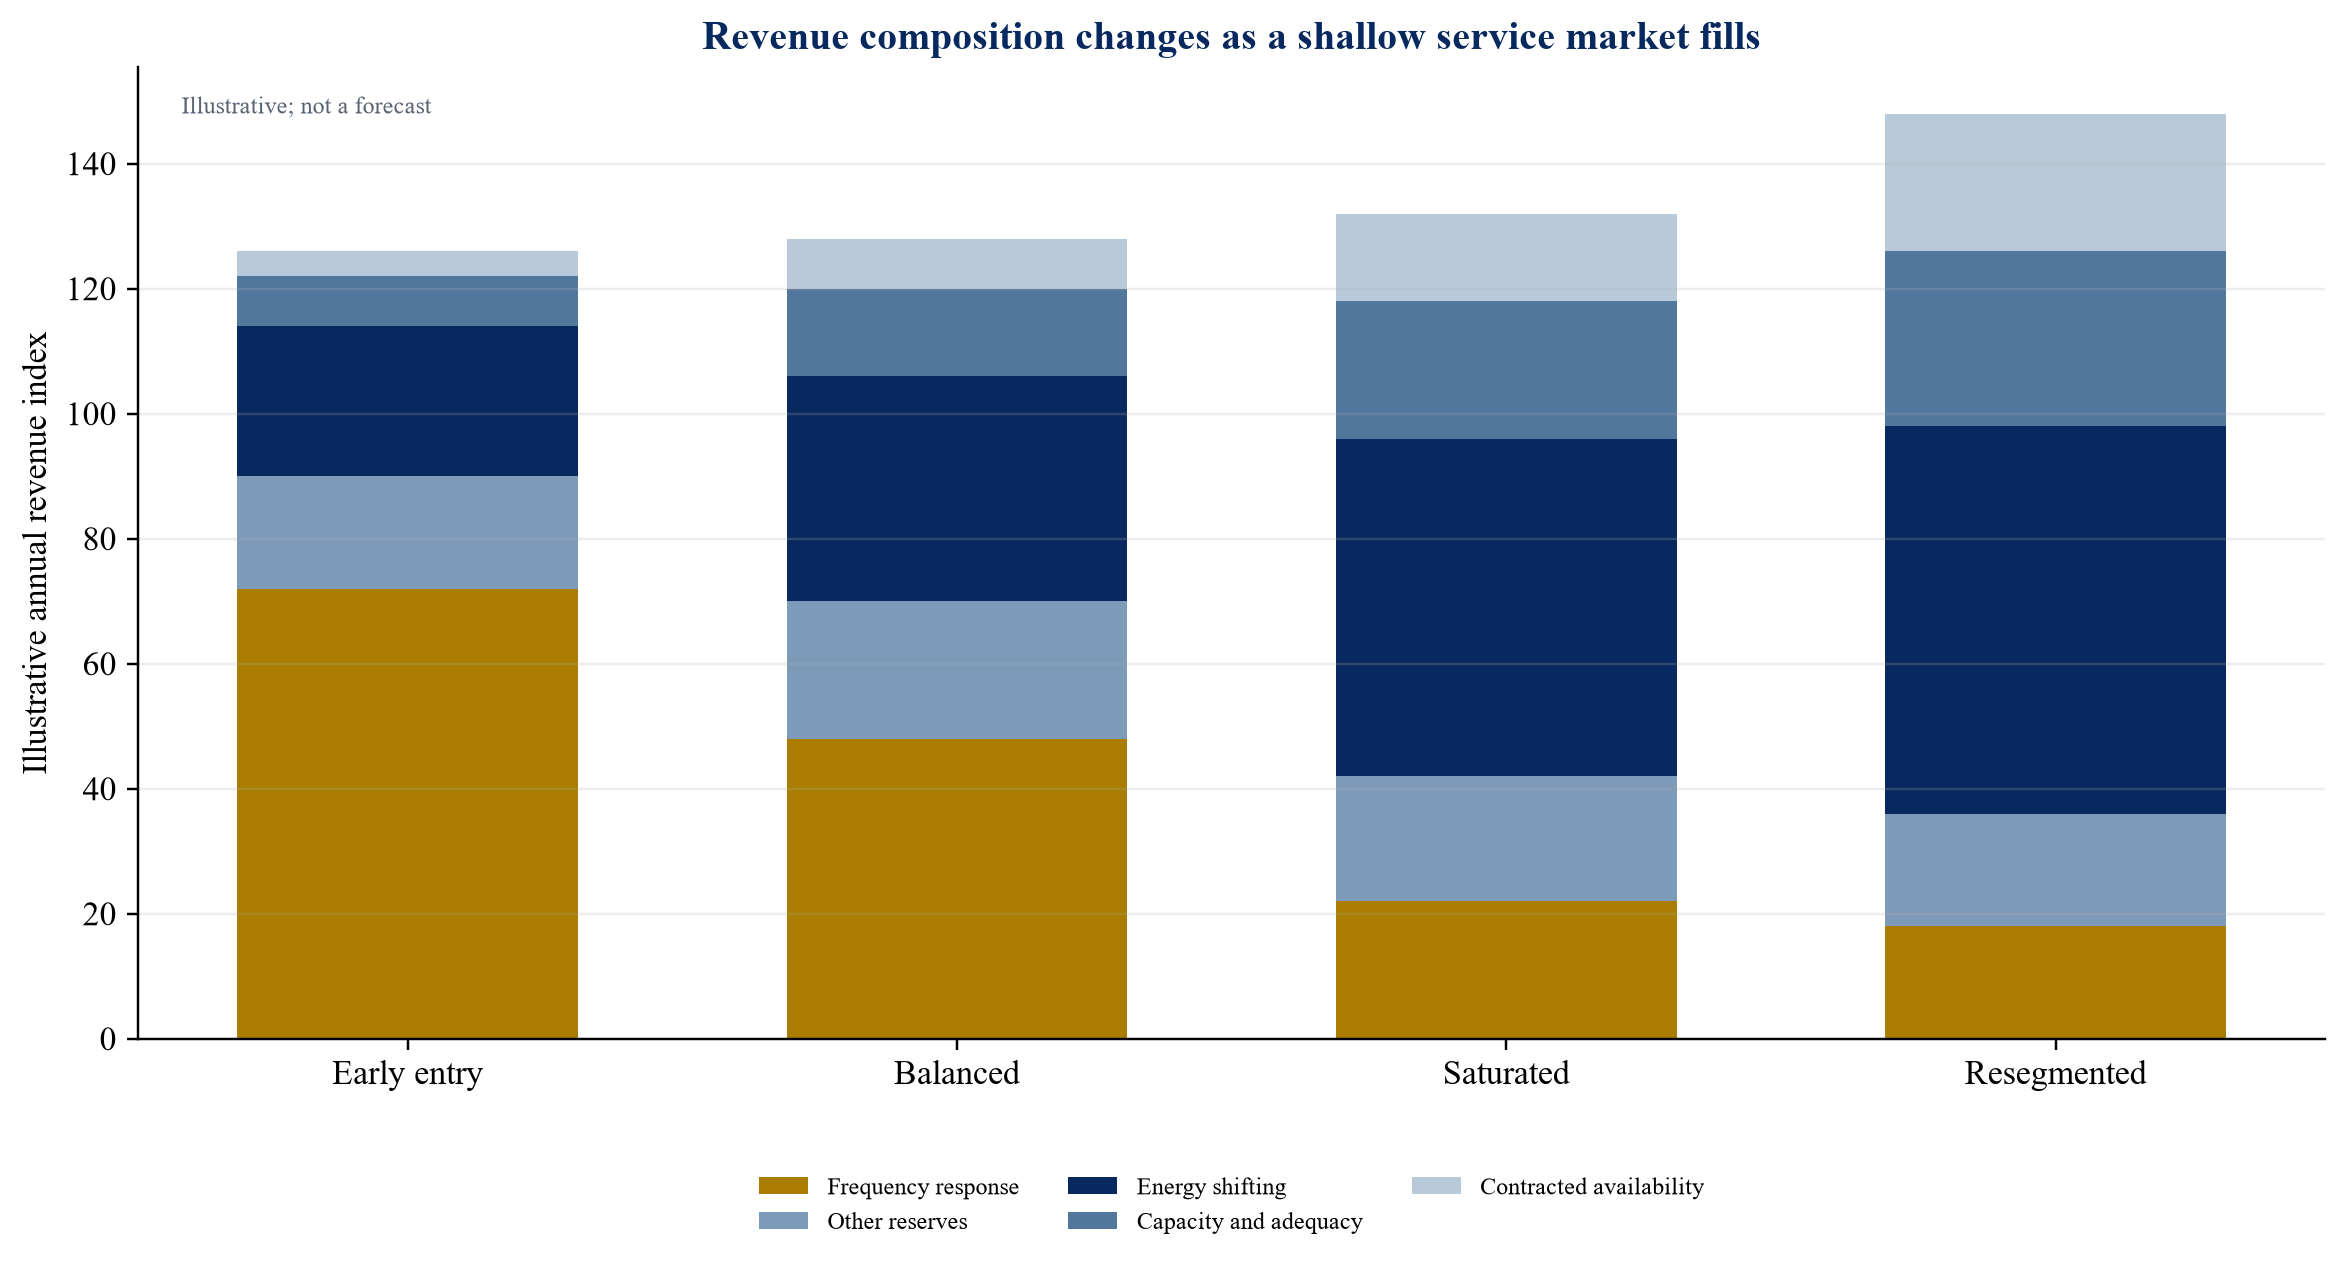
Indexed values are author modelling assumptions. The exhibit demonstrates how revenue can move from shallow response markets toward energy, capacity and contracted availability as qualified battery supply increases.
13 Forecast the requirement as carefully as supply
Ancillary-service demand is not fixed forever. It changes with system size, largest credible contingency, inertia, renewable variability, forecasting accuracy, transmission configuration and operating policy. Saturation analysis can overstate compression if it freezes the requirement while the system need expands.
The system operator's methodology should be the starting point. Some products use a fixed minimum plus dynamic requirements. Others vary by expected loss, time of day or regional condition. New services can emerge when inverter-based resources change system behaviour. Very fast response, inertia and ramping products can create new addressable volumes.
Requirement growth should still be separated from project wishful thinking. The investor should identify published methodology, consultation, implementation date and procurement budget. A proposed product is not bankable revenue until rules, qualification and procurement are sufficiently defined. Upside from future services can be retained as an option value.
Scenario analysis should include lower and higher requirements. The low case can reflect improved forecasting, better transmission or co-optimisation. The high case can reflect larger contingencies, lower inertia, rapid load growth or delayed network investment. Each scenario needs a defined link to official planning evidence.
14 Account for product redesign and cannibalisation
System operators redesign ancillary products when technology and system needs change. A faster product can reward a battery's response capability. A longer-duration requirement can exclude short-duration assets or reduce their accredited volume. Co-optimisation can merge procurement that was previously separate. Product redesign creates both opportunity and obsolescence risk.
Adjacent products can cannibalise one another. A new quick-reserve service may draw providers away from regulation, lowering regulation competition temporarily. It may also reduce the amount of another reserve the operator procures. A stability market can reward inertia or short-circuit contribution that ordinary batteries cannot provide without grid-forming controls.
Project design should preserve upgrade routes where economic. Inverter capability, communications, telemetry and control systems can determine future qualification. Contractual rights to modify software, replace cells, increase duration or add grid-forming functionality may create option value. The model should include capital cost, outage and requalification.
Revenue attributed to a future product should pass a maturity test. The test covers published need, rule authority, procurement timetable, technical eligibility, settlement, expected competition and project compliance. Failure at any stage reduces the amount eligible for the finance case.
15 Rebuild the revenue stack after saturation
The replacement stack can include energy arbitrage, capacity or resource adequacy, congestion management, network support, renewable firming, tolling payments, bilateral availability and portfolio optimisation. Each line has a different counterparty, term, dispatch right and risk.
Energy arbitrage becomes more important as batteries shift surplus renewable output into higher-price periods. The IEA reported that the share of new global battery projects primarily targeting energy shifting increased from around 40% in 2015 to more than 90% in 2025, while the share primarily targeting ancillary services fell to about 7% [1]. This global evidence concerns primary application rather than project revenue composition, but it supports the direction of market development.
Capacity revenue can support fixed cost when the battery provides dependable power during scarcity. Accreditation depends on duration and system conditions. Congestion value depends on location and dispatch. Tolling can exchange some upside for a fixed or floor payment. Renewable hybrids can share interconnection and firm delivery, subject to charging rules and tax or policy treatment.
The investment case should map each line to the same physical asset. State of charge, cycle budget and connection capacity prevent simultaneous full delivery. A dispatch model should demonstrate compatibility and determine the true incremental value of stacking.
16 Prevent double counting in stacked revenue
Revenue stacking can become arithmetic without operational discipline. A model may add regulation, reserve, energy and capacity revenue independently even though each product claims the same megawatts. The result overstates availability and cash flow.
A compatibility matrix should record whether services can be offered simultaneously, sequentially or exclusively. It should include the operator's co-optimisation rules, contracted dispatch priority, state-of-charge reserve, activation duration and penalty. The matrix should be enforced inside the model.
Settlement interactions also matter. Regulation energy can change state of charge and incur energy payments. Capacity obligations can require availability during hours when energy prices are high. A tolling agreement may transfer merchant revenue to the offtaker in exchange for a fixed fee. Network payments may restrict market participation to avoid double compensation.
The model should report gross revenue and the binding constraint for every interval. A reviewer can then identify whether the project earned from scarce energy, a service award, capacity availability or a contract. The same trace supports lender diligence and performance monitoring.
Table 2. Revenue-stack compatibility and diligence questions
| Revenue line | Physical claim | Potential conflict | Minimum evidence |
|---|---|---|---|
| Frequency response | Headroom, footroom and state of charge | Energy dispatch and other reserve awards | Qualification, award and activation data |
| Contingency reserve | Deliverable power for defined duration | Capacity obligation and evening discharge | Product rules and dispatch replay |
| Energy arbitrage | Charge and discharge capacity | Reserved power and cycle budget | Nodal prices and constrained optimisation |
| Capacity or adequacy | Availability during scarcity | Maintenance, energy depletion and tolling rights | Accreditation and performance obligation |
| Congestion management | Location-specific charge or discharge | Energy-market dispatch and network limits | Constraint history and contract rights |
| Tolling or availability | Contracted control over asset | Merchant revenue ownership | Executed agreement and dispatch protocol |
| Renewable firming | Shared interconnection and delivery shape | Charging source and export limit | Hybrid model and connection agreement |
Compatibility depends on market rules, contracts and dispatch; the table provides a review structure rather than a universal conclusion.
17 Model degradation as an economic dispatch cost
Battery degradation is affected by cycle depth, state of charge, temperature, power, calendar age and cell chemistry. Ancillary services can involve shallow frequent movement, while energy arbitrage can require deeper cycles. The relevant cost is the incremental loss of usable life and future revenue caused by a dispatch decision.
A simple fixed cost per megawatt-hour can support screening. Detailed investment analysis should use warranty terms and an engineering degradation model. It should identify throughput limits, retained capacity guarantees, augmentation schedule, replacement cost and the conditions that void coverage.
Revenue migration can increase cycling. A project originally designed for regulation may move into daily energy shifting after response prices compress. The new strategy can create more energy revenue and faster capacity loss. Augmentation capital and downtime should be added to the financial model before describing the replacement revenue as value creation.
Performance obligations also interact with degradation. A degraded battery may retain power capability for a short service while losing duration for capacity or arbitrage. The model should track power and energy separately. Operating policy should prioritise obligations according to contract, penalty and risk-adjusted margin.
18 Convert market revenue into cash available for debt service
Gross market revenue should be reconciled to cash available for debt service. Deductions include charging energy, losses, market fees, scheduling, optimiser fees, imbalance, operations, insurance, land, network charges, degradation, augmentation reserves and performance penalties. Taxes and working capital follow the applicable structure.
Merchant ancillary revenue deserves a haircut based on depth, competition and rule risk. A lender can size debt to contracted revenue and a conservative portion of merchant revenue. It can also require a minimum debt-service coverage ratio under a saturated-market case.
The model should distinguish annual averages from liquidity. Settlement may be volatile, collateral calls can precede receipts, and a scarcity event can create large energy purchase exposure. A reserve account or working-capital facility may be necessary even when the annual margin is positive.
Debt tenor should be compared with battery warranty, augmentation and contract tenor. Refinancing assumptions need a credible revenue stack at the refinance date. A project that loses its initial ancillary advantage before refinancing faces valuation and liquidity risk.
19 Test the downside through break-even market depth
Break-even analysis links market saturation to finance. Start with the fixed cash requirement: operating cost, augmentation reserve, tax, debt service and required equity distribution. Subtract contracted and conservative non-ancillary cash flow. The residual identifies the ancillary contribution required.
The dispatch model can then solve for the combination of service price and award share that produces the required contribution. The service depth ratio associated with that result becomes a monitored threshold. If the qualified pipeline is likely to exceed it before commissioning, the sponsor needs lower cost, different duration, contract support or a revised capital structure.
The break-even should be tested under energy-price conditions because opportunity cost affects bidding. Low energy volatility can push more battery capacity into ancillary services and accelerate price compression. High spreads can draw capacity into energy and support service prices, while changing the project's own revenue mix.
The output should be a boundary rather than a point forecast. It can show the maximum qualified supply, minimum award share and minimum replacement energy margin consistent with the lender case. These variables can be monitored using public market data.
20 Value the project through state-contingent cash flows
Discounted cash flow should use the four market states rather than one extrapolated historic year. Each state has service prices, award shares, energy spreads, activation, degradation and operating cost. Transition probabilities should respond to commissioning and rule evidence.
Contracted revenue can be valued separately using counterparty and termination risk. Merchant revenue should reflect nodal price, dispatch and market-rule uncertainty. Option value from future products can be disclosed outside the base enterprise value or included with an explicit probability and cost.
Comparable transactions require normalisation. Two batteries with the same power and duration can have different connection rights, capacity accreditation, warranty, optimiser agreement and market access. Enterprise value per megawatt can obscure these differences. Value should be bridged through expected cash flow and obligations.
The terminal value should not assume perpetual ancillary scarcity. It should reflect remaining cell life, augmentation, land and connection rights, market access and the future role of the asset. Connection and site rights can retain value even when a particular service revenue falls.
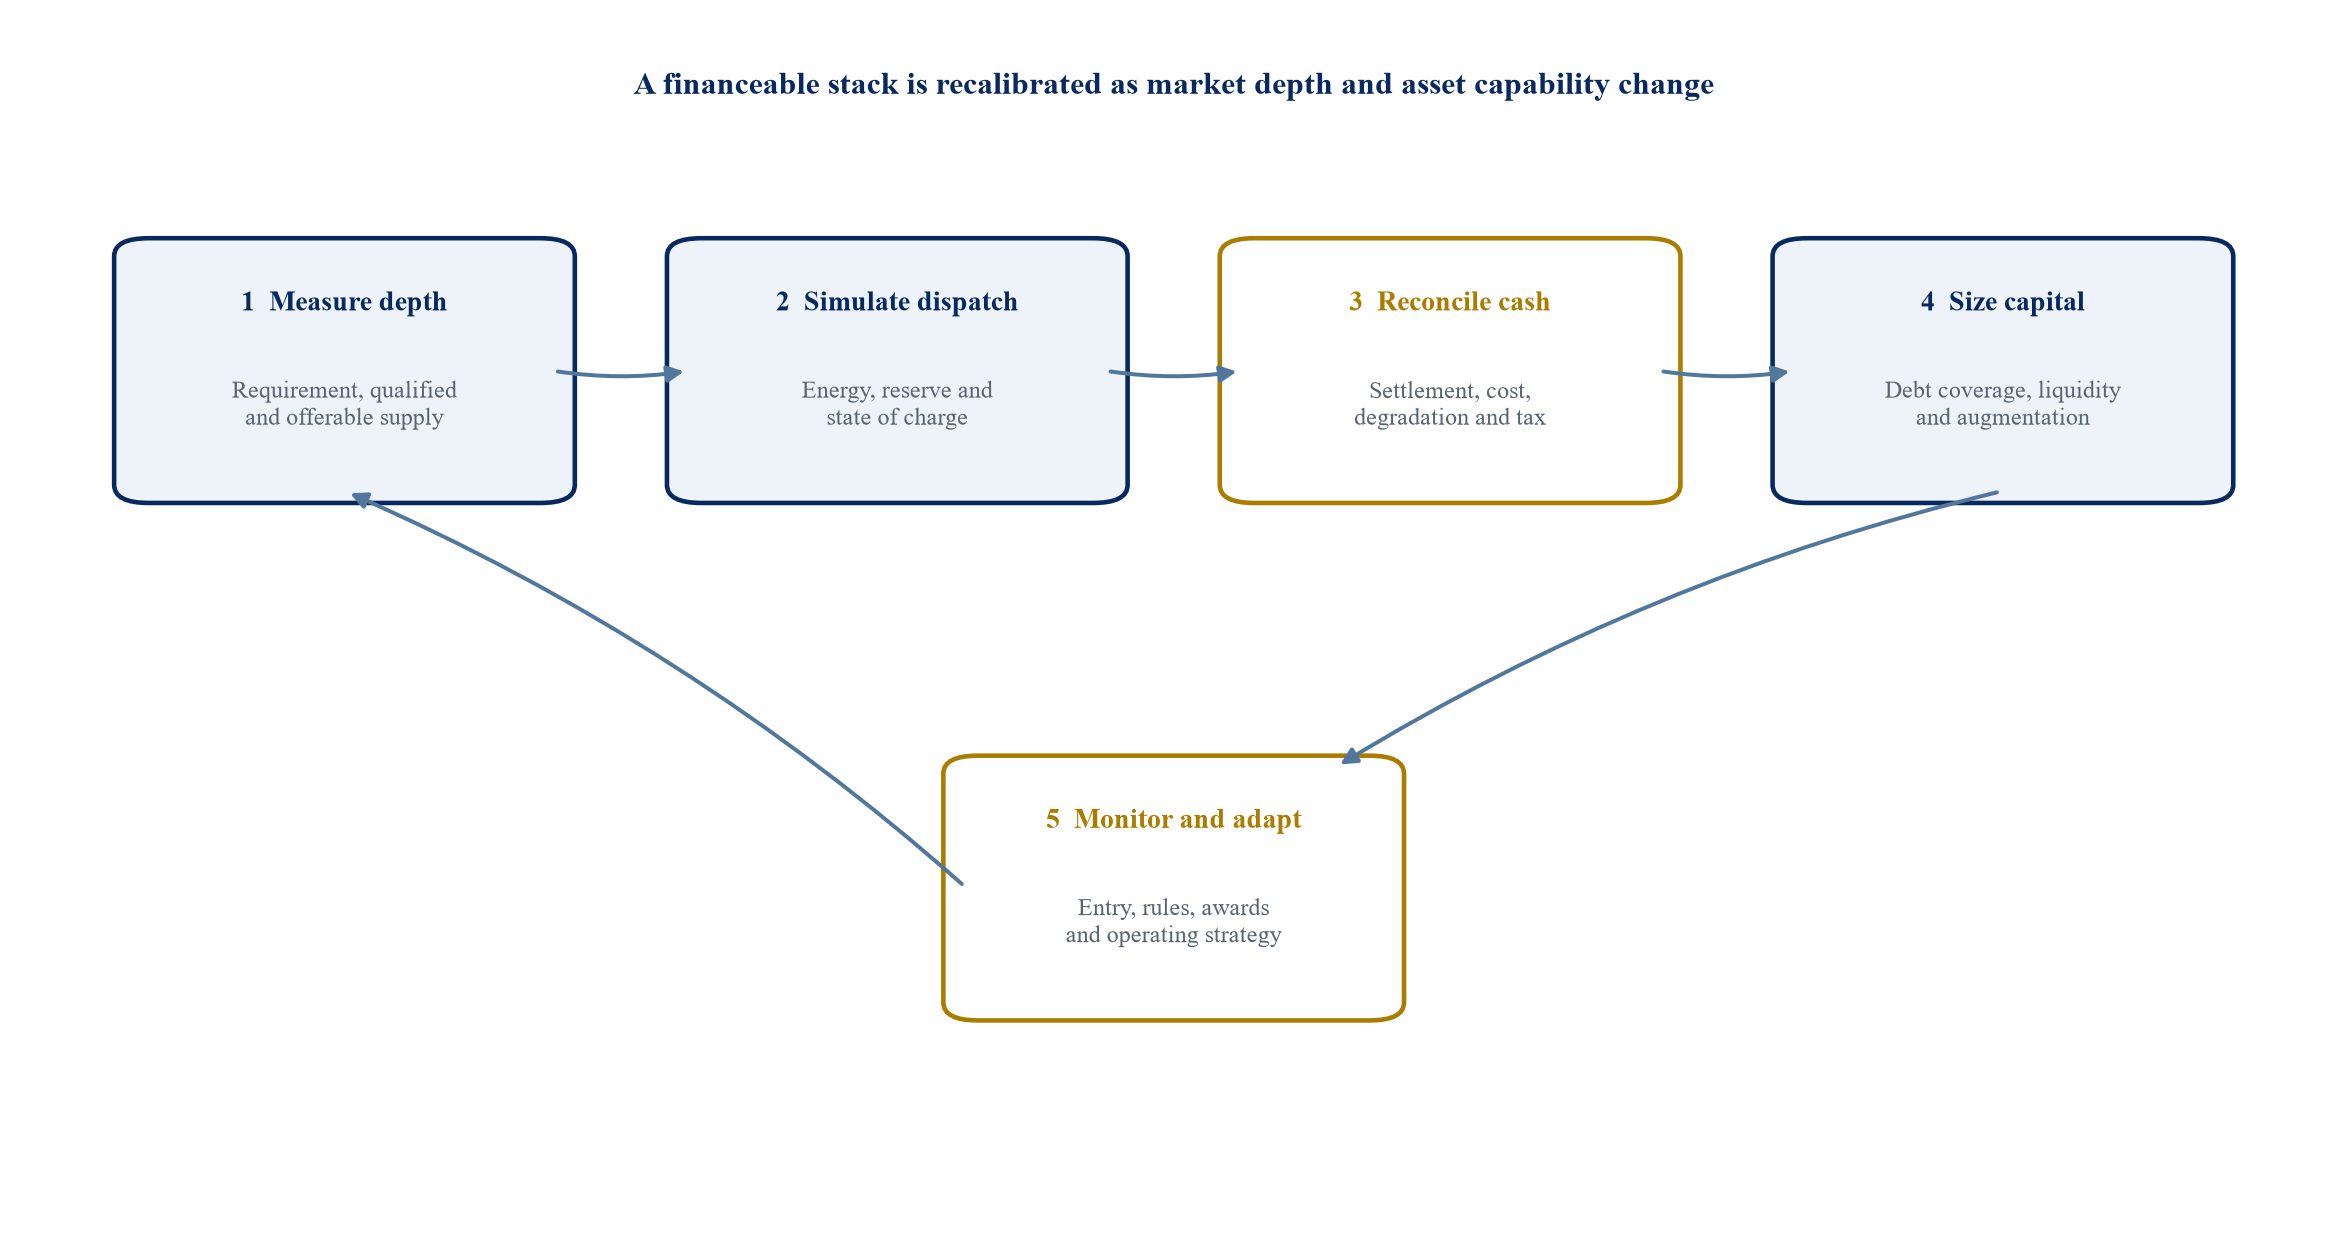
The cycle links service-depth evidence, dispatch, project cash flow, financing controls and operating decisions.
21 Structure contracts around dispatch rights
A tolling or availability contract can convert merchant exposure into a fixed or floor payment. The economic allocation depends on dispatch rights, energy cost, ancillary revenue ownership, degradation, availability, augmentation and performance.
The agreement should define who submits bids and who bears consequences from state-of-charge decisions. If the offtaker controls dispatch, the contract should allocate degradation and warranty risk created by that dispatch. If the owner retains control, availability tests and operating restrictions should be measurable.
Revenue sharing can preserve upside while supporting debt. A floor payment can cover fixed cost and debt service, with merchant value shared above a threshold. The counterparty needs credit support, termination payments and step-in rights appropriate to the tenor.
The contract should address market redesign. A new service, settlement change or co-optimisation rule can change value. Change-in-law and market-disruption clauses should specify whether payments, dispatch or qualification obligations adjust. A broad clause without a calculation method can move the dispute into valuation.
22 Conduct commercial and technical diligence together
Commercial diligence should start with market rules, procurement data and the competitive pipeline. Technical diligence should verify power, energy, efficiency, response, telemetry, controls, degradation, warranty and connection. The workstreams meet in the dispatch model.
The diligence team should replay historical intervals using the asset's constraints. It should compare simulated awards and revenue with available market evidence. Differences can reveal an incorrect settlement formula, unrealistic bidding, missing network constraints or state-of-charge assumptions.
Pipeline diligence should identify shared equipment and delivery risk. A queue can contain duplicated or speculative projects. A smaller set of financed projects with signed equipment and connection milestones may provide a stronger saturation signal. The probability-weighted view should be refreshed before investment approval and financial close.
Management capability matters. Optimisation, bidding, outage coordination and performance monitoring affect realised revenue. The operator's incentives, systems and track record should be tested. A low fee can conceal weak alignment if the optimiser receives little reward for preserving battery life or managing downside.
23 Use covenants that respond before revenue failure
Financial covenants can connect market evidence to protective action. A service-depth trigger might require an updated forecast when qualified supply exceeds a threshold. A revenue-concentration limit can restrict distributions when one ancillary product contributes too much cash. A state-of-health trigger can require augmentation funding.
Debt-service coverage remains central. The calculation should use cash receipts after market and operating costs. A forward-looking test can apply saturated-service prices and current energy curves. A historical test alone can remain strong after the competitive pipeline has changed.
Liquidity controls should address collateral and settlement. Minimum cash, debt-service reserve and augmentation reserve can protect against short-term volatility. Hedging or tolling can reduce exposure, subject to counterparty and basis risk.
Covenants should preserve the operator's ability to adapt. A rigid requirement to pursue one service can destroy value after saturation. The financing documents should permit approved optimisation across eligible markets while protecting contracted availability, warranty and debt coverage.
24 Compare project cases without false precision
The hypothetical cases below use author modelling assumptions. They show how the same battery can produce different cash flow as ancillary-service competition increases. The values do not represent an observed market, forecast or recommendation.
The early-entry case assumes high response-market revenue and limited energy value. The balanced case assumes lower response pricing and improved energy shifting. The saturated case assumes further response compression and greater reliance on energy and capacity. The contracted case adds a fixed availability payment and gives up part of merchant upside.
The comparison should be read with operating constraints. Revenue lines are produced by one dispatch model. Degradation and augmentation rise when cycling increases. Debt capacity depends on cash-flow volatility and contract strength, not gross revenue alone.
Table 3. Hypothetical battery revenue and financing cases
| Case | Ancillary-service revenue | Energy and capacity revenue | Contracted availability | Cash available for debt service | Indicative financing implication |
|---|---|---|---|---|---|
| Early entry | USD 8.4m | USD 3.1m | USD 0.0m | USD 7.2m | Merchant case depends heavily on shallow services |
| Balanced competition | USD 4.9m | USD 6.0m | USD 0.0m | USD 6.7m | Diversified dispatch supports moderate debt |
| Saturated competition | USD 2.1m | USD 7.2m | USD 0.0m | USD 5.2m | Lower leverage and stronger liquidity required |
| Contracted floor | USD 1.3m retained | USD 3.5m retained | USD 5.0m | USD 6.4m | Fixed payment can support debt subject to counterparty risk |
| Downside saturation | USD 0.8m | USD 4.2m | USD 0.0m | USD 2.1m | Equity support or restructuring may be required |
Values are illustrative author assumptions for a 100 MW battery and are not observed results, market forecasts or investment recommendations.
25 Implement a 180 day investment control plan
Days 0 to 30 should define the service set, evidence boundary and asset constraints. The team should collect current rules, requirements, qualified supply, offers, prices, activation and pipeline data. Technical advisers should confirm power, energy, efficiency, warranty and connection.
Days 31 to 70 should build the co-optimised dispatch model. The model should reproduce settlement, enforce physical limits and reconcile to historical intervals. Market and technical teams should agree the qualifying pipeline and state scenarios.
Days 71 to 110 should rebuild the revenue stack and capital plan. Contract options, capacity accreditation, energy value, degradation and augmentation should enter the cases. Lenders should review the saturated state and liquidity requirements.
Days 111 to 145 should complete commercial, legal, tax, accounting, regulatory and technical diligence. The transaction team should reconcile the model to executed agreements, connection rights, warranty and operating arrangements. Open items should have owners and decision consequences.
Days 146 to 180 should complete approval and operating readiness. The board should approve value, downside, financing and monitoring thresholds. The operator should implement the market dashboard, dispatch controls and covenant reporting before financial close or acquisition completion.
26 Recognise analytical limits
Ancillary-service markets can change quickly. Public data may be preliminary, aggregated or incomplete. Qualification and bidding data may omit commercial constraints. Interconnection queues overstate projects that will commission. Historical prices can reflect outages, rule transitions or temporary scarcity.
Dispatch models simplify bidding behaviour and system operation. Competitors can change strategy. Requirements can be redesigned. Energy and ancillary prices are jointly determined, so a static correlation may fail after substantial storage entry. Project-specific connection, tax, accounting and contract terms can change cash flow materially.
The market observations in this paper use cited public sources. The financial examples and revenue indices are author modelling assumptions. They have not been calibrated to a named asset. A live investment requires current settlement data, engineering evidence, executed documents and advice from qualified professionals in the relevant jurisdiction.
Conclusion
Ancillary-service saturation begins when qualified offerable supply grows faster than the operator's product-specific requirement. The commercial effect reaches a project through lower clearing prices, fewer awards, changed activation and a new opportunity cost against energy. Installed battery capacity provides context; the service depth ratio provides the more useful decision measure.
Evidence from California, Australia, Great Britain and ERCOT shows several stages of the transition. Batteries can dominate regulation, deepen competition and migrate toward energy shifting, capacity and contracted availability. Regional scarcity and product redesign can create valuable intervals, but those opportunities should be modelled explicitly.
Investment and financing decisions should join market depth, dispatch, degradation and cash flow. A co-optimised model should prevent double counting and identify the binding constraint in every interval. The downside case should assume saturated routine services and test whether replacement revenue supports debt, augmentation and liquidity.
Storage retains system value as ancillary markets fill. The investable proposition changes. Projects with duration, strong connections, flexible controls, multiple qualified products and credible contracts have more routes to replace early-market revenue. A project that depends on persistent scarcity rent needs evidence strong enough to survive commissioning delays, competitive entry and market redesign.
References
- International Energy Agency. Battery storage is scaling up and taking on a larger system role. 2026. https://www.iea.org/commentaries/battery-storage-is-scaling-up-and-taking-on-a-larger-system-role
- International Energy Agency. Electricity 2026: Flexibility. 2026. https://www.iea.org/reports/electricity-2026/flexibility
- California Independent System Operator Department of Market Monitoring. 2024 Special Report on Battery Storage. May 2025. https://www.caiso.com/documents/2024-special-report-on-battery-storage-may-29-2025.pdf
- California Independent System Operator. Daily Energy Storage Reports. https://www.caiso.com/library/daily-energy-storage-reports
- California Independent System Operator. Department of Market Monitoring Annual and Quarterly Reports. https://www.caiso.com/documents/dmm-annual-report-2025.pdf
- Australian Energy Market Operator. Quarterly Energy Dynamics Q1 2018. 2018. https://aemo.com.au/-/media/files/major-publications/qed/2018/qed-q1-2018.pdf
- Australian Energy Market Operator. Quarterly Energy Dynamics Q3 2022. 2022. https://aemo.com.au/-/media/files/major-publications/qed/2022/qed-q3-2022.pdf
- Australian Energy Regulator. Wholesale Charts and Q2 2026 Market Outcomes. 2026. https://www.aer.gov.au/industry/wholesale/charts
- Australian Energy Market Operator. Quarterly Energy Dynamics Q1 2026. 2026. https://www.aemo.com.au/-/media/files/major-publications/qed/2026/qed-q1-2026.pdf
- Australian Energy Regulator. Significant Electricity Prices Q1 2026. 2026. https://www.aer.gov.au/news/articles/communications/aer-reports-significant-electricity-prices-q1-2026
- Australian Energy Market Operator. FCAS Registration Guides for Battery Energy Storage Systems. 2026. https://www.aemo.com.au/consultations/current-and-closed-consultations/fcas-registration-guides-bess-wind-farms-and-solar-farms-consultation
- Electric Reliability Council of Texas. ERCOT Monthly July 2025. 2025. https://www.ercot.com/files/docs/2025/08/06/ERCOT-Monthly-July-2025.pdf
- National Energy System Operator. Balancing Costs and Monthly Balancing Services Summary. https://www.neso.energy/industry-information/balancing-costs
- National Energy System Operator. Dynamic Services. https://www.neso.energy/industry-information/balancing-services/frequency-response-services/dynamic-services-dcdmdr
- National Energy System Operator. Enduring Auction Capability. https://www.neso.energy/industry-information/balancing-services/enduring-auction-capability-eac
- National Energy System Operator. Enduring Auction Capability Platform. 2023. https://www.neso.energy/news/enduring-auction-capability-platform-new-and-improved-platform-procuring-frequency-response-services
- National Energy System Operator. Storage for Constraint. 2022. https://www.neso.energy/document/247586/download
- Federal Energy Regulatory Commission. Order No. 841, Electric Storage Participation in Regional Markets. 2018. https://www.ferc.gov/media/order-no-841
- Federal Energy Regulatory Commission. Order No. 2222, Distributed Energy Resource Aggregations. 2020. https://www.ferc.gov/news-events/news/ferc-opens-wholesale-markets-distributed-resources-landmark-action-breaks-down
- Electric Reliability Council of Texas. 2025 Annual Report. 2026. https://www.ercot.com/files/docs/2026/03/19/2025-ERCOT-Annual-Report-Final-Single-Pages-March-19-2026.pdf
- US Energy Information Administration. Battery Storage in the United States: 2024 Market Trends. 2026. https://www.eia.gov/analysis/studies/electricity/batterystorage/
- US Energy Information Administration. Utilities report batteries are most commonly used for arbitrage and grid stability. 2024. https://www.eia.gov/todayinenergy/detail.php?id=62405
- Monitoring Analytics. 2025 State of the Market Report for PJM, Section 10 Ancillary Services. 2026. https://www.monitoringanalytics.com/reports/PJM_State_of_the_Market/2025/2025-som-pjm-vol2.pdf
- US Department of Energy. Energy Storage Valuation: A Review of Use Cases and Modeling Tools. 2022. https://www.energy.gov/sites/default/files/2022-06/MSP_Report_2022June_Final_508_v3.pdf
- US Energy Information Administration. Annual Energy Outlook Battery Storage Issues in Focus. 2022. https://www.eia.gov/outlooks/aeo/IIF_battery/
- US Energy Information Administration. Electric Power Monthly, Utility-Scale Storage Usage Factors. 2026. https://www.eia.gov/electricity/monthly/epm_table_grapher.php?t=table_6_07_c
- International Energy Agency. Electricity Market Design. 2025. https://www.iea.org/reports/electricity-market-design
- International Energy Agency. Financing Battery Energy Storage Systems in Indonesia. 2026. https://www.iea.org/reports/financing-battery-energy-storage-systems-in-indonesia/executive-summary
- National Energy System Operator. Co-optimisation of Energy and Frequency-Containment Services. https://www.neso.energy/about/innovation/our-innovation-projects/co-optimisation-energy-and-frequency-containment-services
- US Energy Information Administration. Battery storage capacity averaged 70% growth over the last three years. 2026. https://www.eia.gov/todayinenergy/detail.php/detail.php?id=67925
About the Author
Chennakeshav (CK) is a corporate finance and investment banking executive with 25+ years of global experience in deal origination, structuring and execution across M&A, growth capital and corporate strategy. He has led value-creation mandates for founders, corporates and funds — bridging the boardroom view to hands-on execution and close.
His career spans Morgan Stanley, HSBC, Lloyds Banking Group, EWEC, ADQ portfolio companies and Emirates Growth Fund, across TMT, real estate, fintech, deeptech, cleantech, infrastructure and energy. He has partnered with C-suite leaders, private equity and venture funds, sovereign wealth funds and family offices to finance complex fund raises and scale-up ventures, and has led M&A due diligence, post-merger integration and business-transformation initiatives to create value.
At Matchpoint Partners he is Managing Partner, leading the firm's corporate finance, M&A and capital-raising practice. He holds an MBA from London Business School, an engineering degree from VTU and a Master of Laws (LLM, in progress) from UCL London.
An active start-up mentor, CK mentors at Techstars, DIFC FinTech Hive, Startup Grind, Founder Institute and IN5, serves as Entrepreneur Mentor in Residence (EMiR) at London Business School, and judges the Entrepreneurship World Cup.
https://www.linkedin.com/in/ckadya/
https://www.matchpoint-partners.com/team/ck-adya.html
This paper is part of a continuing series on the structure of private and alternative markets. The views expressed are the author's own. The paper is for information only, describes market structure in general terms, and does not constitute investment, legal, tax or regulatory advice or a recommendation in respect of any security, vehicle or counterparty.
