

1 Introduction: commercial readiness as a capital decision
The proposed investment memorandum carries three separate decisions: whether the product evidence supports the intended use, whether customers support the assumed price and collection terms, and whether the resulting business can fund the required cash path. This paper develops an illustrative manufacturer cash model for the third question and a bounded area-value screen for the second. Eighteen primary institutional, standards-publisher, manufacturer and original academic sources supply defined observations and research context. Their publication types and access limits are retained in the evidence discussion. The components require a transaction-specific reconciliation before investment in an actual facility.
An approval should identify the investment tranche, its permitted use, the required evidence before the next tranche and the authority to alter those conditions. The pilot-stop case supplies a deliberately bounded financial alternative before commercial construction spending. A hold case should identify the additional expenditure, information sought and elapsed selling opportunity in the fixed analytical horizon. The approval record should preserve the values at the decision date so that later changes in price, yield, timing and product obligations can be compared with the original decision.
The programme can also expose a case in which manufacturing performance improves while the buyer-value evidence remains incomplete. Further factory expenditure then needs a reasoned commercial bridge. Conversely, a qualified customer order can still leave a cash gap during the ramp and collection period. The investor should identify both conditions in the same memorandum, with the affected expenditure and the proposed response. This keeps the technology, commercial and financing questions visible to the people responsible for each commitment.
The calculation's limits should travel with every recommendation. The illustrative manufacturer has no tax, debt or terminal franchise value; its replacement-claim diagnostic covers only the stated bounded cohorts. The fixed last selling year makes delay costly through the calendar itself. These assumptions should be replaced and independently reviewed for a real transaction. The contribution of the framework is a traceable chain from product evidence to accepted output, customer price, cash obligations and staged capital; each link remains open to verification and revision.
2 Define the evidence unit behind the readiness claim
Harit and colleagues' May 2026 Perspective treats perovskite and perovskite-silicon tandem commercialisation as a product-development problem spanning manufacturing, standards, stability and finance. Its public abstract and key points argue that further laboratory efficiency gains have limited commercial value without corresponding production yield, operational stability and factory economics. This provides a published intellectual context for a readiness assessment containing several evidence dimensions. The present paper proposes a manufacturer-investment decision within that context; it claims no empirical validation or academic novelty for the general distinction between device performance and commercial readiness. [1]
The National Laboratory of the Rockies' research-cell chart describes efficiencies confirmed by recognised independent laboratories under standard reporting conditions. Its explanatory notes identify a reference temperature of 25 degrees Celsius and defined total-cell or aperture areas. These conventions make the measurement unit explicit. They do not report a distribution of saleable full-size modules or establish outdoor energy production, warranty performance or customer collections. No numerical value from the live chart is used here as an October 2026 record. [2]
An area-specific example is available in Zhang and colleagues' experimental paper, published online in October 2025. Its abstract reports certified perovskite-silicon tandem-cell efficiencies of 33.59 percent for a one-square-centimetre device and 28.53 percent for a sixteen-square-centimetre device. These are separate reported device results. They supply neither a universal scaling penalty nor a conversion rule from a laboratory cell to a commercial module. The endurance result in that abstract is excluded from this analysis because the complete experimental conditions were not inspected. [5]
The proposed evidence register therefore gives every performance claim a product identity, measured area, measurement convention, test date and provenance. A separate record identifies the manufacturing route and bill of materials represented by the tested sample. Commercial evidence receives its own dates for customer approval, shipment, acceptance and payment. Duration is recorded alongside the number of devices under observation. A readiness curve constructed from this register would show the evidence accumulated by a defined product revision; its position would not be an independently certified technology-readiness score.
For an investment committee, the practical question is which unresolved evidence item can change the next funding decision. A missing full-area measurement calls for a different experiment from an uncertain repeat-order commitment. A change to encapsulation may require a new durability assessment even when absorber efficiency improves. The proposed register retains earlier results and marks their applicability to the revised product explicitly. This creates a decision history in which technical progress, manufacturing progress and commercial progress can be assessed on their own terms.
3 Carry tandem architecture into the energy-yield case
Alberi and colleagues' 2024 roadmap explains that two-terminal tandem junctions are optically and electrically series-connected. In the absence of luminescent coupling, the junction generating the lower photocurrent limits current; the authors discuss the qualifications introduced by coupling and changing spectra. Four-terminal junctions are optically stacked and electrically isolated, allowing independent operation with suitable power electronics. Their module integration introduces additional interconnection and insulation considerations. These architecture-specific relationships provide a basis for asking how a proposed product behaves under a particular spectrum and system design. They do not establish an annual energy advantage for every tandem installation. [6]
Full-module integration has a distinct evidence base. In June 2026, Fraunhofer ISE reported a 491-watt rooftop module covering 1.92 square metres and a 546-watt large-area bifacial module covering 2.13 square metres. Both were reported at 25.6 percent efficiency over the whole module area, using Oxford PV cells and matrix-shingled interconnection. The release describes conductive adhesive, glass-glass construction and edge sealing. These reported demonstrations concern specified integrated modules. They do not establish a manufacturing-yield distribution or long-duration field performance. A lead-free adhesive also supplies no evidence that the complete perovskite module is lead-free. [3]
The proposed appraisal carries the chosen architecture into a product-specific energy-yield workstream. Its input sheet would identify module rating, measurement area, orientation, temperature response, spectral treatment, inverter arrangement, shading assumptions and degradation convention. Each input would be marked as measured for the product, supported by an applicable model, or stipulated for a scenario. A measured reference-condition rating would enter the sheet once. Any additional annual-yield benefit would need a separate justification and an explicit baseline with comparable system boundaries.
This distinction is important for pricing the use of scarce installation area. The proposed comparison holds the usable site area, installation constraints and energy-delivery boundary constant before assigning an area-related value to greater module power. It would then test whether mounting, electrical design or other system changes consume part of that value. Where relevant product-specific field information is unavailable, the calculation remains a conditional engineering-economic scenario. It does not support a sales promise.
The manufacturer-facing model in this paper stipulates its own module-level performance. The assumed module power is calculated from assumed module efficiency, area and irradiance. No laboratory cell result is inserted as the efficiency of that fictional module. Customer energy value and manufacturer margin are separate proposed accounts; a customer benefit becomes manufacturer revenue only through an expressly assumed or evidenced price.
4 Reconcile production scale with saleable output
Fraunhofer ISE's June 2025 process report describes replacing spin-coating with blade-coating in a hybrid evaporation and wet-coating route for perovskite-on-silicon cells. It also discusses the relationship between coating speed and perovskite conversion in the investigated process. This is evidence of a research route directed towards scalable fabrication. It supplies no verified industrial throughput, acceptance yield, labour requirement or sustained production cost for a factory. The process demonstration is therefore kept separate from a commercial operating forecast. [7]
Cordell, Woodhouse and Warren's published tandem-module cost model examines two- and four-terminal designs. Its institutional abstract identifies silicon-cell architecture, module efficiency and factory throughput as important cost sensitivities within the modeled cases. Those results concern a defined cost model. Its minimum sustainable prices are excluded from this paper's assumed selling prices, procurement costs and margins. They are not observed customer quotations or evidence that a particular manufacturer can produce profitably. [8]
The public scope of IEC 62941:2019 addresses product design, manufacturing processes, material controls and consistency for photovoltaic modules covered by the specified qualification standards. It assumes an ISO 9001 or equivalent quality-management system and describes a framework supporting continuing consistency. The scope gives a relevant reference for manufacturing diligence. It does not establish that a particular plant has passed an audit or achieved a particular batch yield. [18]
The proposed production bridge begins with attempted modules and follows the same cohort through initial inspection, electrical grading, repair or rework, final acceptance and shipment. Saleable watts are calculated from accepted units and the applicable accepted power bins. Reworked units retain their original cohort identity so that production is counted once. Scrap and downgraded output receive separate dispositions. The resulting bridge would allow a reviewer to ask whether improved output arose from more attempts, higher acceptance, a different grade mix or a changed definition of saleability.
For the fictional manufacturer, volume and yield remain stipulated inputs. An investment application would require line records and a consistent denominator before substituting measured values. The proposed diligence distinguishes equipment nameplate capacity, demonstrated run rate and customer-accepted output. It also records downtime, changeovers, material losses, quality holds and inventory awaiting release, with dates and product revisions. Working capital would follow the resulting purchase, production and collection schedule.
Capital expansion is then evaluated against the constraint demonstrated by this bridge. A proposed expenditure to increase coating speed requires evidence about downstream acceptance and handling. A quality-control expenditure requires a defined measurement of the defects it is intended to detect. The assessment would retain both successful and unsuccessful batches, including the cost of evidence generation during the ramp.
5 Qualify the exact module construction
IEC 61215-1:2021's public scope concerns terrestrial photovoltaic-module design qualification and type approval for long-term open-air operation. It explicitly states that qualification results are not a quantitative prediction of module lifetime. Useful life depends on design, environment and operating conditions. This limits the conclusion available from a qualification claim: the documented tests and applicable product construction can be assessed, while a service-life forecast needs additional evidence and assumptions. Only the public scope and bibliographic metadata of the paid standard were inspected here. [9]
IEC 61730-1:2023 addresses module-construction requirements associated with electrical and mechanical safety, including shock, fire and injury hazards. Its public scope identifies Part 2 as the testing part and acknowledges that national or regional requirements may differ. These are defined safety and construction subjects. The public description supplies no product-specific certification finding, insurance acceptance, warranty term or lender approval. No assertion of mandatory adoption in a particular jurisdiction is made in this paper. [10]
The proposed qualification file identifies the exact certificate, issuer, edition, test laboratory, sample construction and covered product family. Its bill-of-materials register includes absorber composition, contacts, interconnects, encapsulation, edge seal, glass, frame and junction arrangements where applicable. Changes are recorded against the evidence they may affect. The reviewer would seek a documented technical assessment of whether a modification remains within the certificate's scope and which additional evaluation is required. This is a diligence request, with the certification body's actual requirements left to the applicable process.
This file would also distinguish a completed test from a test booking, a passed sample from the production population, and a qualification report from a customer specification. Unresolved exceptions would identify the affected commercial assumption. For example, a product awaiting acceptance under a buyer's specification would have a conditional shipment date in the investment case. The base case would state expressly if shipment is assumed to precede that acceptance.
Qualification spending can be evaluated as a dated investment decision. The committee would compare the cost and duration of the next evidence programme with the capital exposure it is intended to inform. It would record the decision that follows each possible outcome, including redesign and retest. This proposed sequence gives the expenditure an explicit purpose. It does not assign a statistically justified probability of successful qualification, and it does not convert test hours into operating years.
6 Connect metastability and degradation to field evidence
The ISOS-based consensus led by Khenkin sets out stability-assessment and reporting practices for perovskite photovoltaics, including ion redistribution, reversible degradation and the distinction between ambient and intrinsic effects. Its purpose includes comparable research reporting and understanding failure mechanisms. Test environment, operating conditions and measurement history are consequently part of the evidence. These research protocols are not a commercial warranty, an IEC qualification result or an insurer's acceptance of a product. Their historical account of the extent of outdoor testing is not treated as an October 2026 market description. [11]
Silverman and colleagues' 2025 durability Perspective recommends a learning cycle combining module engineering, field testing, accelerated testing, preconditioning and performance engineering. It cautions that accelerated stress tests for new perovskite material systems have no established general translation to field service. The recommendation supports an iterative evidence programme in which field-relevant failure mechanisms inform further tests. It supplies no universal acceleration factor, lifetime distribution or numerical warranty-loss assumption. [12]
PACT's current methods page defines daily outdoor efficiency using delivered energy and incident solar energy. It describes maximum-power-point operation, filtering and area conventions, and states that the plotted efficiencies are not corrected for temperature, spectrum or incidence angle. Deceglie and colleagues separately report intraday, light-exposure-related efficiency changes in tested perovskite modules that conventional outdoor models do not explain. These methods and observations justify attention to measurement history and model applicability. No plot is converted here into an industry failure rate or a tandem-product forecast. [13,14]
The proposed field dossier pairs raw observations with the rules used to condition, filter and normalise them. It would preserve the initial state, preconditioning, electrical operating mode, weather record, interruptions and recovery periods. A later improvement after rest would be reported alongside the earlier decline. The dossier would separate reversible response, persistent change and unresolved measurement effects whenever the evidence permits; unresolved cases would remain identified as such. Comparisons across sites would state differences in exposure, product revision and observation duration.
For valuation, the proposed reliability account would retain several possible cash consequences: lower accepted power, delayed customer approval, product replacement, investigation, freight and disposal. Each consequence would have its own assumed timing and allocation between manufacturer and customer. A two-year illustrative warranty-cash window can test near-term liquidity, provided the analysis states that later liabilities are excluded. It supplies no evidence of a two-year product life or a complete long-term warranty provision. Any extended-life scenario would require additional assumptions and a separately disclosed evidence basis.
7 Include lead controls and retirement obligations
Li and colleagues' 2020 experimental study investigates lead-absorbing films placed on devices to capture leakage after severe damage and water exposure. It demonstrates a particular containment approach under studied conditions. The result does not establish universal zero leakage, fire behaviour, full-module certification or retention throughout a commercial product's field life. The quantified capture result is not used as an assumed environmental performance level in this paper. Product-specific damage, water-exposure and containment evidence would still be needed for an investment application. [15]
Xiao and colleagues' 2025 experimental paper reports aqueous perovskite recovery and recycling of additional components, including transport materials, substrates, cover glass and electrodes. Reconstructed devices and repeated laboratory recycling are studied alongside environmental modeling. This demonstrates a research route for the investigated construction and process. It establishes no contracted industrial recycling capacity for a perovskite-silicon tandem product. Its environmental percentages and modeled electricity-cost benefits are excluded from the fictional manufacturer's cash flows. [16]
Wagner and colleagues' resource-demand study models mineral and synthetic-material requirements for large-scale perovskite tandem deployment. It examines substitution and the production scaling of transport-layer materials within stated scenarios. These are resource and technology-development questions. The study supplies no confirmation that an individual manufacturer has qualified an alternative material or secured commercial supply. Its deployment trajectories and material-demand shares are not adopted as market forecasts. [17]
The proposed environmental diligence tracks the actual material inventory of the product revision under consideration. It would request evidence about normal manufacture, damaged modules, rejected output, transport, storage and retirement. Containment claims would name the tested configuration and stress conditions. A change that improves material recovery would be reviewed for compatibility with product performance and qualification. Environmental benefits and operating costs would be recorded separately, with any quantified comparison retaining its life-cycle boundary and scenario assumptions.
Retirement cash would be modeled through an explicit allocation of collection, handling, transport, processing and residual disposal. A proposed recovery credit would require its own assumption or contractual support. Where a viable commercial route is unverified, the appraisal would retain a disposal or treatment-cost scenario and describe the gap. No uniform legal obligation is asserted across markets. Applicable product, waste, worker-safety and producer-responsibility requirements would require jurisdiction-specific advice and documentary review before an actual investment decision.
8 Test the route from shipment to collectable cash
Oxford PV's September 2024 release reports its first commercial shipment of perovskite-on-silicon tandem panels to a US-based customer, with intended utility-scale use. This is a dated manufacturer statement about a commercial milestone. The announcement does not disclose the invoice, price, payment conditions, acceptance record or subsequent operating history examined in this paper. Its comparative energy claim is not adopted. The same release describes future high-volume manufacturing plans; those plans are not treated as realised production. No claim about the company's current sales or financial condition is made. [4]
The proposed commercial register follows a product from customer evaluation through specification approval, binding order, dispatch, acceptance, invoicing and collection. Each stage would identify its supporting document and any remaining conditions. A non-binding expression of interest would have its own category. Forecast demand without an inspected customer commitment would remain an assumption. This proposed separation allows investors to examine whether a sales ramp depends on technical approval, buyer financing, installation timing or the manufacturer's own delivery capability.
Price requires the same discipline. A stated premium in the fictional model is an assumed amount per saleable watt, with an assumed silicon comparator and a separate tandem increment. It is not a live quotation or a finding that a customer will pay for higher efficiency. An actual appraisal would request comparable dated offers, consistent delivery terms, power-rating conventions, warranty coverage and credit conditions. Any attributed customer benefit would have to be connected explicitly to the negotiated price and the supplier's contractual obligations.
Warranty diligence would pair the technical promise with the resources and process proposed to honour it. The file would identify the remedy, exclusions, claim route, responsible entity, security and survival after ownership changes where relevant to the transaction. A reserve calculated in a financial model is an assumed funding arrangement. It does not demonstrate insurance coverage, legal enforceability or sufficient capital for all future claims. Those matters would need separate evidence and professional review.
Finally, the proposed cash bridge would distinguish revenue recognition assumptions, invoicing, customer deposits, restricted security and money available to operate the factory. Deposits would be linked to their fulfillment obligations and possible refund events in the contractual scenario. Rejects, delayed acceptance and replacement deliveries would be traced through volume, margin and liquidity without counting the same exposure twice. The resulting case can explain a funding need even when its assumed unit margin is positive.
9 Price unresolved evidence through conditional capital decisions
The proposed investment framework prices a defined manufacturer programme through linked operating and funding accounts. Its operating case follows attempted output, accepted output, saleable power, assumed selling price and production cost. Its funding case follows capital expenditure, working capital, qualification spending, warranty cash and the timing of collections. Every parameter is identified as documentary evidence, a management estimate requiring validation, or an expressly fictional scenario input. The worked example uses the third category and represents no actual manufacturer or forecast.
Three questions structure the assessment. First, which evidence would change the expected quantity or timing of saleable output? Second, which obligation remains payable when that output is delayed or rejected? Third, what capital is available on the date the obligation falls due? These questions connect technical diligence to funding exposure while keeping the proposed treatment conditional. A positive discounted result under a selected case would describe that case's arithmetic; it would supply no evidence that the assumed readiness path will occur.
The scenario set should distinguish several mechanisms. Lower acceptance yield can raise cost per saleable watt while reducing shipments. A delayed ramp can move collections beyond qualification and fixed-cost expenditure. A reduced premium can compress margin without changing the device's measured power. A larger replacement burden can consume liquidity after the original sale. Correlated scenarios can be stipulated to examine combined pressure, provided they are described as author-selected combinations with no estimated probability or dependency structure.
Stage-gated capital is proposed as a way to define the exposure accepted before the next information arrives. An early tranche might support a specified module construction and test programme; a later tranche might require a documented production cohort and defined customer acceptance. The actual conditions, remedies and funding commitments would belong to the transaction documents. No generic lender advance rate, required equity share or automatic financing eligibility is asserted. A committee could also decide to stop, redesign or reduce scale under the expressly assumed decision rules.
The closing decision record would state which uncertainties were resolved, which remain priced through scenarios and which remain outside the model. It would include the cost of obtaining additional evidence and the exposure incurred while waiting for it. Long-duration field behaviour, later warranty claims, actual procurement prices, taxes, legal approvals and product-specific insurability require their own work where relevant. The proposed framework consequently supports a transparent conditional decision. Its numerical outputs remain subject to the scope, assumptions and time horizon of the worked case.
10 Price the customer's area constraint before quoting a premium
The proposed commercial screen starts with a specific buyer configuration. A module manufacturer receives payment for an accepted product; the purchaser must recover the additional price through its own installation economics. The worked case deliberately separates these accounts. Its assumed 27% tandem module and 22% silicon alternative are comparison inputs, unrelated to the reported research achievements discussed earlier. Both ratings use a stipulated 1,000 W per square metre. A 540 W tandem module occupies 2 square metres in this hypothetical comparison. Delivering the same nameplate watts with the assumed silicon product requires approximately 2.455 square metres.
Only the costs actually proportional to module area belong in the first screen. At an assumed USD 40 per square metre for such costs, the saving is approximately USD 18.18 per 540 W equivalent. Dividing by 540 gives an area-only premium ceiling of approximately USD 0.03367/W. The calculation excludes electricity yield, installation access, roof reinforcement, financing, insurance and service costs. A purchaser should reconstruct each excluded item for its own site. The ceiling is a diagnostic under the stipulated assumptions; it supplies no market quotation or independently appraised customer valuation.
The manufacturer's assumed USD 0.08/W premium requires USD 43.20 per 540 W module. Area savings in this example cover approximately USD 18.18, leaving about USD 25.02 per equivalent module requiring another evidenced source of buyer value. The seller should identify who captures that value, the contractual mechanism and the dates of payment. An assumed energy advantage needs climate-specific yield evidence and an identified economic beneficiary. An installation-cost claim needs a comparable contractor scope. A customer statement of interest should retain its conditions and expiry date in the commercial assessment.
The resulting price test belongs beside the factory's operating margin. Higher accepted output can improve manufacturing economics while the quoted price still fails the customer's procurement case. The valuation should therefore retain both the invoice-price scenario and the area-supported-price scenario, with separately stated buyer acceptance conditions. Any additional premium requires evidence beyond this area calculation. The investment committee can commission a focused buyer study before committing the manufacturing capital that depends on the larger premium.
11 Convert a manufacturing attempt into accepted module watts
The worked case prices a fictional decision to move from a pilot programme to a commercial tandem-module line. Every efficiency, yield, cost, price and claim rate is an author-created assumption. The comparison begins with attempted modules and follows the accepted output into invoices, collections and restricted warranty cash. It supplies no inference from a laboratory cell result to a saleable module. Technical qualification and actual customer acceptance remain unresolved. The model's purpose is to identify which commercial evidence could justify the next capital commitment and which changes would remove its calculated value.
The assumed module has two square metres of total area and 27% module-level conversion efficiency at a reference irradiance of 1,000 W per square metre. These inputs give 540 W per accepted module. The efficiency is stipulated directly at module level; there is no assumed conversion of a certified cell record, aperture area or active area into that quantity. The resulting watts are a nameplate measure. The calculation contains no annual plant-energy estimate, degradation forecast, spectral response, temperature adjustment or installation-specific yield advantage. A purchasing decision would require evidence appropriate to each of those additional claims.
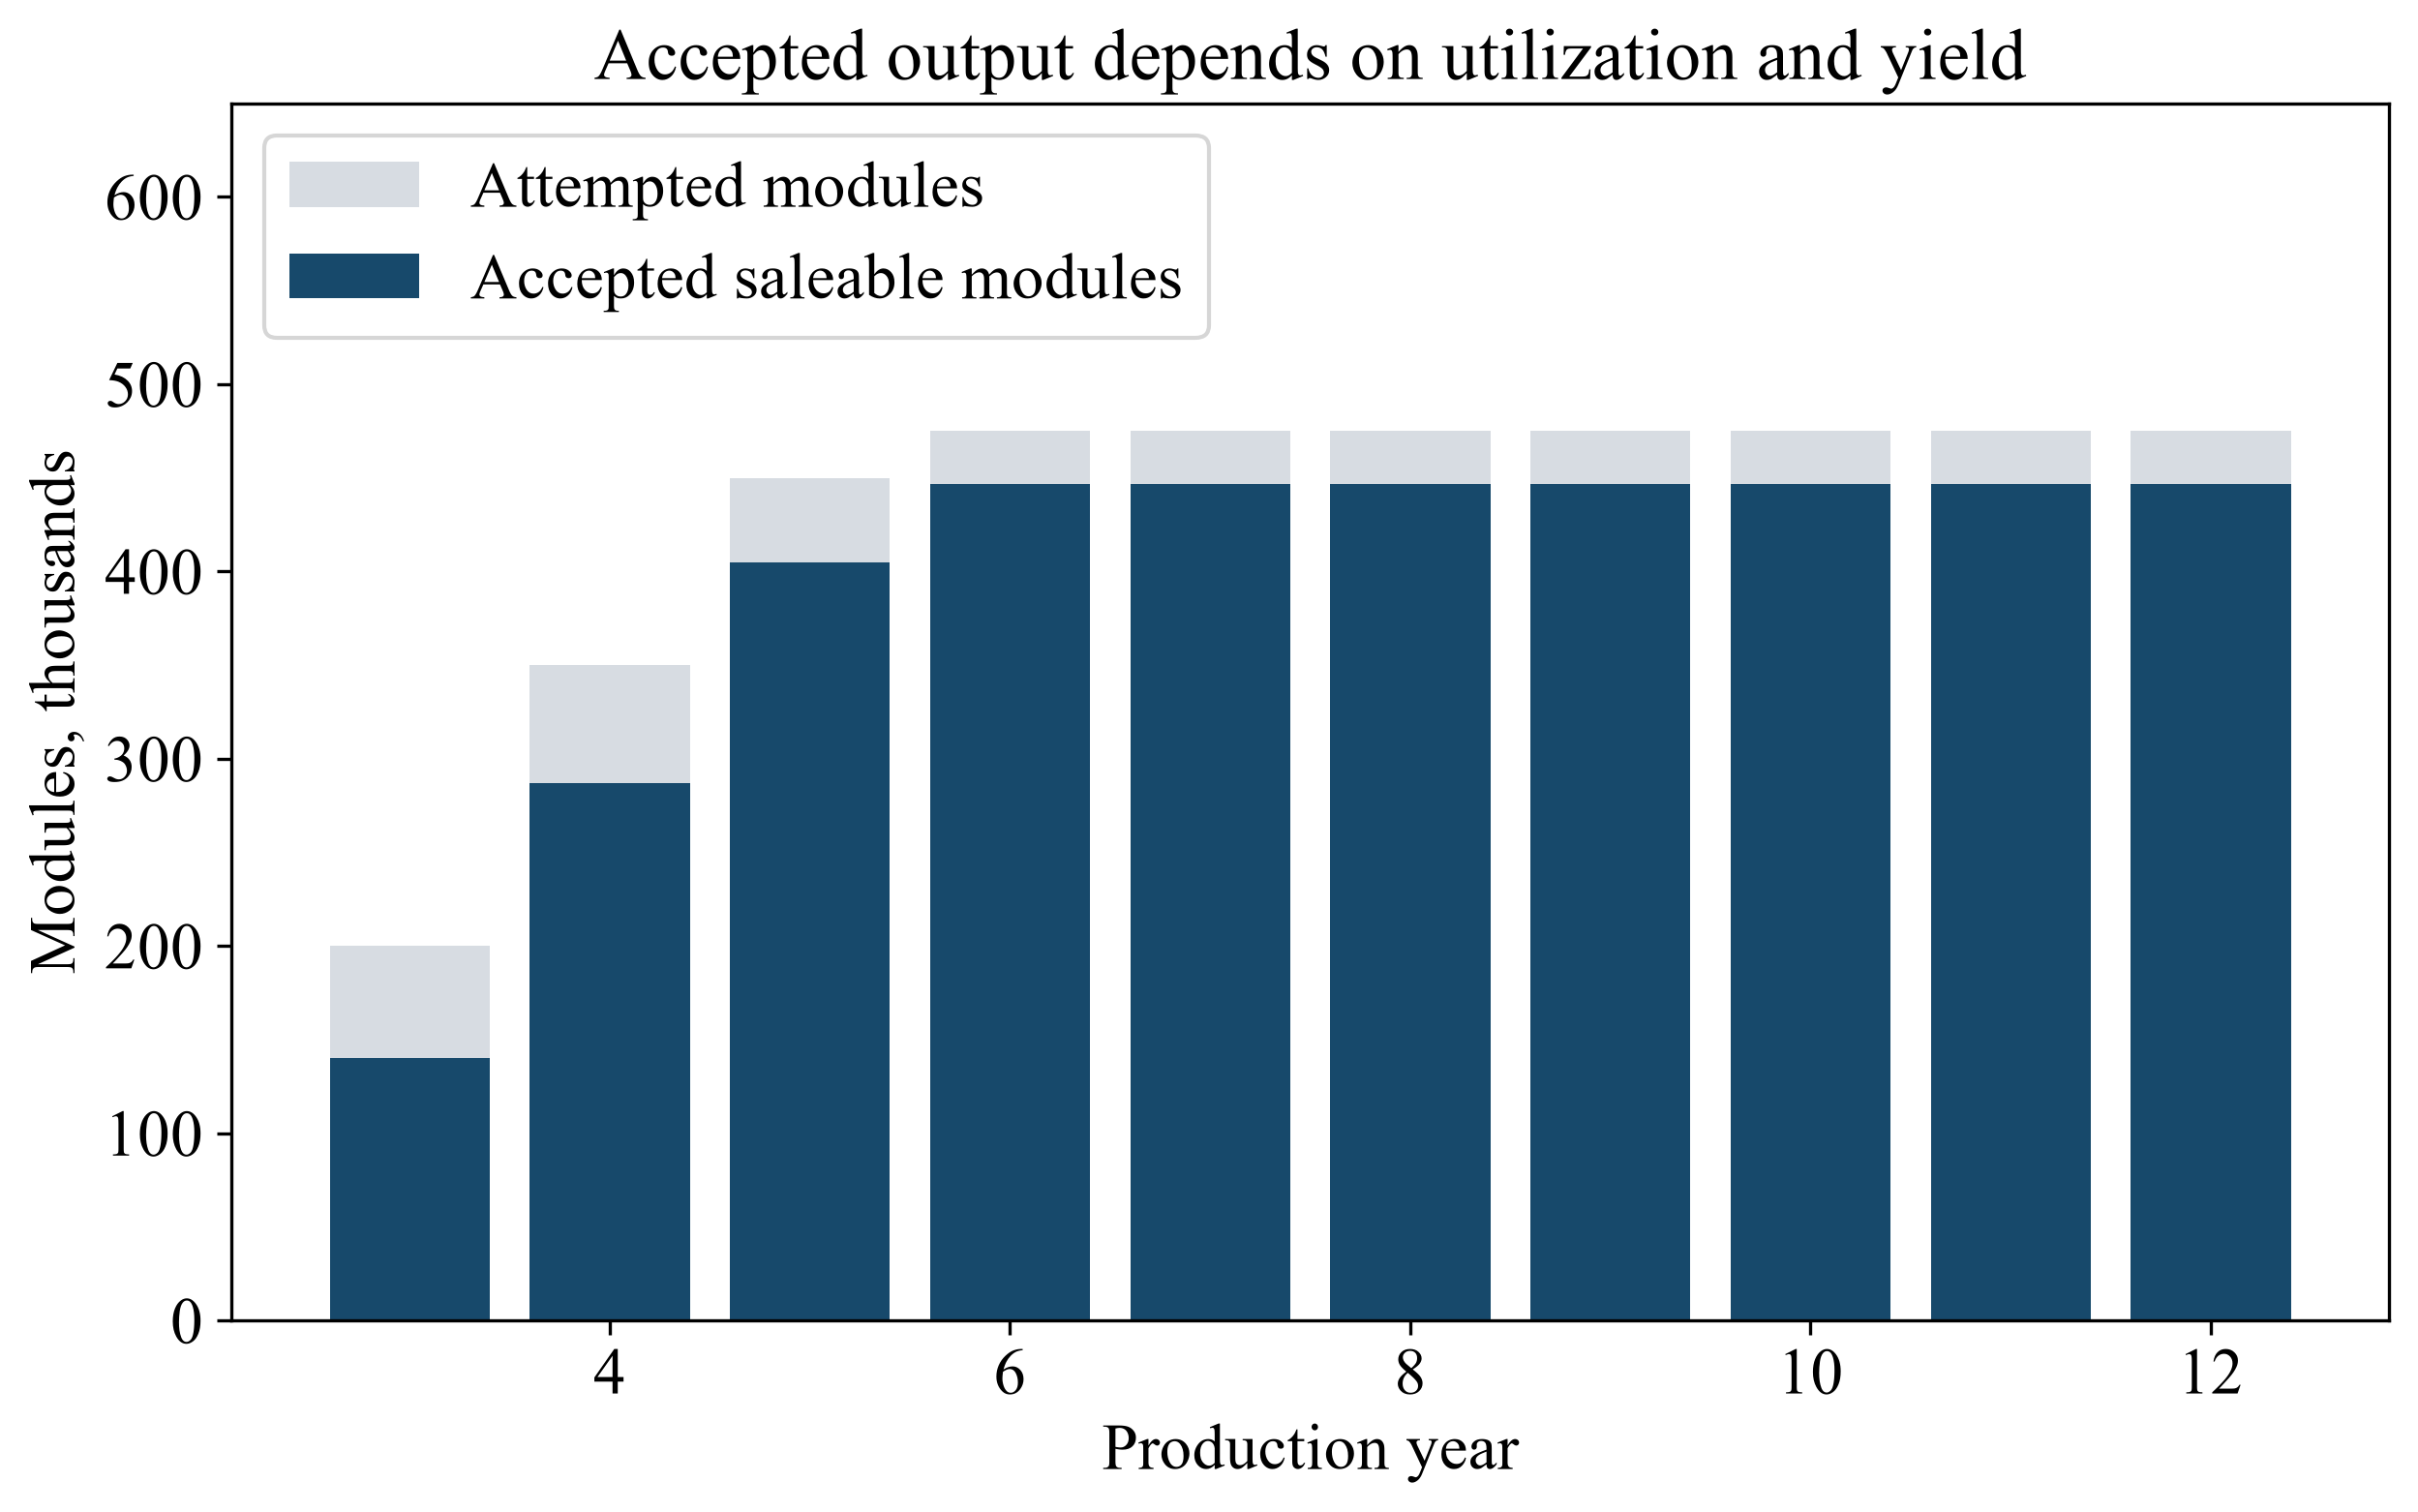
Annual attempted-module capacity is 500,000. Utilization in the first four production years is 40%, 70%, 90% and 95%, with 95% retained thereafter. Accepted yield follows 70%, 82%, 90% and 94%, remaining 94% thereafter. Multiplying capacity by utilization gives attempts; multiplying attempts by accepted yield gives saleable units. In year 3, 200,000 attempts produce 140,000 accepted modules and 75.600 MW of invoiced nameplate power. In year 6, 475,000 attempts produce 446,500 accepted modules and 241.110 MW. The ramp figure shows the rejected portion of output separately from accepted modules, so utilization and process acceptance cannot silently substitute for one another.
Each attempted unit incurs USD 75 of input and processing cost. Each accepted unit incurs a further USD 20 of finishing cost. Rejected units receive no revenue, salvage value or rework recovery. This is an explicit simplifying assumption about the economic perimeter. If a practical process can reuse material or recover a rejected unit, its additional processing, accepted output and cash dates would require separate entries. Conversely, disposal, hazardous-material handling and exceptional reject costs are not separately estimated here; an actual investment case must include them where applicable.
All accepted units are assumed sold at the stated invoice price. No orderbook, customer qualification or demand forecast supports that assumption. The output schedule therefore describes a conditional manufacturing-and-sales case. A technically accepted module that remains unsold would create a different stock and funding profile. The present inventory convention covers processing inputs and work in progress through a simplified value proxy; it does not model finished-goods ageing, cancelled orders or price discounts on accumulated modules. The investor should retain those omissions when interpreting the ramp as commercial readiness.
Table 1. Fictional production and cash assumptions
| Input | Value | Unit | Boundary |
|---|---|---|---|
| Attempt capacity | 500,000.000 | modules/year | Before accepted yield |
| Module area | 2.000 | m2/module | Total assumed module area |
| Module efficiency | 27.000 | % | Assumed module value; no cell conversion |
| Accepted-module power | 540.000 | W/module | 1000 W/m2 reference irradiance |
| Silicon quote | 0.200 | USD/W | Stipulated competing quote |
| Tandem premium | 0.080 | USD/W | Payment assumption, not demonstrated value |
| Processing cost | 75.000 | USD/attempt | Rejected units incur this cost |
| Finishing cost | 20.000 | USD/accepted module | Only accepted units |
| Warranty claim rate | 1.000 | %/cohort/age | Each of the next two years only |
| Reserve contribution | 2.500 | % invoices | Restricted cash transfer |
All inputs are fictional. No field energy, product qualification, observed price or actual warranty duration is inferred. Monetary schedules use USD million.
Table 2. Ramp from attempted modules to saleable watts
| Year | Utilization % | Accepted yield % | Attempted modules | Accepted modules | Saleable MW |
|---|---|---|---|---|---|
| 3 | 40.000 | 70.000 | 200,000 | 140,000 | 75.600 |
| 4 | 70.000 | 82.000 | 350,000 | 287,000 | 154.980 |
| 5 | 90.000 | 90.000 | 450,000 | 405,000 | 218.700 |
| 6 | 95.000 | 94.000 | 475,000 | 446,500 | 241.110 |
| 12 | 95.000 | 94.000 | 475,000 | 446,500 | 241.110 |
Rejected units have no sale, salvage or rework in this case. All accepted units are assumed sold and accepted by a customer; no evidence of actual demand is supplied.
View figure at full size; scroll horizontally on smaller screens.
Fictional manufacturer ramp, with 500,000 annual attempted-module capacity and 540 W per accepted module. Accepted yield and utilization are separate assumptions. No laboratory result is converted into a module or commercial qualification.
12 Date the capital and working capital needed to reach production
The base capital schedule commits USD 4 million to the pilot at time zero and USD 18 million at each of end-years 1 and 2 to the commercial line. Commercial production runs from year 3 through year 12. The capital amount includes the assumed commissioning requirement; fixed operating expense of USD 5 million and maintenance cash of USD 1.5 million enter each active production year. A USD 2 million closure payment occurs at the end of year 12. Years 13 and 14 each include USD 0.3 million of administration for the remaining collections and claims. No physical plant life, resale proceeds, continuing franchise or cash beyond year 14 is valued.
The invoice assumption is USD 0.28/W, composed of a fictional USD 0.20/W competing silicon quote and a USD 0.08/W tandem premium. In the first production year, invoices total USD 21.168 million. Processing costs USD 15.000 million, finishing USD 2.800 million and fixed expense plus maintenance USD 6.500 million. The resulting negative operating contribution precedes working-capital funding. By the mature ramp stage, higher accepted volume spreads fixed expenditure and rejected-unit processing across more saleable watts. That change improves unit economics under the assumed invoice, while its realization still depends on achieving the process and sales conditions.
Closing receivables equal one-sixth of annual invoicing. Collections equal invoices plus opening receivables less closing receivables. Closing inventory equals one-twelfth of that year's attempted-unit processing expense, with inventory purchases represented through its change in value. Finishing costs are paid as incurred; trade payables and customer deposits are absent. The first operating year ends with USD 3.528 million of receivables and USD 1.250 million of inventory. The cash ledger funds both amounts once. In year 13, the final receivable is collected and inventory is realised at carrying value. The separate 70% inventory-recovery case reduces that assumed realization and leaves the original production expenses unchanged.
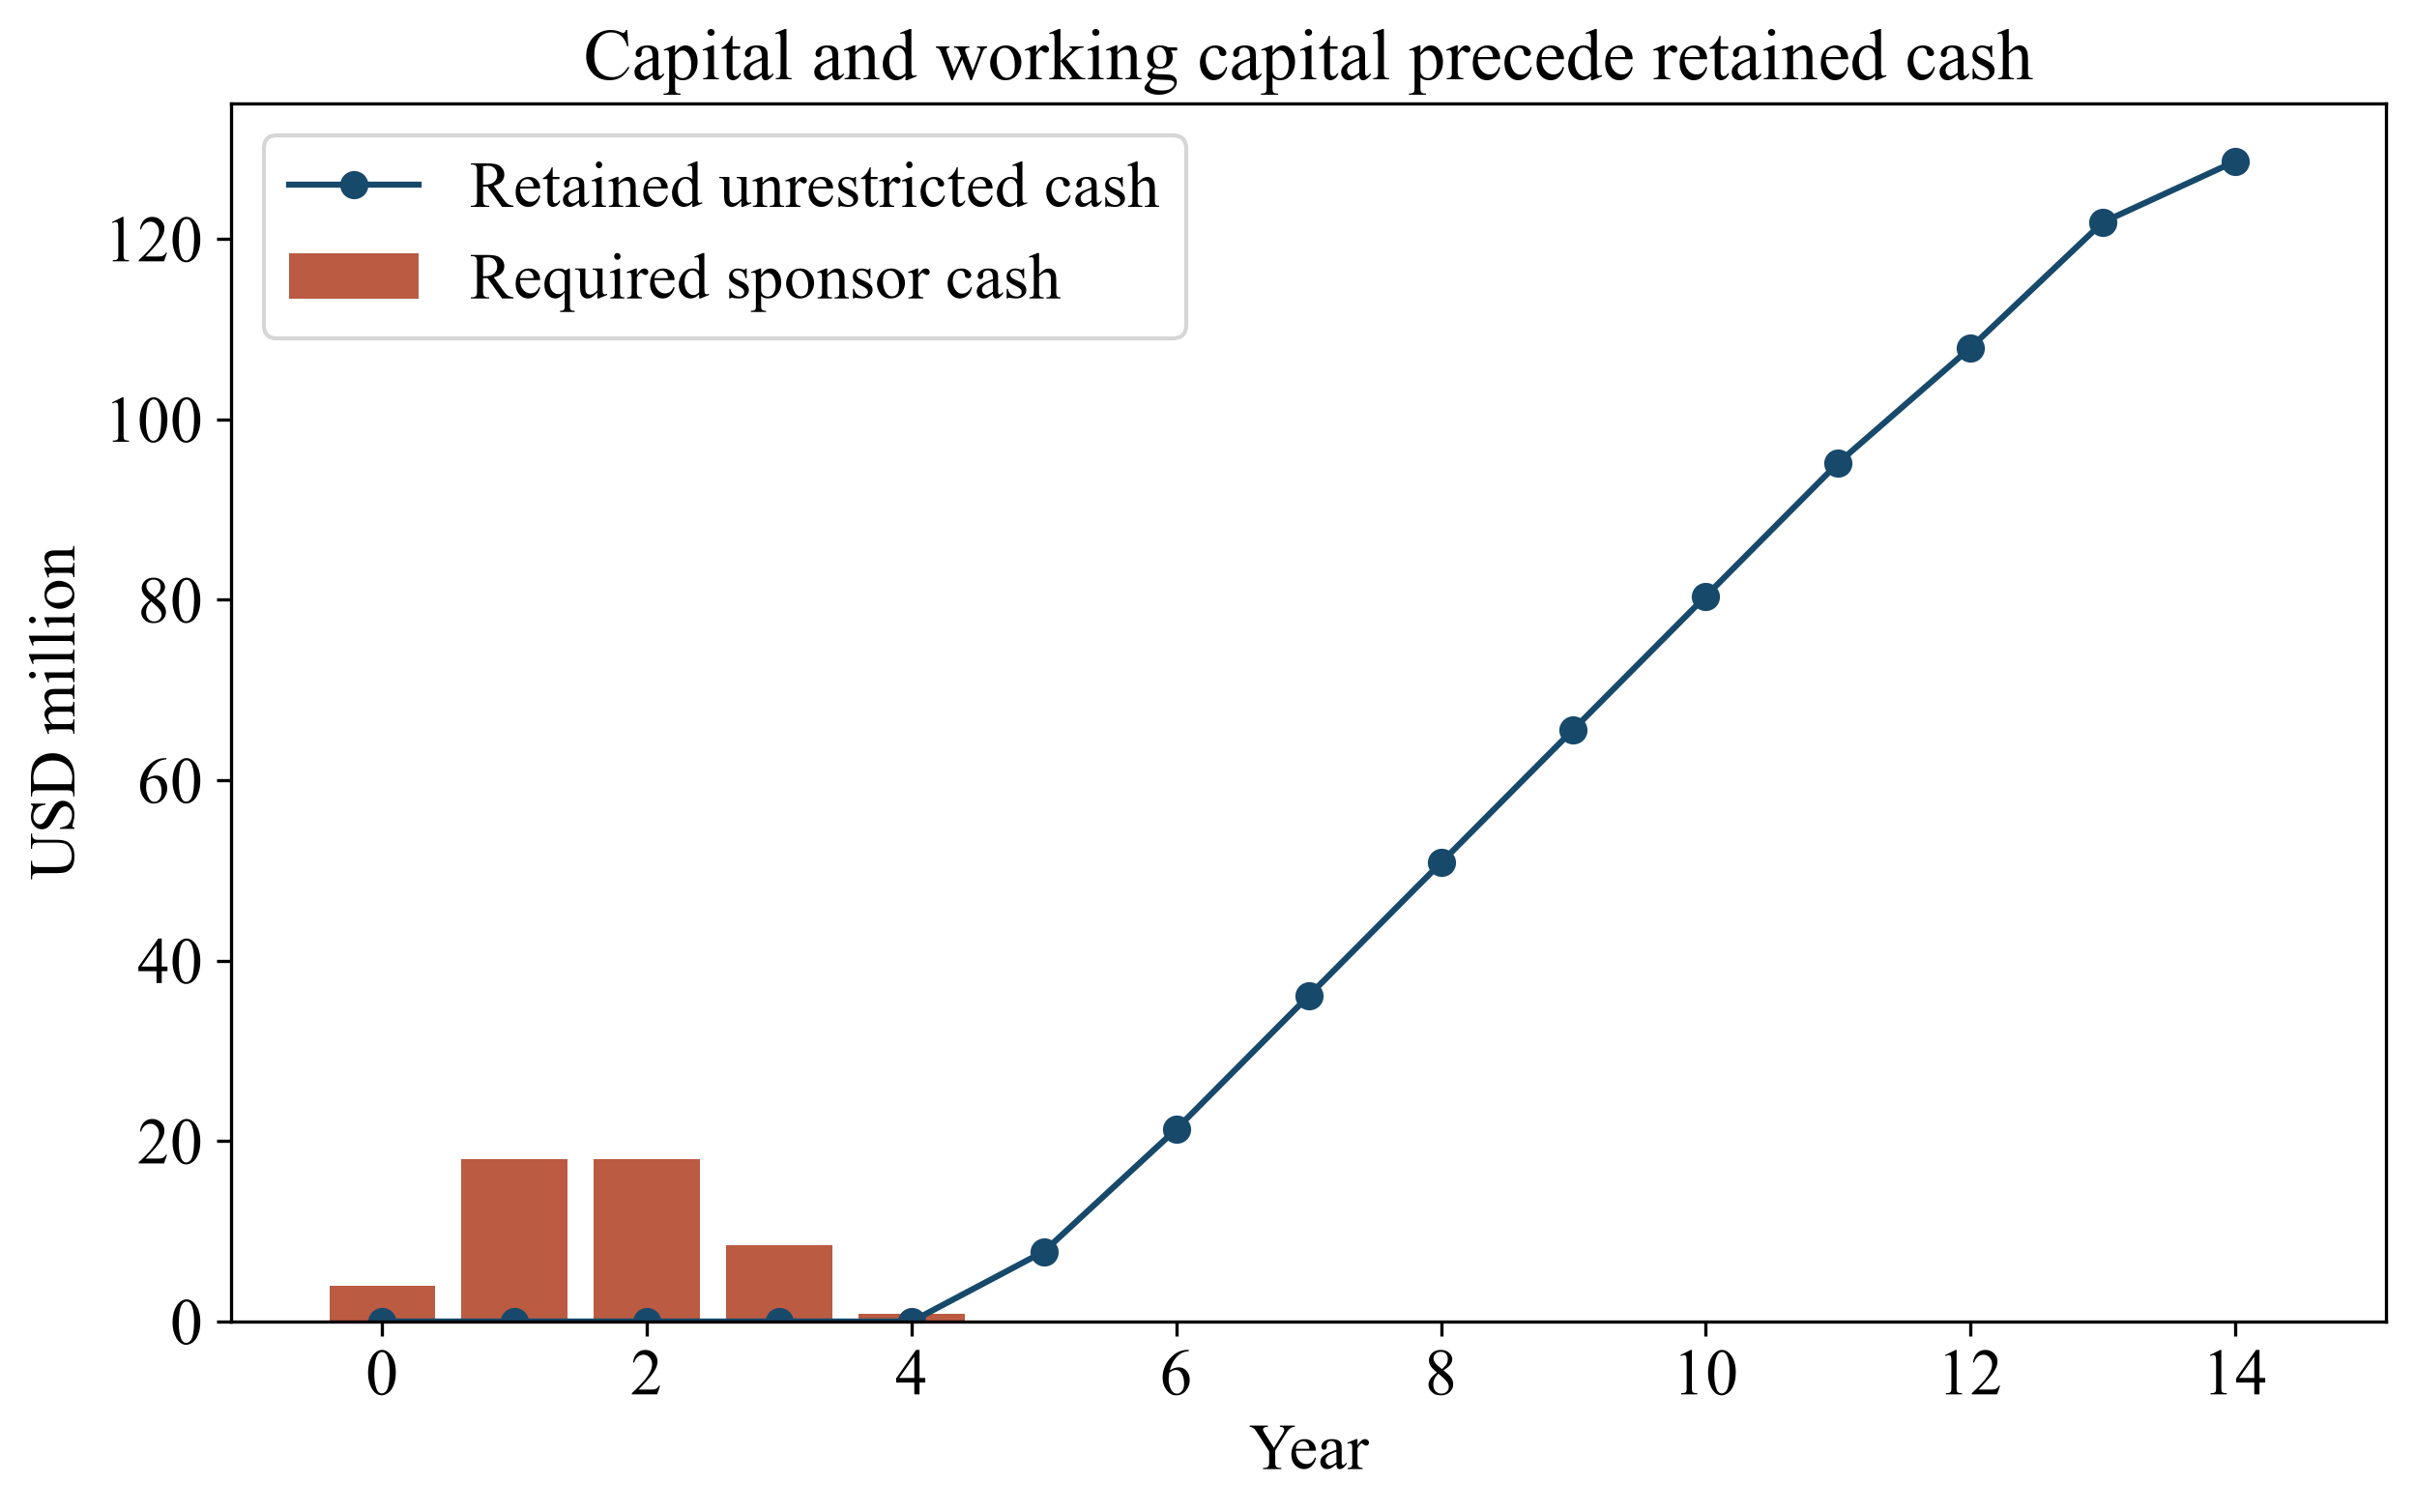
Annual unrestricted project cash includes capital, operating payments, working-capital changes and the warranty-account transfers described below. A sponsor contribution fills any annual deficit after opening unrestricted cash is used. All positive cash is retained. Required contributions total USD 49.262 million in the base case, including USD 40 million of pilot and line capital. The first production year requires USD 8.439 million and the following year USD 0.822 million. These are timely, uncommitted funding requirements. Annual netting establishes no intrayear liquidity sufficiency, available facility or sponsor willingness to fund.
At the stipulated 10% discount rate, liquid project cash-flow NPV is USD 11.809 million. This measure values net unrestricted business cash when generated or required. It is distinct from the retained-cash funding ledger and from a sponsor equity-distribution return. The ledger makes no interim distributions and ends with USD 128.596 million of unrestricted cash; discounting that final balance alone would describe a different distribution policy. No debt, interest, leverage, tax, inflation or equity IRR is calculated. The positive project result therefore remains a conditional business-cash conclusion with a separately stated financing requirement.
Table 3. Manufacturer unit economics during the ramp
| Year | Price USD/W | Process USD/good module | Cash production USD/W | Invoice | Pre-warranty operating cash |
|---|---|---|---|---|---|
| 3 | 0.280 | 107.143 | 0.321 | 21.168 | -3.132 |
| 4 | 0.280 | 91.463 | 0.248 | 43.394 | 4.904 |
| 5 | 0.280 | 83.333 | 0.221 | 61.236 | 12.886 |
| 6 | 0.280 | 79.787 | 0.212 | 67.511 | 16.456 |
Invoice and operating cash are USD million. Unit production cost includes fixed cost and maintenance, excludes capex, working capital and warranty. It is not a levelised investment break-even price.
Table 4. Annual unrestricted funding ledger
| Year | Invoice | Working-capital cash change | Liquid project cash | Equity call | Retained cash |
|---|---|---|---|---|---|
| 0 | 0.000 | 0.000 | -4.000 | 4.000 | 0.000 |
| 1 | 0.000 | 0.000 | -18.000 | 18.000 | 0.000 |
| 2 | 0.000 | 0.000 | -18.000 | 18.000 | 0.000 |
| 3 | 21.168 | 4.778 | -8.439 | 8.439 | 0.000 |
| 4 | 43.394 | 4.642 | -0.822 | 0.822 | 0.000 |
| 5 | 61.236 | 3.599 | 7.757 | 0.000 | 7.757 |
| 6 | 67.511 | 1.202 | 13.566 | 0.000 | 21.322 |
| 7 | 67.511 | 0.000 | 14.768 | 0.000 | 36.091 |
| 8 | 67.511 | 0.000 | 14.768 | 0.000 | 50.859 |
| 9 | 67.511 | 0.000 | 14.768 | 0.000 | 65.627 |
| 10 | 67.511 | 0.000 | 14.768 | 0.000 | 80.395 |
| 11 | 67.511 | 0.000 | 14.768 | 0.000 | 95.163 |
| 12 | 67.511 | 0.000 | 12.768 | 0.000 | 107.931 |
| 13 | 0.000 | -14.221 | 13.921 | 0.000 | 121.851 |
| 14 | 0.000 | 0.000 | 6.744 | 0.000 | 128.596 |
USD million, time zero immediate and later flows year end. Liquid cash includes restricted-reserve transfers and releases. Cash is retained; equity calls are timely uncommitted funding requirements, with no debt assumed.
View figure at full size; scroll horizontally on smaller screens.
Fictional USD million. Timely sponsor contributions cover annual cash deficits and are uncommitted requirements. Positive cash is retained; the project cash-flow NPV is separate from any sponsor distribution return. No debt is modelled.
13 Reconcile warranty obligations with restricted cash
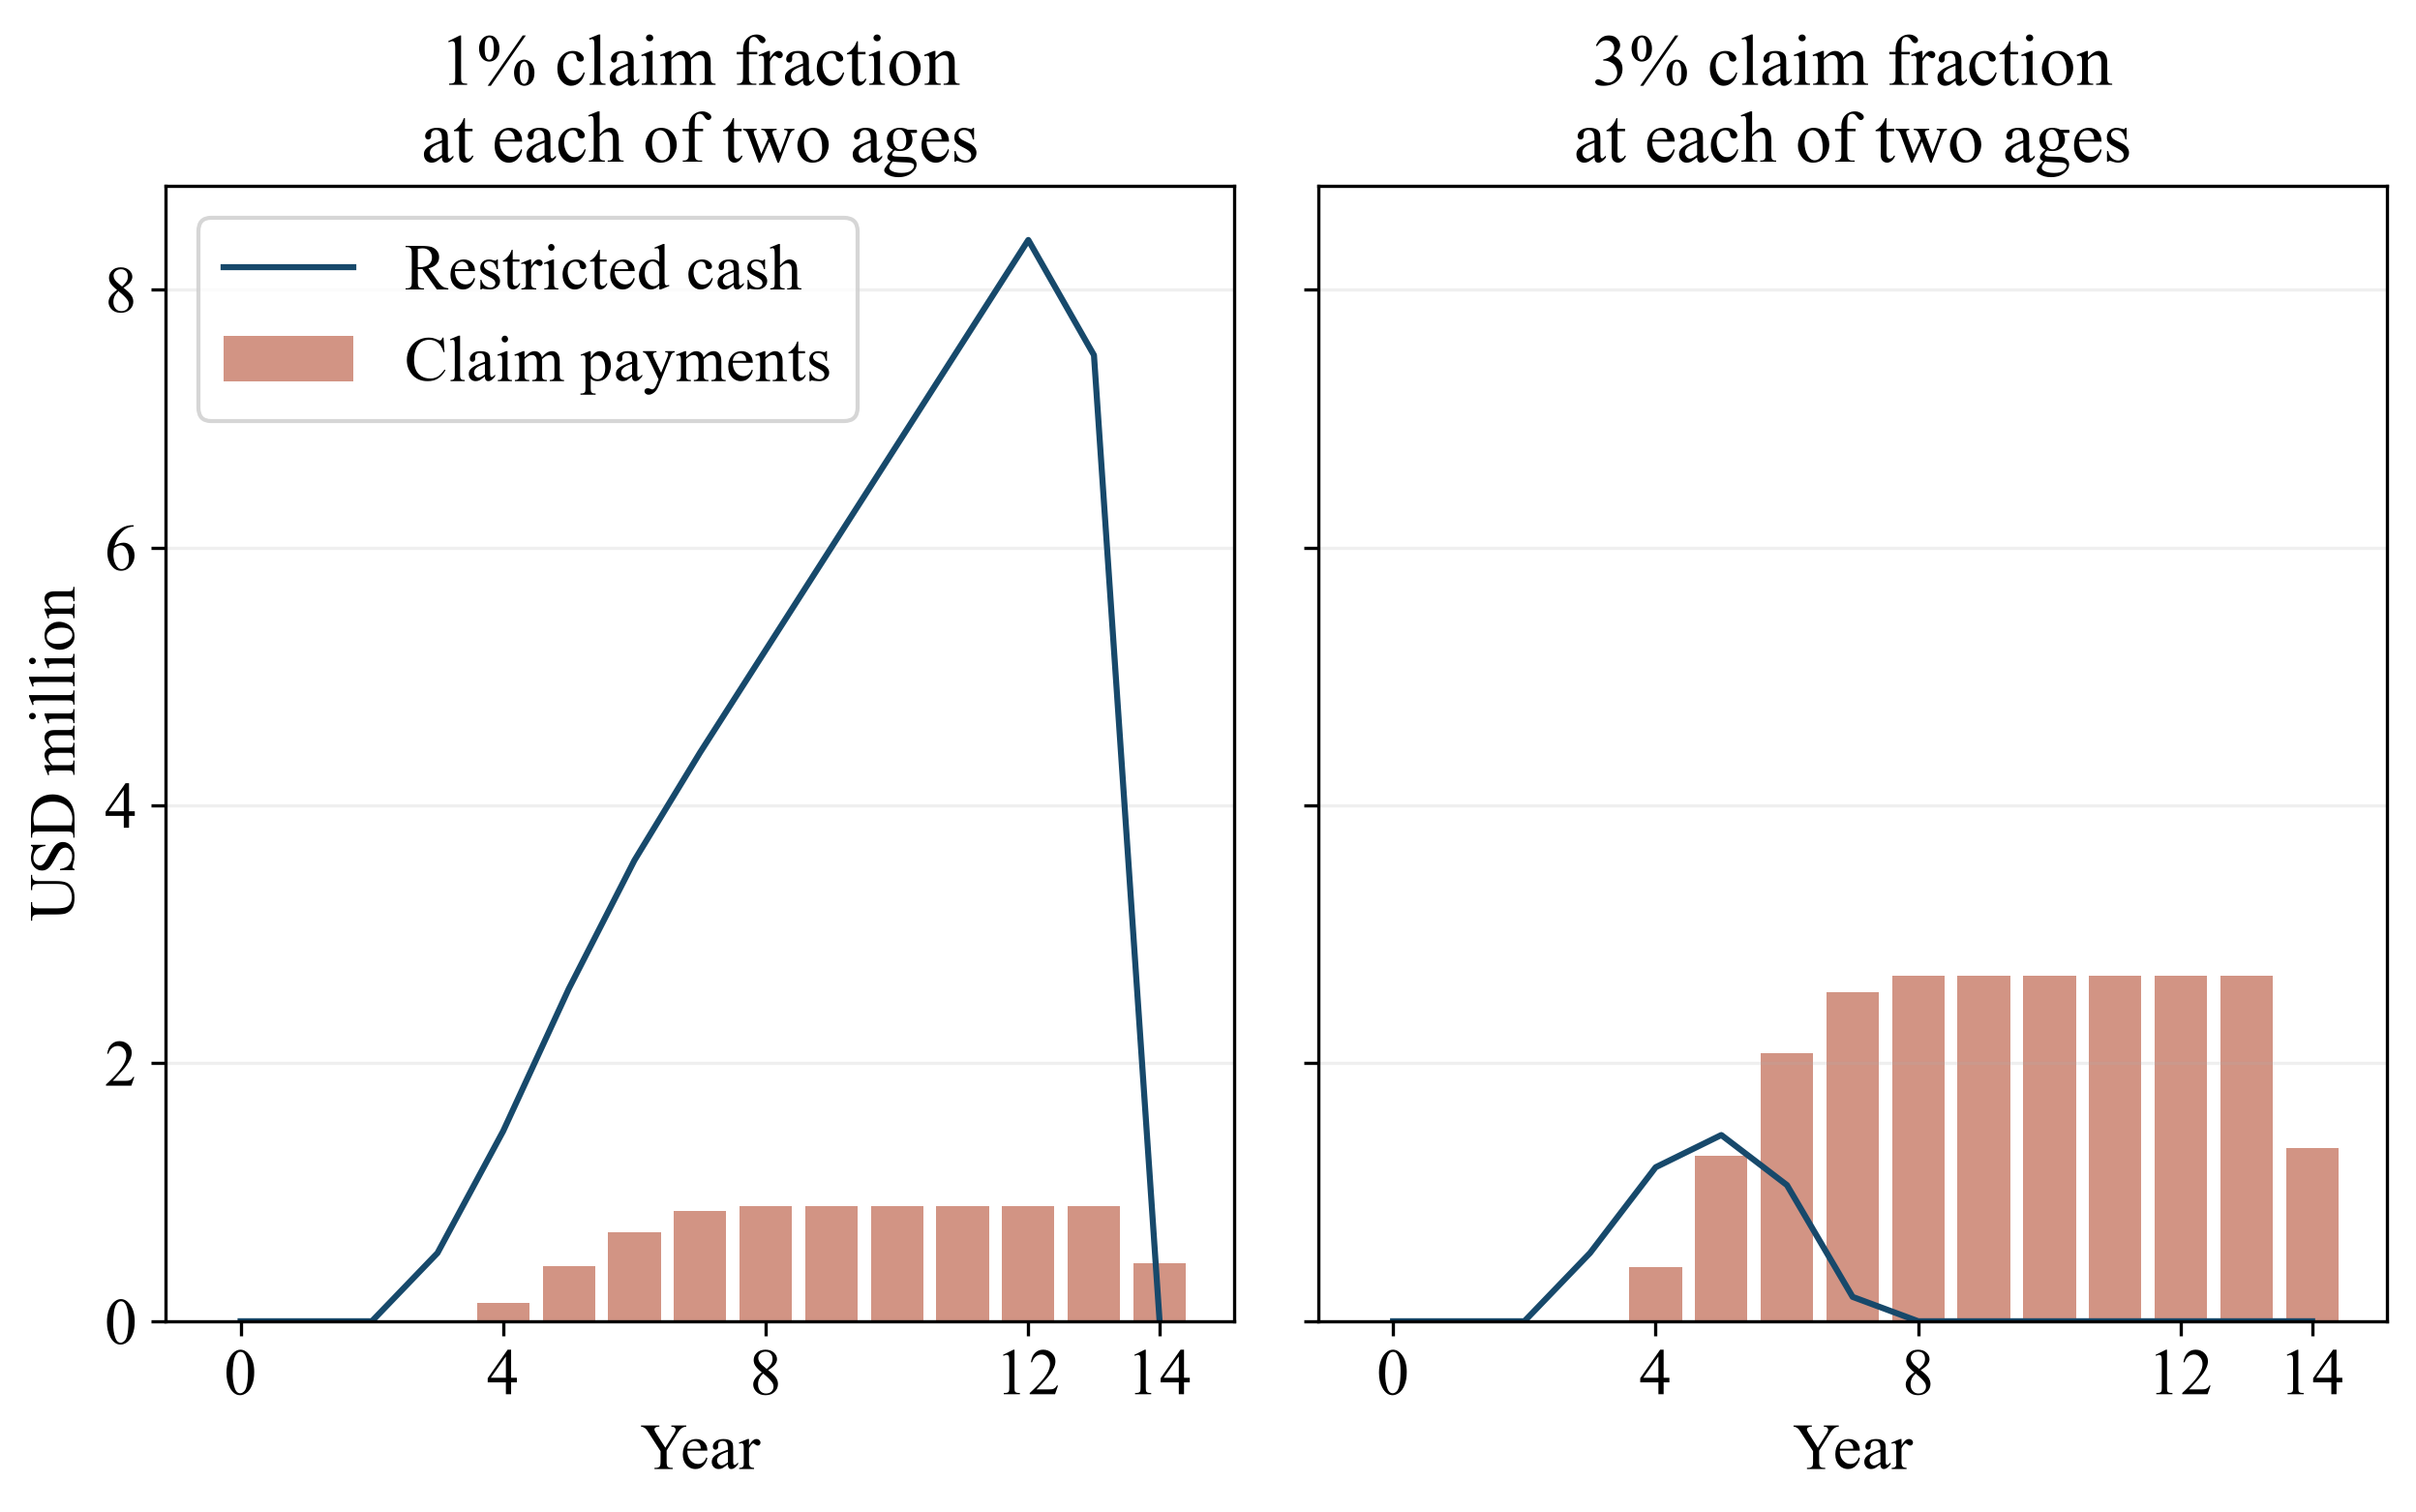
Warranty cash is represented through sales cohorts. Each cohort incurs replacement claims equal to 1% of its original accepted units in the following year and another 1% in the second following year. Each replacement costs USD 100, paid to an assumed external provider. The same original cohort is the denominator for both fractions. These are separate stipulated claim events, with no survival adjustment, repeated-failure process or claim on the replacement itself. Outsourcing keeps replacement production outside the line's own attempted-module capacity; its price must cover the assumed replacement scope for this simplified account to hold.
The two-year claim pattern is a bounded financial diagnostic. It establishes no actual product warranty term, performance guarantee, product lifetime or adequate reserve period. Claims arising later, systemic defects, field removal, transport beyond the stipulated price, legal disputes and long-term performance compensation remain unmodelled. Production ends in year 12, so the final modelled cohort has claims in years 13 and 14. Every stipulated cohort payment is therefore included within the common financial boundary. This completeness applies only to the artificial two-age pattern, whose adequacy for a real product has not been established.
The manufacturer places 2.5% of annual invoices into restricted cash. Payments use that balance first, followed by unrestricted cash when it is insufficient. The account earns no interest. Contributions are a cash restriction and are not an additional replacement expense. Across the base calendar, contributions total USD 14.959 million, actual assumed claim payments total USD 7.915 million, and the remaining USD 7.044 million is released at year 14. The reserve identity reconciles opening cash, contributions, payments, release and closing cash for every year. It also reconciles cohort claim payments with the sum paid from restricted and unrestricted sources.
Two valuation views make the timing explicit. Total-cash NPV deducts actual claim payments and excludes internal reserve transfers. Liquid project NPV additionally reflects the timing of cash restriction and release through the change in the reserve balance. The base total-cash NPV is USD 13.844 million, exceeding liquid NPV by USD 2.034 million because restricted cash becomes available later. Deducting both the original contribution and every reserve-funded payment from liquid cash would duplicate an outflow. The model instead deducts contributions, any payment requiring fresh unrestricted cash, and then adds only the permitted release.
The higher-claims case applies 3% at each of the two ages while retaining the 2.5% contribution policy. It exhausts the reserve during the operating calendar and requires subsequent unrestricted claim payments. Liquid NPV falls to USD 6.985 million. A separate lock case keeps the base claim pattern but grants no reserve release within the financial horizon, producing USD 9.954 million of liquid NPV and leaving the unvalued restricted balance visible. These sensitivities identify cash consequences of stronger claims or weaker release rights. Neither establishes that a larger reserve or the year 14 boundary covers the obligations of an actual commercial warranty.
Table 5. Warranty cohorts and restricted cash
| Year | Claim modules | Claim cash | Reserve contribution | Reserve release | Closing reserve |
|---|---|---|---|---|---|
| 3 | 0 | 0.000 | 0.529 | 0.000 | 0.529 |
| 4 | 1,400 | 0.140 | 1.085 | 0.000 | 1.474 |
| 5 | 4,270 | 0.427 | 1.531 | 0.000 | 2.578 |
| 6 | 6,920 | 0.692 | 1.688 | 0.000 | 3.574 |
| 7 | 8,515 | 0.852 | 1.688 | 0.000 | 4.410 |
| 8 | 8,930 | 0.893 | 1.688 | 0.000 | 5.205 |
| 9 | 8,930 | 0.893 | 1.688 | 0.000 | 6.000 |
| 10 | 8,930 | 0.893 | 1.688 | 0.000 | 6.794 |
| 11 | 8,930 | 0.893 | 1.688 | 0.000 | 7.589 |
| 12 | 8,930 | 0.893 | 1.688 | 0.000 | 8.384 |
| 13 | 8,930 | 0.893 | 0.000 | 0.000 | 7.491 |
| 14 | 4,465 | 0.447 | 0.000 | 7.044 | 0.000 |
USD million except modules. Each sales cohort incurs one stipulated claim fraction at age one and another at age two. Outsourced replacement costs USD 100/module. This bounded diagnostic excludes later claims and establishes no actual warranty adequacy.
Table 6. Cash and warranty reconciliation
| Identity | Left amount | Right amount | Unit |
|---|---|---|---|
| Invoices = collections | 598.374 | 598.374 | USD million |
| Claims = reserve-paid + fresh cash | 7.915 | 7.915 | USD million |
| Contributions = claims paid + release + reserve | 14.959 | 14.959 | USD million |
| Equity + liquid cash = retained cash | 128.596 | 128.596 | USD million |
| Total cash NPV | 13.844 | 13.844 | USD million |
| Liquid cash NPV | 11.809 | 11.809 | USD million |
Reserve transfers do not enter total-cash NPV; actual claims do. Liquid NPV also recognises restriction/release timing through the change in restricted cash. The two discounted measures need not equal.
View figure at full size; scroll horizontally on smaller screens.
Fictional cohorts incur the stated fraction at each of ages one and two. Contributions are restricted cash transfers; payments are actual assumed replacement expenditure. The two-year diagnostic and year 14 release establish no actual product warranty length or reserve adequacy; later claims remain unmodelled.
14 Test the invoice against a separate customer value boundary
The manufacturer price assumption requires a buyer-side test. The separate area diagnostic stipulates a silicon module power density of 220 W per square metre and a tandem density of 270 W per square metre. Both values are fictional module-level inputs. For equal nameplate watts, area saving per watt is one divided by 220 less one divided by 270. Multiplying that quantity by an assumed USD 40 per square metre of area-linked balance-of-system cost gives USD 0.033670/W. The exhibit expresses the physical saving as 0.842 square metres per kilowatt to retain meaningful precision in the displayed table.
This calculation assumes that all of the identified area-linked saving could be used to pay a module premium. It assigns no energy-output improvement, land-sale value, financing advantage, reliability benefit or durability uplift. It also contains no claim that every balance-of-system cost scales with module area. Any actual purchasing ceiling would depend on the buyer's design, installation quantities and commercial alternatives. The area calculation is deliberately limited to one stated benefit mechanism; additional value requires separately evidenced quantities and a treatment that avoids counting the same saving again.
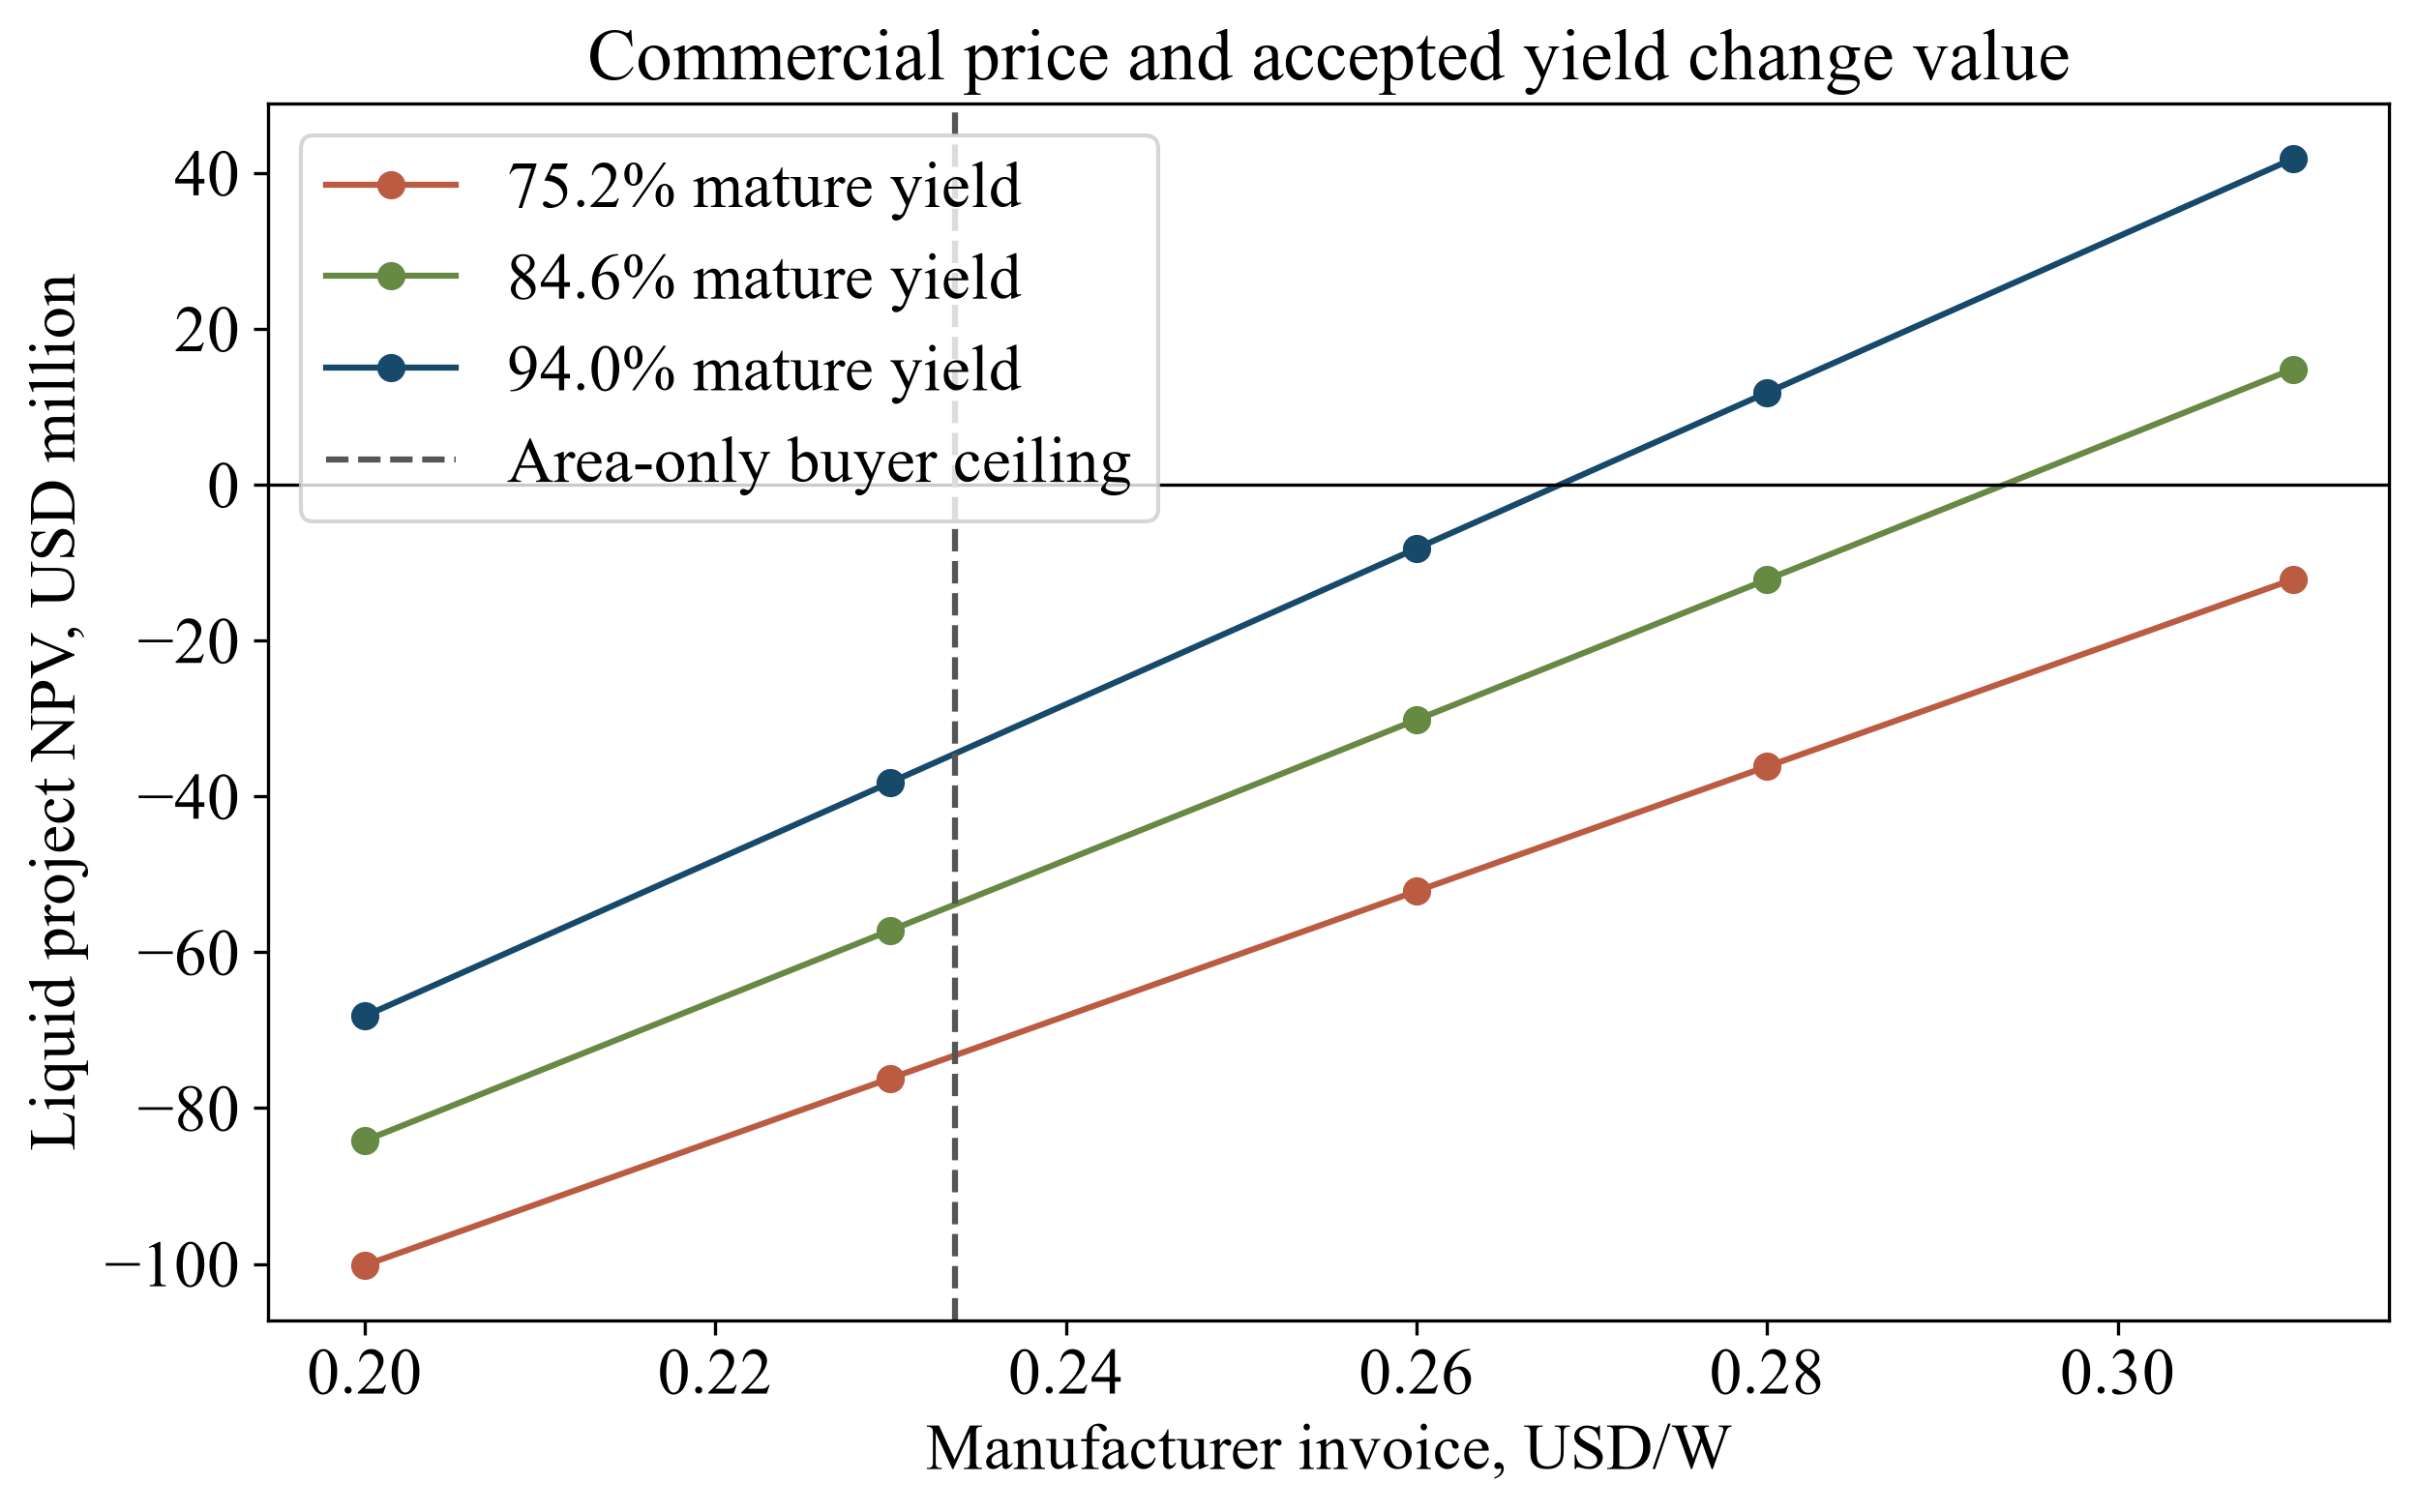
Adding USD 0.033670/W to the stipulated silicon quote gives an area-only invoice ceiling of USD 0.233670/W. The assumed USD 0.08/W premium exceeds that amount of buyer value. For 540 W of equivalent capacity, the assumed silicon area is 2.455 square metres, giving about USD 18.182 of area-linked savings. The proposed module premium costs USD 43.200, leaving USD 25.018 unsupported by this single mechanism. This is a failed price-support test under the stated inputs. The manufacturer cannot treat an assumed invoice as an accepted commercial price simply because the production case produces a positive NPV.
At the area-only invoice ceiling, manufacturer liquid NPV is negative USD 34.526 million and required equity rises to USD 60.111 million. A lower silicon quote of USD 0.15/W, with the original USD 0.08/W premium unchanged, produces a USD 0.23/W invoice and negative USD 38.197 million of liquid NPV. Both cases retain production, costs and warranty assumptions. Their purpose is to show the dependency of the investment case on price formation. No future silicon price path or probability is assigned, and the model does not claim that the larger premium can be recovered through plant-level benefits absent from the calculation.
At the base yield path, the invoice that zeros liquid project NPV is approximately USD 0.268192/W. Scaling every ramp yield to 90% of base raises that threshold to USD 0.293533/W; an 80% factor raises it to USD 0.325208/W. These factors leave attempted volume and its processing cost unchanged. The price-yield figure shows the resulting conditional investment boundary and locates the area-only ceiling on the same price axis. Even a 95% yield factor makes the USD 0.28/W case slightly negative at USD 0.186 million. The commercial decision consequently depends on evidence for process acceptance and customer payment together.
Table 7. Area-only customer price boundary
| Quantity | Value | Unit | Interpretation |
|---|---|---|---|
| Silicon power density | 220.000 | W/m2 | Assumed 22% module efficiency |
| Tandem power density | 270.000 | W/m2 | Assumed 27% module efficiency |
| Area-linked BOS cost | 40.000 | USD/m2 | Stipulated customer cost |
| Area saving per kilowatt | 0.842 | m2/kW | Same nameplate watts only |
| Area-only premium ceiling | 0.034 | USD/W | No measured energy/durability uplift |
| Area-only invoice ceiling | 0.234 | USD/W | Silicon quote plus area saving |
| Assumed invoice premium | 0.080 | USD/W | Exceeds this limited value ceiling |
| Manufacturer NPV at ceiling | -34.526 | USD million | All other manufacturer inputs unchanged |
Customer capital-saving diagnostic is separate from manufacturer cash. It assumes equal nameplate watts and all area-linked savings available to pay premium; no land, energy, finance or durability benefit is added.
Table 8. Price and accepted-yield sensitivity
| Yield factor | Price USD/W | Mature accepted yield % | Liquid NPV | Equity required |
|---|---|---|---|---|
| 0.800 | 0.200 | 75.200 | -100.179 | 170.714 |
| 0.800 | 0.230 | 75.200 | -76.176 | 121.671 |
| 0.800 | 0.260 | 75.200 | -52.173 | 72.628 |
| 0.800 | 0.280 | 75.200 | -36.171 | 60.667 |
| 0.800 | 0.310 | 75.200 | -12.168 | 53.921 |
| 0.900 | 0.200 | 84.600 | -84.190 | 137.760 |
| 0.900 | 0.230 | 84.600 | -57.186 | 82.587 |
| 0.900 | 0.260 | 84.600 | -30.183 | 58.315 |
| 0.900 | 0.280 | 84.600 | -12.181 | 53.979 |
| 0.900 | 0.310 | 84.600 | 14.822 | 48.607 |
| 1.000 | 0.200 | 94.000 | -68.201 | 104.806 |
| 1.000 | 0.230 | 94.000 | -38.197 | 61.585 |
| 1.000 | 0.260 | 94.000 | -8.193 | 53.241 |
| 1.000 | 0.280 | 94.000 | 11.809 | 49.262 |
| 1.000 | 0.310 | 94.000 | 41.813 | 46.606 |
USD million NPV and equity requirements. Yield factor scales every ramp yield; utilization, attempted input cost and calendar remain fixed. Prices are stipulated invoice cases, not accepted offers.
Table 9. Investment break-even invoice prices
| Yield factor | Mature accepted yield % | Break-even USD/W | Area-only ceiling USD/W |
|---|---|---|---|
| 0.800 | 75.200 | 0.325 | 0.234 |
| 0.900 | 84.600 | 0.294 | 0.234 |
| 1.000 | 94.000 | 0.268 | 0.234 |
The threshold zeros manufacturer liquid NPV at 10% under the stated full calendar and reserve policy. No actual customer acceptance or technical readiness is established.
View figure at full size; scroll horizontally on smaller screens.
Fictional liquid project NPV at 10%. The area-only ceiling uses stipulated 220/270 W per square metre and 40 USD per square metre of area-linked cost. No field-energy benefit, observed premium or buyer commitment is assumed.
15 Use readiness evidence to choose the next capital commitment
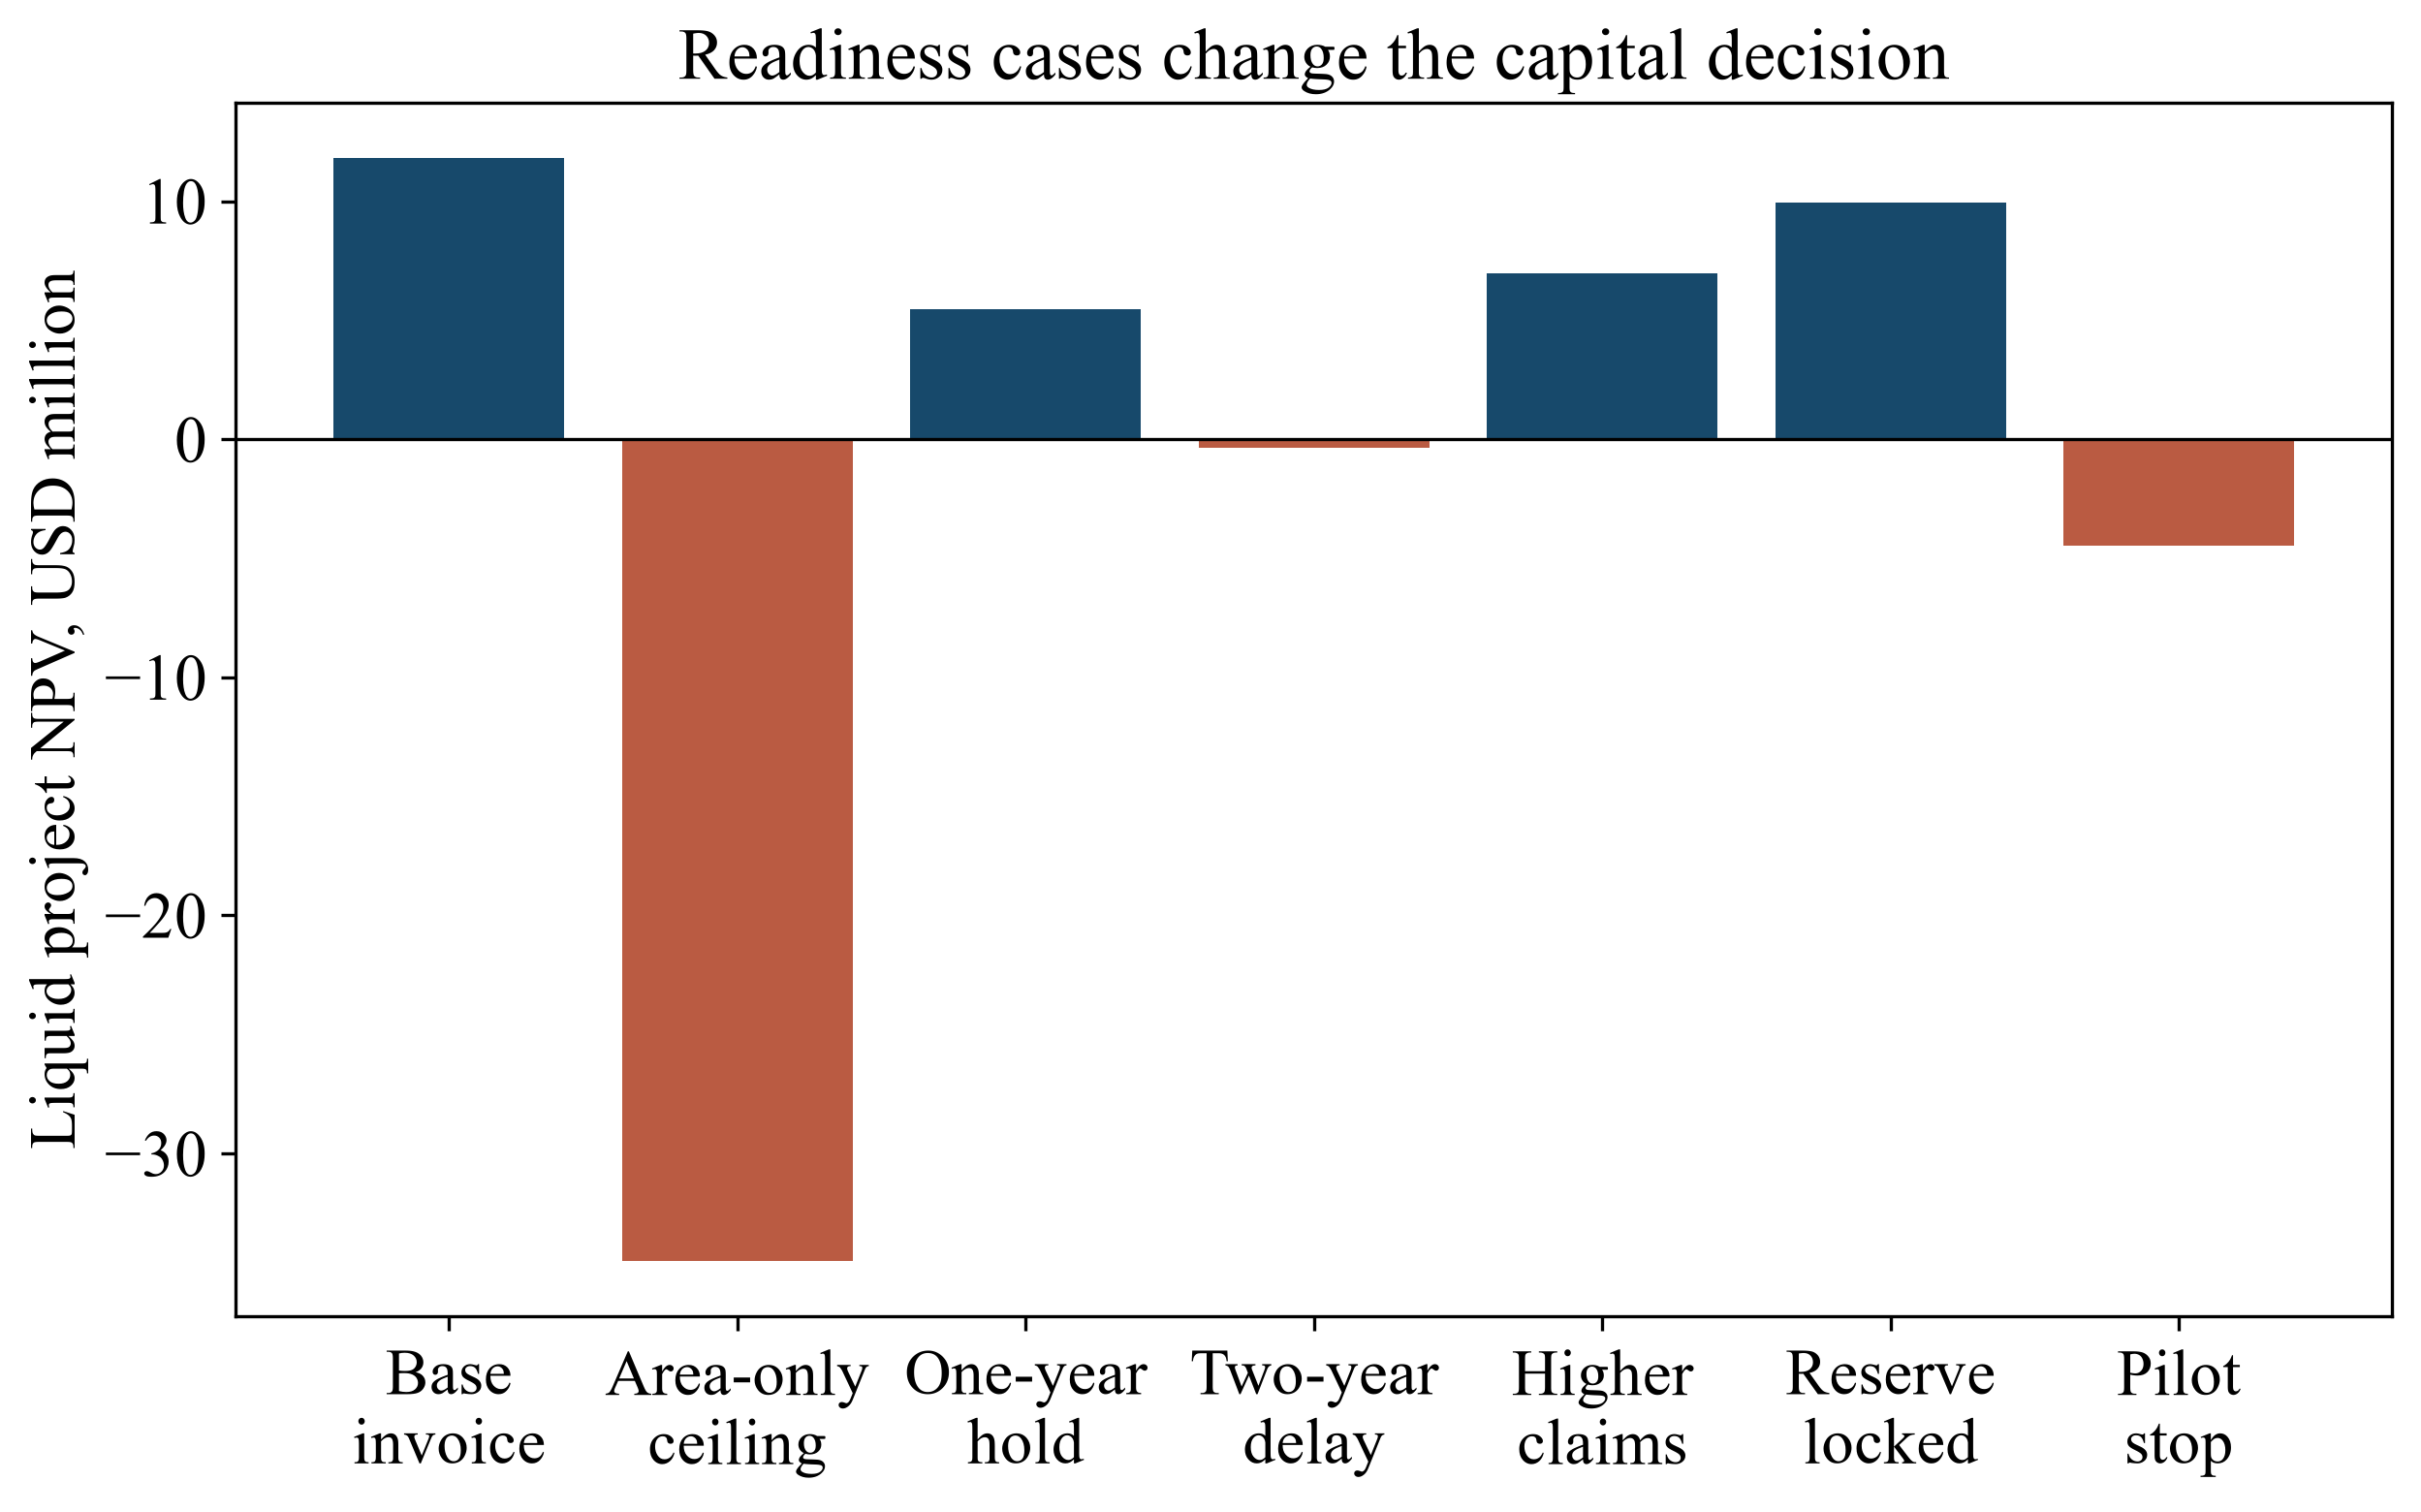
The stage decision occurs after the pilot and before the first commercial-line payment. A stop case retains the USD 4 million pilot expenditure and adds USD 0.5 million of closure in year 1. It makes no sales and incurs no commercial capital, working capital or warranty claims. Its time-zero NPV is negative USD 4.455 million. The pilot amount remains included to describe the whole programme. Once irreversibly spent, that amount is common to the available continuation decisions; it should not be counted again as a new avoidable commitment. A real stopping decision would also require evidence of contractual cancellation and cleanup obligations.
A one-year hold shifts both uncommitted commercial capital payments and the production ramp by one year, adds USD 1 million of holding expenditure in year 1, and retains the final sales date in year 12. Liquid NPV falls to USD 5.446 million and required equity becomes USD 50.262 million. Two years of delay add USD 2 million of holding costs and shorten production further, leaving negative USD 0.358 million of NPV and USD 51.262 million of equity requirements. The closure date remains year 12, inventory and receivables unwind in year 13, and the claim account ends in year 14. The comparison therefore exposes lost productive years within a fixed investment boundary.
Holding is represented as a dated scenario, with no probability of new information or measured value of learning. It supplies no real-option value. A sponsor proposing a hold should specify the evidence expected during that period, its cost, and how a possible finding changes the subsequent commitment. The current model does not improve yield or price simply because time passes. A revised case can incorporate an evidenced change explicitly and compare it with the unchanged stop and continuation schedules. Earlier payments already committed would also need their actual fixed dates, since this delay treatment moves only the assumed uncommitted commercial capital.
The integrated decision is to keep commercial expansion conditional. The base invoice case supports positive liquid project value, but the area-only buyer screen fails to support its premium. A small deterioration in accepted yield or a second year of delay removes the calculated surplus. Before releasing commercial capital, the proposed investment record should connect tested manufacturing acceptance to a saleable specification, documented customer price and payment conditions, available working-capital funding, and the actual scope of warranty obligations. The financial model quantifies those dependencies without declaring any of them achieved.
The reproducible schedule retains fifteen dated rows for each of twenty-eight cases and three break-even prices. Fifty-digit decimal calculations test module and watt dimensions, rejected output, receivables, warranty cohorts, reserve conservation, unrestricted funding and the relationship between total and liquid cash. Discount sensitivities of 7% and 13% are retained in the results. These are author calculation checks; their role is to expose the model's identities and assumptions. Actual production, customer-value, legal and funding evidence is required before the conditional numerical decision can support a capital commitment.
Table 10. Readiness stresses and capital decisions
| Case | First sales year | Liquid NPV | Equity required | Two-age claims | Locked reserve |
|---|---|---|---|---|---|
| Base invoice | 3 | 11.809 | 49.262 | 7.915 | 0.000 |
| Area-only ceiling | 3 | -34.526 | 60.111 | 7.915 | 0.000 |
| Silicon quote 0.15 | 3 | -38.197 | 61.585 | 7.915 | 0.000 |
| Yield 85% of base | 3 | -24.176 | 56.338 | 6.728 | 0.000 |
| Yield 95% of base | 3 | -0.186 | 51.620 | 7.519 | 0.000 |
| One-year hold | 4 | 5.446 | 50.262 | 7.022 | 0.000 |
| Two-year delay | 5 | -0.358 | 51.262 | 6.129 | 0.000 |
| Claims 3% per age | 3 | 6.985 | 49.262 | 23.745 | 0.000 |
| Reserve locked at year 14 | 3 | 9.954 | 49.262 | 7.915 | 7.044 |
| Inventory recovered at 70% | 3 | 11.551 | 49.262 | 7.915 | 0.000 |
| Stop after pilot | N/A | -4.455 | 4.500 | 0.000 | 0.000 |
USD million at 10% discount. Final sales year 12 and model stop 14 remain fixed. Reserve-lock case values no release beyond 14. Stop decision occurs before year 1 commercial capital. No probabilities or option value are assigned.
View figure at full size; scroll horizontally on smaller screens.
Fictional NPV of unrestricted project cash flows. All continuing cases end sales in year 12 and the financial account in year 14; delays shift uncommitted capital and ramp dates. Pilot stop precedes commercial commitment. No probabilities, option value or sponsor-distribution return is claimed.
16 Preserve the identity of the product being financed
A proposed readiness review should begin with a configuration register that follows the product through testing, manufacture and sale. The register would identify the bill of materials, device architecture, module dimensions, encapsulation, interconnection method and relevant production settings for each evidence item. Its purpose is to establish which observations apply to the product under consideration. An investor should request the underlying report, sample identifiers, test dates and configuration record together. A summary presentation that combines observations from several generations of product needs a reconciliation showing the contribution of each generation. Missing configuration information should remain an unresolved diligence item with a named owner.
The company should nominate a custodian responsible for connecting sample records to production records. A practical evidence packet would pair a test report with the relevant manufacturing traveller, measurement procedure, equipment calibration record and record of deviations. Reviewers could then select a sample and trace it back to the process that produced it. A second exercise would begin with a proposed saleable lot and trace forward to the evidence supporting its release. These two directions expose different gaps: a well-documented research specimen may have no demonstrated connection to the proposed line, while a production lot may use a changed material whose supporting tests remain incomplete. Neither exercise requires an investor to invent a technical acceptance threshold.
Configuration changes should carry explicit commercial consequences in the proposed governance system. The technical team would identify which evidence remains applicable, which requires confirmation and which must be repeated. Commercial staff would identify affected quotations, customer samples and contract specifications. Finance would identify additional cash needs and the effect of any release hold. The investment committee would receive a short change record connecting these three assessments. Approval of a material substitution would therefore include the funding and timetable required to substantiate that revised product. The original record should remain available so a later reviewer can reconstruct the basis on which money was committed.
Table 11. Proposed configuration evidence register
| Evidence | Required connection | Unresolved consequence |
|---|---|---|
| Test report | Sample and configuration identifier | Applicability remains open |
| Manufacturing record | Materials and process revision | Repeatability assessment incomplete |
| Proposed saleable lot | Release specification and supporting tests | Commercial release decision pending |
Author-proposed diligence matrix. The relevant technical specialists must define the evidence and acceptance criteria for the actual product.
17 Make production release auditable at the lot level
Before expansion spending, the proposed operating review should reconcile units entering each relevant production stage with units accepted, reworked, scrapped and remaining in process. Management should explain the treatment of trial batches, incomplete runs and products held for additional testing. A useful reconciliation carries both physical units and their associated costs. Repeated processing can consume materials and line time even where the final unit is eventually accepted. The accounting treatment should allow the reviewer to identify those resources once in the cash model. The review should also distinguish measurement uncertainty from actual product variability so the financial consequences of each can be investigated separately.
A release authority should be identified for each lot. Its decision record would state the approved specification, evidence examined, unresolved deviations and intended customer or use. A commercial waiver would require documented authority and an assessment of any effect on warranty, price, customer acceptance and future claims. A reviewer should be able to compare an accepted lot with a rejected lot and understand the decision using the records available at the time. An unexplained exclusion of rejected or interrupted runs would weaken the evidence used to estimate the cost of an accepted module. The proposed control is a complete population register with reconciled exceptions and clear reasons for any analytical exclusion.
Production reporting should connect that population to the cash forecast through a controlled denominator. Utilisation, processing yield and customer acceptance should each use a stated definition and period. Combining different periods or differently defined denominators can obscure the cash consequence of a delayed ramp. Finance should request a bridge from scheduled production to invoiced accepted product, with the intervening inventories and release holds visible. A monthly management pack could show the bridge alongside the next spending gate. Where the record is too short to support a stable estimate, the committee should retain a range of conditional outcomes and specify the observation that would justify changing it.
Table 12. Proposed production population reconciliation
| Population | Record to reconcile | Cash-model treatment |
|---|---|---|
| Accepted product | Lot release and customer status | Use stated acceptance denominator |
| Reworked product | Additional process steps and resources | Count additional resources once |
| Held or rejected product | Disposition and associated inventory | Retain cash use and recovery assumptions |
Author-proposed control. No yield or acceptance rate is asserted by this matrix.
18 Control supplier and process changes through specific agreements
Supplier diligence should examine the exact materials, equipment and services required by the approved configuration. A proposed contract schedule would identify the specification, acceptance evidence, permitted changes, delivery obligations and procedure for resolving deviations. The buyer should ask whether a supplier can change a component or process without advance notice and whether the purchaser has the information needed to assess that change. Any right to inspect, obtain data, demand corrective work or reject delivery needs confirmation in the relevant agreement. A general statement that a supplier is qualified does not describe the scope of the purchaser's actual contractual protection.
Equipment procurement should include an interface record between the equipment supplier and the manufacturing company. That record would identify the conditions under which an acceptance demonstration occurs, the materials used, responsibility for preparation and the treatment of interrupted trials. It should also identify which results are measured on the supplied equipment and which depend on upstream or downstream processes. Proposed acceptance payments should correspond to clearly described events with evidence that the paying party can inspect. Legal and technical reviewers should examine whether an unresolved interface could leave equipment paid for while a necessary combined-process demonstration remains outstanding. The cash forecast should retain that exposure until the relevant agreement resolves it.
The operating team should maintain a dependency register for consumables, replacement parts, software support and specialist maintenance. Each material dependency would have a documented continuity response and an estimate of the associated cash requirement, labelled as management's estimate until supported by quotations or agreements. Alternative suppliers would need their own configuration assessment before their availability enters the plan. The investment committee should understand which substitutions can proceed within delegated authority and which reopen a qualification gate. This approach connects procurement flexibility to the product evidence record and provides a concrete basis for deciding whether an additional supplier relationship merits funding.
Table 13. Proposed procurement interface schedule
| Interface | Documented condition | Decision owner |
|---|---|---|
| Material substitution | Evidence applicability and permitted changes | Technical and procurement leads |
| Equipment acceptance | Inputs, conditions and measurable completion | Operations and contract leads |
| Continuing support | Parts, software and service availability | Operations and finance leads |
These proposed responsibilities require assignment under the company's actual agreements and authority arrangements.
19 Tie incremental commitments to observable completion events
The proposed procurement programme should divide commitments into the amounts already irrevocable, the next optional commitment and later capacity that remains cancellable or deferrable. For each tranche, the committee should receive the evidence required for release, the cancellation terms and the cash required to complete the work after release. A small initial payment can still accompany a substantial obligation to make later payments. The review should therefore compare the authorised commitment with the entire resulting completion obligation. A useful gate decision states the maximum new exposure and the conditions under which management can proceed without returning to the committee.
Completion evidence should follow the actual sequence of work. Delivery, installation, equipment commissioning, integrated process demonstration and release of saleable product may require different records and different signatories in the proposed programme. Each event should have a responsible party, an acceptance document and an unresolved-items procedure. Where the financial plan treats one event as the start of revenue, the commercial agreement should be examined for the separate conditions governing customer acceptance and payment. The gate pack should show the interval between technical completion and cash collection using explicit assumptions. Any additional working capital required during that interval belongs in the funding request.
For a delayed programme, management should submit a dated recovery plan showing expenditure already incurred, expenditure that moves, incremental delay costs and obligations that continue on their original dates. The review should identify who is expected to provide the extra cash and whether that support is committed. An unsigned intention to support the company should be presented as an open financing requirement. The committee can then approve a bounded continuation, request a smaller demonstration, defer a commitment or stop the programme. Each decision should specify the records to preserve and the obligations to discharge, including purchased materials, supplier claims and any customer commitments already accepted.
Table 14. Proposed commitment gate record
| Gate item | Required evidence | Funding question |
|---|---|---|
| New commitment | Authorised scope and cancellation terms | What further obligation becomes binding? |
| Completion event | Acceptance record and open items | What cash is needed before collection? |
| Delay response | Dated recovery plan and continuing obligations | Is additional support committed? |
Author-proposed gate design. Delivery, commissioning, process qualification and customer payment require separately stated conditions.
20 Administer warranty exposure and service cash separately
A proposed warranty register should begin with the actual promised remedy, eligibility conditions, claim procedure, responsible entity and relevant product population. The reviewer should distinguish the manufacturer's obligation from any distributor undertaking, insurer cover or supplier recovery that might support it. Each supporting instrument needs its own verified scope, exclusions, duration and counterparty. The financial analysis should avoid assuming that a product claim generates a simultaneous cash recovery from another party. A claim may require immediate service expenditure while recovery remains contested or delayed. The proposed register would preserve the gross service requirement and the contingent recovery as separate entries.
Service planning should describe how a customer reports a suspected problem, how the company identifies the affected lot, who arranges inspection and which party authorises the remedy. Replacement inventory, transport, labour and diagnostic work should be considered where relevant to the promised obligation. These items are proposed diligence categories, with amounts established from the company's contracts and supported estimates. The plan should also identify access to product records if a distributor relationship ends or a service provider changes. A warranty provision in an accounting record does not establish that the company holds accessible cash or has arranged the practical resources needed to fulfil a remedy.
The treasury review should reconcile any restricted warranty reserve with actual claims expenditure and releases permitted under its governing arrangements. Transfers into a reserve, payments from it and replenishment should appear once in the cash bridge. If the reserve is unavailable for operating use, management should show the remaining unrestricted liquidity separately. The committee should review whether a severe claims scenario affects continued production, customer support and new capital commitments at the same time. A proposed escalation trigger can require a revised cash plan when evidence changes materially. The trigger should identify who assesses significance and who can suspend distributions or discretionary spending, subject to the company's actual authority arrangements.
Table 15. Proposed warranty cash reconciliation
| Item | Supporting record | Cash boundary |
|---|---|---|
| Customer remedy | Actual warranty terms and affected population | Gross service expenditure |
| Third-party recovery | Verified cover or supplier agreement | Contingent amount and collection date |
| Restricted reserve | Governing use and release conditions | Separate from unrestricted liquidity |
This matrix establishes no coverage or recovery right. Reserve transfers, claims and recoveries require separate accounting to avoid duplicate cash uses.
21 Maintain a decision record that survives the next funding round
The proposed board record should state the decision, the evidence available, the unresolved matters, the permitted expenditure and the conditions attached to further funding. Each conclusion should have an owner and a review date. Technical, commercial and financial specialists should identify the boundaries of their conclusions so the committee can see where one review depends on another. A test reviewer may address the reported behaviour of a defined sample while the operating team remains responsible for demonstrating repeatable manufacture. The board record should preserve these boundaries when its conclusions are summarised for prospective investors or customers.
After approval, management should compare actual outcomes with the assumptions supporting the commitment. The review should explain variances through specific causes, such as changed product configuration, different processing yield, slower acceptance, revised payment terms or additional service expenditure. It should then identify which future decisions those observations affect. Updating a central forecast without retaining the prior approved version would make that learning difficult to assess. A controlled record of forecast versions, source data and approved exceptions allows a later investor to understand how the company responded to evidence. Proposed performance reporting should focus on the unresolved conditions most relevant to the next capital decision.
The final investment recommendation should therefore identify a bounded next step and its financing consequences. A recommendation to expand should specify the remaining evidence gaps and the cash capacity to address them. A recommendation to continue a demonstration should state its cost ceiling and the decision it is intended to inform. A recommendation to pause should describe the obligations that survive the pause and the records needed to restart. These outcomes provide a practical commercial-readiness discipline without assigning a universal readiness score. They allow the committee to explain what it is funding, why the available evidence supports that commitment and what subsequent observation would require reconsideration.
Table 16. Proposed board decision and reconsideration record
| Decision | Approval boundary | Next review evidence |
|---|---|---|
| Expand | Permitted commitment and completion funding | Remaining qualification and cash conditions |
| Continue demonstration | Cost ceiling and specific test purpose | Evidence answering the stated uncertainty |
| Pause | Surviving obligations and preservation costs | Defined restart conditions |
Author-proposed decision framework. Each route remains conditional on the company's actual evidence, contracts and available funding.
22 Reconcile manufacturer cash with the purchaser's investment case
This paper proposes two linked cash schedules for a tandem commercialisation decision. The manufacturing schedule begins with accepted modules, invoiced watts, collection timing, production costs and product obligations. The purchaser schedule begins with a defined installation, equivalent service, installed capital and measured or expressly assumed operating performance. Each schedule identifies the legal entity receiving or paying each cash item. The reconciliation then shows the product invoice as the manufacturer's receipt and the purchaser's expenditure. Consolidating those accounts without identifying ownership would conceal the transaction the commercialisation programme must secure.
A buyer may value constrained installation area, but the manufacturer captures that value only through an agreed price or another explicit contractual entitlement. A power purchaser could receive the energy benefit while a roof owner pays for structural work. A developer could sell an installation before the longer operating experience becomes available. The proposed diligence worksheet therefore records the asset owner, module buyer, installer, energy beneficiary and party administering remedies. These roles remain transaction-specific; the framework assigns no actual counterparty or revenue right.
The investor should also reconcile the product specification used in both accounts. A manufacturing scenario stated in nameplate watts needs a defined module area, measurement convention, accepted-output test and configuration. A purchaser's annual-energy case additionally needs site, orientation, operating conditions and an appropriate comparison product. The investor should retain the transformation from the product specification to the buyer's cash case. Any adjustment for degradation, downtime or replacement remains identifiable and should appear once in the relevant account.
The worked manufacturer model omits the purchaser's project finance, taxes, subsidy eligibility and electricity sales. Its hypothetical discount rate is an analytical input. The calculated net present value consequently provides a conditional manufacturing screen, with no project-finance conclusion. Before funding an actual facility, the proposed reconciliation would connect a verified production configuration to qualified customer orders and a dated collection schedule. It would also show who supplies cash when collections arrive after manufacturing expenditure. Uncommitted equity support remains a financing requirement in the model.
23 Structure transactions around evidence that can change the price
The proposed transaction method distinguishes an operating manufacturing business, a technology licence and a purchase of development assets. An investor should define the acquired rights and obligations before using the scenario values in a price discussion. The illustrative factory cash flows assume an operating package with specified investment and costs. They do not value a patent portfolio, freedom to operate, a licensing contract, an acquired customer base or a technology platform that can enter additional markets. Those items require their own scope and evidence.
For an acquisition, a diligence schedule can connect each major price-dependent assumption to an identified record. Accepted yield should reconcile to specified production lots and rejected units. Selling price should reconcile to the products, volumes, conditions and collection terms in customer evidence. Product obligations should reconcile to the contracts and the configuration sold. Capital expenditure should reconcile to equipment scope, commissioning responsibilities and acceptance conditions. An investor should state which records are available, which require further review and what expenditure would become exposed before that review finishes.
The author proposes contingent consideration only where the measured event and economic meaning can be defined. A payment tied to delivered megawatts needs rules for accepted product, cancellations, returns and unpaid invoices. A payment tied to qualification needs the specified configuration and relevant test result. A production-yield condition needs its denominator, sampling period and treatment of rework. A cash-collection condition should identify the account and permitted adjustments. Legal and accounting advisers must assess the actual arrangements; the examples establish no enforceability, reporting treatment or tax outcome.
The valuation also needs a single treatment of each exposure. A rejected-unit cost already charged through attempted production should remain visible when a purchaser proposes an additional yield adjustment. A warranty expense included in the operating cash case should be reconciled to any separate reserve requirement. A retained claim liability and an escrow contribution have different cash mechanics. The investor should present their combined effect and the reason for any extra haircut. This approach makes the negotiated price adjustments traceable to the evidence and cash boundary used in the underlying calculation.
24 Conclusions and a decision-led field deployment
The author proposes a limited field programme whose observations answer a defined capital decision. The programme should identify the product configuration, comparison product, operating locations, installation dates and conditions under observation. Its commercial question might concern acceptance of the proposed price, performance under the intended climate or the practicality of diagnosing and replacing modules. The programme should establish these questions before equipment is selected. A pilot can then report what it observed within its actual scope and identify what remains unresolved.
The purchaser and manufacturer should agree how results are associated with production evidence. Each installed unit should have an identifiable configuration and lot, with retained records of changes affecting the comparison. Measurement responsibilities, data access, calibration records, outages and missing observations should be specified. An analyst should retain observations that affect the interpretation, including intervals with unavailable data and maintenance intervention. These procedures are proposed controls; the paper does not represent that a particular programme has implemented them or achieved a specified reliability level.
The financial use of the programme requires a further bridge. An observed output difference enters a buyer's valuation only after adjustment for the comparison boundary and the relevant payment mechanism. A service incident enters the manufacturer's cash assessment through the remedy, responsible entity and timing. A change in encapsulation or processing should prompt a documented assessment of which earlier observations remain applicable. The decision record should distinguish a new measurement from a change in the assumption used to interpret it.
The programme should finish with an explicit decision dossier. It should set out the tested configuration, observation period, excluded conditions, customer response and proposed next commitment. The dossier can recommend additional testing, a bounded customer deployment, a revised quotation or cessation of further expenditure. It should state the basis for each recommendation and the cash already committed. The evidence available from a finite programme cannot establish an unobserved multi-decade service history. That remaining exposure belongs in the actual product, contractual and financing review. The resulting capital decision connects a qualified product, an accepted customer price and a fundable cash calendar; unresolved links remain explicit conditions for further investment.
References
Public sources accessed 9 October 2026. Model inputs, calculated examples and proposed decision records are author-created illustrations. The manufacturing scenarios are hypothetical. Their capacity, yield, pricing and warranty assumptions require project-specific commercial and technical verification. They establish no achieved production, field reliability, customer commitment or financing availability. The model horizon, cash boundaries and residual treatment are stated with the calculations. Calculated table values use up to three decimal places with round-half-up; calendar years and module counts are shown as integers. Floating-point noise is removed at twelve decimal places before display rounding. Calculations retain their underlying precision.
- Harit, A. K., et al.. Taking perovskite photovoltaics from promise to product. 2026-05-26. Abstract paragraphs 1-3; Key points 1-3. https://www.nature.com/articles/s44359-026-00173-2
- National Laboratory of the Rockies. Best Research-Cell Efficiency Chart. Undated. Efficiency confirmations; reference temperature; total or aperture cell area. https://www.nlr.gov/pv/cell-efficiency
- Fraunhofer Institute for Solar Energy Systems ISE. Perovskite-Silicon Solar Cells Meet Matrix Shingled Interconnection. 2026-06-18. 491 W at 1.92 square metres; 546 W at 2.13 square metres; 25.6 percent whole-module-area efficiency; interconnection and edge seal. https://www.ise.fraunhofer.de/en/press-media/press-releases/2026/perovskite-silicon-solar-cells-meet-matrix-shingled-interconnection.html
- Oxford PV. 20% more powerful tandem solar panels enter commercial use for the first time in the US. 2024-09-05. First shipment to a US-based customer; 72-cell perovskite-on-silicon panels; intended utility-scale use. https://www.oxfordpv.com/press-releases/oxford-pv-solar-technology-patent
- Zhang, D., et al.. Perovskite crystallization control via an engineered self-assembled monolayer in perovskite-silicon tandem solar cells. 2025-10-20. Certified efficiencies of 33.59 percent for 1 square centimetre and 28.53 percent for 16 square centimetres. https://www.nature.com/articles/s41566-025-01778-y
- Alberi, K., et al.. A roadmap for tandem photovoltaics. 2024-03-20. Fundamentals of tandem solar cells; 2T tandem solar cells; 4T tandem solar cells; tandem module configurations. https://www.nlr.gov/docs/fy24osti/86496.pdf
- Fraunhofer Institute for Solar Energy Systems ISE. Scalable Path to Produce Perovskite Silicon Tandem Solar Cells. 2025-06-02. Hybrid evaporation and blade-coating replacing spin-coating; coating speed and conversion rate. https://www.ise.fraunhofer.de/en/press-media/news/2025/scalable-path-to-produce-perovskite-silicon-tandem-solar-cells.html
- Cordell, J. J.; Woodhouse, M.; Warren, E. L.. Technoeconomic Analysis of Perovskite/Silicon Tandem Solar Modules. 2025. Two- and four-terminal cost model; silicon architecture, module efficiency and throughput sensitivity. https://research-hub.nlr.gov/en/publications/technoeconomic-analysis-of-perovskitesilicon-tandem-solar-modules/
- International Electrotechnical Commission. IEC 61215-1:2021 Terrestrial photovoltaic (PV) modules - Design qualification and type approval - Part 1: Test requirements. 2021-02-23. Long-term open-air design qualification; explicit exclusion of quantitative module-lifetime prediction. https://webstore.iec.ch/en/publication/61345
- International Electrotechnical Commission. IEC 61730-1:2023 Photovoltaic (PV) module safety qualification - Part 1: Requirements for construction. 2023-09-13. Electrical and mechanical safe-operation construction requirements; Part 2 testing; regional code limitation. https://webstore.iec.ch/en/publication/59803
- Khenkin, M. V., et al.. Consensus statement for stability assessment and reporting for perovskite photovoltaics based on ISOS procedures. 2020-01-22. Ion redistribution, reversible degradation, test environment, operating conditions and comparability. https://www.nature.com/articles/s41560-019-0529-5
- Silverman, T. J., et al.. Durability research is pivotal for perovskite photovoltaics. 2025-06-13. Durability learning cycle combining module engineering, field testing, accelerated testing and preconditioning/performance engineering. https://www.nature.com/articles/s41560-025-01786-w
- Photovoltaic Accelerator for Commercializing Technologies; Sandia National Laboratories and National Laboratory of the Rockies. Results and Data. Undated. Daily energy efficiency; no temperature, spectrum or incidence-angle correction; maximum-power tracking and data filters. https://pvpact.sandia.gov/results-and-data/
- Deceglie, M. G., et al.. Intraday Outdoor Efficiency Changes in Metal-Halide Perovskite Photovoltaic Modules. 2025. Outdoor PACT observations; intraday changes and limitations of conventional outdoor performance models. https://research-hub.nlr.gov/en/publications/intraday-outdoor-efficiency-changes-in-metal-halide-perovskite-ph/
- Li, X., et al.. On-device lead sequestration for perovskite solar cells. 2020-02-19. Lead-absorbing films on front and back; leakage capture following severe device damage and water exposure. https://www.nature.com/articles/s41586-020-2001-x
- Xiao, X., et al.. Aqueous-based recycling of perovskite photovoltaics. 2025-02-12. Laboratory recovery of absorber and other device materials; repeated recycling and device reconstruction. https://www.nature.com/articles/s41586-024-08408-7
- Wagner, L., et al.. The resource demands of multi-terawatt-scale perovskite tandem photovoltaics. 2024-02-27. Mineral extraction and synthetic-material production scale; substitution and transport-material supply. https://publications.pik-potsdam.de/pubman/faces/ViewItemFullPage.jsp?itemId=item_29651_2
- International Electrotechnical Commission. IEC 62941:2019 Terrestrial photovoltaic (PV) modules - Quality system for PV module manufacturing. 2019-12-12. Control of design, manufacturing processes and materials for certified PV modules; consistency of performance; ISO 9001 assumption. https://webstore.iec.ch/en/publication/61932
About the Author
Chennakeshav (CK) is a corporate finance and investment banking executive with 25+ years of global experience in deal origination, structuring and execution across M&A, growth capital and corporate strategy. He has led value-creation mandates for founders, corporates and funds — bridging the boardroom view to hands-on execution and close.
His career spans Morgan Stanley, HSBC, Lloyds Banking Group, EWEC, ADQ portfolio companies and Emirates Growth Fund, across TMT, real estate, fintech, deeptech, cleantech, infrastructure and energy. He has partnered with C-suite leaders, private equity and venture funds, sovereign wealth funds and family offices to finance complex fund raises and scale-up ventures, and has led M&A due diligence, post-merger integration and business-transformation initiatives to create value.
At Matchpoint Partners he is Managing Partner, leading the firm's corporate finance, M&A and capital-raising practice. He holds an MBA from London Business School, an engineering degree from VTU and a Master of Laws (LLM, in progress) from UCL London.
An active start-up mentor, CK mentors at Techstars, DIFC FinTech Hive, Startup Grind, Founder Institute and IN5, serves as Entrepreneur Mentor in Residence (EMiR) at London Business School, and judges the Entrepreneurship World Cup.
https://www.linkedin.com/in/ckadya/ https://www.matchpoint-partners.com/team/ck-adya.html
