

1. Introduction
Country labels are indispensable to institutional investing. They determine benchmark membership, mandate limits, settlement arrangements, disclosure, taxation, regulatory treatment and the location of legal rights. They also provide a common vocabulary for investment committees and external managers. Their usefulness can create a blind spot when the label is treated as a complete account of economic risk.
The Gulf Cooperation Council contains six sovereign states with linked regional institutions, predominantly dollar-linked monetary regimes, substantial hydrocarbon wealth and active diversification programmes. These shared characteristics support a regional allocation lens. The same region contains different fiscal positions, market structures, sector mixes, population models, legal systems, capital-market depth and sources of external revenue. A regional label can therefore be both correct and insufficient.
Public benchmark composition makes the issue visible. At 29 May 2026, the MSCI GCC Countries Combined Index contained 83 constituents. Saudi Arabia represented 58.05 percent of the index and financials represented 58.51 percent. The United Arab Emirates represented 20.35 percent, followed by Kuwait at 10.02 percent, Qatar at 9.39 percent and Oman at 1.63 percent.[1] A passive regional equity position was consequently a large Saudi and financial-sector position alongside its formal GCC classification.
Economic diversification also changes the meaning of geography. The World Bank reported that GCC non-hydrocarbon activity expanded 3.7 percent in 2024, supported by private consumption, investment and structural reforms.[2] The IMF described robust non-hydrocarbon activity, higher inward investment and reform implementation in its May 2025 regional outlook.[3] These developments broaden the set of return engines available to investors. They also create exposures whose economics can depend on government investment, foreign demand, credit formation or technology adoption more than on the issuer's domicile alone.
This paper proposes a second classification layer. Country, domicile and benchmark status remain recorded. Each position is also mapped to the economic channel that generates cash flow and the shocks that can impair it. The resulting portfolio can be viewed by legal geography and by risk driver. The second view helps committees identify hidden concentration, select relevant comparators and design scenarios that correspond to how value is created.
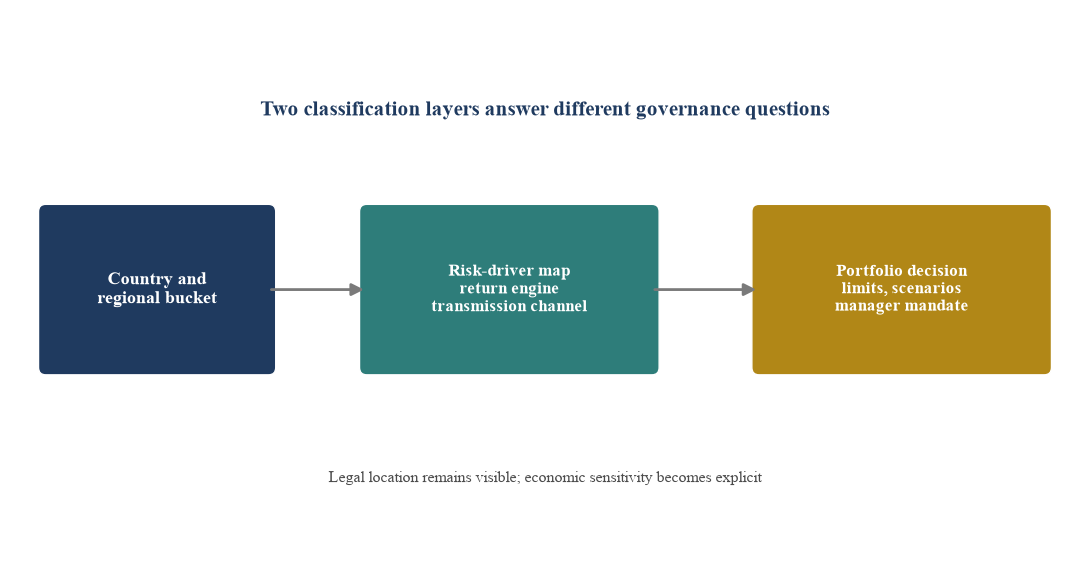
Author framework. The second layer supplements existing country, domicile and benchmark classifications.
2. What the country bucket captures
A country classification answers several important questions. It identifies the sovereign and legal environment in which an issuer or asset operates. It can indicate currency arrangements, market access, capital controls, settlement systems, insolvency rules, ownership restrictions, withholding taxes and political institutions. It also allows consistent comparison with a public benchmark and supports compliance with mandate limits.
Benchmark providers apply published eligibility, size, liquidity, investability and accessibility rules. Their classifications make portfolios operational. The MSCI GCC Countries Combined Index, for example, gives investors a transparent listed-equity universe across the six GCC states.[1] Its country and sector weights describe the investable public market that meets the methodology. They do not claim to represent every economic activity, private asset or unlisted national champion in the region.
Country buckets can become misleading through three mechanisms. First, market capitalisation can concentrate the benchmark in a few countries and sectors. Second, a listed company's operating footprint can extend far beyond its listing venue. Third, private assets can have cash flows tied to contracts, concessions, offtakers, tenants or customers whose risk geography differs from the holding company's domicile.
The issue extends beyond the Gulf. Research on international stock-return comovement has decomposed returns into global, country, industry and firm-specific components. Bekaert, Hodrick and Zhang found that parsimonious risk-factor models captured international covariance better than a simple country-industry decomposition and found no universal trend in the dominance of industry factors.[4] Diermeier and Solnik found a strong relationship between firms' international sales and exposure to global shocks.[5] These findings support a practical conclusion: both location and operating exposure can matter, and their relative importance can change.
Table 1. Information contained in the country bucket
| Classification question | Country bucket contribution | Additional evidence required |
|---|---|---|
| Legal jurisdiction | Company, fund, asset or obligor location | Holding structure, governing law and enforceability |
| Market access | Benchmark eligibility, liquidity and accessibility | Free float, ownership limits and settlement capacity |
| Currency regime | Reporting currency and exchange-rate arrangement | Revenue currency, debt currency and convertibility |
| Sovereign setting | Fiscal capacity, institutions and regulation | Policy transmission to the specific asset |
| Tax and compliance | Applicable national rules | Entity-level treatment and cross-border flows |
| Economic exposure | Broad domestic context | Revenue, cost, funding, customer and offtaker mapping |
Country classification remains a core control. The economic layer addresses additional portfolio questions.
3. Why Gulf exposure needs a second lens
GCC economies share an important hydrocarbon transmission channel. Oil and gas receipts influence government revenue, external balances, liquidity, public investment and confidence. The strength and timing of that channel differ by country and by asset. An upstream energy producer receives commodity-linked cash flow directly. A contractor may receive the effect through a public capital programme. A bank may experience it through deposits, credit demand and asset quality. A consumer platform can benefit from employment, tourism and household income.
The IMF's December 2025 GCC policy paper modelled a temporary oil-price decline to USD 40 per barrel in 2026. In that sensitivity, non-hydrocarbon GDP growth fell 1.3 percentage points below baseline in 2026 and 1.0 percentage point in 2027. Fiscal and external balances absorbed the largest direct effects.[6] The exercise illustrates the continuing connection between hydrocarbon income and the wider economy. It also shows why the magnitude of exposure depends on the transmission channel rather than a binary oil or non-oil label.
Monetary conditions form another shared channel. GCC policy rates broadly follow US policy rates under prevailing exchange-rate arrangements, while Kuwait uses a basket-linked regime. The IMF noted that most GCC central banks cut policy rates in line with the Federal Reserve's easing cycle during 2024.[3] Interest-rate changes affect bank margins, credit formation, real estate, project finance, working capital, private credit and asset valuations in different directions and with different lags.
Diversification adds new channels. The IMF found that inward and domestic investment were positively associated with GCC real non-hydrocarbon GDP, with inward investment showing a larger estimated medium-term relationship in its 2025 study.[7] Services, logistics, tourism, finance, renewable energy and technology connect the region to foreign customers and global capital. Their resilience can diverge from domestic public spending, and their cost bases can retain exposure to rent, labour, imported equipment or dollar funding.
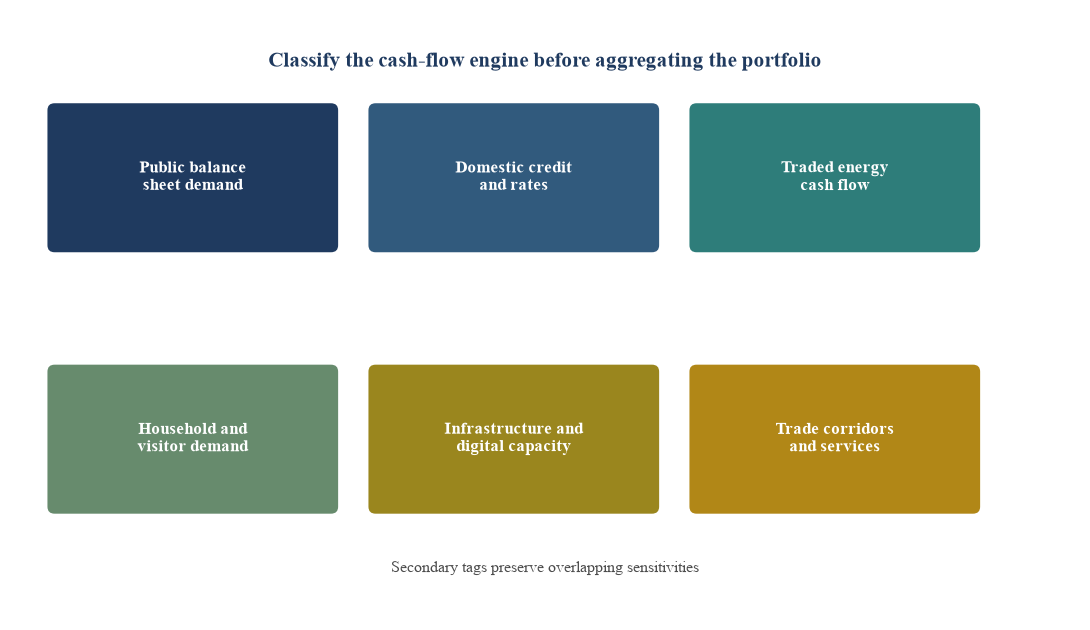
Author framework. An asset can carry several channels; one should be identified as primary for portfolio aggregation.
4. The risk-driver taxonomy
The proposed taxonomy begins with six return engines. Public-balance-sheet demand includes companies and projects whose cash flows depend materially on government budgets, state-owned-enterprise procurement, sovereign investment or regulated offtake. Domestic credit and rates includes banks, lenders, leveraged property, refinancing-sensitive companies and assets whose returns depend on local liquidity or dollar interest rates. Traded-energy cash flow includes upstream, midstream, downstream, petrochemical and service exposures linked directly to energy prices, volumes or margins.
Household and visitor demand includes retail, hospitality, aviation, healthcare, education, residential services and consumer platforms. Infrastructure and digital capacity covers contracted utilities, transport, communications, data centres, grid assets and long-duration concessions. Trade corridors and services includes logistics, ports, professional services, re-export platforms, cross-border payments and businesses whose revenue is linked to flows between the Gulf and other regions.
Each exposure receives five descriptors. Revenue geography identifies where customers or offtakers generate cash flow. Funding regime identifies fixed or floating debt, local or foreign currency, bank or capital-market funding and refinancing dates. Policy dependence records direct procurement, concession, tariff, subsidy, licensing or sovereign-investment links. Liquidity form records daily traded, periodically traded, closed-ended fund, bilateral loan or direct asset exposure. Loss transmission explains the event that converts a macro shock into lower cash flow or capital value.
The framework uses a primary engine plus secondary tags. A listed Saudi bank may have domestic credit and rates as its primary engine, with public-balance-sheet demand and household demand as secondary tags. A UAE port operator may have trade corridors and services as its primary engine, with infrastructure capacity as a secondary tag. A Qatari gas-linked bond can retain legal and country classification while its principal economic engine is traded-energy cash flow.
Table 2. Risk-driver taxonomy and observable indicators
| Return engine | Core cash-flow source | Observable indicators | Typical downside transmission |
|---|---|---|---|
| Public-balance-sheet demand | Procurement, public capex, regulated payment or sovereign investment | Budget execution, awards, payment days and project reprioritisation | Delayed awards, lower capex or slower payment |
| Domestic credit and rates | Net interest income, loan growth, refinancing or leveraged asset cash flow | Policy rates, deposits, credit growth, leverage and maturity profile | Margin pressure, defaults or refinancing gap |
| Traded-energy cash flow | Commodity price, volume, processing margin or energy service activity | Production, benchmark prices, spreads and utilisation | Price decline, quota change or margin compression |
| Household and visitor demand | Consumption, tourism, mobility and population-linked services | Employment, arrivals, occupancy, spending and pricing | Lower volume, weaker pricing or higher acquisition cost |
| Infrastructure and digital capacity | Contracted availability, usage or long-term lease payments | Capacity, utilisation, offtake, uptime and capex delivery | Construction delay, technology change or offtaker stress |
| Trade corridors and services | Cargo, re-export, cross-border revenue and professional services | Trade volumes, routes, freight, client geography and sanctions | Route disruption, lower volume or compliance friction |
Indicators are diagnostic prompts. Their materiality requires asset-specific evidence.
5. Public markets: concentration hidden inside the regional label
The listed-equity benchmark provides a measurable case. At 29 May 2026, financials represented 58.51 percent of the MSCI GCC Countries Combined Index. Energy represented 10.36 percent, communication services 8.74 percent, materials 7.51 percent and real estate 6.31 percent. Information technology represented 0.85 percent.[1] The index therefore offered investable regional equity exposure with substantial sensitivity to banks, domestic financial conditions and a small number of large issuers.
Market-cap concentration does not invalidate the benchmark. It describes the accessible listed universe under the methodology. The allocation decision requires clarity about the exposure being purchased. An investor seeking diversified access to non-hydrocarbon growth may need complementary private assets, specialist listed mandates, private credit, infrastructure or sector limits. Each complement introduces its own liquidity, valuation and governance conditions.
MSCI's research on GCC equity markets reported that the regional index underperformed MSCI ACWI and MSCI Emerging Markets in absolute and risk-adjusted terms from its 2006 inception through February 2025, while it outperformed emerging markets over the preceding decade. Earnings growth and dividends contributed positively; valuation change was a drag. Currency effects were limited by dollar pegs.[8] This decomposition shows that the return outcome combined business fundamentals, valuation and currency regime. A country label alone could not isolate those sources.
The benchmark also differs from the economic structure. National oil companies, sovereign investment assets, private family groups and unlisted infrastructure can sit outside free-float public indices. Public equity represents one investable slice of regional activity. A total-portfolio Gulf allocation should therefore reconcile public benchmark exposure with private and direct holdings before making claims about sector or risk-driver diversification.
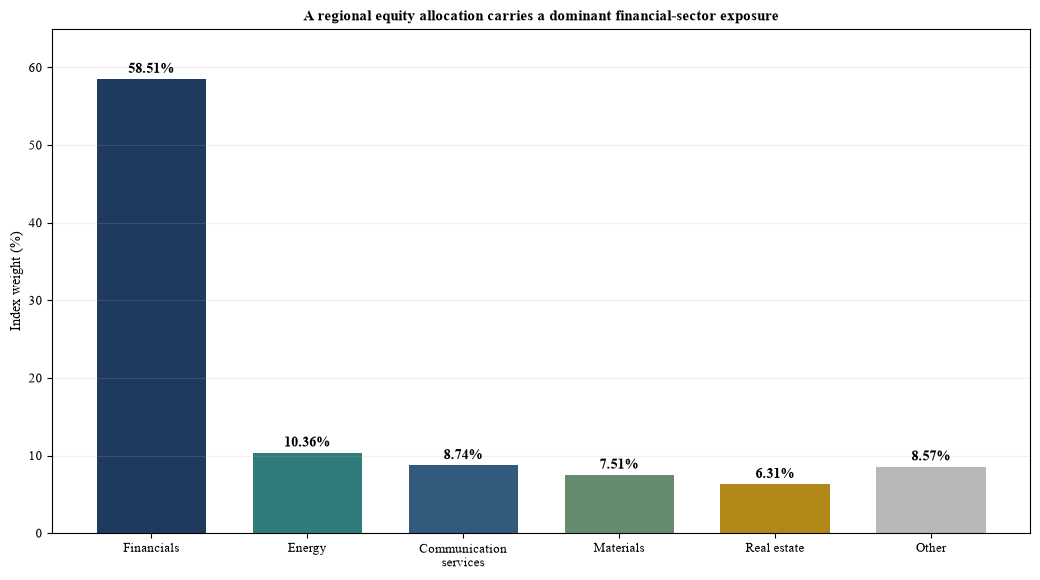
Source: MSCI index factsheet. Percentages may not total 100 due to rounding and the grouping of smaller categories.
6. Fixed income and private credit
Fixed-income classification should distinguish sovereign, government-related, financial, corporate and project exposure. The MSCI GCC Bond Index contained 463 securities from 127 issuers at 30 June 2026, with an average credit rating of A, modified duration of 5.96 and yield to worst of 5.38 percent.[9] These aggregate characteristics are useful for market comparison. Portfolio risk also depends on issuer type, duration, currency, security, covenant structure, refinancing profile and the relationship between the borrower and public-sector demand.
A sovereign bond channels oil and non-oil fiscal revenue through debt-service capacity and market access. A bank bond adds deposit, asset-quality and regulatory-capital sensitivity. A government-related issuer can combine commercial cash flow with varying expectations of state support. A project bond can depend on construction, offtake, availability, tariff and counterparty performance. Two bonds from the same country can therefore have different loss-transmission paths.
Private credit makes the distinction more important. A floating-rate loan to an asset-light service company may benefit from lender income when rates rise while the borrower experiences lower coverage. A real-estate facility may depend on presales, escrow release and refinancing. A trade-finance exposure may be short duration while retaining obligor, document, fraud and route risk. An infrastructure loan may have long duration and contracted revenue while retaining construction and offtaker concentration.
The portfolio record should capture source of repayment, security, seniority, debt-service coverage, interest-rate basis, currency, maturity, covenant headroom and recovery channel. Country remains a required descriptor. The primary economic engine determines which leading indicators and stress cases belong in monitoring.
Table 3. Fixed-income exposures with different loss transmission
| Instrument type | Primary repayment source | Leading indicators | Relevant stress |
|---|---|---|---|
| Sovereign | Fiscal revenue, reserves and market access | Oil revenue, non-oil revenue, spending and debt profile | Lower revenue and wider funding spread |
| Bank senior debt | Operating earnings and balance-sheet strength | Deposits, margin, asset quality, capital and liquidity | Credit losses and wholesale funding pressure |
| Government-related issuer | Commercial cash flow and potential public linkage | Contract revenue, leverage, ownership and support framework | Weaker operations and reduced support expectation |
| Project finance | Contracted project cash flow | Construction, availability, offtake and coverage | Delay, cost overrun or counterparty default |
| Corporate sukuk or bond | Enterprise cash flow and refinancing | EBITDA, leverage, maturity and covenant headroom | Margin compression and refinancing gap |
| Private credit | Bespoke borrower cash flow, security and covenants | Coverage, collateral, liquidity and reporting | Covenant breach, enforcement delay and recovery shortfall |
The table describes analytical categories and does not assess any issuer or security.
7. Private markets and real assets
Private assets widen the economic representation of a Gulf portfolio. They can provide exposure to digital infrastructure, logistics, healthcare, business services, private credit, growth companies and operating real estate that listed benchmarks represent only partially. Their diversification value depends on the underlying cash flows and on the reliability of valuation and liquidity assumptions.
Private-market appraisal can smooth reported volatility. A low observed correlation with public equities can reflect infrequent valuation as well as different economics. The risk-driver framework should therefore classify the return engine and retain separate records for valuation method, leverage, duration, liquidity and evidence quality. Economic diversification and measurement diversification are different concepts.
Infrastructure requires asset-specific mapping. A data centre can be driven by contracted digital demand, power availability, technology refresh and customer concentration. A toll road can depend on mobility and regulation. A utility can depend on availability payment, tariff or commodity pass-through. A logistics park can depend on tenant quality and trade flows. All can share the infrastructure label while responding to different shocks.
Real estate also needs decomposition. Residential development can depend on land, construction, presales, mortgage availability and buyer geography. Stabilised logistics can depend on trade and tenant credit. Hospitality can depend on visitor demand and pricing. Owner-occupied sale-and-leaseback exposure can depend on corporate credit. A country and property-sector bucket cannot express these differences without additional tags.
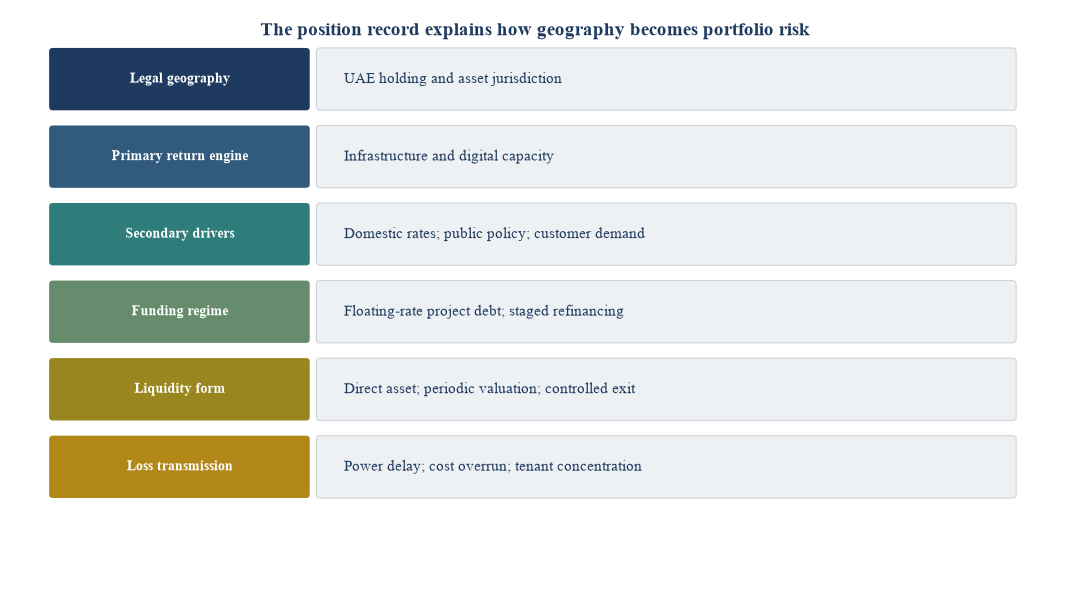
Author framework. The example shows required fields; it does not represent an actual asset.
8. A portfolio classification method
Implementation begins with a position-level exposure register. Each holding retains its established country, asset-class, sector and benchmark fields. The analyst then identifies the primary return engine using documented cash-flow evidence. Secondary drivers are recorded without allowing every exposure to carry every tag. Revenue geography, funding regime, policy dependence, liquidity form and loss transmission complete the record.
Weights should be aggregated under several views. Market value remains the accounting view. Risk contribution can be estimated when reliable return or cash-flow data exist. Revenue and EBITDA exposure can support operating analysis. Debt and unfunded commitments can show financing and liquidity burdens. The committee should know which basis supports each chart; a market-value heat map and a risk-contribution heat map answer different questions.
Look-through matters for funds. A fund-level country label can conceal portfolio-company revenue, customer and financing exposures. Managers should provide the most granular data permitted by confidentiality and mandate terms. Where look-through is unavailable, the asset owner should record the limitation and avoid false precision.
Classification governance needs an owner, evidence standard, review frequency and exception process. A proposed classification can be prepared by the investment team and challenged by risk. Material changes in revenue mix, refinancing, ownership, policy framework or operating model should trigger review. The change log should preserve prior labels so attribution remains reproducible.
Table 4. Position-level exposure register
| Field | Required content | Evidence source | Review trigger |
|---|---|---|---|
| Established classification | Country, asset class, sector and benchmark | Custodian, index or legal documents | Benchmark or structure change |
| Primary return engine | One of six economic channels | Revenue, contracts and operating model | Material change in cash-flow source |
| Secondary drivers | Up to three material sensitivities | Management and diligence evidence | New dependency or concentration |
| Revenue geography | Domestic, GCC, global and key markets | Segment reporting or portfolio data | Geographic mix changes materially |
| Funding regime | Currency, rate basis, maturity and source | Debt schedule and facility documents | Refinancing or hedging change |
| Policy dependence | Procurement, tariff, subsidy, licence or concession | Contract and regulatory record | Policy or counterparty change |
| Liquidity form | Trading, redemption, fund or direct-exit terms | Market and legal terms | Suspension, extension or transfer change |
| Loss transmission | Event to cash-flow and valuation impairment | Underwriting and scenario analysis | Risk review or material event |
The fields can be adapted to public securities, funds, loans and direct assets.
9. Hypothetical portfolio diagnosis
Consider a hypothetical USD 500 million Gulf allocation containing listed equities, GCC bonds, private credit, infrastructure, real estate and growth capital. The portfolio is diversified across four countries and six asset categories. Market-value diversification appears broad. The risk-driver view shows that 34 percent is primarily driven by domestic credit and rates, 24 percent by public-balance-sheet demand and 18 percent by infrastructure and digital capacity. The two largest channels account for 58 percent.
This hypothetical result changes the committee agenda. A country-limit report may show compliance while a financial-conditions shock still affects banks, leveraged property and floating-rate borrowers together. A public-capex slowdown can affect contractors, project suppliers and certain logistics assets across several countries. A trade disruption can affect ports, freight and re-export businesses while leaving domestic services less exposed.
The committee can respond through limits, complementary exposures and monitoring. It can place a maximum on combined domestic-credit and public-demand sensitivity. It can require each external manager to report revenue geography and funding basis. It can select global-revenue companies, trade-corridor assets or contracted infrastructure when those exposures improve the intended risk budget. Every response should retain asset-specific diligence.
The model uses assigned primary drivers and illustrative weights. It does not estimate correlations, expected returns or losses. A production portfolio would require verified holdings, look-through data, position valuations and committee-approved classification rules.
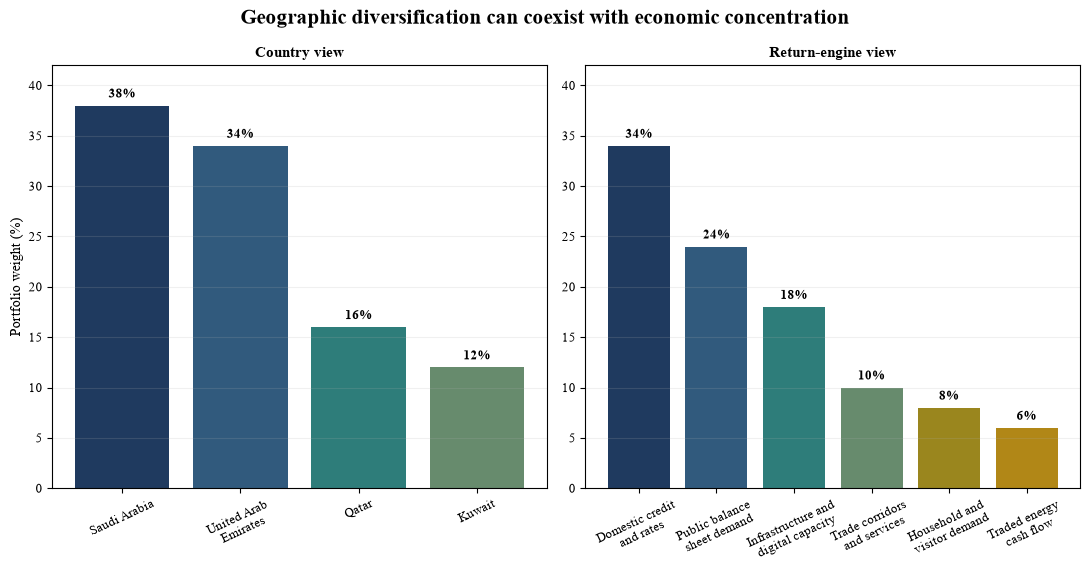
Illustrative assumptions only. The two panels use the same USD 500 million portfolio.
Table 5. Hypothetical risk-driver allocation
| Primary return engine | Weight | Concentration question | Example monitoring evidence |
|---|---|---|---|
| Domestic credit and rates | 34% | Are banks, property and borrowers exposed to the same rate and liquidity shock? | Policy rates, deposits, credit growth, coverage and maturities |
| Public-balance-sheet demand | 24% | How much cash flow depends on awards, capex and public payment? | Budget execution, awards, backlog and receivable days |
| Infrastructure and digital capacity | 18% | Are power, construction and offtake dependencies diversified? | Capacity, milestones, uptime, offtake and capex |
| Trade corridors and services | 10% | Which routes, customers and external regions drive revenue? | Trade volume, route disruption and client geography |
| Household and visitor demand | 8% | How sensitive are volume and price to employment and arrivals? | Spending, arrivals, occupancy and retention |
| Traded-energy cash flow | 6% | Which price, volume and margin variables determine cash flow? | Commodity price, production, spread and utilisation |
All weights and diagnoses are illustrative. They are not recommendations or market estimates.
10. Scenario design by transmission channel
Scenarios should begin with an observable shock and trace the path to cash flow, financing and valuation. An oil-price decline can reduce fiscal and external balances, influence public investment and affect confidence. Its impact on a bank, contractor, consumer asset and exporter will differ. A single uniform country haircut removes that distinction.
A US-rate shock can affect policy rates, discount rates, bank margins, borrower coverage and refinancing. The sign can differ across assets and time. A bank with low-cost deposits may initially benefit from higher rates, while credit losses and funding competition can emerge later. A leveraged property company can experience immediate interest expense and a slower valuation response. The scenario therefore needs staged transmission.
A public-capex reprioritisation scenario should identify contract backlog, award timing, payment history, customer concentration and working-capital capacity. A trade-corridor disruption should map routes, substitute capacity, insurance, inventory and customer geography. A technology-demand correction should map tenant concentration, contracted capacity, power commitments and equipment obligations.
The committee can establish common scenario narratives and require asset-specific parameters. Results can be aggregated by return engine, country, manager and asset class. This structure preserves a consistent shock while allowing different cash-flow mechanics.
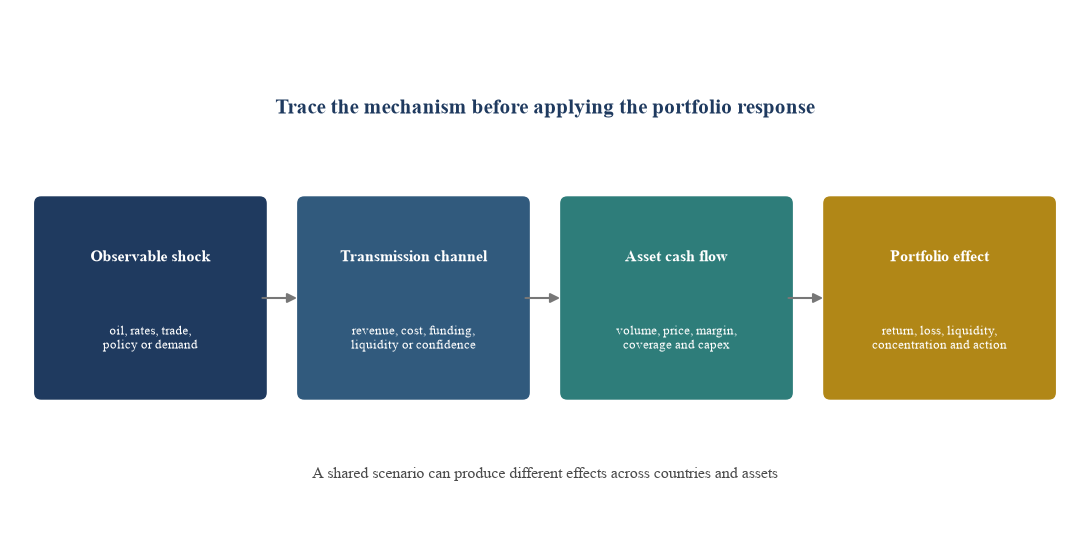
Author framework. Quantitative parameters require verified asset and portfolio data.
Table 6. Scenario library by return engine
| Scenario | First-order channel | Assets requiring focused review | Key evidence |
|---|---|---|---|
| Oil revenue decline | Fiscal, external and confidence transmission | Sovereigns, banks, public contractors and domestic demand | Revenue, buffers, budget execution and payment cycle |
| US rate increase | Funding cost, discount rate and credit quality | Banks, property, private credit and long-duration infrastructure | Repricing, deposits, coverage, maturity and valuation |
| Public-capex reprioritisation | Awards, backlog and receivables | Contractors, suppliers, logistics and project assets | Contract status, customer mix and working capital |
| Trade-corridor disruption | Volume, route, insurance and inventory | Ports, shipping, logistics, re-export and tourism | Routes, substitute capacity, customers and insurance |
| Technology-demand correction | Utilisation, tenant demand and equipment commitments | Data centres, fibre, cloud and technology growth assets | Contracts, capacity, customer concentration and capex |
| Household-demand slowdown | Volume, price and credit quality | Retail, hospitality, residential and consumer lenders | Spending, arrivals, occupancy, arrears and retention |
Scenarios describe analytical pathways. Magnitudes should be approved using current portfolio data.
11. Mandate and governance implications
Investment mandates should specify both established classifications and risk-driver reporting. Country and regional limits remain binding. A return-engine budget adds a cross-cutting control. The mandate can require managers to report the primary driver, secondary sensitivities, revenue geography, funding basis and material changes at agreed intervals.
Benchmark selection should match the decision. A public GCC equity index remains relevant for listed-manager performance. It may be an incomplete policy reference for a total Gulf portfolio containing private credit, infrastructure and direct assets. The committee can use a benchmark set and a separate risk-driver dashboard rather than force every exposure into one composite series.
Manager selection also benefits. A manager can be asked to explain whether its claimed diversification comes from countries, sectors, business models, funding structures or customer geographies. Attribution can separate security selection from structural exposure to banks, public demand, commodity cash flow or global services.
Governance should prevent the second layer from becoming an opaque model. Definitions, evidence requirements and classification changes should be documented. Aggregation should show both primary drivers and secondary concentrations. Assumptions should be versioned. Risk should challenge classifications, and the investment committee should approve material limits and scenarios.
12. Limitations and research agenda
The proposed taxonomy is an analytical framework. It does not estimate expected returns, factor premia or causal relationships for a representative Gulf asset universe. The hypothetical portfolio and its weights were created to demonstrate classification and do not describe a client or market portfolio.
Primary-driver assignment requires judgement. Complex businesses can have several material cash-flow engines, and those engines can change. Look-through data may be limited for funds and private assets. Public-company segment reporting may not fully capture customer, funding or policy dependence. The framework should record missing evidence and avoid precision unsupported by the source data.
Historical correlations can change across regimes. Oil prices, fiscal policy, US rates, geopolitical conditions, technology demand and regulation can interact. Appraisal-based private-market returns can understate contemporaneous volatility. Scenarios therefore complement historical measurement.
Future research should assemble a position-level dataset across listed and private Gulf assets; test whether the proposed drivers explain cash-flow and return variation; measure overlap between country, sector and driver classifications; and examine the stability of assignments across time. Research should also compare market-value, revenue, debt and risk-contribution weights for institutional portfolios.
13. Conclusion
Country and regional classifications provide the legal, operational and benchmark foundation of Gulf investing. Institutional decisions need an additional view of how cash flow is generated and how loss is transmitted. The proposed framework records both.
The second layer classifies exposure across public-balance-sheet demand, domestic credit and rates, traded-energy cash flow, household and visitor demand, infrastructure and digital capacity, and trade corridors and services. Revenue geography, funding regime, policy dependence, liquidity form and loss transmission add the detail required for monitoring and scenarios.
The framework reveals concentration that can sit across countries and asset classes. It supports clearer mandate design, manager questions, portfolio limits and scenario analysis. Its value depends on transparent definitions, verified look-through data and governed classification changes. Used with established country and benchmark controls, it can help an investment committee describe the Gulf allocation it actually owns.
References
- MSCI, MSCI GCC Countries Combined Index Factsheet, 29 May 2026. https://www.msci.com/documents/10199/0561060f-a006-81c5-1631-5cf2da853f21
- World Bank, GCC: Growth on the Rise, but Smart Spending Will Shape a Thriving Future, 19 June 2025. https://www.worldbank.org/en/news/press-release/2025/06/19/gcc-growth-on-the-rise-but-smart-spending-will-shape-a-thriving-future
- International Monetary Fund, Regional Economic Outlook: Middle East and Central Asia, May 2025. https://www.imf.org/-/media/files/publications/reo/mcd-cca/2025/may/english/text.pdf
- Geert Bekaert, Robert J. Hodrick and Xiaoyan Zhang, International Stock Return Comovements, Journal of Finance 64, 2009; NBER Working Paper 11906. https://www.nber.org/papers/w11906
- Jeffrey J. Diermeier and Bruno Solnik, Firm-Level Evidence on International Stock Market Comovement, Review of Finance 10, 2006. https://academic.oup.com/rof/article-abstract/10/1/69/1573508
- International Monetary Fund, GCC: Enhancing Resilience to Global Shocks, Policy Paper 2025/043, December 2025. https://www.imf.org/en/publications/policy-papers/issues/2025/12/05/gulf-cooperation-council-gcc-enhancing-resilience-to-global-shocks-economic-prospects-and-572372
- Yevgeniya Korniyenko and Weining Xin, GCC Diversification: The Role of Foreign Investments and Sovereign Wealth Funds, IMF Working Paper 2025/174. https://www.imf.org/en/publications/wp/issues/2025/09/05/gulf-cooperation-council-diversification-the-role-of-foreign-investments-and-sovereign-569546
- MSCI, Exploring the Futures of GCC Equity Markets, 2025. https://www.msci.com/research-and-insights/blog-post/exploring-the-futures-of-gcc-equity-markets
- MSCI, MSCI GCC Bond Index, data as of 30 June 2026. https://www.msci.com/indexes/index/765229/msci-gcc-bond-index
- International Monetary Fund, The Managing Director's Remarks at GCC Ministerial Meeting, 2 October 2025. https://www.imf.org/en/news/articles/2025/10/02/sp100225-md-opening-remarks-gcc-ministerial-meeting
- International Monetary Fund, A New GCC Fiscal Era: A Look at the Macro and Firm-Level Impact of Tax Reforms, Working Paper 2025/074. https://www.imf.org/en/publications/wp/issues/2025/04/11/a-new-gcc-fiscal-era-a-look-at-the-macro-and-firm-level-impact-of-tax-reforms-565843
- Bank for International Settlements, Global and regional financial integration: progress in emerging markets, BIS Quarterly Review, September 2007. https://www.bis.org/publ/qtrpdf/r_qt0709g.pdf
About the Author
Chennakeshav Adya, Independent Researcher
Chennakeshav Adya writes on private capital, investment governance, corporate finance and transaction execution. This paper is independent research for general information. It is not investment, legal, tax, accounting, valuation or regulatory advice.
Appendix A. Classification Checklist: Questions for every position
1. What is the established country, asset-class, sector and benchmark classification? 2. Which cash-flow source justifies the primary return engine? 3. Which secondary drivers can create a material gain or loss? 4. Where are customers, offtakers, assets and obligors located? 5. Which currencies determine revenue, cost, debt and valuation? 6. Is funding fixed or floating, secured or unsecured, local or cross-border? 7. Which contract, licence, tariff, concession, subsidy or procurement link matters? 8. How can the position be traded, redeemed, transferred or exited? 9. Which event transmits a macro shock into cash-flow impairment? 10. Which evidence is missing, stale, estimated or manager-reported? 11. Which scenario and leading indicators belong in monitoring? 12. Who approves and reviews the classification?
Appendix B. Minimum Portfolio Outputs: Governance dashboard
- Market value by country, asset class and benchmark.
- Market value by primary return engine and secondary driver.
- Revenue and customer geography where available.
- Fixed and floating funding, currency, maturity and refinancing schedule.
- Public-sector, regulated-offtake and concession dependence.
- Liquidity form, redemption terms, exit rights and unfunded commitments.
- Loss-transmission map and scenario results.
- Position-level evidence quality and look-through coverage.
- Classification changes, exceptions and unresolved disagreements.
- Concentration limits, breaches, actions and accountable owners.
