

1. Introduction
Climate transition can affect an asset through demand, regulation, technology, financing, insurance, operating cost, physical conditions and buyer expectations. These channels can alter revenue durability, required capital expenditure, margins, debt capacity and terminal value. They belong in investment underwriting whenever they could change the probability or magnitude of cash flows.
The Gulf requires an asset-specific approach. A solar project, gas-processing facility, aluminium smelter, logistics platform, district-cooling network, data centre and water utility can all appear in a climate allocation. Their transition mechanisms, emissions profiles, counterparties, technology risks and physical exposures differ. A common label does not make the assets economically comparable.
National pathways also differ. The United Arab Emirates' NDC 3.0 sets an economy-wide target to reduce greenhouse-gas emissions by 47 per cent from the 2019 baseline by 2035 and connects that target to net zero by 2050.[1] Saudi Arabia submitted its second NDC on 31 December 2025.[2] Qatar and Bahrain submitted NDC 3.0 documents in November and December 2025 respectively.[3][4] These documents establish current policy context. The investor still needs evidence about the particular asset, its owner, its market and its funded execution plan.
The central question is practical: what must change in the asset, who controls the change, what capital is required, how will progress be measured and how do the outcomes enter the financial model? This paper answers that question through a seven-gate institutional process.
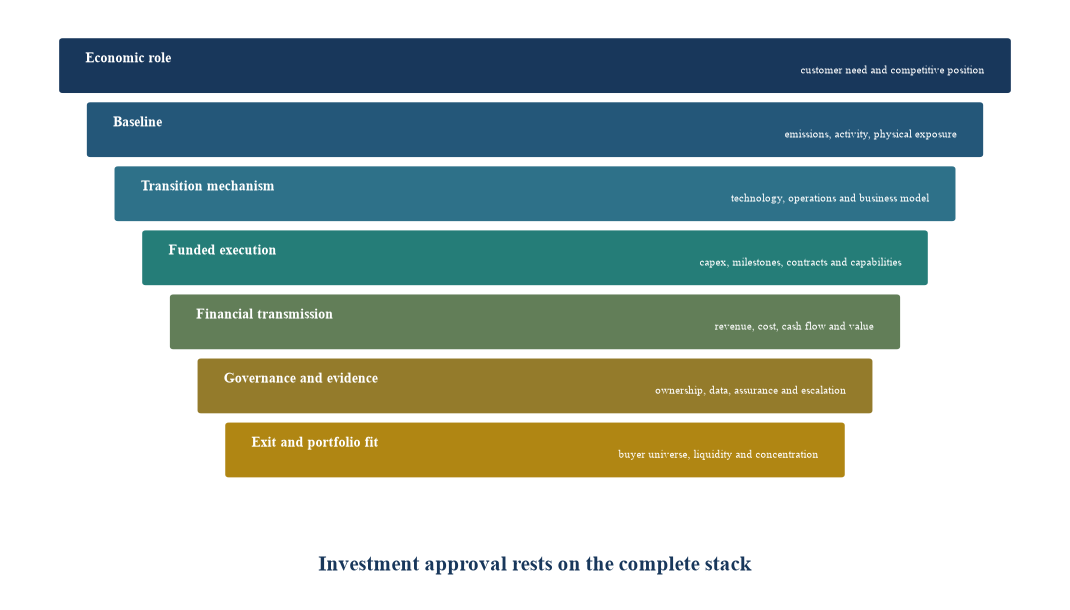
Author framework. A label may initiate screening; every layer requires asset-level evidence before investment approval.
2. Use national pathways as context, not as asset proof
National climate commitments help the investor identify direction, relevant sectors, expected policy development and possible infrastructure requirements. They can also reveal different baselines, target years, coverage and implementation approaches. Direct numerical comparisons can mislead when those definitions differ.
The UAE NDC 3.0 uses a 2019 base year and an absolute economy-wide 2035 target.[1] Saudi Arabia's second NDC, Qatar NDC 3.0 and Bahrain NDC 3.0 are active UNFCCC submissions.[2][3][4] IRENA's regional market analysis reported that renewable power represented about 3 per cent of GCC generation capacity in 2022 and that installed renewable capacity had increased to more than 5.6 gigawatts by that year.[5] Those dated figures describe a regional starting point. They do not measure the current capacity, emissions or economics of an individual investment.
The official environment is also becoming more relevant to financial institutions. The Central Bank of the UAE's climate-related financial-risk regulation requires regulated institutions to govern assets and liabilities carrying green, sustainable or equivalent labels and to assess portfolio exposures by geography, sector and other risk-relevant criteria.[6] The UAE Sustainable Finance Working Group has also issued principles for climate transition planning.[7] These measures reinforce a core investment discipline: climate factors should enter governance, risk management and capital allocation through evidence.
Table 1. Country and market evidence for asset underwriting
| Evidence layer | What the official source can establish | What the investor must still prove |
|---|---|---|
| National commitment | target architecture, coverage, policy direction and priority sectors | asset boundary, owner obligations, implementation pathway and commercial effect |
| Sector policy | renewable, efficiency, industrial, transport, methane, water or adaptation direction | applicable permits, incentives, standards, timetables and enforcement |
| Financial regulation | governance, disclosure, risk-management and transition-planning expectations | entity perimeter, portfolio exposure, control ownership and decision record |
| Market infrastructure | power procurement, grid, carbon-market, financing or certification arrangements | contract terms, access, settlement, verification and price exposure |
| Corporate disclosure | stated baseline, targets, capex, milestones and governance | consistency, assurance, asset allocation, financing and operating delivery |
| Asset evidence | measured performance, contracts, engineering condition and location risk | investment case, model integration, covenants, monitoring and exit |
The table identifies evidence categories. Investment teams should verify the latest official documents and asset-specific applicability at the decision date.
3. Define the transition thesis before analysing the label
An investment thesis should state how the asset's economic position changes. A transition thesis can arise from lower operating cost, protected market access, improved resource efficiency, reduced loss, stronger customer demand, resilience against physical disruption, access to capital or an option on new products. A broad intention to decarbonise is not yet an investment thesis.
The thesis needs a starting point, mechanism, destination and time horizon. The starting point identifies current operations, emissions, technology, contracts and physical exposure. The mechanism identifies the change, such as electrification, efficiency, renewable procurement, methane abatement, fuel switching, carbon capture, product redesign, recycling, water reuse, cooling optimisation or relocation. The destination specifies measurable operating and financial outcomes. The time horizon connects milestones to the holding period and debt maturity.
The investor should classify the asset's transition archetype. A mature low-emissions asset may already possess evidence and stable economics. An enabling asset supplies equipment or infrastructure needed by other sectors. A transforming asset begins with higher emissions and follows a credible funded pathway. A resilience asset protects cash flows against physical hazards. A speculative option depends on unproven technology, uncertain policy or a future market. Each archetype can be investable at the right price and risk budget. Each requires different evidence.
Table 2. Transition archetypes and underwriting focus
| Archetype | Economic mechanism | Principal evidence | Primary downside |
|---|---|---|---|
| Mature low-emissions asset | durable cost or demand advantage from established operations | measured output, contracts, operating history, resource and grid data | pricing compression, curtailment, contract or refinancing risk |
| Enabling infrastructure | earns from grid, storage, efficiency, cooling, water or control-system demand | utilisation, interconnection, customer pipeline and tariff or contract structure | timing mismatch, utilisation shortfall and technology substitution |
| Transforming incumbent | preserves or improves competitiveness through operational change | baseline, engineering plan, funded capex, milestones and product-market evidence | execution delay, lock-in, cost overrun and customer rejection |
| Resilience investment | avoids loss or protects uptime under physical stress | hazard mapping, engineering standard, avoided-downtime logic and insurance | hazard mismeasurement, correlated events and weak maintenance |
| Transition-finance instrument | funds a defined issuer or asset pathway | issuer strategy, use of proceeds or KPI design, reporting and verification | weak additionality, target reset, label controversy and refinancing |
| Technology option | creates upside from early commercial deployment | technical validation, pilot evidence, sponsor capacity and staged funding | failure to scale, cost disadvantage and limited exit market |
Classification is an investment tool. It does not confer a regulatory, environmental or financing label.
4. Establish a decision-grade baseline
The baseline should reconcile the physical asset, financial model and emissions inventory. Boundaries matter. An investor must know which facilities, activities, joint ventures and value-chain stages are included. It should distinguish equity share from operational control and understand whether changes in asset ownership can create apparent emissions reductions without operational improvement.
Absolute emissions, emissions intensity and avoided emissions serve different purposes. Absolute emissions measure the total inventory within a defined boundary. Intensity divides emissions by output, revenue or another activity measure. Avoided emissions compare an outcome with a counterfactual. A growing asset can reduce intensity while absolute emissions rise. A shrinking asset can reduce absolute emissions while operational quality deteriorates. Avoided-emissions estimates can change materially with the counterfactual.
The data room should show methodology, factors, metering, estimation, restatement policy and assurance. Scope 1, Scope 2 and material Scope 3 categories should be separated where relevant. For an oil or gas asset, methane and flaring deserve explicit attention. The IEA estimated that fossil-fuel operations in the Middle East and North Africa emitted about 20 million tonnes of methane in 2024, with wide performance differences across producers.[8] That regional estimate is a diligence prompt. Asset approval requires measured or defensibly estimated asset data.
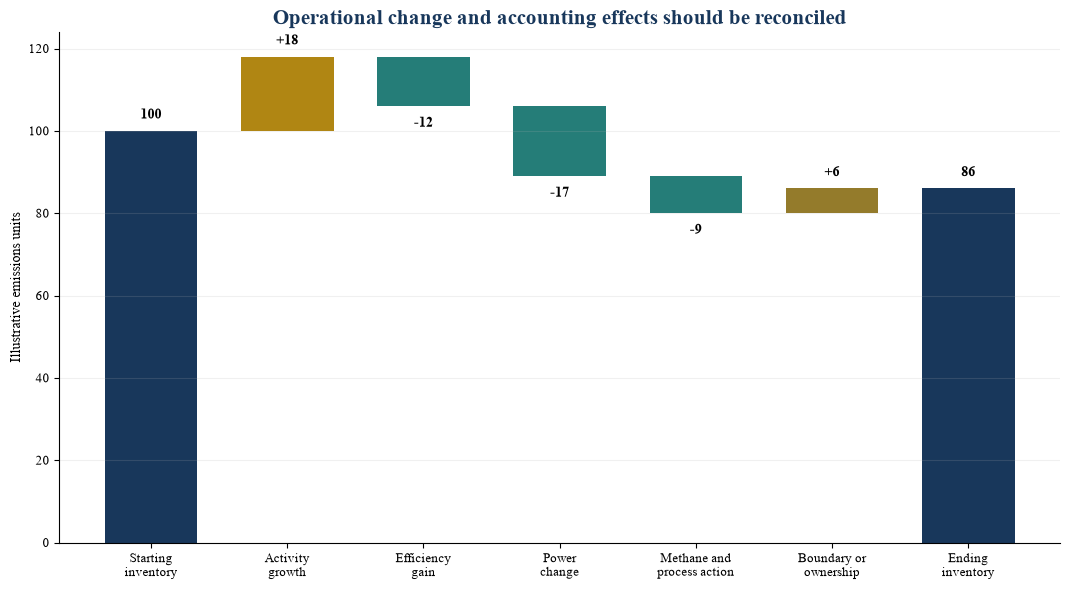
Author framework. Management assumptions illustrate why absolute emissions, intensity and ownership effects require separate analysis.
5. Convert ambition into operating evidence
A target becomes investable when it is connected to accountable actions. The operating schedule should identify the equipment, process, site, supplier, contract, permit, data source, milestone owner and decision date. The investor should distinguish actions already completed, contracted, approved, budgeted, piloted and merely described.
Key performance indicators should remain close to the operating mechanism. A power asset may track heat rate, availability, curtailment, fuel mix and grid constraints. A building may track energy use per square metre, cooling load and occupancy. A logistics platform may track fuel per tonne-kilometre and fleet utilisation. An industrial asset may track process yield, energy per tonne, recycled input and product specification. A hydrocarbon asset may track methane intensity, flared volume, energy use and leak-repair cycle time.
The diligence team should test rebound effects and bottlenecks. Efficiency can lower unit cost and stimulate higher throughput. Renewable capacity can face grid congestion or curtailment. Electrification can shift emissions to the power supply. Carbon capture depends on capture rate, energy penalty, transport, storage, monitoring and liability. Hydrogen economics depend on power, utilisation, electrolyser performance, water, storage, transport, certification and offtake. The investment case should model the complete chain.
Table 3. Operating diligence schedule
| Workstream | Evidence request | Acceptance question | Monitoring output |
|---|---|---|---|
| Asset condition | engineering report, maintenance record and performance history | can existing equipment deliver the stated pathway? | availability, loss and maintenance dashboard |
| Energy and process | metered consumption, production data and process flow | are baseline and improvement levers measurable? | intensity, yield and variance bridge |
| Emissions | inventory boundary, factors, meter map and assurance | can reported performance be reconciled to operations? | absolute and intensity ledger |
| Capex | design, budget, procurement, contingency and commissioning plan | is the programme funded and executable? | committed spend and milestone curve |
| Contracts | power, feedstock, offtake, technology, EPC and service agreements | are price, volume, performance and liability allocated? | dependency and covenant register |
| People and controls | governance chart, incentives, expertise and escalation | who owns delivery and data quality? | responsibility matrix and exception log |
Evidence status should be supported by dated documents, responsible owners and inspection where material.
6. Underwrite technology and capital execution
Technology risk is not captured by a single maturity label. A component can be commercially established while its local integration, supply chain, maintenance capability or feedstock remains uncertain. The investor should assess technical readiness, system integration, local operating conditions, supplier strength, warranty, performance security, spare parts, cyber controls, commissioning and end-of-life obligations.
Capital planning should separate maintenance, compliance, efficiency, growth and transformation expenditure. It should show committed and uncommitted amounts, inflation, foreign-exchange exposure, contingency, schedule, shutdown requirements and funding source. The model should reflect when each expenditure begins to affect output, cost, emissions and revenue.
A transforming asset needs a milestone-linked funding plan. Early capital can fund design, permitting and pilot work. Later capital can depend on performance, offtake, financing, interconnection or regulatory gates. Staging limits exposure to a failing pathway while preserving upside from successful delivery.
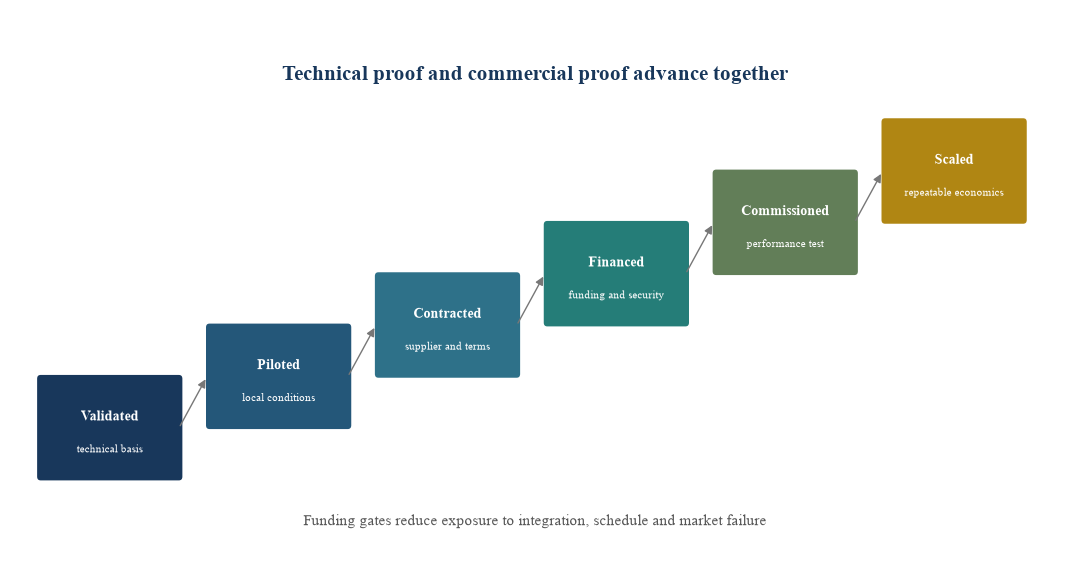
Author framework. Capital exposure increases only when technical and commercial evidence advances together.
7. Test every external dependency
Many transition assets depend on systems outside the investee's control. Power projects need grid connection, dispatch and payment. Electrified industrial assets need reliable low-emissions electricity. Hydrogen needs power, water, certification, transport and offtake. Carbon capture needs transport, storage and long-term responsibility. Efficiency assets need customer access, installation rights and measurement. Resilience assets need planning approvals, maintenance and insurance recognition.
The dependency register should identify the counterparty, contractual status, capacity, timing, pricing, termination rights, performance security and substitution options. A memorandum of understanding carries less weight than a bankable contract. A policy announcement is different from an implemented rule. A subsidy or tariff can support returns while creating political and renewal risk.
Offtake deserves independent diligence. The investor should test customer credit, volume flexibility, pricing formula, indexation, curtailment, take-or-pay terms, product specification, certification, delivery point and termination. A green premium should be supported by contract, observed transactions or defensible customer economics. A modelled premium without a buyer should be treated as an option.
Table 4. Dependency register for transition assets
| Dependency | Required evidence | Model link | Downside control |
|---|---|---|---|
| Grid or utility | connection agreement, capacity, dispatch and tariff | volume, timing, curtailment and cost | delay case, capacity cap and alternative supply |
| Technology supplier | performance guarantee, warranty, balance sheet and references | capex, output, maintenance and degradation | security, liquidated damages and replacement rights |
| EPC and commissioning | fixed scope, schedule, acceptance tests and contingency | construction draw, start date and ramp-up | completion support, reserves and step-in |
| Feedstock and resources | quality, availability, transport and price formula | utilisation, yield and unit cost | diversified supply, inventory and price pass-through |
| Customer and offtake | credit, volume, price, specification and tenor | revenue, working capital and terminal value | take-or-pay, security and replacement market |
| Policy or certification | enacted rule, methodology, verifier and renewal | eligibility, premium, compliance and financing | no-support case and covenant headroom |
Each dependency should carry an owner, evidence date, downside case and mitigation.
8. Translate climate channels into the financial model
Climate analysis becomes investment analysis when each material channel enters revenue, cost, capex, working capital, financing and terminal value. The model should avoid a single ESG adjustment. Separate variables improve accountability and scenario design.
Revenue can change through demand, product qualification, green premium, market access, availability and contract renewal. Operating cost can change through energy, water, carbon, maintenance, insurance and process yield. Capital expenditure can include replacement, retrofit, grid, cooling, water, abatement and resilience. Financing can change through debt capacity, margin, tenor, covenant, reserve and eligible lender universe. Terminal value can change through useful life, buyer universe, regulatory compatibility and decommissioning.
The model should show which effects are contracted, probable, conditional and optional. Management cases should not silently combine optimistic volume, premium, technology and financing assumptions. Correlations matter. A delayed project can cause cost overrun, lost revenue, covenant pressure and refinancing risk at the same time.
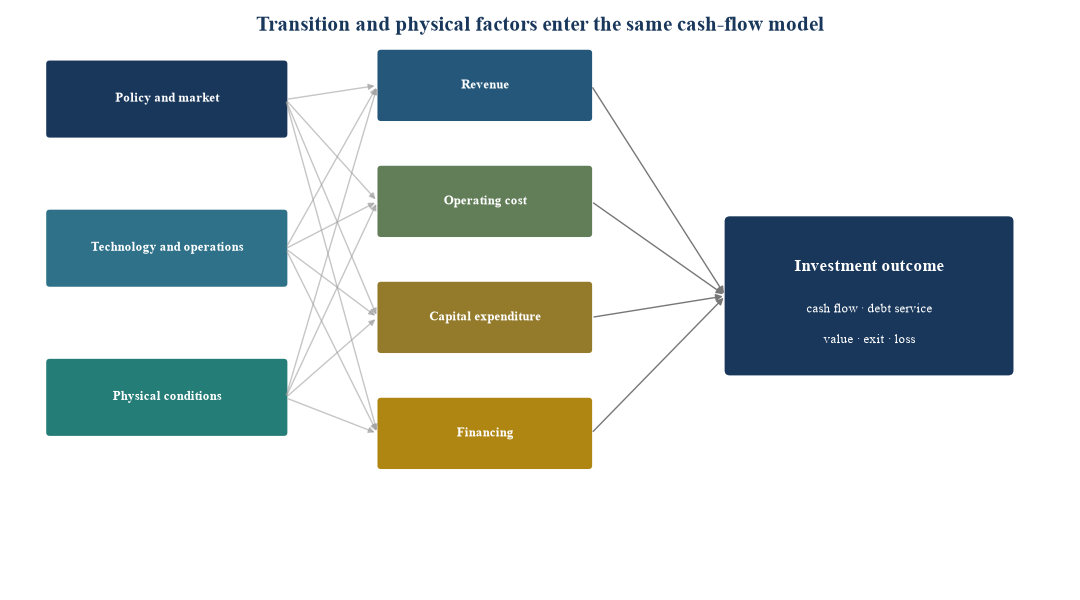
Author framework. Each arrow should correspond to a model variable, evidence source and accountable owner.
9. Underwrite physical risk and adaptation
Transition analysis should include physical resilience. Gulf assets can face chronic heat, water scarcity, sea-level exposure, storm surge, flash flooding, dust, humidity and worker-safety constraints. The materiality depends on location, design, technology, supply chain, insurance and operating practice.
Hazard is only the first component. Exposure identifies the asset, people, suppliers and customers in the affected area. Vulnerability identifies how design and operations respond. Financial impact measures outage, repair, lost output, higher cooling or water cost, insurance, safety, working capital and capital replacement. Adaptation identifies engineering, redundancy, relocation, operating protocols and emergency response.
The CBUAE has reported using transition scenarios for corporate lending and physical-risk analysis for real-estate exposures to rainfall flooding and storm surge.[9] The NGFS scenarios provide a structured range of transition and physical-risk futures, including orderly, delayed, current-policy and fragmented pathways.[10] These are scenario inputs rather than predictions. An asset model should use locally relevant hazards and engineering evidence.
Table 5. Physical-risk assessment for Gulf assets
| Hazard | Exposure questions | Financial channels | Adaptation evidence |
|---|---|---|---|
| Extreme heat | equipment rating, worker exposure, cooling and peak demand | derating, downtime, energy cost, labour limits and maintenance | design temperature, redundancy, shade, cooling and operating protocol |
| Water scarcity | source, allocation, quality, competing demand and treatment | input cost, production limit, capex and licence | reuse, efficiency, alternative source, storage and contingency |
| Flood and storm | elevation, drainage, critical equipment and access route | damage, interruption, inventory loss and insurance | drainage, barriers, elevation, response and recovery test |
| Sea-level and coastal exposure | site life, surge, corrosion and access | protection capex, impairment, downtime and terminal value | coastal model, design standard, maintenance and relocation option |
| Dust and air quality | filtration, solar soiling, machinery and workforce | output loss, cleaning, health cost and replacement | filtration, cleaning schedule, monitoring and spares |
| Supply-chain disruption | critical input origin, route and inventory | delay, price, working capital and lost output | dual sourcing, stock, route diversity and supplier plans |
Hazard screening should be followed by site-specific engineering and insurance evidence when material.
10. Separate financing claims from asset economics
Green, sustainability, sustainability-linked and climate-transition instruments can support funding. The instrument label does not replace credit or asset analysis. The investor should understand whether proceeds are allocated to eligible projects, whether performance targets apply to the issuer, how baselines and methodologies work, who verifies results, what happens after acquisition or disposal and whether any pricing adjustment is material.
ICMA's Climate Transition Finance Handbook provides entity-level guidance for issuers using sustainable instruments, while the Climate Transition Bond Guidelines published in 2025 add issuance-level guidance for transition projects, including high-emitting sectors.[11] IFRS S2 requires material disclosure about climate-related risks and opportunities and calls for climate-resilience assessment informed by scenario analysis. IFRS S2 does not require an entity to possess a transition plan; it requires relevant disclosure when a transition strategy exists and affects the entity's prospects.[12]
The financing file should reconcile issuer strategy, funded projects, instrument terms and asset delivery. Use-of-proceeds eligibility should connect to actual capital expenditure. Sustainability-linked targets should be material, measurable, time-bound and difficult enough to influence behaviour. External review supports credibility while the investor remains responsible for underwriting.
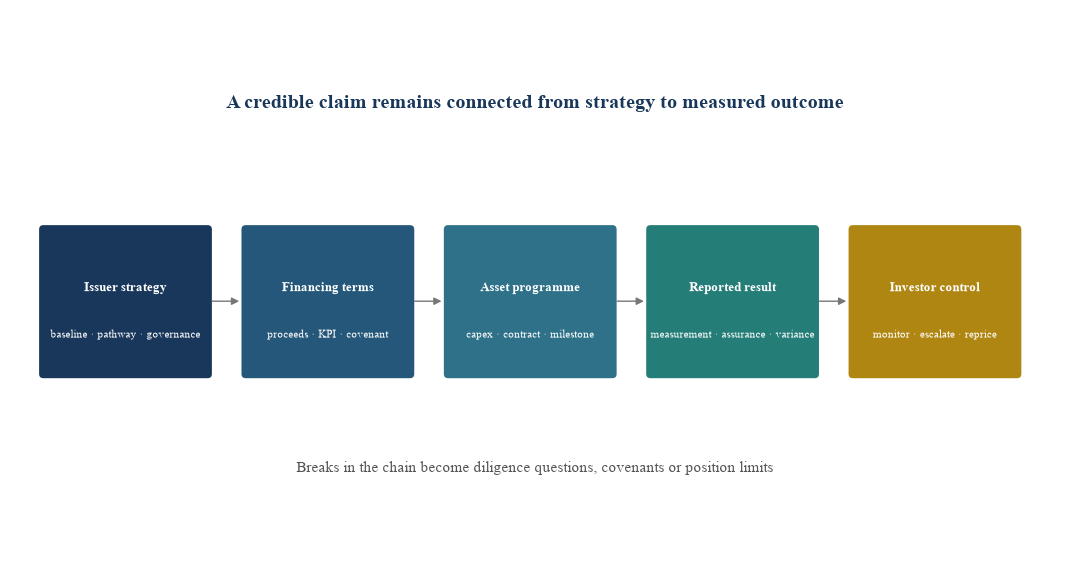
Author framework. Credibility depends on alignment from issuer strategy to asset evidence and investor monitoring.
11. Build governance around decisions and data
Governance should establish who approves the thesis, validates data, controls capex, manages exceptions and reports progress. The board or investment committee needs information that connects transition performance to investment performance. A sustainability function can provide expertise. Accountability for revenue, cost, capex, risk and data should remain with the relevant operating and financial owners.
The data architecture should identify metric owner, calculation method, source system, frequency, control, restatement and assurance. Estimates should be identified as estimates. Acquired assets should use a clear consolidation date. Divestments should not create an unexplained improvement. Renewable certificates, offsets and other market instruments should be reported separately from operational reductions when material.
IFRS S2's emphasis on governance, strategy, risk management, metrics, targets and scenario-informed resilience offers a useful disclosure baseline.[12] The investment file can use the same architecture internally even when the investee is outside a mandatory reporting perimeter. Consistent fields improve comparison and escalation.
Table 6. Investment governance and data pack
| Record | Minimum content | Owner | Escalation trigger |
|---|---|---|---|
| Transition thesis | baseline, mechanism, destination, milestones and model links | deal lead and operating sponsor | mechanism or timetable changes materially |
| Metric dictionary | boundary, unit, method, source, frequency and restatement | finance, operations and sustainability | missing data, method change or failed reconciliation |
| Capex register | budget, commitment, spend, contingency, schedule and funding | CFO and project director | cost or schedule outside approved tolerance |
| Dependency register | counterparty, contract, capacity, price, timing and alternative | commercial and legal leads | contract delay, credit change or capacity shortfall |
| Scenario file | assumptions, correlations, outputs and management actions | risk and investment team | downside breaches return, liquidity or covenant floor |
| Committee dashboard | operating, emissions, cash-flow, covenant and valuation variance | investment owner | milestone failure, data concern or thesis impairment |
The pack supports approval and monitoring. It should remain proportionate to materiality and investment size.
12. Construct the portfolio by transition mechanism and risk
Portfolio diversification should look through labels to common drivers. Two differently labelled assets can share the same exposure to grid connection, policy support, technology supplier, construction market, power price or offtaker. A portfolio concentrated in solar, battery and electrification assets may still carry common grid and procurement risk. A collection of transforming industrial assets may share carbon-price, offtake and execution risk.
The allocator can group exposures by transition mechanism, technology maturity, revenue model, policy dependency, construction status, physical hazard, counterparty, country and exit route. Position limits should reflect evidence quality, downside correlation and liquidity. The risk budget can distinguish operating assets, construction assets, transforming incumbents and technology options.
Expected return should compensate for the full risk set. A labelled asset with contracted cash flow and mature technology may justify a lower required return. A transforming asset with strong strategic value can still require a higher return, staged capital and covenants. A speculative option should use a position size that the portfolio can lose without undermining its mandate.
13. Apply the framework to a hypothetical 100-unit portfolio
The illustrative portfolio contains five positions. Renewable generation receives 28 units, grid and storage infrastructure 22 units, industrial-efficiency assets 20 units, a transforming export-oriented industrial asset 20 units and an early commercial low-carbon technology platform 10 units. These weights are management assumptions for demonstration.
The initial label-led view assigns positive transition relevance to all five assets. The evidence-led review changes the conclusion. The renewable asset has operating history and contracted revenue but material curtailment exposure. The grid asset has strategic demand and regulated returns but construction timing risk. The efficiency platform has rapid payback and diversified customers but weak measurement controls. The transforming industrial asset has a material funded programme and credible customers but high execution and power-supply dependency. The technology platform has technical validation but limited commercial evidence.
The committee retains all five opportunities while adjusting conditions. It caps the technology position at 5 units until a firm offtake and performance guarantee are executed. It transfers 3 units to the grid asset and 2 units to the efficiency platform. It requires milestone funding for the industrial transformation and a curtailment reserve for the renewable asset. These actions show how climate evidence changes capital allocation without relying on a binary green-versus-brown classification.
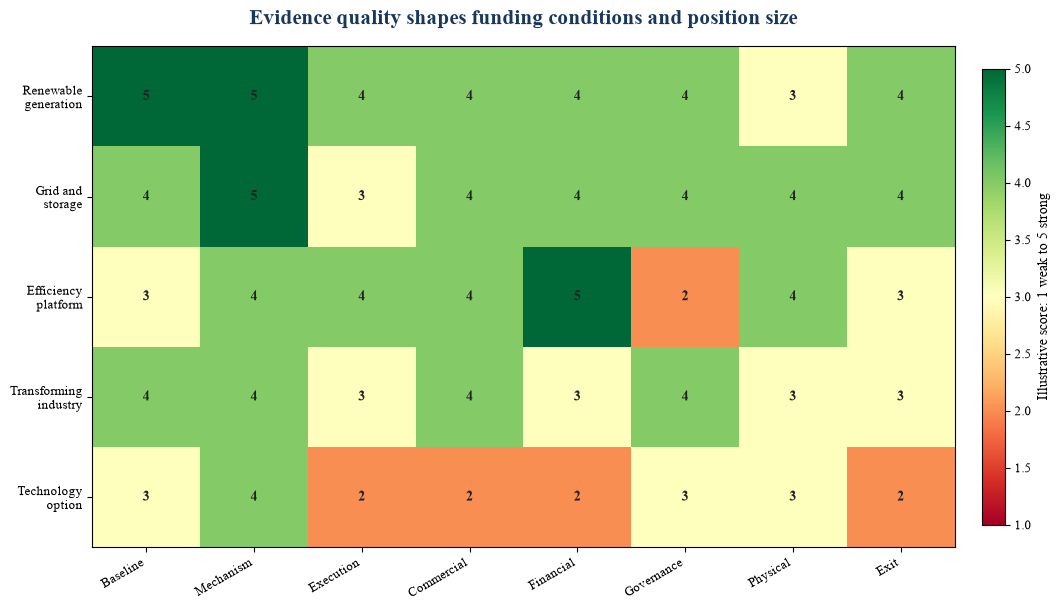
All scores and weights are management assumptions for method demonstration. They are not current asset or market estimates.
14. Run scenarios that preserve causal links
Scenario analysis should test coherent futures. A transition scenario can combine faster policy, technology adoption and customer preference changes. A delayed-transition scenario can combine slow early action with abrupt later adjustment. A current-policy scenario can create higher long-term physical risk. A fragmented scenario can combine divergent rules, trade barriers and supply-chain pressure. The NGFS provides structured scenarios for these purposes.[10]
The asset model should translate scenarios into a limited number of decision variables. Relevant variables may include power price, carbon cost, product demand, utilisation, efficiency, capex, financing margin, insurance, downtime and terminal multiple. The team should document the mapping rather than applying an unexplained value haircut.
Management actions belong in the scenario. The asset may defer expansion, accelerate retrofit, switch supplier, change product, renegotiate offtake, add redundancy or sell. Each response requires time, authority and capital. A scenario is more useful when it identifies the decision window before value is impaired.
The committee should also test combined failure. Technology delay, weak offtake, grid congestion and refinancing can occur together. Correlated downside is especially important for assets whose transition thesis depends on the same infrastructure or policy programme.
15. Write an investment-committee memorandum that can be challenged
The memorandum should state the economic thesis in one paragraph. It should then describe the baseline, transition mechanism, execution plan, dependencies, financial transmission, physical risk, evidence quality and exit. The main claims should connect to source documents, model cells and responsible owners.
The committee should see a short list of unresolved questions. Examples include an unfinalised grid agreement, unassured baseline, incomplete EPC terms, uncertain carbon methodology, uncontracted premium or missing flood design. Each issue should have an owner, deadline, downside treatment and approval consequence.
Approval conditions can include staged funding, minimum contract coverage, performance security, data assurance, capex reserve, reporting covenants, information rights, insurance, technical-adviser sign-off and an explicit stop-work or exit trigger. These conditions turn climate diligence into enforceable investment governance.
The memorandum should avoid claiming that a label proves impact, alignment or superior return. It should state what has been evidenced, what remains conditional and which outcomes depend on management estimates.
16. Execute a twelve-week allocation and diligence programme
Weeks one and two define the portfolio objective, materiality thresholds, eligible archetypes and committee authority. The team selects official pathways and recognised standards relevant to the mandate.
Weeks three and four build the country, sector and asset evidence map. The investor requests baseline data, engineering records, capex plans, contracts, physical-risk information and governance documents. It establishes the metric dictionary and identifies missing evidence.
Weeks five and six validate the transition mechanism. Technical, commercial, legal, environmental and financial specialists test technology, operations, dependencies, permits, offtake and measurement. Site inspection is used where material.
Weeks seven and eight rebuild the financial model. The team maps revenue, cost, capex, financing and terminal-value effects. It runs orderly, delayed, current-policy and asset-specific downside scenarios.
Weeks nine and ten structure the investment. Position size, staged funding, covenants, performance security, reporting, reserves and exit rights are negotiated. Financing claims are reconciled with asset economics and delivery.
Weeks eleven and twelve complete the committee pack, assurance plan and monitoring dashboard. The committee approves, rejects or defers the investment with explicit evidence conditions. The operating dashboard becomes part of post-investment management.
17. Recognise limitations
National commitments, sector pathways, scenarios and taxonomies continue to evolve. They can inform direction and comparison while remaining uncertain in timing and implementation. Asset-level results depend on technology, location, contracts, management capability, financing and market conditions.
Emissions inventories can contain estimates, method changes and incomplete value-chain data. Physical-risk models contain uncertainty in hazard, exposure and vulnerability. Avoided-emissions calculations depend on counterfactuals. Transition scenarios are decision tools rather than forecasts.
The framework does not provide legal, environmental, engineering, accounting, tax or investment advice. It does not determine whether an instrument qualifies under a particular taxonomy or regulation. Specialist review remains necessary.
The illustrative portfolio is hypothetical. Its units, scores, constraints and responses do not describe an existing Matchpoint Partners mandate, client portfolio or current market opportunity.
18. Conclusion
Climate transition can improve institutional underwriting when it is treated as a set of cash-flow mechanisms, execution dependencies and risk controls. The starting label may help organise a pipeline. The investment decision requires a reconciled baseline, credible mechanism, funded capital plan, operating milestones, commercial proof, financial transmission, physical resilience, governance and an exit thesis.
The Gulf offers diverse opportunities across power, industry, infrastructure, water, transport, technology and hydrocarbons. Diversity creates potential and requires disciplined differentiation. National pathways provide context. Asset evidence establishes investability.
A transition allocation becomes durable when the committee can explain why each asset should remain competitive, which facts support that view, what could break the thesis and which governance actions follow. That standard protects credibility and capital through changing policy, technology and physical conditions.
References
- [1] United Arab Emirates, Third Nationally Determined Contribution, submitted 6 November 2024. https://unfccc.int/sites/default/files/2024-11/UAE-NDC3.0.pdf
- [2] United Nations Framework Convention on Climate Change, Saudi Arabia Second NDC, submitted 31 December 2025. https://unfccc.int/documents/497888
- [3] United Nations Framework Convention on Climate Change, Qatar NDC 3.0, submitted 21 November 2025. https://unfccc.int/node/654987
- [4] United Nations Framework Convention on Climate Change, Bahrain NDC 3.0, submitted 1 December 2025. https://unfccc.int/node/655117
- [5] International Renewable Energy Agency, Renewable Energy Markets: GCC 2023, December 2023. https://www.irena.org/Publications/2023/Dec/Renewable-energy-market-analysis-GCC
- [6] Central Bank of the UAE, Climate-related Financial Risk Management Regulation, C 8/2025. https://rulebook.centralbank.ae/en/rulebook/climate-related-financial-risk-management-regulation
- [7] Central Bank of the UAE Rulebook, Principles for Climate Transition Planning. https://rulebook.centralbank.ae/en/rulebook/principles-climate-transition-planning
- [8] International Energy Agency, Global Methane Tracker 2025, Regional Insights: Middle East and North Africa. https://www.iea.org/reports/global-methane-tracker-2025/regional-insights
- [9] Central Bank of the UAE, Sustainable Finance and Climate Risk Scenario Analysis. https://www.centralbank.ae/en/our-operations/sustainable-finance/
- [10] Network for Greening the Financial System, Scenarios Portal, long-term climate scenarios. https://www.ngfs.net/ngfs-scenarios-portal/explore/
- [11] International Capital Market Association, Climate Transition Finance Handbook 2025 and Climate Transition Bond Guidelines 2025. https://www.icmagroup.org/sustainable-finance/the-principles-guidelines-and-handbooks/climate-transition-finance-handbook/
- [12] IFRS Foundation, IFRS S2 implementation guidance and disclosures about climate-related transition, 23 June 2025. https://www.ifrs.org/news-and-events/news/2025/06/ifrs-publishes-guidance-disclosures-transition-plans/
- [13] IFRS Foundation, Climate resilience and climate-related scenario analysis requirements in IFRS S2, 10 March 2026. https://www.ifrs.org/supporting-implementation/supporting-materials-for-ifrs-sustainability-disclosure-standards/ifrs-s2/webcast-climate-resilience-scenario-analysis/
- [14] International Capital Market Association, Climate Transition Finance Handbook, June 2023. https://www.icmagroup.org/assets/documents/Sustainable-finance/2023-updates/Climate-Transition-Finance-Handbook-CTFH-June-2023-220623v2.pdf
- [15] Abu Dhabi Global Market, Supplementary Guidance for the Sustainable Finance Regulatory Framework, July 2023. https://assets.adgm.com/download/assets/Sustainable%2BFinance%2BSupplementary%2BGuidance%2B20230704.pdf/b4c88a746c3f11efadef6ad8e5bcaa80
