
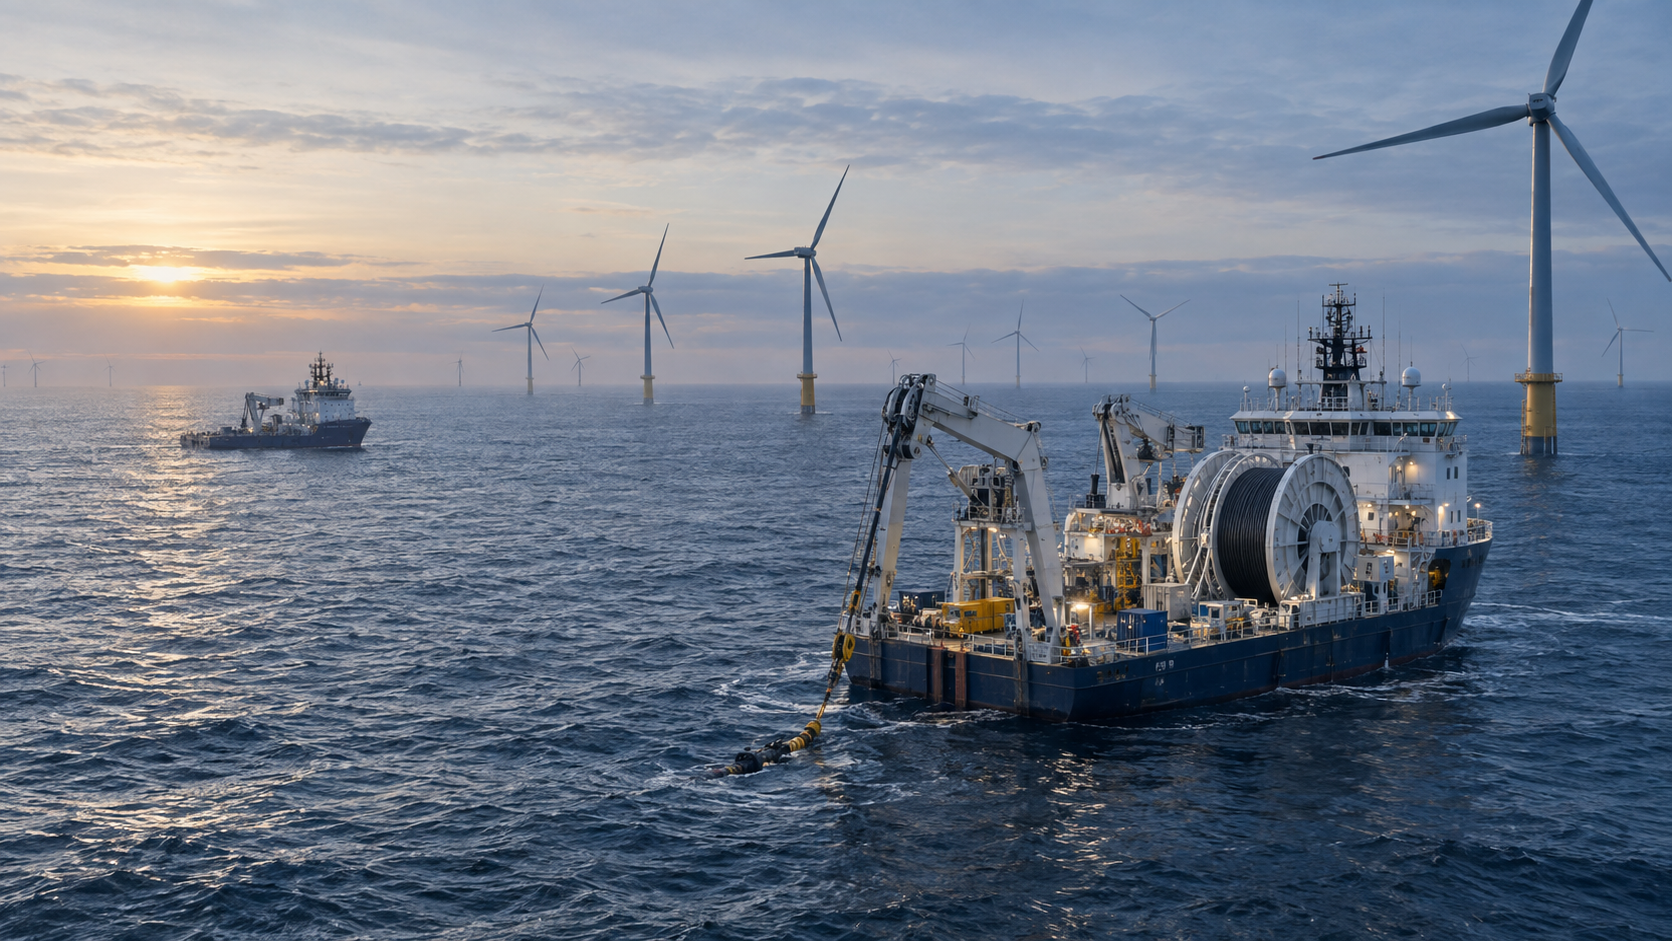
1 The investment question and the evidence boundary
A cable resilience assessment should begin with the electricity that remains deliverable after a defined failure. The investment committee can then examine the resources needed for restoration and the cash available during the interruption. This paper proposes three linked capacities: electrical transfer, executable repair and financial support. Each should be documented against the same contingency and operating period.
The US Department of Energy's May 2024 operations and maintenance roadmap describes export and inter-array redundancy as occasionally adopted, with industry-wide standard practice still developing. Its discussion draws on earlier literature and provides a research agenda. It supplies no contemporary global denominator for redundant installations. The roadmap also identifies cable downtime exceeding three months in some circumstances. Its emphasis on advanced diagnosis and automated repair identifies research needs, with commercial performance requiring separate evidence. [1]
The technical boundary should include cable lengths, joints, terminations, protection systems and the interfaces with substations. DNV's public description of the December 2025 edition of its subsea-cable standard expressly covers array and export systems, associated components and interfaces. The complete standard requires subscription access; this paper uses its published scope without attributing unseen technical clauses. [4]
The proposed board record should connect each contingency to residual transfer, isolation arrangements, restoration evidence, uninsured exposure and debt-service timing. This provides a consistent question for engineers, insurers and financiers.
2 What the available loss evidence measures
ORE Catapult's September 2018 analysis reports 43 known array and export cable failures in its UK offshore-wind database since 2007. The reported events include unplanned faults and planned pre-emptive repairs. For recorded UK failures during 2014-2017, it estimates cumulative lost generation at approximately 1.97 TWh. Its accompanying approximately GBP 227 million valuation applies an assumed GBP 115/MWh strike price. That amount represents a valuation of estimated generation loss under the study's stated price assumption. [2]
Allianz's September 2023 report discloses a different population: 126 claims across its German and Central/Eastern European offshore-wind portfolio during 2014-2020. Export cables contribute 29% of claims amount, inter-array cables 17% and onshore cables 7%. The sum of the three categories is 53%. The denominator concerns claims value across the selected insurer portfolio. [14]
An investment model requires further information before using either dataset for expected-loss estimates: installed exposure, observation years, cable kilometres, operating hours, commissioning cohorts, claim thresholds and event inclusion rules. A claims-value share alone provides no annual failure frequency. The paper therefore retains these datasets as evidence of material loss concentration and excludes a universal cable-failure probability.
Table 1. Quantitative evidence and its measurement boundary
| Evidence | Published figure | Population and period | Interpretation limit |
|---|---|---|---|
| Allianz claims amount | Export 29%; array 17%; onshore 7% | 126 portfolio claims; Germany and Central/Eastern Europe; 2014-2020 | 53% includes onshore; value share, with no project failure probability [14] |
| ORE Catapult reported events | 43 known failures | UK array/export database; since 2007; September 2018 report | Includes planned pre-emptive repairs; exposure denominator undisclosed [2] |
| ORE Catapult generation estimate | Approximately 1.97 TWh | Recorded UK failures; 2014-2017 | Estimated historical generation loss [2] |
| ORE Catapult monetary illustration | Approximately GBP 227 million | Above generation estimate at GBP 115/MWh | Source-assumed price; no current repair-cost benchmark [2] |
Observed published figures and source-estimated values retain their original population and period. No row provides a project forecast.
3 Topology and usable surviving capacity
The topology review should trace power from each turbine group to the onshore delivery point. For every cable section, it should identify the turbines disconnected, the switching needed to restore unaffected sections and the permissible loading of the surviving route. An alternate connection requires compatible protection, switchgear, controls and operating authority.
The Dutch January 2026 Development Framework provides a specific design example. Its 700 MW AC platforms have two 220 kV connections. Switching to another offshore transformer is intended to preserve at least half the transport capacity following failure of a cable or associated transformer. Its 2 GW DC concept uses two 525 kV cables with a metallic return in a bipolar arrangement, with cross-coupling of converter poles. These arrangements describe the Dutch framework's specified configurations. [10]
The proposed economic assessment should use approved contingency load-flow results, thermal constraints and restoration procedures. It should distinguish sustained capacity from a temporary operating rating and record the conditions attached to each. Wind and power-price scenarios should then determine the economic consequence of the constrained state.
A two-route diagram should receive a dependency review. The assessment should record shared landfalls, switchboards, control supplies, protection, offshore structures and route crossings. Capacity credited to an alternate route should also be checked against existing allocation to other connected generators.
Table 2. Topology questions for an engineering and investment review
| Arrangement | Contingency to examine | Capacity evidence | Remaining dependency |
|---|---|---|---|
| Radial array string | Fault between successive turbine groups | Isolation points and downstream generation | Shared string section and feeder |
| Reconfigurable array | Transfer through alternate feeder | Load flow, cable rating and approved switching | Protection coordination and receiving feeder |
| Multiple export circuits | One export circuit unavailable | Surviving transformer and circuit ratings | Landfall, substation and route corridor |
| Bipolar DC connection | Pole, return or converter component unavailable | Permitted operating modes and control studies | Shared auxiliaries, controls and offshore platform |
| Shared offshore hub | Loss of one connection with other generators operating | Contracted access and available transfer headroom | Allocation, dispatch and onshore constraints |
Analytical decision framework. Actual outcomes require project-specific electrical studies.

View figure at full size; scroll horizontally on smaller screens.
Authored hypothetical topology, with two original 500 MW circuits and one additional 500 MW circuit. A corridor event removes every shared-route circuit; the separate third route retains 500 MW only while its interfaces remain usable. Common buses remain exposed in both configurations. This is a decision schematic and supplies no electrical design approval.
4 Common-cause exposure and changing seabed conditions
Common-cause diligence should examine repeated designs and operating conditions across the asset population. The relevant population may consist of protection systems, joints, cable batches or installation campaigns. A confirmed defect at one location should trigger a scoped investigation of comparable components, with the extent of affected assets established through evidence.
In its April 2021 earnings call, Ørsted reported an array-cable failure discovered during a Race Bank inspection. Management attributed it to movement of the cable protection system over scour-protection rocks, causing abrasion. Its contemporaneous assessment identified potential exposure at up to ten wind farms, with varying extent and further engineering work underway. This was a management assessment of a possible population issue. The paper does not treat that count as a final verified failure total. [6]
Route exposure also changes through time. Carbon Trust's 2015 burial guidance describes seabed mobility, free spans, scour, fishing and anchoring threats, and recommends route segmentation and suitable survey evidence. It identifies repeated bathymetry as relevant to sediment-mobility assessment. [3]
The proposed review should connect these mechanisms to both circuits in a redundancy design. A shared exposure should be stated explicitly, with intervention options assessed against the actual hazard. Wider inspection, revised protection or additional spacing should receive project-specific engineering evaluation and cost evidence.
5 Integrity, qualification and acceptance evidence
Qualification should address the intended cable system and service environment. ORE Catapult's September 2022 dynamic-cable framework links the qualification basis, technology assessment and threat assessment to a staged plan, execution and performance assessment. It states that the sequence of mechanical and electrical tests matters and that the generic case-study plans remain indicative. Its discussion also identifies a limitation of single-failure-mode assessment: combinations of failures may require additional consideration. [5]
The proposed procurement specification should require an evidence trail from design assumptions through manufacture, installation and commissioning. Records should include material identity, accessory compatibility, mechanical limits, installation tensions and bending, jointing personnel, test results and deviations. Change control should identify whether a substitution affects the qualification basis or repair method.
For floating systems, the review should establish which motion, fatigue and interface conditions the qualification covers. A result from a previous application should be examined for comparable loading and configuration. The ORE framework explicitly makes requalification judgement dependent on the changes in application or components. [5]
Acceptance should also preserve operational usefulness. The owner should receive reproducible settings, as-laid locations, burial records and repair drawings in accessible formats. An independent technical review can examine whether the record set supports the operating assumptions and proposed restoration methods. This is a recommendation for evidence quality; the paper assigns no quantified failure reduction to certification or testing.
Table 3. Proposed cable-system acceptance evidence
| Stage | Evidence to retain | Question for acceptance |
|---|---|---|
| Design | Site conditions, load cases, interface register | Does the analysed system match the installation? |
| Qualification | Test scope, sequence, results and deviations | Are the intended application and accessories covered? |
| Manufacture | Traceability, routine tests and repair records | Can installed and spare components be identified? |
| Installation | Handling limits, monitored loads and jointing records | Were departures assessed and accepted? |
| Commissioning | Electrical tests, protection settings and as-built records | Is the approved operating configuration reproducible? |
| Operations | Condition trends, inspection results and intervention history | Does current condition support the assumptions? |
Analytical requirements for procurement and due diligence; technical acceptance criteria remain project-specific.
6 Restoration duration and its critical path
Repair duration should be built from tasks and dependencies. Detection, safe isolation, fault location, engineering, materials, consents, marine mobilisation, recovery, jointing, testing and protection all require an explicit place in the schedule. Parallel work should be identified, together with the evidence needed to release sequential activities.
Fingrid's July 2025 half-year report supplies a dated restoration example from an electricity interconnector. EstLink 2 had been unavailable since 25 December 2024 and returned to commercial operation on 20 June 2025. Approximately one kilometre of damaged subsea cable was replaced. Fingrid reported equal sharing of repair costs with Elering and continuing pursuit of compensation through court proceedings. The case concerns an interconnector and supplies no offshore-wind repair-time distribution or standalone repair-cost total. [16]
The proposed project schedule should retain a prepared case, a constrained case and a severe case. Differences should correspond to identifiable resources or events, such as spare readiness, vessel access, weather restrictions or additional damage found during recovery. Every case should state its start and finish definitions.
Management should update the critical path as evidence arrives. A new fault location, failed spare inspection or revised recovery method should change the forecast visibly. Reporting elapsed outage days beside the forecast remaining duration provides a useful distinction between observed time and the current management estimate.
Table 4. Proposed restoration critical-path record
| Work package | Release evidence | Potential concurrent activity | Completion evidence |
|---|---|---|---|
| Isolate and locate | Safe electrical state and diagnostic data | Notifications and resource enquiries | Confirmed fault location |
| Design repair | Cable records and site assessment | Spare inspection and consent review | Approved method and compatible joints |
| Mobilise | Resource allocation and port readiness | Material preparation and test planning | Complete vessel and specialist package |
| Recover and repair | Marine approvals and task weather limits | Preserved-material examination | Jointing, installation and inspection records |
| Test and restore | Approved test sequence and protection settings | Claims documentation | Authorised return and operating restrictions |
No durations or service commitments are assumed. Dependencies must be established for the actual repair.
7 Vessel, spare and specialist capacity
A repair-capacity review should identify the complete marine and specialist package. Vessel suitability should be checked against recovery loads, cable handling, jointing arrangements, water depth and burial method. Equipment, jointers, mobilisation port and cable transport should be assessed on the same availability basis.
NKT's February 2024 announcement documents a four-year turnkey-repair agreement with the Norwegian PRSI Pool, covering approximately 6,000 km of offshore power cables owned by member companies. It describes 23 pool members and a range of AC and DC technologies. The announcement describes the service arrangement and possible use of NKT's vessel or cable-handling system; it publishes no universal mobilisation deadline or individual member priority. [13]
Spares require compatibility, preservation, title and access evidence. Ofgem's December 2025 decision records consultation respondents' warning that some unavailable HVDC replacement components could take approximately three to six years to procure. That statement concerns respondent-reported component constraints. It supplies no general lead time for every cable or joint. [9]
The proposed readiness review should therefore obtain current written confirmation for the actual spare system and repair package. Pool rules should address simultaneous requests, drawdown authority, replenishment and substitute resources. A shared store should record which projects can technically use each component and whether the component remains available after another member exercises its rights.
Table 5. Evidence levels for repair-capacity arrangements
| Arrangement | Evidence needed | Financial-model question |
|---|---|---|
| Uncontracted market access | Current capability and procurement assessment | What happens if the preferred resource is committed? |
| Framework agreement | Executed scope, call-off procedure and allocation terms | Which resources and timings are contractually supported? |
| Capacity reservation | Identified package, period, geography and exceptions | What capacity remains after exclusions and prior commitments? |
| Pooled vessel or spares | Eligibility, priority, concurrent-demand and replenishment rules | Can correlated requests exceed the pool's resources? |
| Dedicated spare system | Physical inventory, condition, title and joint compatibility | Is the complete repair system deployable? |
Analytical classification; executed terms determine each arrangement's actual rights.
8 Contracts, latent defects and information rights
The contract review should follow technical responsibility across designer, manufacturer, installer, protection-system supplier and operator. For each interface, it should identify the relied-upon data, acceptance obligations, change authority and continuing cooperation required during a repair.
Ofgem's 20 January 2025 Gwynt y Môr determination describes the December 2023 failure of export cable SSEC3 as resulting from the same latent defect associated with its 2020 failure. The regulator examined foreseeability, risk management, insurance and third-party recourse. It recorded that construction warranties had expired and that the licensee had no available commercial route to recover its costs. The decision approved an income-adjusting event in the circumstances described. [7]
The proposed diligence response is to map warranty expiry against the asset's operating period and the evidence needed to identify defects. Serial-defect provisions, notification deadlines, financial caps, security and dispute procedures require examination in the executed documents. Their value should be assessed alongside counterparty credit and practical enforcement.
Information rights should survive contractor changes where negotiated and legally available. Drawings, joint designs, settings, test procedures and material certificates should remain accessible for restoration. The owner should also establish who can instruct urgent mitigation while responsibility remains disputed. This paper recommends documented authority and funded decision limits, subject to applicable safety, insurer and lender requirements.
9 Insurance response and recovery timing
Insurance analysis should distinguish physical damage, revenue interruption, expediting, defect correction and third-party liability. Each loss component requires a separate assessment of trigger, exclusion, deductible, limit and evidence. A financial model should also retain the date on which cash is expected to arrive.
The November 2025 Nordic Offshore Wind Insurance Conditions provide published standard wording for examining these mechanics. Operational business-interruption clause 5-1 links lost revenue to recoverable damage involving an insured or nominated object. Liability is subject to agreed sums and indemnity days; optional aggregate limits can apply. Clause 5-3 leaves the deductible period to the insurance contract. The introductory notice expressly identifies the wording as illustrative and freely modifiable. No project coverage commitment follows from publication of the wording. [15]
The Gwynt y Môr determination provides a specific coverage boundary. Ofgem records that the relevant policy excluded damage arising from export-cable defects and that economically viable coverage for the defined risk was unavailable in the circumstances assessed. This policy finding is confined to the case and period examined. [7]
The proposed recovery register should retain disputed causation, adjuster position, submitted evidence and anticipated receipts separately. Forecast recoveries should be reconciled across insurance, warranty and statutory compensation. Subrogation rights and settlements require coordinated legal review before the model credits overlapping recovery routes.
Table 6. Proposed loss-component and recovery assessment
| Loss component | Documents to examine | Cash-timing question |
|---|---|---|
| Physical repair | Property policy, defect wording and repair contract | Which costs can be funded before coverage agreement? |
| Lost operating revenue | BI trigger, deductible period and indemnity limits | When does loss attach and when might payment occur? |
| Expediting or extra cost | Extensions, mitigation provisions and approval requirements | Is accelerated expenditure authorised and recoverable? |
| Repeated defect | Serial-loss wording, warranties and security | How are related events aggregated and remedies funded? |
| Third-party damage | Liability evidence and subrogation provisions | Can identification or litigation delay recovery? |
| Transmission compensation | Licence, connection agreement and relevant statute | What calculation, threshold and timing govern payment? |
Potential routes require executed wording, governing law and case evidence. No coverage is presumed.
10 Country-specific ownership and compensation
Great Britain's OFTO model separates transmission ownership from generation. Ofgem's September 2025 Tender Round 13 guidance describes a 98% availability target, a maximum annual uplift of 5% and a maximum annual revenue penalty of 10%, with further accrued penalties carried forward under the stated mechanism. It also describes seasonal and capacity weighting. The guidance applies to its specified tender round and defers to the licence where they differ. [8]
Ofgem's December 2025 decision retains 98% for the vast majority of HVDC projects while permitting pre-tender consideration of a reduced target where supported by a business case. Its discussion identifies particular concern for assets with more than 200 km of cable. That policy is an availability-incentive arrangement, with generator losses requiring their own contractual and financial analysis. [9]
The Dutch January 2026 framework defines TenneT's offshore-grid task and describes proportional capacity reduction across connected farms according to the relevant site-decision bandwidths. It also refers to compensation under Section 16f of the Electricity Act 1998. Its English translation is expressly informational; controlling Dutch documents and project agreements require legal review. [10]
Germany's EnWG Section 17d assigns construction and operation of offshore connections to the responsible transmission operator. Section 17e contains separate rules for connection disturbance, delayed completion and maintenance. Disturbance provisions include ten consecutive days and an annual threshold, with compensation bases, turbine-readiness conditions and exceptions. Tendered projects have a specific valuation rule in paragraph 3a. A blanket percentage of total project revenue would omit these distinctions. [11; 12]
Table 7. Distinct offshore-transmission allocation frameworks
| Jurisdiction | Published allocation | Diligence consequence |
|---|---|---|
| Great Britain | Separate OFTO; licence-based availability incentive [8] | Separate OFTO revenue adjustment, repair expenditure and generator loss |
| Netherlands | TenneT offshore-grid task; design and capacity allocation in framework [10] | Review platform configuration, shared capacity and controlling Dutch agreements |
| Germany | TSO connection duties; statutory disturbance, delay and maintenance rules [11; 12] | Establish applicable paragraph, readiness, event duration and compensation basis |
Source-grounded comparison as accessed 10 October 2026. Project eligibility and controlling local documents require confirmation.
11 Liquidity, debt service and transaction value
The proposed financing assessment should reconcile engineering downtime with monthly cash movements. Lost sales, continuing operating costs, repair deposits, marine mobilisation and debt service should be placed on the same timeline. Policy deductions and disputed recoveries should remain visible through the period before cash receipt.
A repair reserve should be tested against the expenditure that releases the critical path. The analysis should identify the account permitted to fund surveys, engineering, spare preparation and mobilisation; draw conditions should be compared with the date of the required commitment. Sponsor support and revolving facilities should be assessed through their executed availability and conditions.
Debt-service coverage should use the agreed financing definition. Management should test consent requirements for key-contract amendments, material damage, insurance settlements and reserve releases. Proposed emergency authority should be documented before an incident, with escalation thresholds linked to the financial downside.
Transaction diligence should separate completed restoration from unresolved population risk. A buyer should reconcile claimed repair readiness to physical inventory, technical compatibility and contracted access. Open claims require their own evidence and timing assessment. Any purchase-price adjustment, reserve requirement or specific indemnity should be traced to the exposure addressed.
The proposed valuation bridge should first show supported cash-flow adjustments. Residual uncertainty can then be considered in scenario weighting or transaction terms, with an explicit check for double counting. This paper assigns no observed market discount, leverage premium or value uplift to cable preparedness.
12 Interpreting a hypothetical repair-capacity model
An illustrative model should make the mechanism reproducible. Inputs should separately specify the outage duration, surviving transfer capacity, generation profile, electricity price, repair expenditure, insurance response and payment delay. Each parameter should be labelled hypothetical until supported by the project's evidence.
The energy-loss calculation should compare deliverable production with and without the contingency. Hourly resource, curtailment, electrical limits and revenue arrangements should be used when available. A simplified generation profile should state its assumptions and check that the resulting energy loss is consistent with the surviving transfer capacity.
Redundancy and preparedness should be tested independently and together. The model should also include a shared-failure case and concurrent demand for repair resources. Incremental cable, protection, spare, monitoring and reservation expenditure should be compared with the resulting loss scenarios over the same evaluation horizon.
Insurance should enter as a distinct cash-flow component. A model should display ultimate net loss alongside the maximum funding deficit before recovery. Expected-value analysis requires a defensible probability basis; a deterministic stress case should retain its scenario identity.
The proposed decision output is a transparent set of trade-offs: usable transfer after failure, supported restoration time, gross loss, conditional recoveries and liquidity requirement. A single unexplained asset-value index would conceal too many of those assumptions.
13 Innovation and practical operating priorities
Recent programmes address system interfaces and evidence gaps. Carbon Trust's 2026 CBRA 2.0 tender proposes updated treatment of acceptable risk, uncertainty, multiple cables, system-level issues and trade-offs involving burial, installation and repairability. As accessed in October 2026, this is a proposed work scope and tender record; the paper claims no completed guidance or measured reliability improvement. [17]
DNV's September 2026 QUADRE status reports work on cable-protection failure modes, responsibilities, interface management and global analysis, including vortex-induced vibration. It identifies a draft mechanical-protection recommended practice planned for early 2027 and further testing and model-validation work in phase two. Those planned deliverables should retain their development status. [18]
The proposed operating response is to connect monitoring to a defined decision. Each measurement should have a failure mechanism, threshold, accountable reviewer and feasible intervention. The qualification record should identify what monitoring can establish about condition and which uncertainties require physical inspection or testing.
The first operational priority should be evidence preservation and a safe electrical state. Diagnosis and method engineering can then proceed with materials, consent and resource checks. Repair execution should retain removed-material records and as-repaired configuration. Return to service should be followed by root-cause closure, related-asset review and revision of the readiness assumptions. These are proposed work stages, with timing determined by the actual event.
14 Public evidence and unresolved research questions
Further research would benefit from consistently defined installed exposure, event counts, partial-capacity states and restoration milestones. A proposed comparative dataset would identify circuit rating, energised circuit-years, route and interface configuration, event mechanism, surviving export, repair stages and cash recovery. Each field would require a documented definition and source. An unresolved fault or claim should retain its observation date so that an unfinished restoration or recovery period is visible.
A further research question concerns the value of repair readiness under simultaneous demand. A study could compare verified resource commitments with actual mobilisation and restoration sequences, preserving the contract terms and conditions affecting access. Comparable reporting of repair resources, costs and recovery timing could support stronger economic assessment, subject to commercial confidentiality, security and legal constraints. The public sources reviewed here provide no complete project dataset for estimating those relationships. The worked example below therefore uses explicitly authored parameters and requires independent project validation.
15 The hypothetical system and monthly cash definitions
The following authored example compares four responses to a cable fault in a 1,000 MW offshore-wind system. Every engineering configuration, cost, outage duration, insurance term and event frequency in this example is hypothetical. The calculations demonstrate a decision method. They supply no project forecast, current procurement quotation or empirical failure probability.
The original system has two export circuits rated at 500 MW each. The reactive configuration obtains repair resources after the event. The prepared configuration purchases spares and reserves a repair package. Two further configurations add a third 500 MW circuit, either within the original corridor or along a separate route. Each configuration assumes usable switching and surviving interfaces. Figure 1 identifies the common buses that remain exposed even when the third route is separate. An actual design would require contingency studies and protection approval before these transfer capabilities could be credited.
Daily resource energy is calculated from export capacity P, an assumed average capacity factor c and 24 hours. The authored daily profile produces 1,000 MW for twelve hours and zero for twelve hours, giving a 50% capacity factor and 12,000 MWh per day before a fault. A surviving 500 MW circuit carries half the energy during the twelve generating hours. This deliberately simplified two-state profile supplies the physical interpretation of the energy-loss fractions used below. It has no claim to represent observed offshore-wind output and omits actual hourly variation, seasonality, dispatch constraints and capture-price variation. A project application should replace it with the approved generation time series and electrical operating limits.
Equation 1.
For each model month, lost revenue is daily energy multiplied by the unavailable export fraction u, the outage overlap in days d, and the real capture price p. Dividing by one million expresses the result in USD million. The overlap uses 365 divided by 12 days per equal model month; a partially affected month contains only the actual modelled outage days. This convention avoids counting a 60-day interruption as two complete calendar months.
Equation 2.
Monthly cash flow available for debt service, C, starts with annual normal revenue R0 less baseline operating cost O0 and annual readiness cost a, divided by 12. It then deducts lost revenue L and repair cash X. All repair expenditure is paid in month 1 in this illustration. Insurance receipts remain outside this definition of CFADS. This analytical definition should be reconciled to executed financing documents before a lender covenant is assessed.
Equation 3.
Table 8 sets out the shared operating and financial inputs. Table 9 identifies the physical fault configurations and assumed payment month. Normal annual revenue is USD 350.40 million, producing USD 280.40 million of CFADS before readiness expenditure. Annual debt service is USD 180.00 million, paid in twelve equal instalments. The example assumes no reduction in baseline operating costs during an outage, which is a modelling choice requiring project validation.
The prepared option requires USD 6.00 million upfront and USD 0.60 million annually. The shared third circuit requires USD 55.00 million upfront and USD 0.90 million annually. The separate third route requires USD 70.00 million upfront and USD 1.20 million annually. Upfront investment is separately funded at time zero. It is excluded from the operating reserve reported later, so that reserve cannot be interpreted as the total initial funding requirement.
Table 8. Hypothetical operating and financial assumptions
| Parameter | Value | Unit or timing |
|---|---|---|
| Normal export capacity | 1,000 | MW; two 500 MW base circuits |
| Resource capacity factor | 50% | Authored daily profile: 12 hours at 1,000 MW, 12 at zero |
| Capture price | 80 | Real USD/MWh |
| Baseline operating cost | 70.00 | USDm per year |
| Annual debt service | 180.00 | USDm; monthly payment 15.00 |
| Normal revenue / CFADS | 350.40 / 280.40 | USDm per year; before readiness |
| Event cash horizon | 24 | Equal model months; 365 days/year |
| Evaluation life / real discount rate | 20 / 8% | Years; no residual value |
| PD deductible / combined claim cap | 2.00 / 50.00 | USDm per occurrence |
| BI waiting period / eligible fraction | 30 / 80% | Days / eligible lost gross revenue |
| Reference event count / corridor share | 0.080 / 25% | Expected count/year / event composition |
All values are authored assumptions. No project, insurance quotation, observed failure rate or current supplier price is represented. Upfront resilience expenditure is funded separately and excluded from the operating reserve.
Table 9. Hypothetical fault and restoration configurations
| Configuration and event | Lost MW | Days | Repair USDm | Receipt month |
|---|---|---|---|---|
| Reactive / single | 500 | 120 | 18.00 | 9 |
| Reactive / corridor | 1,000 | 180 | 35.00 | 12 |
| Prepared / single | 500 | 60 | 12.00 | 6 |
| Prepared / corridor | 1,000 | 120 | 28.00 | 10 |
| Third shared / single | 0 | 60 | 12.00 | 6 |
| Third shared / corridor | 1,000 | 120 | 28.00 | 10 |
| Third separate / single | 0 | 60 | 12.00 | 6 |
| Third separate / corridor | 500 | 120 | 28.00 | 10 |
The corridor event removes both original circuits. It also removes the shared third circuit; the separately routed circuit retains 500 MW only while common interfaces remain usable. Repairs are paid in month 1. Zero lost MW still requires repair expenditure. Timing is assumed, with no contractual mobilisation commitment.
16 Conditional fault losses and insurance mechanics
The single-fault case removes one original 500 MW circuit. Reactive repair assumes 120 days of reduced export and USD 18.00 million repair expenditure. Prepared repair assumes 60 days and USD 12.00 million. Both third-circuit configurations explicitly purchase the prepared repair capability and use those same duration and repair-cost assumptions, while their surviving circuits carry the full assumed output. Physical damage therefore creates expenditure even when the system has sufficient transfer capacity to avoid lost sales.
The corridor case removes both original circuits. The reactive case loses all export for 180 days and incurs USD 35.00 million repair cost. Prepared repair reduces the assumed duration to 120 days, with USD 28.00 million repair cost. The shared third circuit is lost in the same corridor event. The separate route retains 500 MW, subject to the surviving common interfaces. These event definitions isolate the mechanisms purchased by preparedness and route separation.
The hypothetical policy has a USD 2.00 million physical-damage deductible, a 30-day business-interruption waiting period, 80% reimbursement of eligible lost gross revenue, and a combined USD 50.00 million per-occurrence cap. Equation 4 calculates an assumed ultimate receipt from repair cost X, deductible D, interruption duration d, waiting period w and reimbursement fraction beta. The cap applies to the combined amount. Actual wording can use different loss measures, exclusions and limits; the published Nordic conditions illustrate the need to inspect the agreed contract. [15]
Equation 4.
The receipt enters cash only in its stated month. Reactive single-fault recovery occurs in month 9; prepared and third-circuit single-fault recovery occurs in month 6. Corridor recoveries occur in month 12 for reactive repair and month 10 for the other configurations. These assigned dates are assumptions, with no insurer or contractor commitment implied. They remain separate from the 30-day waiting period, which changes the reimbursable amount.
Conditional event loss discounts monthly lost revenue and repair cash, then deducts the discounted receipt. Equation 5 uses a real annual effective discount rate r of 8% and a 24-month cash horizon. It excludes upfront resilience spending, annual readiness cost and debt service, which enter different parts of the assessment.
Equation 5.
The reactive single fault loses USD 57.60 million of sales and produces net event loss PV of USD 27.38 million after the assumed recovery. Prepared repair reduces these amounts to USD 28.80 million and USD 19.74 million. Each third-circuit configuration avoids single-fault lost sales in this constructed system, while retaining USD 2.30 million of net event loss PV from repair expenditure and the delayed partial recovery.
The corridor results are more demanding. Reactive net loss PV is USD 157.49 million. Prepared repair and the shared third circuit each produce USD 94.31 million. The separate route produces USD 37.62 million because half the assumed transfer capacity survives. Table 10 and Figure 2 preserve gross loss and recovery separately, making the assumed cap and cash timing visible alongside the net result.
Table 10. Conditional economic loss and assumed insurance recovery
| Configuration and event | Lost sales | Gross loss PV | Recovery PV | Net loss PV |
|---|---|---|---|---|
| Reactive / single | 57.60 | 74.58 | 47.20 | 27.38 |
| Reactive / corridor | 172.80 | 203.79 | 46.30 | 157.49 |
| Prepared / single | 28.80 | 40.45 | 20.71 | 19.74 |
| Prepared / corridor | 115.20 | 141.21 | 46.89 | 94.31 |
| Third shared / single | 0.00 | 11.92 | 9.62 | 2.30 |
| Third shared / corridor | 115.20 | 141.21 | 46.89 | 94.31 |
| Third separate / single | 0.00 | 11.92 | 9.62 | 2.30 |
| Third separate / corridor | 57.60 | 84.51 | 46.89 | 37.62 |
Authored hypothetical cases; real USDm. Gross PV includes lost sales and repair cash. Recovery uses the assumed combined limit and payment month. Net event PV excludes upfront investment, annual readiness cost, debt service and tax. Discounting uses 8% real annual effective rate with monthly cash timing.

View figure at full size; scroll horizontally on smaller screens.
Authored hypothetical calculations in real USD million. Total stacked width is gross event-loss PV; navy is net loss and gold is the assumed discounted receipt. Numeric labels identify net loss PV. Model terms and cash timing are defined in Tables 8-10; no project policy or event probability is represented.
17 Operating liquidity and debt coverage during restoration
Debt-service coverage and operating liquidity answer different questions within this model. First-year DSCR divides the sum of twelve monthly CFADS amounts by USD 180.00 million of debt service. Insurance is excluded from the numerator. The operating reserve is the largest cumulative cash shortfall over 24 months, after debt service and insurance received in its assigned month. Equation 6 includes an opening zero balance and each monthly cumulative position, so a configuration with no deficit has a zero required reserve.
Equation 6.
Reactive repair in the single-fault case records first-year DSCR of 1.14 and a USD 42.13 million operating reserve. Prepared repair gives DSCR of 1.33 and a USD 24.17 million reserve. The shared and separate third circuits give DSCR of 1.49 and 1.48, respectively, with operating reserves of USD 3.71 million and USD 3.73 million. The slightly higher separate-route requirement in this case arises from its larger readiness payment; both configurations avoid lost sales.
In the corridor case, reactive DSCR falls to 0.40 and the required reserve reaches USD 157.60 million. Prepared repair gives DSCR of 0.76 and reserve of USD 109.93 million. A third circuit in the same corridor yields almost the same operating result, with USD 110.03 million reserve and DSCR of 0.76 after rounding. The separate route gives DSCR of 1.08 and USD 52.53 million reserve under the specified surviving-capacity assumption. Table 11 reports the values without treating any ratio as a covenant conclusion.
Figure 3 plots the complete monthly cumulative cash paths. Dots identify the assumed insurance payment. A reserve review should trace the deepest cash point and the expenditures immediately preceding it. Actual facility availability, permitted account use and draw conditions would determine whether the project could fund that point. The model contains no commitment from a sponsor, lender or insurer to supply the calculated amount.
Recovery delay has a specific consequence in the reactive single-fault example. Moving receipt from month 9 to month 15 or 21 increases net event loss PV from USD 27.38 million to USD 29.16 million or USD 30.88 million. Its peak operating reserve remains USD 42.13 million in all three cases because the deepest deficit occurs before each receipt date. A longer lag can therefore change economic recovery without changing the maximum deficit in a particular cash path. Other cases require their own timing calculation.
These results also show the importance of separating capital expenditure from operating liquidity. Adding the separate route requires its assumed USD 70.00 million upfront expenditure in addition to the reserve appropriate to the selected event. Financing that capital expenditure with additional debt would change debt service, fees and coverage. Such a funding structure is outside this model and would require a separate financing case.
Table 11. Conditional debt coverage and operating liquidity
| Configuration and event | Year 1 CFADS | Year 1 DSCR | Operating reserve | Receipt month |
|---|---|---|---|---|
| Reactive / single | 204.80 | 1.14 | 42.13 | 9 |
| Reactive / corridor | 72.60 | 0.40 | 157.60 | 12 |
| Prepared / single | 239.00 | 1.33 | 24.17 | 6 |
| Prepared / corridor | 136.60 | 0.76 | 109.93 | 10 |
| Third shared / single | 267.50 | 1.49 | 3.71 | 6 |
| Third shared / corridor | 136.30 | 0.76 | 110.03 | 10 |
| Third separate / single | 267.20 | 1.48 | 3.73 | 6 |
| Third separate / corridor | 193.60 | 1.08 | 52.53 | 10 |
Authored hypothetical cases; cash amounts in real USDm. CFADS and DSCR exclude insurance. Reserve is the maximum cumulative cash deficit over 24 months after debt service and actual assumed receipt timing, beginning with zero operating cash. It excludes separately funded upfront expenditure and supplies no contractual covenant assessment.

View figure at full size; scroll horizontally on smaller screens.
Authored hypothetical cumulative cash after debt service, beginning at zero. Dots mark the assumed insurance receipt; CFADS excludes insurance. The operating reserve is the largest negative balance over 24 months. Upfront resilience investment is separately funded and excluded. Overlapping curves reflect similar operating outcomes under the stated cases.
18 Whole life cost and the event frequency needed to justify investment
The cost comparison adds upfront investment, discounted readiness expenditure and frequency-weighted conditional event loss for a twenty-year event-exposure window. Events are placed at the start of each year, from time zero through the start of year 20. Each event retains its full 24-month cash path, including runoff after the exposure window; the final event's path ends at time 21 years. Readiness expenditure covers twenty year-end payments. This explicit runoff convention avoids truncating the late insurance receipts and costs of the last event cohort. The expected event count lambda and corridor-event share q are authored sensitivity parameters. Lambda is a count per year under an additive calculation; q is the composition of the two event families. Neither parameter is estimated from the historical claims-value figures discussed earlier.
Equation 7.
In Equation 7, K0 denotes upfront expenditure, A is the year-end readiness annuity factor, B is the factor for events placed at each year start, and Cs and Cc are the conditional single-fault and corridor losses already discounted from their monthly cash paths. At an 8% real discount rate, A is approximately 9.8181 and B is approximately 10.6036. Using different factors preserves the explicitly different payment timing; the monthly conditional event losses retain their own timing within each year.
The reference sensitivity uses 0.080 expected events per year and a 25% corridor-event share. Table 12 gives cost PV for that exposure window and runoff of USD 50.82 million for reactive repair, USD 44.45 million for preparedness, USD 85.30 million for the shared third circuit and USD 91.22 million for the separate route. Preparedness has the lowest cost in this constructed reference case. Route separation still reduces the severe-event operating deficit, a different decision criterion that can matter to financing and sponsor risk tolerance.
The cost comparison assumes expected events can be added without overlapping outages or constrained recovery between events. It also omits annual aggregate insurance limits, degradation, changing hazards, tax, residual value and later replacement investment. A high-count sensitivity should therefore prompt a fuller event-process model before it is used for an investment decision. No project enterprise value, equity return or market transaction multiple is calculated here.
Break-even event counts are obtained by dividing incremental upfront and readiness PV by the discounted conditional saving per event. With corridor share at 25%, preparedness breaks even against reactive repair at approximately 0.052 events per year. The shared third circuit requires approximately 0.174 and the separate route approximately 0.158. Comparing the separate route directly with the shared third circuit gives a threshold of approximately 0.119 events per year. The reference count of 0.080 is below that last threshold.
Table 13 makes the event mix explicit. When corridor share is zero, separating the third route produces no conditional event-loss saving in this model, so there is no finite break-even count for that incremental decision. At a 50% corridor share, the separate-versus-shared threshold falls to approximately 0.060 events per year. At 100%, it is approximately 0.030. The result depends on the defined failure mechanisms, cost difference and surviving capacity; the table supplies no evidence that any of these event frequencies occurs in a particular asset.
Figure 4 displays the four cost curves at the 25% corridor share. It shows how a higher fixed resilience cost can be justified only as the modelled loss saving accumulates. A project decision should examine this cost criterion together with the maximum fundable outage, contractual obligations, safety requirements and available capital. Those constraints require evidence outside a simple expected-cost ranking.
Table 12. Twenty year cost comparison in the hypothetical reference case
| Configuration | Upfront | Readiness PV | Event loss PV | Total cost PV |
|---|---|---|---|---|
| Reactive | 0.00 | 0.00 | 50.82 | 50.82 |
| Prepared | 6.00 | 5.89 | 32.56 | 44.45 |
| Third shared | 55.00 | 8.84 | 21.46 | 85.30 |
| Third separate | 70.00 | 11.78 | 9.44 | 91.22 |
Real USDm; hypothetical expected event count 0.080/year and corridor-event share 25%. Readiness costs occur at year end. Additive expected events occur at each year start with their monthly cash timing preserved. Overlapping faults, annual insurance aggregates and hazard changes are excluded. This is a conditional cost comparison, with no market valuation conclusion.
Table 13. Hypothetical break even annual event counts
| Corridor share | Prepared vs reactive | Shared vs reactive | Separate vs reactive | Separate vs shared |
|---|---|---|---|---|
| 0% | 0.147 | 0.240 | 0.308 | No finite threshold |
| 10% | 0.085 | 0.208 | 0.223 | 0.299 |
| 25% | 0.052 | 0.174 | 0.158 | 0.119 |
| 50% | 0.032 | 0.136 | 0.106 | 0.060 |
| 100% | 0.018 | 0.095 | 0.064 | 0.030 |
Expected event counts per year, not empirical annual probabilities. Thresholds equate incremental upfront/readiness cost to discounted conditional event savings. No finite threshold means route separation provides no event-loss saving in the zero-corridor case under these assumptions. Changes to hazards, policy or actual costs require recalculation.

View figure at full size; scroll horizontally on smaller screens.
Authored hypothetical cost comparison at a 25% corridor-event share and 8% real discount rate. The event-exposure window spans twenty year starts; each event retains its full 24-month cash runoff. Readiness has twenty year-end payments. The dotted line identifies the reference expected count of 0.080 events per year. Event counts are assumptions and carry no empirical annual probability interpretation.
19 Price sensitivities and the common interface stress
Figure 5 compares the separate third route directly with the shared third circuit across 25 combinations of event count and corridor share. Positive cells show a lower modelled cost for separation. Negative cells show that incremental capital and readiness expenditure exceed the calculated event-loss saving. At the reference count of 0.080 and corridor share of 25%, separation has approximately USD 5.92 million higher cost PV. At the same count with a 50% corridor share, it has approximately USD 6.10 million lower cost PV. These are hypothetical sensitivity outcomes, with no empirical likelihood assigned to either combination.
Electricity price changes both the opportunity cost of lost production and the assumed insurance amount until the combined cap binds. The supporting calculations use real prices of USD 40, 70, 80, 100 and 130 per MWh. All operating costs and debt service remain unchanged to isolate the price mechanism. A project model should instead reconcile its hedge, support mechanism, merchant exposure, basis risk and compensation terms before applying these cases.
At USD 40/MWh, the reactive corridor case produces negative first-year CFADS of USD 16.20 million and a DSCR of negative 0.09. Its 24-month operating reserve reaches USD 221.00 million. Even normal annual CFADS at that price is USD 105.20 million before readiness expenditure, below the assumed USD 180.00 million debt service. The deficit therefore includes the continuing weakness of the underlying operating cash flow after repair. Raising a repair reserve alone would leave that financing problem unresolved.
At USD 130/MWh, reactive corridor first-year CFADS is USD 183.60 million and DSCR is 1.02. Its reserve is still USD 156.10 million because the six-month outage and early repair payment create a large cash deficit before the assumed month-12 recovery. The USD 50.00 million combined claim cap remains binding. The change in annual coverage ratio should therefore be read with the full monthly funding path.
The common-interface stress removes the separate route's surviving-capacity assumption. It sets export loss to 100% for the stated corridor restoration period in every configuration. Under this stress, the separate route's net event loss PV rises from USD 37.62 million to USD 94.31 million. Its reserve rises to USD 110.13 million and first-year DSCR falls to approximately 0.76. Shared buses, controls, landfalls or other actual dependencies require engineering examination before any separate-route benefit is credited.
The supporting no-insurance cases remove every assumed receipt while preserving physical restoration and repair cost. They allow the owner to examine funding without anticipated recovery. Claim-delay cases add six or twelve months to each original receipt date within the 24-month horizon. These tests expose different vulnerabilities and should be retained individually when the project model is populated with current evidence.
An investment recommendation should identify which result governs the decision. A lower expected cost, a smaller conditional loss, a fundable operating deficit and continued output under a specific contingency each require their own evidence. The worked example demonstrates how those results can diverge and provides a reproducible basis for examining the actual design and contracts.

View figure at full size; scroll horizontally on smaller screens.
Authored hypothetical separate-versus-shared third-circuit sensitivity. Positive real USD million values favour separation; negative values indicate higher cost. Cells use unrounded model calculations with labels rounded to one decimal. Corridor share is event composition, with no correlation coefficient or observed likelihood implied.
20 Contract interfaces and authority to restore service
The proposed execution framework starts with a single interface schedule covering the generator, transmission owner, cable supplier, installation contractor, maintenance provider and insurer. For each physical boundary, the schedule should identify ownership, operating control, maintenance duties, access rights and the party authorised to instruct work. A separate financial schedule should identify who initially pays, which counterparty may reimburse eligible expenditure and which approvals apply. These schedules would require review against the executed agreements; the allocations below are proposed responsibilities for adaptation to a specific project.
The outage procedure should nominate one incident coordinator with access to technical, commercial and legal decision-makers. That appointment should leave each asset owner's switching and safety authority explicit. Emergency expenditure authority, evidence-preservation requirements and the process for requesting insurer participation should be documented before mobilisation. Where multiple contracts touch the same joint, termination or protection system, the decision record should identify the responsible interface and any unresolved allocation. Escalation should have a named recipient and deadline for action, with subsequent changes recorded.
Table 14. Proposed outage responsibility and decision matrix
| Decision | Proposed accountable role | Evidence required | Decision condition |
|---|---|---|---|
| Isolate the affected circuit | Asset owner's operating authority | Protection records, fault indication and safety assessment | Approved isolation and safe access |
| Define repair scope | Technical incident lead | Fault location, inspection findings and compatible repair design | Engineering acceptance and recorded uncertainties |
| Reserve and mobilise resources | Repair-contract manager | Vessel capability, crew, equipment and component availability | Confirmed scope, availability and spending authority |
| Notify and support recovery claims | Insurance and legal leads | Event chronology, policy and contract notices, preserved exhibits | Required notices issued and consent questions resolved |
| Release staged expenditure | Authorised finance lead | Approved work package and funding position | Delegated limit or specific approval documented |
| Re-energise and close the incident | Asset owner's operating authority | Accepted tests, completed work records and operating restrictions | Documented technical and safety release |
This is an author-proposed governance matrix. The allocation requires adaptation to actual contracts and operating rules. NOWIC's insurer survey and repair provisions provide relevant insurance context; its standard wording remains illustrative and modifiable. [15]
21 Evidence-led claims execution
Claims preparation should begin alongside fault investigation. The proposed evidence register would preserve original protection and monitoring records, inspection images, cable identification, installation history and prior defect notifications. Every item should carry its date, origin and custodian. The incident chronology should distinguish observed events, specialist conclusions and matters awaiting investigation. Physical samples and removed components should have a recorded custody trail, with testing or disposal agreed through the relevant technical and claims process.
The commercial record should connect each expenditure item to the damaged asset, work package, invoice and approval. Vessel standby, mobilisation, component supply and testing should remain identifiable within the ledger. A separate revenue file should retain actual generation, curtailment instructions, relevant market or contracted prices and the assumptions used to estimate the damage-free position. Changes in those assumptions should have an explanation and version history, so that technical scope and financial calculation can be reconciled.
Published NOWIC wording illustrates the questions that a project policy review should answer. Operational BI compensation uses lost operating time and daily revenue, with proportionate treatment of partial operation. The contract specifies the deductible period, indemnity days and sums insured; optional aggregate limits and serial-defect provisions may affect recovery. Revenue loss caused or increased by specified authority interventions or decisions to curtail undamaged objects is excluded under clause 5-1. Each proposed claim therefore needs a documented causal explanation and review against its own policy. [15]
The proposed recovery register should track insurance, warranty, contractual and regulatory routes separately, recording notice dates, amounts sought, decisions received and cash collected. A claimed amount should remain separate from an admitted amount and an actual receipt. Finance should reconcile any overlapping recoveries and obtain legal advice on applicable rights, deductions and subrogation. Closure should include outstanding disputes and a retained evidence index accessible to successor asset managers.
22 Lender and transaction diligence
A lender or purchaser should request a cable-specific diligence file before relying on a resilience claim. The proposed file would connect the electrical single-line diagram to asset ownership, protection arrangements, inspection findings, repair resources and available financial recovery routes. A technical adviser should confirm which failures the stated alternative path can accommodate, the relevant operating restrictions and the evidence supporting component compatibility. Any unresolved common-cause exposure should be carried into the investment decision with an identified owner and proposed treatment.
The contract review should examine assignment, expiry, liability caps, notice requirements, access to technical records and the ability to obtain replacement parts or specialist services after a supplier change. Ofgem's January 2025 Gwynt y Mor determination documents a repeated latent-defect failure, an absolute export-cable defect exclusion in the relevant policy, expired construction warranties and unavailable commercial recourse. Its income-adjusting-event decision depended on that licence and case-specific findings. This provides a concrete reason to inspect the remaining life and scope of each recovery route at the transaction date. [7]
Liquidity diligence should compare the proposed repair sequence with available cash and committed funding, applying the actual financing documents. Insurance proceeds, disputed recourse and regulatory adjustments should each have separately supported receipt assumptions. Fingrid reported that EstLink 2 resumed commercial operation after approximately one kilometre of damaged submarine cable was replaced, with repair costs shared between the two transmission operators and court compensation still being pursued. This interconnector case demonstrates that restoration and compensation can occupy different stages in the same documented incident. [16]
Where a financing decision depends on an unverified vessel commitment, component specification or policy interpretation, the proposed response is a defined evidence condition before commitment or a documented reservation with a funded treatment plan. Subsequent monitoring should request renewal terms, material inspection findings and changes to repair arrangements at agreed review points.
23 A proposed 100-day implementation programme
The following timetable is an author-proposed management programme for an operating asset. Its feasibility would depend on access to records, counterparties and specialist advice. It establishes decision dates for assembling and testing a plan; it supplies no restoration-time commitment. The accountable asset executive should approve the programme's scope, evidence owners and escalation arrangements at commencement.
During days 1-20, the project team should assemble the controlled baseline: asset drawings, cable and joint specifications, protection settings, installation records, inspection results, contracts and current insurance documents. Technical and legal leads should reconcile boundaries and record missing or conflicting information. Finance should establish the existing authority and funding arrangements for an incident. The phase should close with a reviewed evidence-gap register, named owners and dates for obtaining each material item.
During days 21-45, the technical lead should define credible asset-specific outage scenarios for examination with the repair provider and suppliers. Each scenario should trace diagnosis, isolation, access, component selection, vessel mobilisation, installation, testing and return to service. Compatibility and availability should be confirmed in writing at the level required for the proposed arrangement. Commercial and insurance leads should compare those activities with notification, consent and recourse provisions. Unresolved assumptions should remain visible at the phase review.
During days 46-70, the team should conduct a tabletop exercise using one agreed scenario. Participants should demonstrate who receives the first alert, who can authorise expenditure, where original evidence is stored and how disputed interfaces are escalated. The exercise should include a change in repair scope or resource availability. Its output should be a dated decision log and a corrective-action register, with each action assigned to an accountable owner.
During days 71-100, management should review the outstanding actions, approve achievable contract or operating changes and present the resulting evidence pack to the relevant board or financing parties. Actions requiring procurement, engineering work or third-party agreement may extend beyond the programme. Their interim treatment, funding and review dates should be explicit. The completed programme should establish an ongoing review cycle linked to inspections, insurance renewals, contract changes and lessons from actual incidents.
24 Limitations and conclusion
The public evidence supports a structured examination of cable resilience within defined limits. Allianz's regional claims-value dataset supplies a historical insurer portfolio view. The paper's use of that evidence requires retention of its geography, period, denominator and inclusion of onshore cables. Individual project performance and the probability of a future failure require additional asset-specific evidence. [14]
Incident reports also carry distinct boundaries. Ørsted's assessment of possible exposure across several wind farms was a contemporaneous management assessment following the Race Bank finding. Fingrid's report concerns an electricity interconnector. The Gwynt y Mor determination addresses a defined defect, policy and regulatory licence. Each case supports the stated observation; its transfer to another asset requires examination of technical and contractual differences. [6; 16; 7]
The proposed execution framework brings electrical functionality, physical restoration and financial recovery into one reviewable decision process. A project can use it to identify which capacity remains usable, which resources are demonstrably available, who can instruct work and how the cost and revenue evidence would support the relevant recovery routes. The investment decision should retain residual exposure wherever those questions remain unresolved. A defensible cable-resilience proposition is therefore an evidenced set of asset-specific arrangements, with explicit uncertainties, accountable decisions and periodic reassessment.
References
- US Department of Energy; Sandia National Laboratories; National Renewable Energy Laboratory. An Operations and Maintenance Roadmap for U.S. Offshore Wind. 2024-05. https://www.energy.gov/sites/default/files/2024-05/operations-maintenance-roadmap-us-offshore-wind.pdf. Locator: Printed pp. 37-40; PDF indices 48-51; sections 3.4.1.2, 3.4.1.4 and 3.4.2.2. Accessed 10 October 2026.
- Offshore Renewable Energy Catapult. Offshore Wind Subsea Power Cables: Installation, Operation and Market Trends. 2018-09. https://cms.ore.catapult.org.uk/wp-content/uploads/2018/09/Subsea-Power-Cable-Trends-Othmane-El-Mountassir-and-Charlotte-Strang-Moran-AP-0018.pdf. Locator: Printed p. 4; PDF index 3; Cable Failure Trends. Accessed 10 October 2026.
- The Carbon Trust; Offshore Wind Accelerator. Cable Burial Risk Assessment Methodology: Guidance for the Preparation of Cable Burial Depth of Lowering Specification. 2015-02. https://www.carbontrust.com/sites/default/files/documents/resource/public/cable-burial-risk-assessment-guidance.pdf. Locator: Printed pp. 16-20; PDF indices 15-19; sections 5-7; Printed p. 40; PDF index 39; fishing-data limitations; Appendix B examples are hypothetical. Accessed 10 October 2026.
- DNV. DNV-ST-0359 Subsea power cables for wind power plants. 2025-12 edition. https://www.dnv.com/energy/standards-guidelines/dnv-st-0359-subsea-power-cables-for-wind-power-plants/. Locator: Public standard landing page; Edition 2025-12 and scope statement. Accessed 10 October 2026.
- Offshore Renewable Energy Catapult. Dynamic Power Cable Qualification Framework and Case Studies. 2022-09-29. https://cms.ore.catapult.org.uk/wp-content/uploads/2022/10/Dynamic-Cable-Technology-Qualification-Oct-2022.pdf. Locator: Printed pp. 36-39 and 60-61; power-cable case study; Printed pp. 89-92; Appendix A qualification process and limitations. Accessed 10 October 2026.
- Orsted. Q1 2021 Report Transcription. 2021-04-29 earnings call. https://cdn.orsted.com/-/media/2021/orsted-q1-2021-transcript.pdf?hash=49E6710C499D3F027F26C785081AFC43&rev=cbff2024aa7a44c0be23d74780baf01e. Locator: Printed pp. 6-7; PDF indices 5-6; Printed pp. 11-12; management Q&A on the estimate. Accessed 10 October 2026.
- Ofgem. Final determination in relation to notice of an income adjusting event from Gwynt y Mor OFTO plc. 2025-01-20. https://www.ofgem.gov.uk/sites/default/files/2025-01/GyM-SSEC3-IAE-Final%20Determination-2023-cable-failure-(unsigned).pdf. Locator: pp. 1-3; dates and partial income adjustments; pp. 5-9; paragraphs 22-39 on latent defect, insurance and recourse. Accessed 10 October 2026.
- Ofgem. Guidance for Generic Offshore Transmission Owner (OFTO) licence Tender Round 13 (TR13). 2025-09-02. https://www.ofgem.gov.uk/sites/default/files/2025-09/Guidance%20for%20Generic%20Offshore%20Transmission%20Owner%20(OFTO)%20licence_TR13.pdf. Locator: pp. 7, 13-15; ownership/licence separation; pp. 21-26; sections 8.33-8.61 and availability mechanism. Accessed 10 October 2026.
- Ofgem. OFTO: Further evolution of a mature asset class decision. 2025-12-08. https://www.ofgem.gov.uk/sites/default/files/2025-12/OFTO-Further-evolution-of-a-mature-asset-class-decision.pdf. Locator: PDF pp. 6-11; HVDC availability section; particularly pp. 10-11 on decision/spares. Accessed 10 October 2026.
- Netherlands Ministry of Economic Affairs; RVO. Development Framework for Offshore Wind Energy, January 2026. 2026-01 adopted version. https://english.rvo.nl/sites/default/files/2026-01/Development%20Framework%20January%202026%20DEF.pdf. Locator: p. 1 translation disclaimer; pp. 8-9; TenneT task and compensation references; pp. 19-20; sections 3.5.1-3.5.3; pp. 31-32; DC completion/compensation milestones. Accessed 10 October 2026.
- German Federal Ministry of Justice / Federal Office of Justice; Gesetze im Internet. Energiewirtschaftsgesetz, Section 17d. Current consolidated provision accessed 2026-10-10; amendment date not separately asserted. https://www.gesetze-im-internet.de/enwg_2005/__17d.html. Locator: Section 17d paragraphs 1 and 2. Accessed 10 October 2026.
- German Federal Ministry of Justice / Federal Office of Justice; Gesetze im Internet. Energiewirtschaftsgesetz, Section 17e. Current consolidated provision accessed 2026-10-10; amendment date not separately asserted. https://www.gesetze-im-internet.de/enwg_2005/__17e.html. Locator: Section 17e paragraphs 1, 2, 3, 3a and 6. Accessed 10 October 2026.
- NKT. NKT wins service agreement with Norway-based Pipeline Repair and Subsea Intervention (PRSI) Pool. 2024-02-15. https://www.nkt.com/news-press-releases/nkt-wins-service-agreement-with-norway-based-pipeline-repair-and-subsea-intervention-prsi-pool. Locator: Full announcement. Accessed 10 October 2026.
- Allianz Commercial. A turning point for offshore wind: Global opportunities and risk trends. 2023-09. https://commercial.allianz.com/content/dam/onemarketing/commercial/commercial/reports/offshore-wind-opportunities-risks.pdf. Locator: Printed pp. 7 and 26; PDF indices 6 and 25; claims chart and footnote. Accessed 10 October 2026.
- Cefor / Nordic Offshore Wind Insurance Conditions Committee. Nordic Offshore Wind Insurance Conditions, Version 1.0. 2025-11-03. https://cefor.no/globalassets/documents/clauses/nowic/2025/master-document--nowic--3-november-2025.pdf. Locator: Printed p. 4 illustrative/nonbinding notice; Printed pp. 37-38; survey, tender and repair provisions; Printed pp. 46-47; clauses 5-1 through 5-5; Printed pp. 143-148 commentary, if further interpretation is needed. Accessed 10 October 2026.
- Fingrid Oyj. Half-year report January-June 2025. 2025-07-24. https://www.fingrid.fi/globalassets/dokumentit/en/investors/financial-reports/2025/fingrid-groups-half-year-report-2025-h1.pdf. Locator: Printed pp. 6-7; PDF indices 5-6; Power system operations. Accessed 10 October 2026.
- The Carbon Trust; Offshore Wind Accelerator. Offshore Wind Accelerator: CBRA 2.0. 2026 tender; exact original posting date not displayed in reviewed text. https://www.carbontrust.com/news-and-insights/tenders/offshore-wind-accelerator-cbra-20. Locator: Full tender page; objectives and scope; submission deadline extended to 14 August 2026. Accessed 10 October 2026.
- DNV. Qualification and design requirements for cable protection systems (QUADRE). Project status September 2026; original posting date not asserted. https://www.dnv.com/group/joint-industry-projects/qualification-and-design-requirements-for-cable-protection-systems/. Locator: Project status September 2026; objectives and phase-two deliverables. Accessed 10 October 2026.
About the Author
Chennakeshav (CK) is a corporate finance and investment banking executive with 25+ years of global experience in deal origination, structuring and execution across M&A, growth capital and corporate strategy. He has led value-creation mandates for founders, corporates and funds — bridging the boardroom view to hands-on execution and close.
His career spans Morgan Stanley, HSBC, Lloyds Banking Group, EWEC, ADQ portfolio companies and Emirates Growth Fund, across TMT, real estate, fintech, deeptech, cleantech, infrastructure and energy. He has partnered with C-suite leaders, private equity and venture funds, sovereign wealth funds and family offices to finance complex fund raises and scale-up ventures, and has led M&A due diligence, post-merger integration and business-transformation initiatives to create value.
At Matchpoint Partners he is Managing Partner, leading the firm's corporate finance, M&A and capital-raising practice. He holds an MBA from London Business School, an engineering degree from VTU and a Master of Laws (LLM, in progress) from UCL London.
An active start-up mentor, CK mentors at Techstars, DIFC FinTech Hive, Startup Grind, Founder Institute and IN5, serves as Entrepreneur Mentor in Residence (EMiR) at London Business School, and judges the Entrepreneurship World Cup.
https://www.linkedin.com/in/ckadya/ https://www.matchpoint-partners.com/team/ck-adya.html
