
1. Define the like-for-like service
A power comparison is meaningful only when every pathway supports the same economic service. The reference case should state information-technology load, rack density, utilisation, facility overhead, availability, ramp, climate, backup duty, customer requirements and study period.
Nameplate data-centre capacity is insufficient. A pathway that appears inexpensive may deliver less usable compute during connection constraints, renewable shortfalls, maintenance or fuel disruption. Another pathway may carry higher capital while protecting customer service through firm capacity.
The study should therefore begin with hourly electricity demand and supported compute. Facility electricity includes information-technology equipment, cooling, pumps, fans, storage losses, network, lighting and other loads. Backup generation and on-site energy assets need separate fuel, maintenance and emissions treatment.
All pathways should use the same financial boundary. Land, building and compute equipment can remain constant while power-specific connection, generation, storage, contracts, collateral, reserves and operating costs change. The model should avoid giving one pathway credit for infrastructure excluded from another.
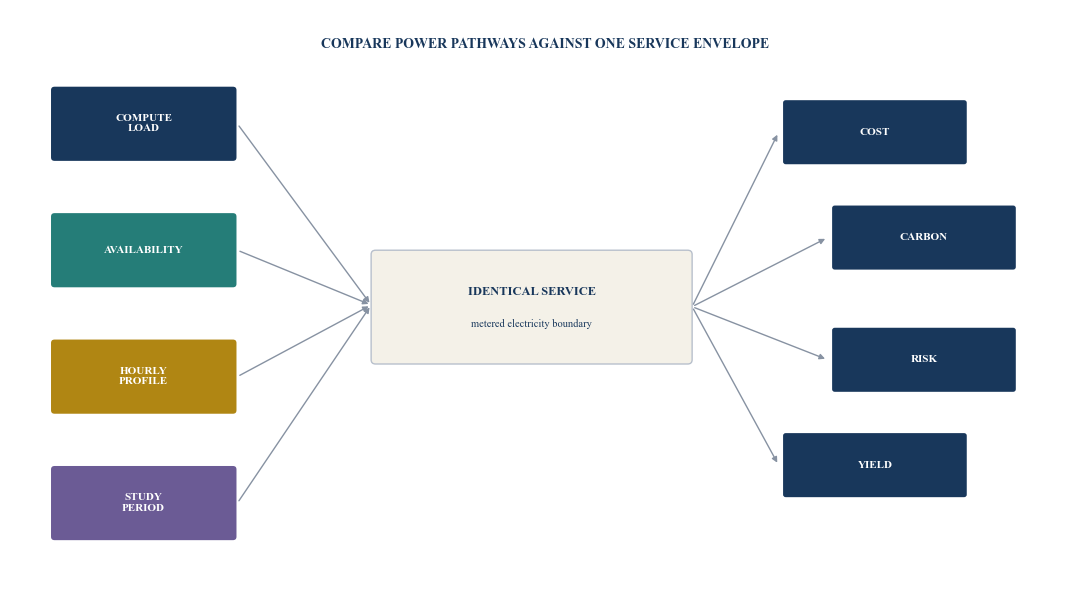
Author framework. Every pathway should support the same compute, availability and study period.
2. Use three emissions lenses
Location-based Scope 2 emissions use average generation emission factors for the grid area serving consumption. This lens reflects the physical emissions intensity associated with where electricity is used, subject to the method and data period.
Market-based Scope 2 emissions use qualifying supplier or product information and contractual instruments. GHG Protocol requires dual reporting in markets where such instruments are available.[1][2] Market-based results describe contractual choices and claims. They may differ materially from the average physical grid.
Time-matched carbon-free energy compares consumption with carbon-free generation in each hour and relevant grid area. The United Nations 24/7 Carbon-Free Energy Compact identifies hourly matching, local procurement and technology inclusion among its principles.[3] This lens reveals hours when annual procurement volumes conceal a shortage.
The three lenses should remain distinct. Location-based results support geographic comparison and physical-grid exposure. Market-based results support recognised inventory reporting and contractual procurement claims. Hourly matching supports operational and transition analysis.
Direct emissions from on-site combustion belong in Scope 1 under applicable accounting rules. Upstream fuel, transmission losses, equipment manufacture and construction can sit outside operational Scope 2. The investment file should state which categories are included.
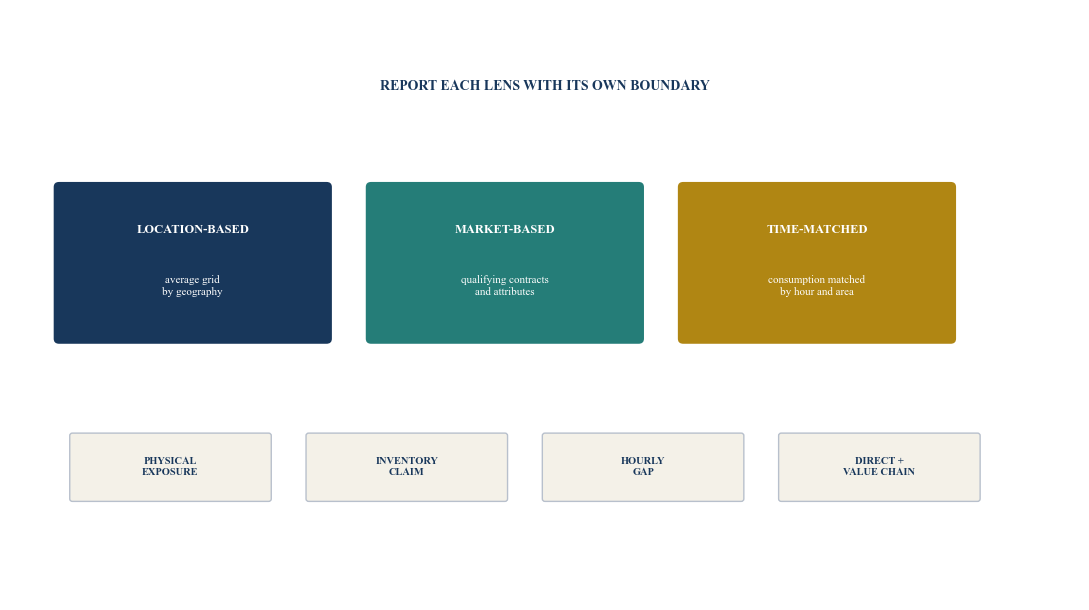
Author framework based on GHG Protocol concepts and 24/7 carbon-free energy principles.
3. Establish the electricity data file
The load file should contain hourly metered or engineered electricity, facility overhead, losses, backup generation, storage charge and discharge, on-site generation, curtailment and imports or exports.
The generation file should identify source, location, technology, commissioning date, hourly output, ownership, contractual rights, attributes, retirement and residual treatment. Annual contract quantity alone cannot establish coincidence with load.
The emissions-factor file should record source, geography, vintage, unit, greenhouse gases, treatment of losses and update date. The United States EPA eGRID publishes subregion output emission rates and resource mixes.[4][5] Australia's National Greenhouse Accounts Factors provide updated electricity factors and methodology for national reporting.[6] These data illustrate why factors should be current and jurisdiction-specific.
The contract file should cover delivery point, volume, shape, profile, price, indexation, imbalance, curtailment, settlement, credit, collateral, change in law, attributes, additionality representations, termination and replacement.
Table 1. Carbon-adjusted yield data file
| File | Minimum content | Control | Decision use |
|---|---|---|---|
| Load | hourly IT and facility electricity, ramp, weather, losses and outages | approved meter and forecast reconciliation | common service boundary |
| Grid | connection, tariff, congestion, losses, interruption and emission factor | utility and public data with vintage | physical cost and location-based emissions |
| Generation | technology, site, capacity, hourly output, availability and curtailment | metered or independent production evidence | volume and shape of clean supply |
| Contract | delivery, price, index, volume, imbalance, attributes and termination | legal review and settlement model | market-based claim and cash exposure |
| Storage | power, energy, efficiency, degradation and dispatch | control logs and warranty model | hourly matching and resilience |
| Carbon | reporting method, factor, residual mix, price and scenario | approved methodology and assurance | emissions and financial adjustment |
| Finance | capital, operating cost, debt, reserves, tax and residual value | integrated audited model | equity yield and downside |
Evidence should be current, traceable and consistent across every pathway.
4. Map the power pathways
Grid-only supply offers simplicity and system diversity, though its price, emissions and connection timing depend on the local network and generation mix. Annual attribute procurement can change the market-based inventory result without changing hourly physical supply.
A physical or financial power purchase agreement can support new generation and provide price exposure. The data centre still receives balancing power through the grid unless the project is directly connected and capable of following the load.
On-site solar or wind reduces imported energy when generation coincides with load. Land, permitting and intermittency limit contribution. Battery storage can shift energy across hours and provide resilience services, while duration, efficiency, degradation and charging source constrain its carbon result.
Firm low-carbon pathways may include nuclear, geothermal, hydro or other resources, depending on jurisdiction and evidence. Their availability, lead time, contract form, environmental attributes and system effects differ. Dispatchable combustion with carbon capture requires evidence on capture performance, upstream fuel and residual emissions.
The IEA expects a diverse mix to meet growing data-centre electricity demand, including renewables, natural gas and nuclear, with local constraints and timing shaping outcomes.[7][8] The comparison should therefore test actual deliverability rather than a technology label.
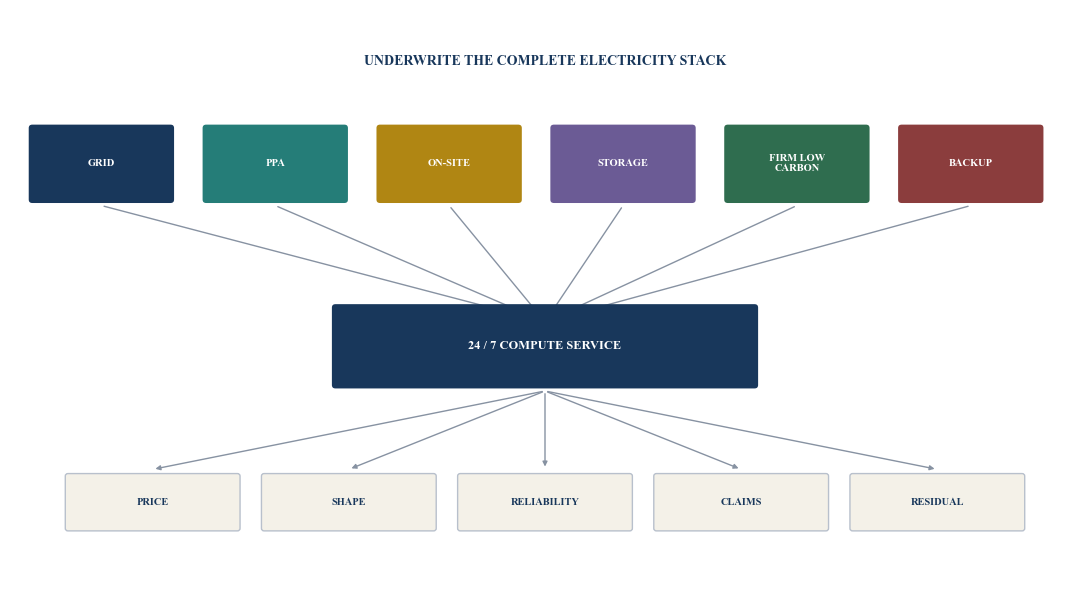
Author framework. Every pathway combines physical supply, balancing, contractual claims and residual exposure.
5. Price connection and deliverability
The lowest-carbon generation option can have little project value if it arrives after the data centre, sits behind a constrained network or lacks firm delivery. Connection date, import capacity, curtailment, congestion and reinforcement obligations should enter the base schedule.
The model should identify responsibility for network studies, security deposits, construction, energisation, delay and cancellation. Milestone payments can create material capital at risk before final capacity is committed.
A contracted generator may settle at a different market node from the data centre. Basis risk arises when prices diverge. Shape risk arises when output and load differ. Volume risk arises when generation is above or below contracted expectations. Balancing and sleeving charges can materially change delivered cost.
Curtailment terms should state whether the buyer pays, receives attributes, obtains deemed generation or bears replacement cost. A carbon claim may depend on attributes that are not delivered during curtailment.
6. Compare location-based exposure
Location-based emissions equal electricity consumption multiplied by an appropriate geographic emission factor, subject to the selected method. Average annual factors provide a common starting point. Hourly or marginal data can answer different questions when available and methodologically appropriate.
The factor should match the load geography and period. National averages can obscure regional differences. EPA's Power Profiler shows substantial variation among US eGRID subregions.[4] Australia's factors are jurisdiction-specific and updated through the National Greenhouse Accounts process.[6]
Location-based emissions can fall as the grid decarbonises, even without a new buyer contract. They can rise when fossil generation increases or new load changes dispatch. A long-term investment case should therefore use dated scenarios rather than hold one factor constant for twenty years.
Grid decarbonisation is a system scenario, not a contracted project cash flow. Its effect on carbon cost or customer demand should be modelled with an approved basis and sensitivity.
7. Test market-based claims
Market-based reporting depends on qualifying contractual instruments and the applicable accounting framework. GHG Protocol's Scope 2 Guidance sets quality criteria and a data hierarchy for supplier and product information, residual mixes and other factors.[1][2]
The diligence file should trace ownership and retirement of energy attributes, generation vintage, geographic market, reporting period, uniqueness, residual mix and any third-party assurance. Double counting can arise when several parties claim the same output or when attributes are sold separately from electricity.
A power purchase agreement combines commercial and environmental terms. The buyer may receive price settlement and attributes, one of those elements, or neither under some events. The legal agreement, registry and settlement should align.
Market-based results should not be described as physical delivery when the data centre continues to draw mixed grid electricity. Clear language preserves the value of the contractual claim and avoids overstating the operating condition.
Table 2. Power-pathway comparison
| Pathway | Delivery profile | Main cost exposure | Carbon evidence | Principal risk |
|---|---|---|---|---|
| Grid supply | firm subject to network terms | tariff, congestion and escalation | location factor and supplier data | connection, price and grid carbon |
| Grid plus annual attributes | grid profile | grid cost plus attribute price | qualifying retired instruments | claim quality, residual mix and annual mismatch |
| Renewable PPA | generator profile plus grid balancing | strike, basis, shape and imbalance | contract, metering and attributes | volume, curtailment, basis and tenor |
| On-site renewable | local generation profile | capital, land, operation and lost output | project meter and retained attributes | intermittency, space and performance |
| Renewable plus storage | shifted but duration-limited | generation plus storage capital and losses | charge source, dispatch and metering | degradation, duration and replacement |
| Firm low-carbon supply | technology-specific firm or contracted profile | capital or long-term service price | generation and attribute evidence | delivery, concentration, outage and policy |
| Gas plus carbon capture | dispatchable subject to fuel | fuel, carbon, capture and transport | measured emissions and capture evidence | residual emissions, methane, capture and storage |
Directional characteristics require project-specific market, engineering, contract and emissions evidence.
8. Measure hourly matching
Annual renewable procurement can equal annual consumption while leaving many hours unmatched. Solar output concentrates in daylight. Wind can vary across days and seasons. Data-centre load is comparatively flat unless compute can shift.
Hourly matching divides the study into time intervals and compares eligible carbon-free supply with consumption in each interval and relevant region. Excess supply in one hour should not automatically offset a shortfall in another when the objective is 24/7 matching.
Storage can move eligible electricity, subject to charging source, efficiency and interval accounting. Flexible compute can move some workloads when customer contracts, data, latency and operations allow. Firm carbon-free generation can fill persistent gaps.
The metric should state whether matching is based on energy, power, attributes or physical scheduling. It should also address exports, curtailment, storage losses, backup generation and partial intervals.
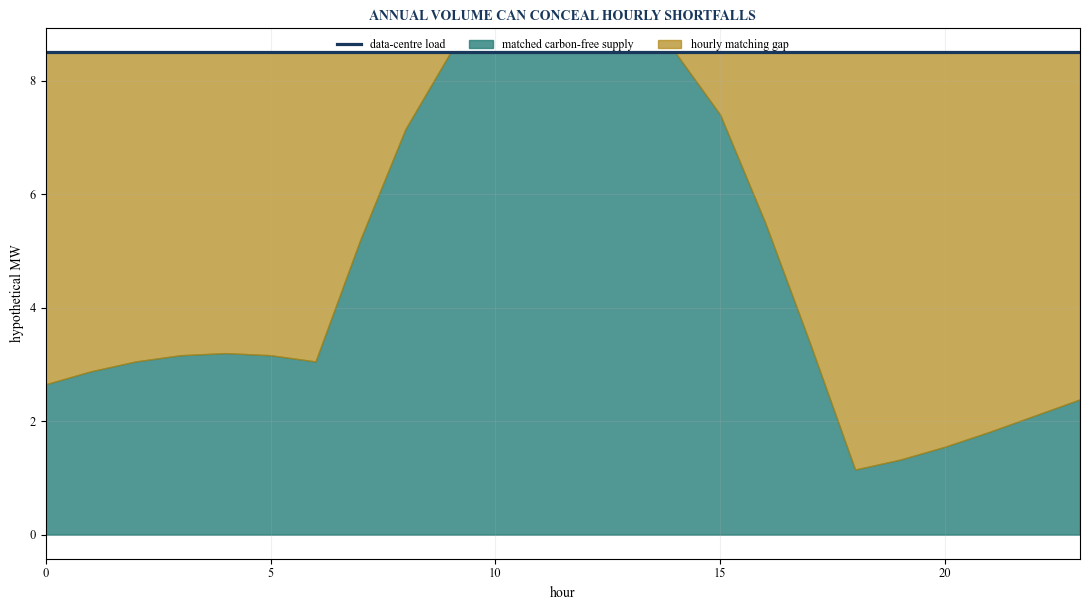
Hypothetical management profile created to demonstrate the method; it is not measured project data.
9. Distinguish average and marginal effects
Average emissions allocate the emissions of a generation mix across consumption. Marginal analysis estimates the change in system emissions associated with a change in load, generation or operation. The two answer different questions.
A location-based corporate inventory generally uses prescribed average factors. An investment committee may also examine marginal or consequential effects when assessing load shifting, storage dispatch or new generation. The method, counterfactual and uncertainty should be explicit.
Avoided-emissions claims are especially sensitive to counterfactual choice. A renewable project can displace different generation across locations and hours. A storage asset can reduce or increase emissions depending on charging and discharge.
The base carbon-adjusted yield should use recognised inventory methods for reported emissions. Consequential impacts can be shown separately as a scenario. Mixing them into one number can create false precision.
10. Price carbon exposure
Carbon price can enter through a tax, emissions trading system, customer discount, financing term, internal price or future compliance scenario. Each pathway has a different legal and cash transmission.
The model should apply carbon price only to emissions within the selected liability or decision boundary. A project may report Scope 2 emissions without paying a direct carbon levy. The economic exposure could instead appear through power prices or customer requirements.
Use several carbon-price scenarios and state currency, base year, escalation and coverage. Avoid double counting when a power price already includes carbon cost or when a contract passes it through.
The adjustment should also recognise transaction and assurance costs. Data systems, registries, audits, legal advice, certificates, collateral and reporting create cash costs even when the claimed emission factor is low.
11. Build carbon into customer revenue
Some customers require renewable procurement, emissions reporting, location restrictions or hourly matching. These requirements can affect occupancy, price, contract term and renewal.
The operator should distinguish a contractual customer obligation from a marketing ambition. The service agreement should define energy product, reporting method, attribute allocation, data availability, assurance, change in standards and remedies.
Green revenue premiums should remain outside the base case until supported by contracts or comparable transactions. Carbon performance may protect demand rather than increase price. The appropriate economic benefit can be lower vacancy, longer term, reduced churn or access to a customer segment.
The European Union has established data-centre energy-performance and water reporting and is developing further rating and performance work.[9][10] Regulatory transparency can increase the value of consistent metering and comparable evidence across facilities.
12. Model reliability and backup emissions
Power carbon and reliability cannot be evaluated independently. Customers buy available compute. A low-emissions pathway that increases service interruption can destroy more value than its carbon benefit.
The reliability model should cover grid events, generator outages, renewable variability, storage duration, fuel continuity, maintenance, common-mode failure and restoration. It should translate each event into supported compute and customer remedies.
Backup engines can create direct emissions, local air impacts, fuel cost and permitting obligations. Their annual energy may be small while their availability value is high. Testing and real outage operation should be metered separately.
The comparison should show emissions in normal, stress and emergency operation. A grid and renewable combination may still require backup. A firm low-carbon supply may also require redundancy for maintenance or unplanned outage.
13. Account for embodied capital
Power pathways require different physical capital. Solar, wind, storage, network reinforcement, substations, generators, heat systems and long transmission connections carry embodied emissions and resource use.
Operational Scope 2 reporting does not automatically include these impacts. Investment evaluation can present lifecycle or embodied estimates separately when reliable evidence is available.
Embodied analysis should define equipment boundary, manufacturing geography, transport, construction, replacement and end of life. Storage replacement and short-lived equipment can be material. Double counting should be avoided when supplier declarations and project totals overlap.
Carbon-adjusted yield can include a shadow cost for embodied emissions as a scenario. The decision file should not combine a lifecycle estimate with an operational inventory without explaining the difference.
Table 3. Claim, contract and assurance matrix
| Claim or metric | Evidence | Contract control | Assurance question |
|---|---|---|---|
| Location-based emissions | metered load and geographic factor | utility meter and factor source | does geography, period and loss treatment match? |
| Market-based emissions | qualifying product, supplier data or instruments | attribute ownership, retirement and residual mix | is the claim unique and within the eligible market? |
| Annual renewable coverage | annual consumption and retired renewable attributes | volume, vintage and settlement | does annual volume equal the reported boundary? |
| Hourly carbon-free matching | interval load and eligible interval generation | timestamp, region, storage and export rules | are shortages and excesses treated consistently? |
| Direct emissions | fuel quantity and equipment factors or measurement | fuel, meter and operating records | are testing and outages complete? |
| Embodied emissions | product declarations and lifecycle inventory | supplier data, scope and change control | are boundaries, replacements and overlaps clear? |
The exact requirements depend on the reporting framework, jurisdiction, contract and customer obligation.
14. Integrate the financial model
The power module should feed the same project model used for revenue, capital, operating cost, debt and equity returns. It should carry hourly or representative-period electricity, demand charges, tariffs, PPA settlement, storage dispatch, fuel, attributes and carbon scenarios.
Power capital should include connection, substation, dedicated generation, storage, control systems, deposits, development and contingency. Operating costs should include energy, network, maintenance, land, insurance, licences, registry, assurance and collateral.
The model should distinguish accounting EBITDA from cash available for debt service and equity. Financial or virtual PPAs can create settlements outside site power bills. Margining and collateral can create liquidity needs even when lifetime economics appear favourable.
Debt sizing should reflect contracted cash and risk allocation. Lenders may give limited value to an uncontracted carbon premium or avoided carbon cost. A long-term PPA can reduce price volatility while creating termination and mark-to-market exposure.
15. Calculate carbon-adjusted yield
Unadjusted equity yield can be calculated from project cash under standard approved definitions. Carbon-adjusted yield then applies transparent adjustments for carbon price, incremental decarbonisation capital, reporting cost, customer value and other selected exposures.
One approach is to calculate a carbon-adjusted cash yield:
Carbon-adjusted cash yield equals cash available to equity, less priced residual emissions and incremental assurance cost, plus contracted carbon-linked customer cash, divided by total equity invested including power-pathway equity.
This is a management measure rather than a universal accounting standard. The investment paper should show the conventional financial metric beside the adjustment and reconcile every item.
The framework can also calculate abatement cost, carbon-free matching percentage, emissions per useful compute unit, carbon value at risk and yield sensitivity per carbon-price increment.
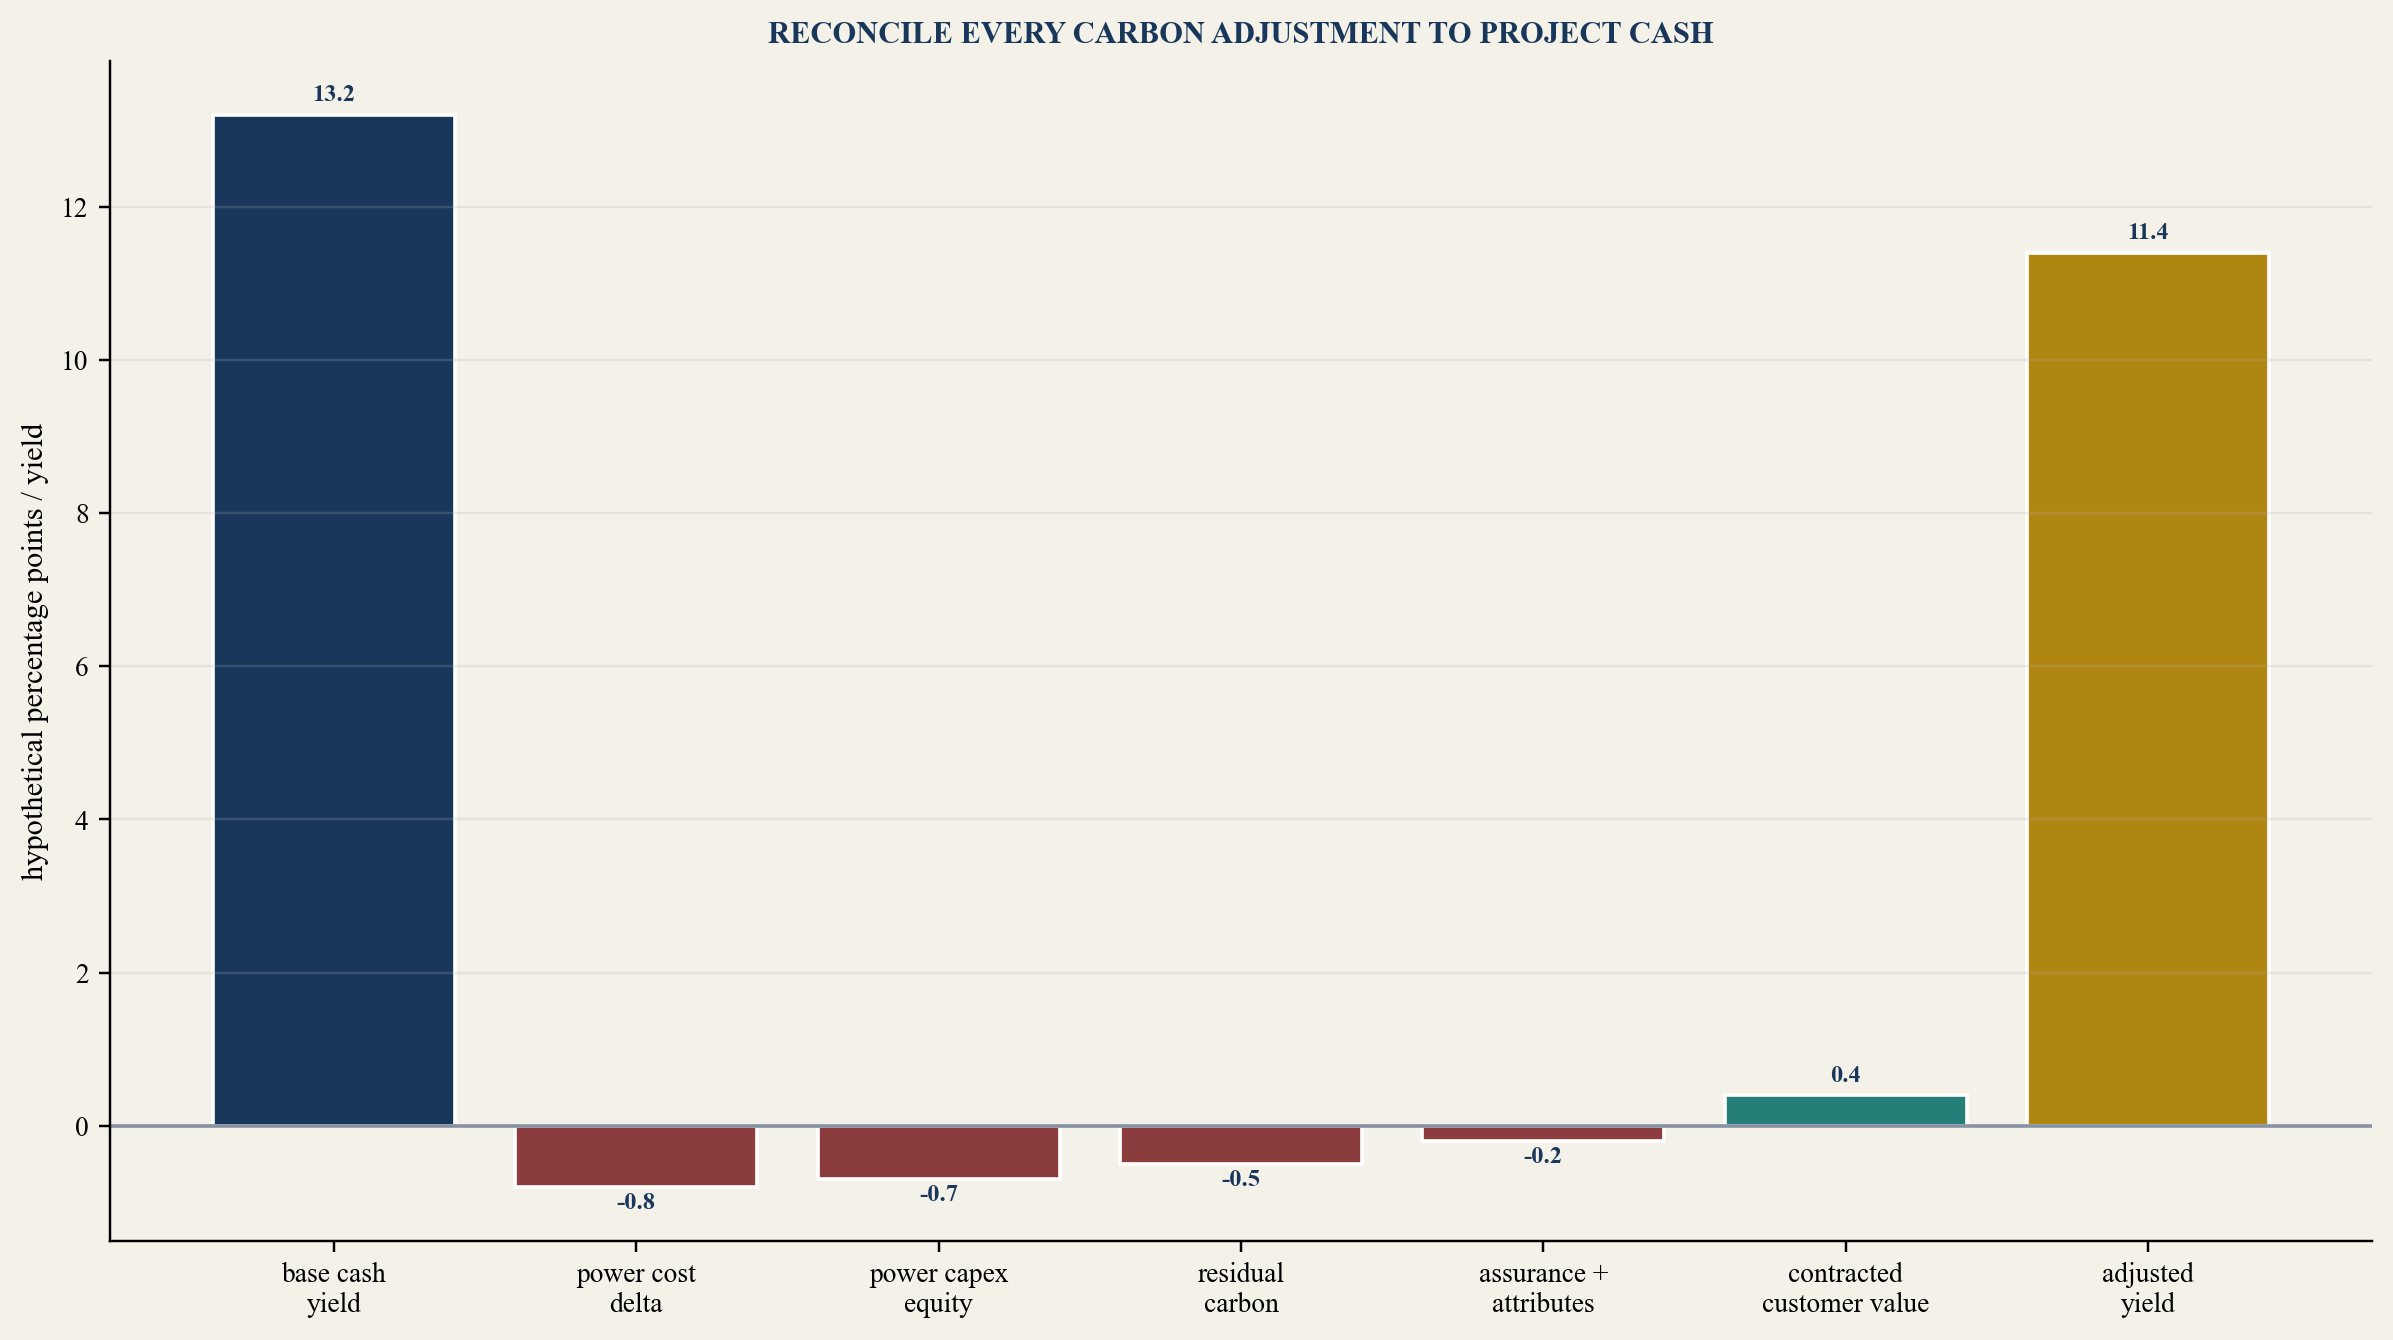
Hypothetical management values illustrate the reconciliation; they are not a forecast or actual project result.
16. Test a hypothetical 60 MW project
The following case demonstrates the method. Every value is a hypothetical management assumption. It does not describe an actual data centre, power contract or investment outcome.
Assume a 60 MW critical IT facility with average total site demand of 72 MW after facility overhead. Annual electricity consumption is 630,720 MWh before storage losses. The common property and compute case requires USD 420 million of equity before pathway-specific power capital.
Pathway A uses grid power and annual qualifying attributes. Pathway B adds a financial renewable PPA sized to annual consumption. Pathway C combines a renewable PPA, four-hour battery storage and firm low-carbon supply for part of the load. All pathways retain grid and emergency backup access.
Table 4. Hypothetical carbon-adjusted yield case
| Item | Pathway A: grid plus annual attributes | Pathway B: renewable PPA | Pathway C: shaped low-carbon stack |
|---|---|---|---|
| Annual electricity | 630,720 MWh | 630,720 MWh | 630,720 MWh plus storage losses |
| Power-specific equity | USD 8 million | USD 24 million | USD 112 million |
| Delivered energy and network cost | USD 75 per MWh | USD 70 per MWh expected | USD 78 per MWh expected |
| Location-based factor | 0.42 tCO2e per MWh | 0.42 tCO2e per MWh | 0.42 tCO2e per MWh on residual imports |
| Market-based operational result | 0.04 tCO2e per MWh | 0.03 tCO2e per MWh | 0.02 tCO2e per MWh |
| Hourly carbon-free match | 46% | 68% | 91% |
| Annual operating cash before carbon adjustment | USD 58 million | USD 61 million | USD 64 million |
| Residual emissions priced at USD 75 per tonne | USD 1.89 million | USD 1.42 million | USD 0.95 million |
| Assurance, registry and attribute cost | USD 0.80 million | USD 0.95 million | USD 1.20 million |
| Carbon-adjusted cash yield | 12.9% | 13.1% | 11.7% |
Every number is a hypothetical management assumption created solely to demonstrate the method.
Pathway C produces the strongest hourly match and lowest priced residual emissions in the hypothetical case. Its larger power-specific equity reduces current cash yield. Pathway B produces the highest carbon-adjusted cash yield under the assumed price and capital, while leaving more hourly exposure than Pathway C.
These results can reverse under different energy price, carbon price, customer contract, capacity factor, storage cost, connection timing or equity structure. The framework provides a comparison method rather than a preferred technology.
17. Stress the comparison
The stress case should change connected variables together. A renewable generation shortfall can increase replacement energy, reduce attributes and raise market-based emissions. A grid-price spike can coincide with low renewable output. A connection delay can postpone revenue while deposits and interest remain outstanding.
Carbon-accounting rules can change the eligibility, geography or timing of claims. GHG Protocol began a Scope 2 revision process and consulted on proposed changes, so long-lived contracts should preserve data and adjustment rights.[11][12]
Customer demand can also change. A large buyer may require hourly evidence, reject certain technologies or seek audit access. The operator needs a change mechanism that allocates new compliance cost.
Table 5. Carbon-adjusted yield stress matrix
| Stress | Hypothetical management case | Transmission | Required response |
|---|---|---|---|
| PPA underproduction | annual output 18% below plan | replacement power, fewer attributes and lower settlement | volume bands, diversification and liquidity reserve |
| Negative basis | generator node price falls while load node rises | adverse financial PPA settlement | basis limits, location analysis and hedge review |
| Connection delay | energisation slips 12 months | deferred revenue and capital carry | staged equipment, long-stop rights and alternative capacity |
| Carbon factor increase | residual factor rises 30% | higher priced emissions and customer exposure | disclose scenario, improve matching and contract pass-through |
| Carbon price increase | price reaches USD 150 per tonne | greater value difference among pathways | covenant headroom and phased abatement options |
| Rule change | hourly or geographic criteria tighten | attributes or PPA may no longer support claim | data rights, substitution and change-in-standard clause |
| Storage underperformance | usable energy 20% below plan | lower matching, capacity and arbitrage | warranty test, augmentation reserve and dispatch control |
| Customer claim default | contracted green premium is removed | lower revenue and stranded pathway capital | minimum payment, re-marketing and approval gate |
Every scenario is a hypothetical management assumption and should be replaced with project-specific evidence.
18. Procure evidence and flexibility
Procurement should require comparable bids against one load, connection, availability, emissions and settlement envelope. Suppliers should state exclusions, dependencies and evidence sources.
Power proposals should provide hourly production, historical or model basis, curtailment, degradation, outage, price, index, basis location, imbalance, attributes, security, collateral and termination. Storage proposals should include efficiency, usable energy, degradation, augmentation and warranty tests.
The owner should retain access to meter, settlement, attribute, registry and operating data. Contracts should permit reasonable assurance and customer reporting. Proprietary dashboards without exportable evidence can weaken future claims and financing.
Flexibility can come from volume bands, staged capacity, technology-neutral carbon-free supply, substitution rights, portfolio procurement and scheduled re-openers. Too much flexibility can undermine bankability, so each option needs a clear price and decision process.
19. Establish the operating dashboard
The monthly dashboard should report compute served, total electricity, PUE, location-based emissions, market-based emissions, hourly match, direct emissions, backup operation, renewable generation, curtailment, storage losses, attributes, power cost and carbon-adjusted cash.
Forecast-to-actual variance should be explained by load, weather, grid factor, generation, price, outage, settlement and methodology. Restatements should be controlled and visible.
The operating team should reconcile utility meters, sub-meters, generator meters, storage, settlements and attribute registries. Finance, sustainability and operations should use the same underlying quantities.
Customer reports should follow contract definitions. Public claims should undergo legal and technical review. The dashboard should distinguish measured data, prescribed factors and modelled estimates.
20. Finance the pathway
The financing package should identify which costs and cash flows sit in the data-centre company, a generation project, storage company or separate contract. Cross-default and termination can transmit risk across entities.
Senior project debt can rely on contracted data-centre revenue and dependable operating cost assumptions. Dedicated generation or storage can use separate project finance when it has bankable offtake and asset rights. The data-centre credit may support a PPA even when generation debt is outside the facility.
Lenders should receive the power model, contracts, carbon methodology, customer requirements and change scenarios. Reserve accounts may cover power-price volatility, PPA collateral, fuel, storage augmentation and carbon compliance.
The equity committee should see unadjusted yield, carbon-adjusted yield, hourly match, emissions, abatement cost and downside together. A lower current yield can be justified by contracted customer value or reduced future exposure, with the evidence explicitly stated.
21. Execute through 150 days
The comparison should move from boundary and data to market evidence, integrated modelling, contracts, financing and decision. Early agreement on methods reduces later dispute over claims.
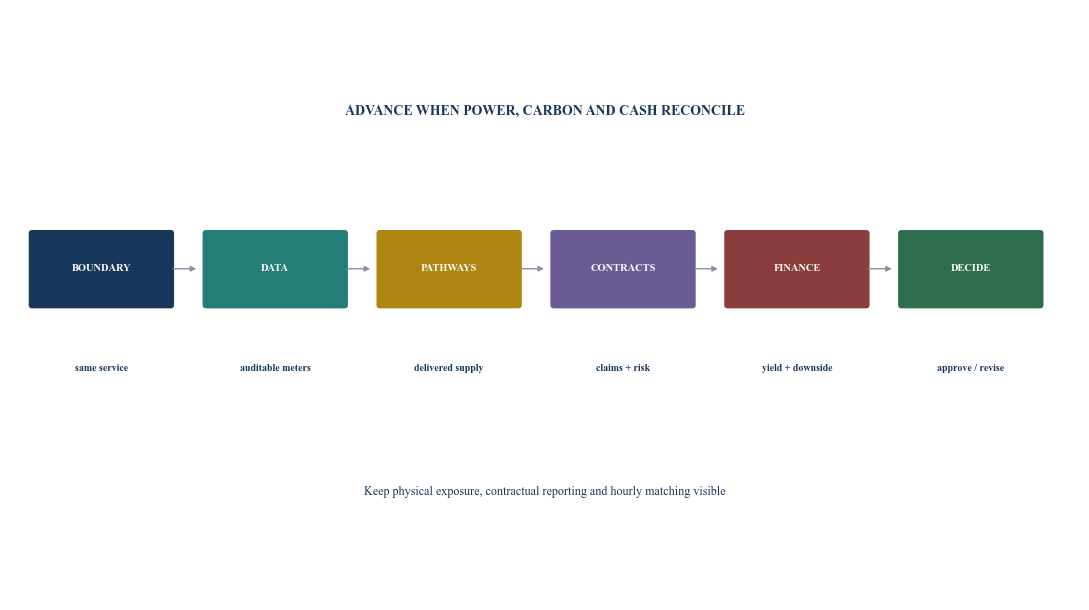
Author framework. Every gate requires approved evidence, ownership and a recorded decision.
Table 6. 150-day power-pathway execution plan
| Days | Workstream | Principal output | Gate |
|---|---|---|---|
| 1 to 15 | comparison boundary | compute, load, availability, emissions and finance definitions | common service approved |
| 16 to 35 | data room | meters, forecasts, grid, factors, contracts and customer requirements | evidence quality accepted |
| 36 to 60 | pathway design | grid, PPA, on-site, storage, firm supply and backup cases | shortlist approved |
| 61 to 85 | market engagement | prices, profiles, connection, attributes, collateral and terms | executable offers received |
| 86 to 105 | integrated model | hourly power, emissions, settlements, capital, cash and yield | reconciled comparison accepted |
| 106 to 125 | contracts and claims | delivery, balancing, attributes, data, assurance, change and exit | risk allocation approved |
| 126 to 140 | financing and stress | debt, reserves, downside, carbon price and customer exposure | financeable case established |
| 141 to 150 | investment decision | preferred pathway, conditions, dashboard and implementation | approve, revise or decline |
Sequencing is indicative and should reflect project location, procurement and connection status.
22. Set the investment decision
The committee should approve the service boundary, load, emissions methods, eligible claims, pathway, connection, generation, storage, backup, customer obligations, contracts, capital, financing, reserves, reporting and assurance.
Conditions should cover grid capacity, planning, generation completion, attribute ownership, meter and data access, storage performance, customer terms, carbon methodology, insurance, lender consent and independent acceptance.
The project should pause or resize when connection is uncertain, generation evidence is weak, annual claims conceal material hourly gaps without disclosure, PPA basis is uncontrolled, storage lacks augmentation, customer value is uncontracted or carbon-adjusted yield depends on a speculative price.
The approved decision should retain both conventional and carbon-adjusted financial metrics. It should state which emissions lens supports each claim and how future method changes will be handled.
23. Limitations and conclusion
Electricity markets, grid factors, generation, technology, contracts, reporting standards, climate policy, customer demand and capital markets can change. Decisions require current evidence from utilities, system operators, generators, customers, technology providers, environmental specialists, accountants, lawyers, lenders and qualified advisers.
The cited international sources describe global analysis, recognised reporting guidance and public data within their stated purposes. They do not establish the emissions, cost, reliability, claim or return of a specific project.
Every numerical value and result in the worked case is a hypothetical management assumption. No actual data centre, power contract, carbon claim, customer payment or investment result is represented.
A carbon-adjusted yield is useful when it reconciles an environmental objective to the same compute service and project cash. It should preserve the distinctions among physical grid exposure, contractual inventory reporting, hourly matching, direct emissions and embodied capital.
The strongest power pathway can differ by location, load, connection, customer and financing. Transparent boundaries, hourly evidence, enforceable contracts, current factors and explicit residual exposure allow investment committees to compare those pathways without false equivalence.
References
- [1] GHG Protocol, Scope 2 Guidance, official standard and resources accessed 13 August 2026. https://ghgprotocol.org/scope-2-guidance
- [2] GHG Protocol, Scope 2 Frequently Asked Questions, official guidance accessed 13 August 2026. https://ghgprotocol.org/scope-2-frequently-asked-questions
- [3] United Nations, 24/7 Carbon-Free Energy Compact Principles, official compact. https://www.un.org/sites/un2.un.org/files/2021/09/principles_-_updated.pdf
- [4] United States Environmental Protection Agency, Power Profiler, updated 1 October 2025. https://www.epa.gov/egrid/power-profiler
- [5] United States Environmental Protection Agency, eGRID Summary Data, 2023 data released and revised in 2025. https://www.epa.gov/egrid/summary-data
- [6] Australian Department of Climate Change, Energy, the Environment and Water, National Greenhouse Accounts Factors 2025. https://www.dcceew.gov.au/climate-change/publications/national-greenhouse-accounts-factors-2025
- [7] International Energy Agency, Energy and AI, 10 April 2025. https://www.iea.org/reports/energy-and-ai/
- [8] International Energy Agency, Executive Summary, Energy and AI, official analysis accessed 13 August 2026. https://www.iea.org/reports/energy-and-ai/executive-summary
- [9] European Commission Directorate-General for Energy, Energy Performance of Data Centres, official reporting page accessed 13 August 2026. https://energy.ec.europa.eu/topics/energy-efficiency/energy-efficiency-targets-directive-and-rules/energy-efficiency-directive/energy-performance-data-centres_en
- [10] European Commission Directorate-General for Energy, Minimum Performance Standards for EU Data Centres, official study page accessed 13 August 2026. https://energy.ec.europa.eu/resources/preparatory-studies/minimum-performance-standards-eu-data-centres_en
- [11] GHG Protocol, Scope 2 Standard Advances, 1 August 2025. https://ghgprotocol.org/blog/scope-2-standard-advances-isb-approves-consultation-market-and-location-based-revisions
- [12] GHG Protocol, Frequently Asked Questions: Scope 2 and Electricity Sector Consequential Accounting Public Consultations, official update accessed 13 August 2026. https://ghgprotocol.org/blog/frequently-asked-questions-scope-2-and-electricity-sector-consequential-accounting-public
About the Author
Chennakeshav Adya is an independent researcher and Managing Partner of Matchpoint Partners. His research focuses on investment strategy, capital formation, transaction execution, governance and operating-model design across international markets.
