

1. Define the performance system before selecting the software
A CFO performance system is the governed set of definitions, data flows, forecasts, reconciliations, decision thresholds and reporting routines through which management interprets economic performance. It is broader than a budget model and narrower than the organisation's complete finance architecture. Its job is to convert operating evidence into decisions about liquidity, margin, capacity, capital and risk.
The system should answer five recurring questions. What has happened and against which controlled baseline? What is currently expected to happen? Which assumptions explain the change? What does the change mean for cash, margin, capital and risk? Which decision is required, by whom and by when? A report that cannot support one of these questions may still serve a statutory, tax, operational or control purpose, but it should not occupy scarce executive or board attention merely because it exists.
The design begins with governance. The board retains the responsibilities imposed by applicable law, constitutional documents and reserved matters. Management owns the forecasts, actions and controls within its authority. Finance governs financial definitions, reconciliation and reporting evidence. Business leaders own the operating assumptions and actions that create the forecast. Treasury owns the liquidity view within the organisation's policy and financing arrangements. Risk, compliance and internal audit perform their respective roles without being treated as substitutes for management ownership.
The G20/OECD Principles of Corporate Governance describe board responsibilities for strategic guidance, management oversight, risk management, internal control and the integrity of reporting within their scope.[1] The UK Corporate Governance Code 2024 requires boards of companies within scope to monitor risk-management and internal-control frameworks and introduces the Provision 29 declaration for financial years beginning on or after 1 January 2026.[2] The Financial Reporting Council's related guidance explains the role of evidence, monitoring and reporting while recognising the inherent limitations of control systems.[3] These sources support a performance architecture in which numbers retain their definitions, owners, evidence and limitations.
The CFO should write a short performance-system charter before approving tools or dashboards. It should define the reporting perimeter, planning horizons, metric ownership, source systems, adjustment controls, forecast calendar, escalation thresholds, decision authorities, board timetable and document-retention requirements. Software can automate an agreed system. It cannot resolve an undefined measure or an unresolved decision right.
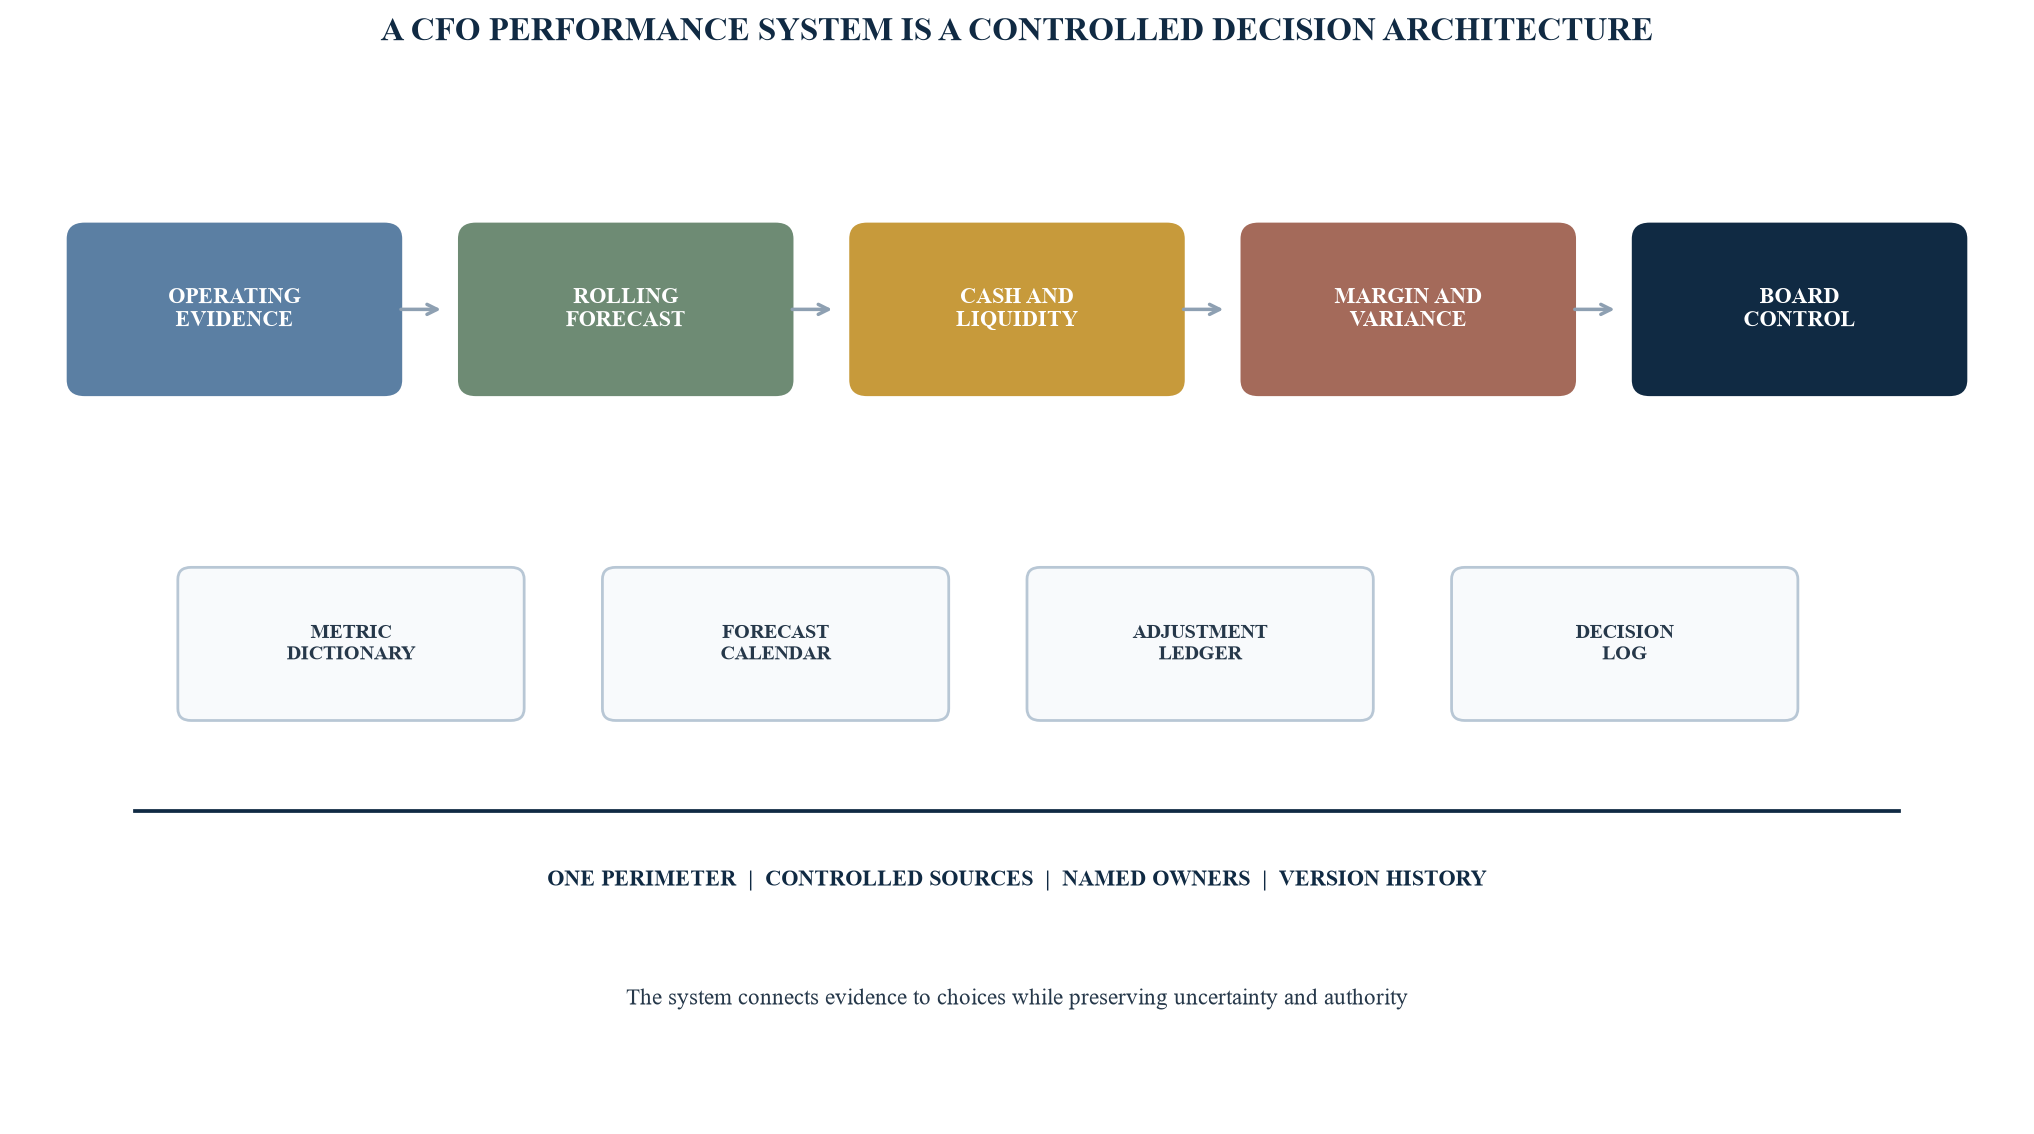
The architecture is a generic management model. Reporting, control and assurance arrangements should reflect the entity's governance, systems and obligations.
2. Freeze the perimeter and metric dictionary
Performance reporting becomes unreliable when the same label describes different populations or calculations. Revenue can be booked, billed, delivered, contracted or collected. Margin can be gross, contribution, project, product, customer, EBITDA or cash margin. Orders can include cancellable, contingent or unapproved items. Cash can mean bank balance, available liquidity, unrestricted cash or headroom after minimum operating reserves. Every decision measure needs a controlled definition.
The metric dictionary should identify the business meaning, formula, reporting perimeter, currency, source system, frequency, accountable owner, control owner, material exclusions and restatement policy. It should also state whether a measure is an IFRS measure, a management-defined performance measure, another alternative measure, an operating indicator or a planning assumption. Similar language should not imply equivalent accounting status.
IFRS 18 is effective for annual reporting periods beginning on or after 1 January 2027, with earlier application permitted. It introduces defined subtotals in the statement of profit or loss and disclosure requirements for management-defined performance measures, including reconciliation to the most directly comparable IFRS subtotal or total, together with specified explanations.[4][5] An internal management metric is not automatically within the standard's definition. The implementation programme should identify which measures enter public communications and obtain accounting advice on scope, consistency and disclosure.
The perimeter needs equal control. Acquisitions, disposals, new entities, discontinued operations, currency translation, intercompany eliminations and changes in accounting policy can move reported performance without reflecting the operating change management intends to analyse. The dictionary should specify both the statutory perimeter and any like-for-like analytical perimeter, with a bridge between them.
Table 1. Minimum fields for a controlled performance metric
| Field | Required content | Control question | Accountable role |
|---|---|---|---|
| business definition | economic meaning and decision use | Does the measure answer a defined management question? | business and finance owner |
| calculation | numerator, denominator, units and rounding | Can an independent preparer reproduce the result? | finance control owner |
| perimeter | entities, products, channels, customers and periods | Are additions, exclusions and eliminations explicit? | financial controller |
| source and frequency | system, report, cut-off and refresh cycle | Does the source reconcile to controlled records? | data owner |
| evidence class | actual, commitment, forecast, scenario or estimate | Can the reader distinguish observation from assumption? | preparer and reviewer |
| change history | prior definition, reason, authority and effective date | Can later users understand every restatement? | metric custodian |
The fields are illustrative. Accounting and disclosure classification requires entity-specific professional judgement.
Dictionary changes should require an owner, rationale, effective date and effect analysis. The prior definition should remain available. A silent change can create artificial growth, margin improvement or forecast accuracy. A controlled restatement tells users what changed and preserves comparability.
3. Design rolling forecasts around decisions and operating drivers
A rolling forecast extends the view as time passes. Its value comes from updating assumptions and actions, not from moving the end date mechanically. A monthly twelve-month forecast, for example, can add a new month as the current month closes. A quarterly strategic forecast can extend beyond it. A thirteen-week cash forecast can update weekly or more often. The system should join these horizons without forcing every measure into the same level of detail.
The forecast should be driver based where a stable operating relationship can be established. Revenue may depend on price, volume, mix, utilisation, conversion, backlog release and churn. Cost may depend on headcount, capacity, input prices, logistics, productivity and contractual indexation. Working capital may depend on billing events, collection patterns, supplier terms, inventory and project milestones. Capital expenditure may depend on approval gates, construction progress, equipment delivery and commissioning.
Drivers do not remove judgement. A relationship derived from history can fail after a product change, acquisition, supply shock, regulation or competitor action. Management should state the assumption, evidence, range and invalidation condition. The forecast should distinguish data that already exists from management choices that still need approval.
The forecast calendar should sequence operational submissions, treasury updates, finance consolidation, challenge, executive decisions and board reporting. It should align with the accounting close without waiting for every statutory adjustment before management can act. A preliminary operational view can be useful when clearly identified and later reconciled.
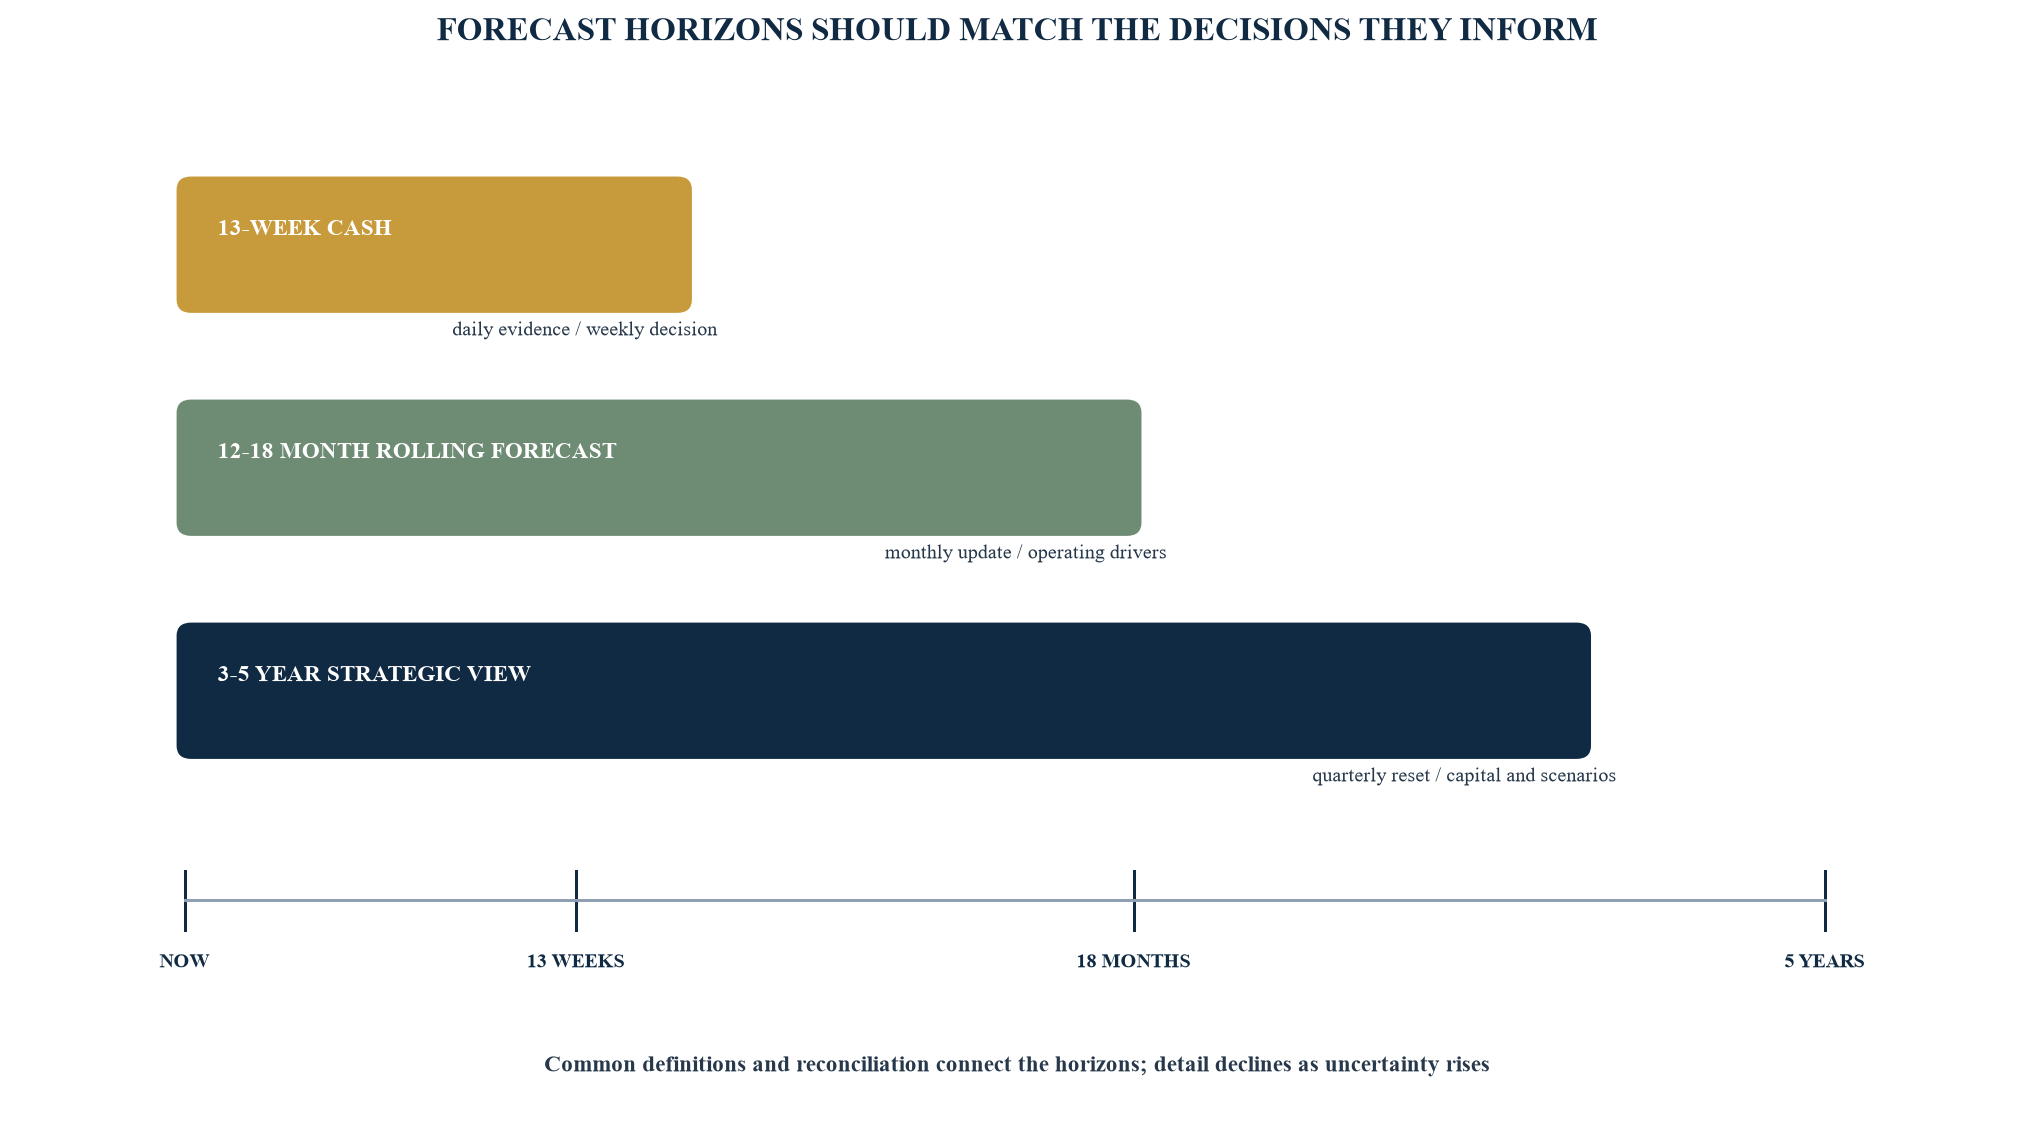
Horizons and frequencies are illustrative. The design should reflect business volatility, financing terms, decision lead times and data quality.
Table 2. Illustrative forecast horizons and decision uses
| View | Typical granularity | Principal decision use | Primary owners |
|---|---|---|---|
| daily liquidity | bank account, major receipt and payment | funding movement, payment timing and immediate exception | treasury and authorised payment owners |
| thirteen-week cash | weekly direct receipts and payments | liquidity headroom, facility use and working-capital action | treasury, finance and business owners |
| rolling operating forecast | monthly drivers, profit, cash and balance sheet | resource, pricing, capacity, cost and near-term capital decisions | business leaders and finance |
| strategic forecast | quarterly or annual scenario ranges | portfolio, financing, capital structure and strategic choices | executive team and board |
| statutory outlook | accounting and disclosure perimeter | going concern, impairment, tax, reporting and disclosure analysis | finance with professional advice |
The cadence is a management example and does not prescribe a universal reporting cycle.
A forecast submission should preserve the prior forecast. Accuracy analysis then separates change caused by new evidence, management action, timing, model error and definition change. The purpose is learning and control. A target that is overwritten each month cannot reveal forecast bias or execution variance.
4. Establish one calendar and one assumption register
The operating calendar coordinates many clocks. Sales pipelines may update daily, projects weekly, payroll monthly, tax periodically and board materials according to a fixed meeting schedule. Financing agreements can have separate testing and reporting dates. The CFO performance system should state the data cut-off and expected freshness for each input, then disclose material stale items.
An assumption register provides the link between operating judgement and financial consequence. It should record the assumption, owner, evidence date, base value, range, affected measures, sensitivity, next review and decision threshold. Examples include price realisation, customer churn, input-cost inflation, utilisation, collection timing, project completion, hiring pace, foreign exchange and interest rates.
The register should distinguish controllable and external assumptions. Management can change price, procurement, capacity or payment discipline within applicable constraints. It cannot control market rates, regulation or customer solvency. The response to an external movement may still be controllable. The system should show both the exposure and the available action.
Forecast challenge should focus on material assumptions. Finance can compare the submitted view with run rates, contracts, order books, operational capacity, historical bias and external evidence. The business owner should explain the mechanism and action. Challenge becomes less useful when it substitutes a central percentage for local evidence without documenting why.
The final forecast should carry an approval state. Draft, challenged, management-approved and board-received versions have different meanings. Every board pack should identify the version, cut-off and subsequent material developments known before issue.
5. Build a direct cash forecast for short-term control
Short-term liquidity control requires a direct view of expected cash receipts and payments. IAS 7 classifies cash flows as operating, investing and financing and permits operating cash flows to be reported using the direct or indirect method. It also requires specified disclosures and reconciliation concerning changes in liabilities arising from financing activities.[6] Management forecasting can use more granular categories while preserving a bridge to controlled accounting and treasury records.
The direct forecast should begin with verified bank balances and available facilities, subject to restrictions, covenants, security, blocked accounts and minimum operating reserves. It then adds dated receipts and payments. Contracted items, purchase orders, payroll, tax, debt service and approved capital expenditure should remain distinct from probability-weighted pipeline items.
Collections require customer-level evidence when concentration is material. A forecast based on average days sales outstanding can conceal a single delayed receipt that determines facility use. Payments should capture contractual date, operational priority, approval status and the legal or commercial consequence of delay. Management should not solve a liquidity gap through undocumented postponement assumptions.
Supplier-finance arrangements can affect how users understand liabilities and liquidity. Amendments to IAS 7 and IFRS 7 apply for annual reporting periods beginning on or after 1 January 2024 and introduce disclosure requirements intended to improve transparency about such arrangements and their effects on liabilities, cash flows and liquidity risk.[7] Treasury and accounting teams should identify relevant arrangements and obtain advice on classification and disclosure.
Table 3. Minimum controls for a thirteen-week direct cash forecast
| Forecast element | Evidence | Minimum control | Exception response |
|---|---|---|---|
| opening cash | bank statements and treasury records | reconcile every account and identify restrictions | investigate unmatched balances immediately |
| customer receipts | invoices, milestones, collection evidence and customer communication | separate committed date from probability assumption | owner, recovery action and revised range |
| supplier payments | approved invoices, purchase orders and contractual terms | identify critical, disputed and deferrable items | assess legal, operational and relationship effect |
| payroll and tax | approved payroll, filings and statutory calendar | named preparer, reviewer and funding date | escalate any funding or compliance risk |
| debt and facilities | executed agreements, notices and lender statements | model interest, principal, fees, availability and tests | obtain financing and legal advice before action |
| capital expenditure | approved commitments, project evidence and delivery dates | distinguish committed, discretionary and cancellable exposure | sequence or pause within authority |
The controls are illustrative and should be adapted to financing documents, payment controls and business volatility.
Forecast variance should be reviewed each week. Timing variance, value variance, missed item and classification error reveal different weaknesses. A late receipt can be a customer issue, a billing issue or a forecasting issue. The action should address the actual cause.
6. Reconcile profit, working capital and cash
Profit and cash answer different questions. Revenue recognition, inventory, accruals, capital expenditure, debt and tax create timing and classification differences. The CFO performance system should therefore maintain an indirect bridge from operating result to cash movement while treasury maintains the direct view. The two should reconcile through the same perimeter and controlled balances.
The bridge should identify EBITDA or another defined starting subtotal, non-cash items, working-capital movement, tax, interest, capital expenditure, financing and other material cash movements. Each line should link to a driver. Receivables can move because of sales growth, billing timing, customer terms, disputes or collection performance. Inventory can move because of demand, purchasing, lead times, safety stocks, obsolescence or project staging. Payables can move because of volume, terms, payment timing or supplier-finance arrangements.
The direct and indirect forecasts will often use different source detail and timing. A reconciliation table should show the difference, owner and resolution date. Persistent unexplained gaps undermine both views and can obscure a funding requirement.
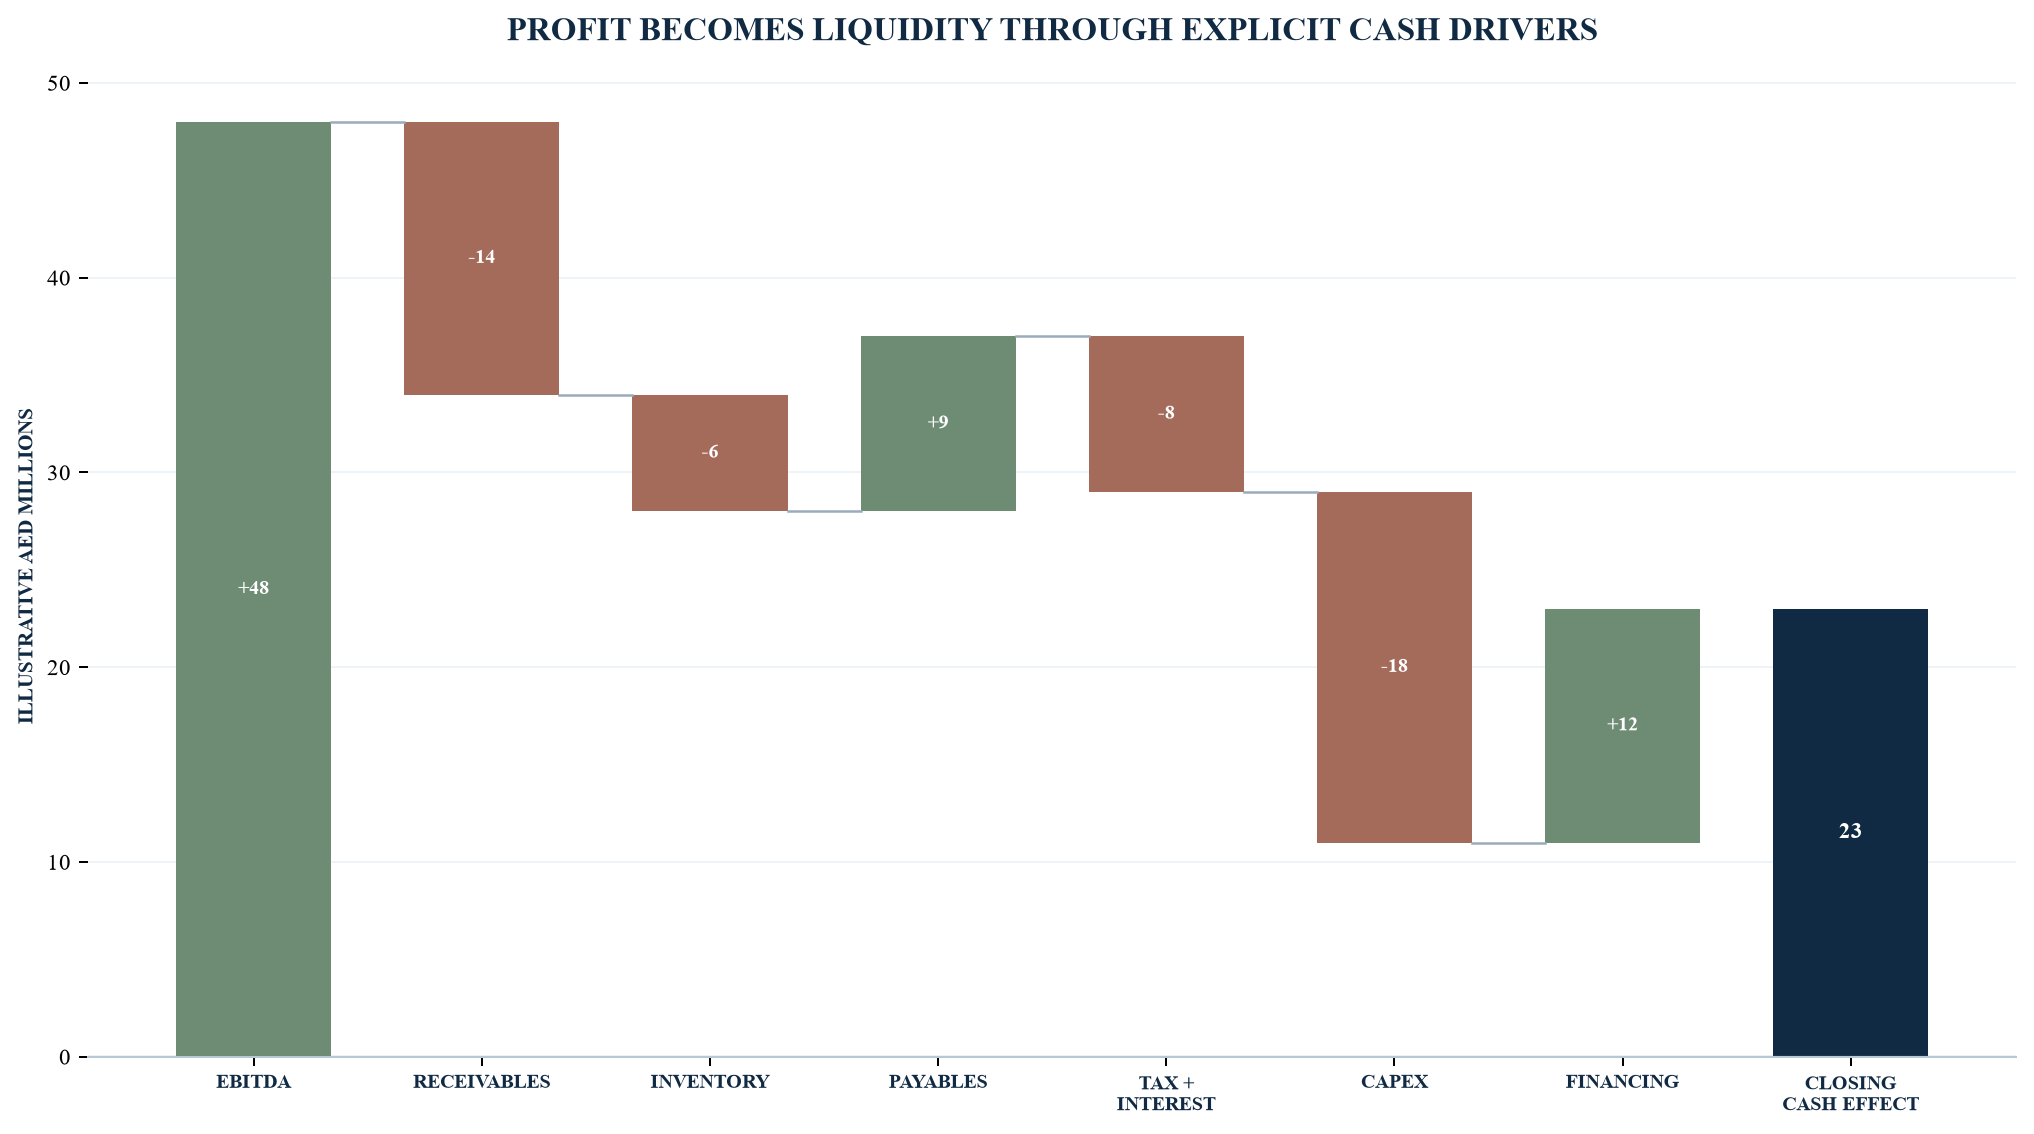
All values are hypothetical management assumptions in AED millions. They do not forecast any entity's performance or liquidity.
The bridge should extend into scenario analysis. A revenue shortfall may have a smaller immediate cash effect if collections relate to earlier sales. A growth scenario may consume cash through inventory and receivables before generating profit. The financing decision requires the timing path, not only the annual result.
7. Diagnose margin through a controlled variance tree
Headline margin movement rarely identifies the action required. The system should separate price, volume, mix, input cost, productivity, yield, utilisation, foreign exchange and one-off effects. The exact decomposition depends on the business model. A project business needs contract and cost-to-complete analysis. A distributor needs product and customer mix. A manufacturer needs volume, yield, scrap, energy and capacity. A service business needs rate, utilisation, delivery mix and subcontracting.
IFRS 15 establishes principles for reporting revenue arising from contracts with customers and uses a five-step model concerning the contract, performance obligations, transaction price, allocation and revenue recognition.[8] IAS 2 addresses measurement and recognition of inventories, including cost and net realisable value.[9] These standards govern financial reporting within their scope. Management variance analysis can use operational detail, but it should reconcile to the reported result and avoid presenting an operational bridge as accounting policy.
Price variance should measure realised price against a controlled comparator after rebates, discounts, credits and mix. Volume variance should use a defined contribution basis. Mix should isolate changes in the composition of products, customers, channels or geographies. Cost variance should separate market price, purchasing, specification, freight, yield and productivity where evidence permits. Residual amounts should be visible rather than allocated arbitrarily.
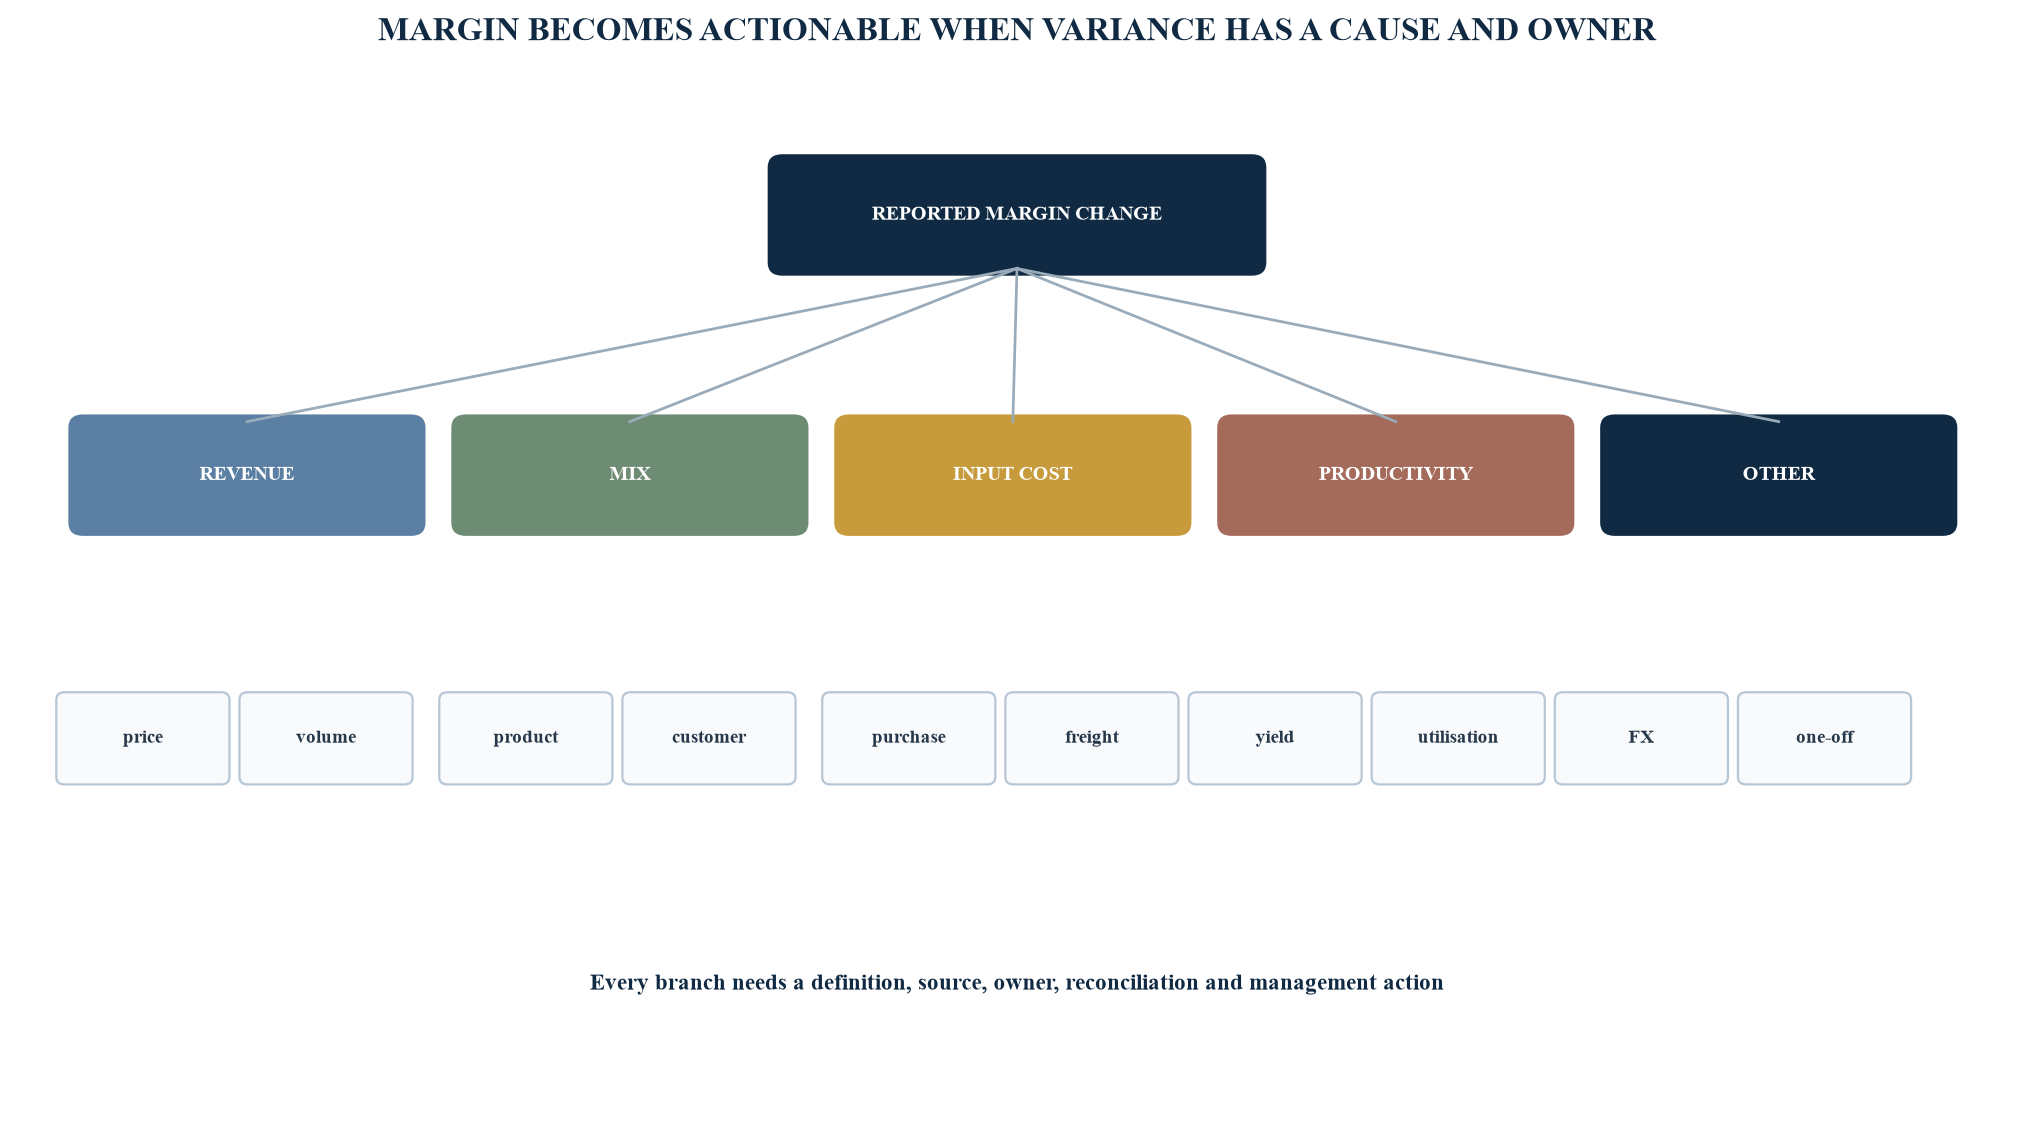
The tree is an illustrative analytical structure. Definitions should reflect the entity's contracts, costing method, operating model and accounting policies.
Table 4. Illustrative margin-variance definitions and actions
| Variance | Controlled comparison | Principal evidence | Typical management question |
|---|---|---|---|
| realised price | net realised unit price versus comparator | invoices, contracts, credits and volume | Did pricing action survive discount and customer response? |
| volume | actual units or service volume versus comparator | fulfilment, delivery and revenue records | Was demand, capacity or conversion responsible? |
| mix | actual portfolio composition versus comparator | product, customer, channel and geography data | Did growth move toward higher or lower contribution activity? |
| input cost | actual input price and landed cost versus comparator | purchase, freight, tariff and energy evidence | Is the change market-driven, negotiated or specification-driven? |
| productivity | output per controlled labour or capacity input | time, throughput, quality and capacity records | Did operating efficiency change after quality and overtime effects? |
| leakage and one-off | residual credits, penalties, waste and exceptional effects | controlled adjustment and incident records | Which preventable losses require an owner and corrective action? |
Entity-specific costing, revenue recognition and operational evidence should determine the final calculation.
Variance analysis should show gross and net action. A price increase can improve realised price while reducing volume or increasing churn. Procurement savings can increase inventory or quality failures. Productivity can improve through deferred maintenance that later harms cash and continuity. The CFO should place linked effects beside the headline variance.
8. Separate actuals, commitments, forecasts and scenarios
Evidence classes should remain visible throughout the system. An actual is an observed amount recorded through a controlled process, subject to later accounting adjustments. A commitment is supported by an executed contract, approved purchase order or other defined evidence, yet timing and performance may still change. A forecast is management's current expectation. A scenario is a conditional model. A target is an intended outcome. These categories should not share the same colour or total without a bridge.
The distinction is especially important in revenue and liquidity. A sales pipeline is not contracted revenue. Contracted revenue may still depend on performance obligations, customer acceptance, billing and collection. An approved facility may be unavailable because of conditions, covenants, security or draw procedures. Cash held in one entity may be restricted or impractical to transfer. The board pack should preserve these constraints.
Management adjustments require an explicit ledger. Each adjustment should state the source number, proposed change, rationale, evidence, preparer, reviewer, affected periods, reversal treatment and whether it changes statutory reporting, management reporting or both. A recurring manual adjustment often identifies a source-system, policy or process weakness that needs remediation.
Scenario models should use the same metric dictionary and opening balances as the base forecast. Otherwise the difference can reflect model construction rather than the scenario. Each scenario should identify the changed assumptions, management actions, timing, constraints and decision thresholds.
9. Convert scenarios into trigger-based action
Scenarios become useful when they are connected to decisions. A base, downside and severe case can display a range, yet management still needs to know what evidence would trigger an action and whether the action can be implemented in time. The trigger should be observable, owned and linked to authority.
ISO 31000 provides principles, a framework and a process for managing risk and emphasises integration into governance, strategy, planning, reporting, policies, values and culture.[10] HM Treasury's Orange Book similarly presents risk management as an integral part of planning, decision-making and performance management and stresses timely, accurate and useful information.[11] These sources support an integrated forecast-risk process rather than a separate risk appendix.
A scenario should test both the shock and the response. A volume decline can be accompanied by pricing, procurement, capacity, working-capital and financing actions. The model should include implementation delay, one-time cost, contractual constraint and second-order effects. A cost reduction that requires severance or supplier termination can worsen short-term cash before improving the run rate.
Table 5. Illustrative scenario triggers and management actions
| Signal | Illustrative trigger | Required evidence | Potential action path |
|---|---|---|---|
| collections | two material receipts move beyond approved tolerance | customer communication, dispute and revised date | senior collection action, billing correction or liquidity response |
| gross margin | adverse price-cost-mix movement persists for two cycles | variance tree and customer or supplier evidence | pricing guardrail, procurement action or portfolio change |
| liquidity | headroom approaches board-approved minimum | direct cash forecast, facility terms and stress result | draw, funding, payment, capex or contingency decision within authority |
| covenant | forecast ratio enters escalation buffer | agreement definition, forecast and sensitivity | lender engagement and financing advice before breach risk matures |
| delivery | critical milestone threatens revenue or cash date | project evidence, dependency and recovery plan | resource reallocation, customer plan or forecast reset |
| control | material reporting or operational control fails | incident evidence, impact and remediation plan | contain, correct, escalate and obtain assurance as required |
Thresholds, actions and timings are hypothetical examples. Each entity should verify authority, feasibility, financing and legal consequences.
Trigger design should avoid false precision. A threshold can be a range with specified judgement. It should also distinguish early warning from action point and breach. The board should know which decisions management can make within delegation and which require further approval.
10. Govern data lineage, adjustments and forecast bias
A decision-grade forecast requires lineage from board number to source and assumption. The system should record the source system, extraction date, transformation logic, manual adjustments, approval and final report location. Data lineage does not need to be technologically elaborate at the outset. It needs to be complete enough for an authorised reviewer to reproduce material numbers.
Access should follow role and sensitivity. Forecasts can contain customer terms, employee plans, pricing, transactions, financing, tax positions and market-sensitive information. Approved systems, named access, version control, retention and change history should replace uncontrolled file circulation where practicable.
Forecast bias deserves a recurring review. Persistent optimism may arise from commercial incentives, slow recognition of delivery constraints or an asymmetric challenge process. Persistent conservatism can distort resource allocation and capital decisions. Accuracy analysis should separate timing, price, volume, mix, cost, working capital, model and definition effects. The purpose is to improve the system and surface judgement, not to punish every forecast miss in a volatile business.
The US Government Accountability Office's Cost Estimating and Assessment Guide describes reliable estimates through practices that include defining purpose and scope, establishing a technical baseline, identifying assumptions, collecting data, selecting methods, conducting sensitivity and risk analysis, documenting the estimate, presenting it for approval and updating it with actual costs.[12] The guide concerns government cost estimates, so its detailed application is context-specific. Its evidence disciplines are useful when management builds material investment, transformation or project forecasts.
The CFO should maintain an issue register for unresolved lineage and control gaps. Each issue should have materiality, affected reports, temporary control, owner and remediation date. A known limitation can be governed. An invisible limitation cannot.
11. Build a board pack around decisions and evidence
The board pack should give directors a coherent view of performance, outlook, liquidity, capital, risk and decisions within the board's remit. It should not reproduce the entire management-reporting environment. The pack should state the reporting perimeter, cut-off, forecast version, key definitions and material subsequent developments.
A useful sequence begins with the decisions and matters for noting. It then presents the executive performance view, rolling forecast, cash and liquidity, margin and operating drivers, capital allocation, principal risks, controls and appendices. The pack should show current actual, prior period, approved comparator, current forecast, prior forecast and scenario range where material. Commentary should explain the cause, consequence, action, owner and timing.
The board should be able to trace a material statement to evidence. That does not require every transaction in the main pack. It requires controlled supporting schedules, reconciliations and access to authorised management when questions arise. Sources should be dated. Adjustments and limitations should be explicit.
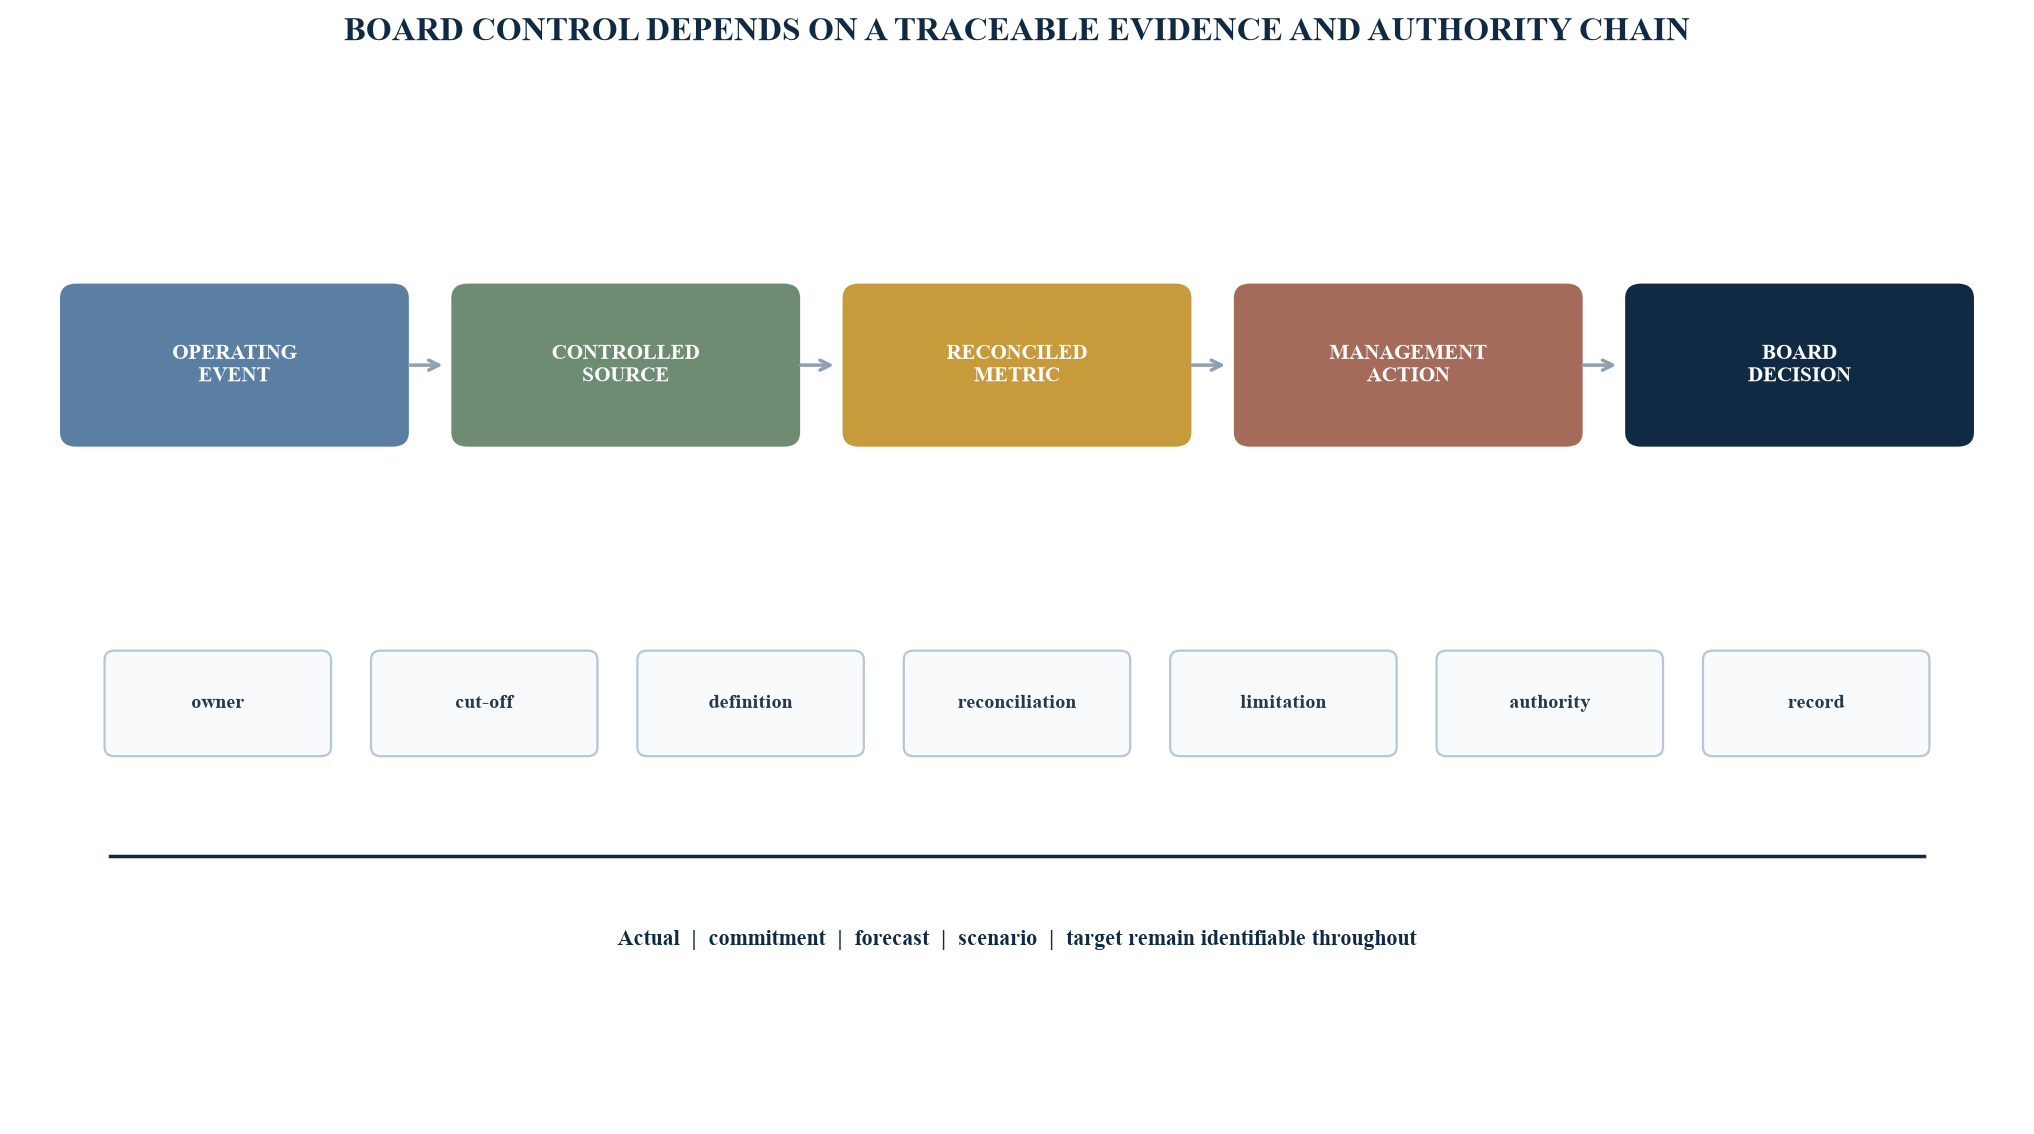
The chain is illustrative. Assurance, disclosure and retention requirements should be determined for the entity and jurisdiction.
The pack should preserve uncertainty. A range can be more decision-useful than a single unsupported point estimate. Sensitivity should identify the assumptions that can move liquidity, covenant headroom, margin or capital need materially. Management's recommended action should still be clear.
IAS 34 specifies minimum content and recognition and measurement principles for interim financial reports within its scope.[13] A board pack is not automatically an interim financial report. Finance should identify any overlap with external reporting, market disclosure, lender reporting or other regulated communication and apply appropriate review and controls.
12. Operate a monthly performance cycle
The monthly cycle should begin with data and assumptions, progress through challenge and decisions, and end with recorded actions. A standard sequence can improve reliability while allowing urgent exceptions to move faster.
Days 1 to 3 focus on preliminary actuals, bank reconciliation, material operational evidence and known adjustments. Treasury updates the cash view. Business owners update principal drivers and commitments. Finance identifies material data or close issues.
Days 4 to 6 complete the controlled close for management purposes, margin decomposition, working-capital analysis and initial forecast consolidation. Forecast owners explain changes from the prior view. Finance challenges evidence, consistency and cross-functional dependencies.
Days 7 to 9 resolve material assumptions and scenarios. The executive team decides actions within its authority. Treasury updates liquidity consequences. Finance records changes, owners and expected timing. Legal, tax, risk, technology, people and other functions review matters within their mandates.
Days 10 to 12 issue the executive pack and prepare board materials where scheduled. The board pack identifies decisions, material uncertainty, liquidity, capital, risks and forecast changes. Supporting schedules remain available for review.
After the meeting, the decision log records the authority, rationale, action, owner and date. The next forecast should reflect approved actions only when their timing and economic consequences are supported. A proposed action remains a scenario or management option until authorised.
13. Apply the framework to an illustrative regional group
Consider a hypothetical multi-country services and distribution group. Management reports annual revenue of AED 900 million and EBITDA of AED 72 million under its illustrative planning assumptions. The group has seasonal working capital, two material customer concentrations, imported inputs, project revenue and a revolving facility. These amounts and facts are hypothetical and do not describe a client or forecast.
The legacy process uses an annual budget, monthly profit report, a separate treasury spreadsheet and a board pack prepared through manual presentation updates. Revenue forecasts use pipeline percentages, margin commentary combines price and mix, and cash forecasting begins after the profit forecast. Definitions differ by business unit.
Management implements a common metric dictionary, an eighteen-month rolling forecast, a thirteen-week direct cash view and a controlled margin tree. The first reconciliation identifies that one business counts unsigned renewals as committed revenue, another excludes freight from product margin, and the treasury view assumes receipt dates that sales has already revised. Correcting the definitions reduces the illustrative base-case EBITDA expectation by AED 6 million and brings forward the expected facility draw by four weeks. These values demonstrate the framework only.
The downside scenario assumes slower collections, an adverse mix shift and higher imported input cost. The model shows a hypothetical AED 22 million reduction in peak liquidity headroom. Management identifies actions involving customer collections, price exceptions, inventory purchases, discretionary capital expenditure and lender engagement. Each action receives a lead time, authority and evidence requirement.
Table 6. Illustrative ninety-day CFO performance-system implementation
| Period | Core work | Controlled output | Executive decision |
|---|---|---|---|
| days 1-15 | charter, perimeter, definitions and source inventory | approved metric dictionary and issue register | confirm scope, owners and priority gaps |
| days 16-30 | forecast drivers, calendar and assumption register | first integrated forecast architecture | approve horizons, cut-offs and challenge process |
| days 31-45 | direct cash model and bank or facility evidence | reconciled thirteen-week liquidity view | set headroom, escalation and contingency rules |
| days 46-60 | margin tree, profit-to-cash bridge and adjustments | controlled variance and cash bridges | assign commercial and operating actions |
| days 61-75 | scenarios, triggers and board-pack prototype | decision-ready forecast and risk view | approve trigger actions and authorities |
| days 76-90 | two live cycles, remediation and handover | operating calendar, logs and evidence repository | accept controls and continuing improvement plan |
Timing and outputs are hypothetical. Actual implementation depends on systems, data, governance, staffing, reporting obligations and business complexity.
After two hypothetical cycles, the group can trace the board view to source data and assumptions. This establishes process evidence. It does not prove that the forecast will be achieved or that the system will improve enterprise value. Results depend on management action, operating conditions, data quality and external events.
14. Implement the system without creating a parallel finance function
The first thirty days should establish the charter, perimeter, dictionary and issue register. Finance should use existing controlled reports where they are adequate. Material gaps should receive temporary controls and remediation owners. The team should avoid building a second ledger merely to accelerate a dashboard.
The next thirty days should connect forecast drivers, cash and margin. Business owners should own operational assumptions. Finance should test reconciliation and economic logic. Treasury should validate balances, facility mechanics and cash timing. The system should expose the differences between the direct and indirect cash views.
The final thirty days should run live cycles, test scenarios, issue the board-pack prototype and correct control gaps. Training should focus on definitions, evidence classes, submission requirements, challenge and decision logging. Documentation should state both the normal cycle and the exception process.
Technology selection can follow the proven workflow. Requirements should include data integration, access, audit history, versioning, scenario management, workflow, reconciliation, security, reporting and export. Automated narrative generation or anomaly detection can assist authorised users when sources, assumptions, review and confidentiality are controlled. Management remains responsible for the forecast and communication.
Success measures should assess the system itself: reconciled source coverage, material adjustment ageing, forecast bias by driver, cash-forecast variance, time spent on data assembly, decision closure and board-paper timeliness. These measures show whether the process is becoming controlled and decision-useful. They do not demonstrate business performance by themselves.
15. Preserve professional, legal and evidential boundaries
The framework is a management architecture. It does not determine accounting recognition, audit evidence, solvency, going concern, directors' duties, tax treatment, covenant interpretation, market disclosure or regulatory compliance. Those conclusions require the applicable standards, agreements, law, facts and professional advice.
Forecasts and scenarios are uncertain. Management should avoid language that turns assumptions into commitments. A model can show internal consistency while using incomplete or incorrect inputs. Sensitivity and reconciliation improve decision quality, yet they cannot establish future performance.
Board information should be complete, balanced and timely within the applicable governance context. Material adverse evidence, control failures and liquidity constraints should remain visible. Positive and negative variances should use consistent definitions. Management should preserve the record of estimates that later proved wrong so the organisation can learn and reviewers can understand the decision made with information available at the time.
The CFO performance system reaches maturity when operating leaders, finance, treasury, executives and the board use the same controlled language while retaining their distinct responsibilities. Forecasts become explicit assumptions. Cash consequences appear early. Margin changes acquire causes and owners. Scenarios lead to authorised actions. Board decisions retain their evidence and rationale.
The system does not remove uncertainty. It makes uncertainty governable. That is the practical contribution of an integrated rolling forecast, cash view, margin tree and board-control process.
References
- OECD, G20/OECD Principles of Corporate Governance 2023, Chapter V: The Responsibilities of the Board. https://www.oecd.org/en/publications/g20-oecd-principles-of-corporate-governance-2023_ed750b30-en/full-report/component-8.html
- Financial Reporting Council, UK Corporate Governance Code 2024. https://www.frc.org.uk/library/standards-codes-policy/corporate-governance/uk-corporate-governance-code/
- Financial Reporting Council, Guidance on Risk Management, Internal Control and Related Financial and Business Reporting, 2024. https://www.frc.org.uk/library/standards-codes-policy/corporate-governance/corporate-governance-code-guidance/
- IFRS Foundation, IFRS 18 Presentation and Disclosure in Financial Statements, issued standard, 2026. https://www.ifrs.org/content/dam/ifrs/publications/pdf-standards/english/2026/issued/part-a/ifrs-18-presentation-and-disclosure-in-financial-statements.pdf?bypass=on
- IFRS Foundation, Effects Analysis: IFRS 18 Presentation and Disclosure in Financial Statements, April 2024. https://www.ifrs.org/content/dam/ifrs/publications/amendments/english/2024/effect-analysis-ifrs18-april2024.pdf
- IFRS Foundation, IAS 7 Statement of Cash Flows. https://www.ifrs.org/issued-standards/list-of-standards/ias-7-statement-of-cash-flows/
- IFRS Foundation, IASB increases transparency of companies' supplier finance, 25 May 2023. https://www.ifrs.org/news-and-events/news/2023/05/iasb-increases-transparency-of-companies-supplier-finance/
- IFRS Foundation, IFRS 15 Revenue from Contracts with Customers. https://www.ifrs.org/issued-standards/list-of-standards/ifrs-15-revenue-from-contracts-with-customers/
- IFRS Foundation, IAS 2 Inventories. https://www.ifrs.org/issued-standards/list-of-standards/ias-2-inventories/
- International Organization for Standardization, ISO 31000 Risk management. https://www.iso.org/iso-31000-risk-management.html
- HM Treasury, The Orange Book: Management of Risk - Principles and Concepts, updated 29 July 2026. https://www.gov.uk/government/publications/orange-book/the-orange-book-management-of-risk-principles-and-concepts
- United States Government Accountability Office, Cost Estimating and Assessment Guide, GAO-20-195G, March 2020. https://www.gao.gov/products/gao-20-195g
- IFRS Foundation, IAS 34 Interim Financial Reporting. https://www.ifrs.org/issued-standards/list-of-standards/ias-34-interim-financial-reporting/
- Committee of Sponsoring Organizations of the Treadway Commission, Enterprise Risk Management: Integrating with Strategy and Performance. https://www.coso.org/enterprise-risk-management
- IFRS Foundation, Module 7 Statement of Cash Flows, supporting material for the IFRS for SMEs Accounting Standard, 2025. https://www.ifrs.org/content/dam/ifrs/supporting-implementation/smes/2025-modules/module-7.pdf
About the Author
Chennakeshav Adya is an independent researcher whose work focuses on corporate finance, value creation, private capital and transaction execution. His research translates financial, commercial and operating evidence into decision frameworks for boards, investors and management teams.
Appendix A: CFO performance-system design checklist
- Confirm the governance charter, reporting perimeter, planning horizons and decision authorities.
- Establish a controlled metric dictionary with formulas, sources, owners, evidence classes and change history.
- Connect the rolling operating forecast, direct cash view, indirect cash bridge and margin variance tree.
- Maintain an assumption register, adjustment ledger, forecast-version history and issue register.
- Define scenario triggers, authorised actions, lead times and escalation routes.
- Build the board pack around decisions, material evidence, uncertainty, liquidity, capital, risks and actions.
Appendix B: Monthly close, forecast and board-control checklist
- Reconcile bank balances, controlled actuals and material operational evidence at the agreed cut-off.
- Preserve the prior forecast and explain changes by driver, timing, action, model and definition.
- Review direct cash, profit-to-cash and facility or covenant effects through the required professional lens.
- Separate actuals, commitments, forecasts, scenarios and targets throughout reporting.
- Record adjustments, limitations, decisions, owners, deadlines and subsequent developments.
- Retain supporting reconciliations and source evidence under approved access and retention controls.
