

1. Make the successful outcome the economic unit
An AI application creates value when a customer receives the contracted result at the required quality, latency, reliability and risk level. A token is one input to that result. A request is one step in the workflow. Neither measure establishes customer value on its own.
A research product may charge for a completed and cited report. A customer-service agent may charge for a resolved case. A coding product may charge per seat while consuming compute per suggestion, repository scan and agent run. A document platform may charge for each valid extraction. The unit should follow the customer promise and revenue model.
The margin ledger begins with billed and collected revenue for the outcome. It then assigns every directly attributable delivery cost. The result is compute contribution margin by customer, product, workflow and cohort.
This approach allows different technical architectures to be compared on a common commercial basis. A more expensive model can produce a lower cost per successful outcome when it needs fewer retries and less review. A smaller model can create superior economics for a bounded task when its quality and reliability remain within the approved envelope.
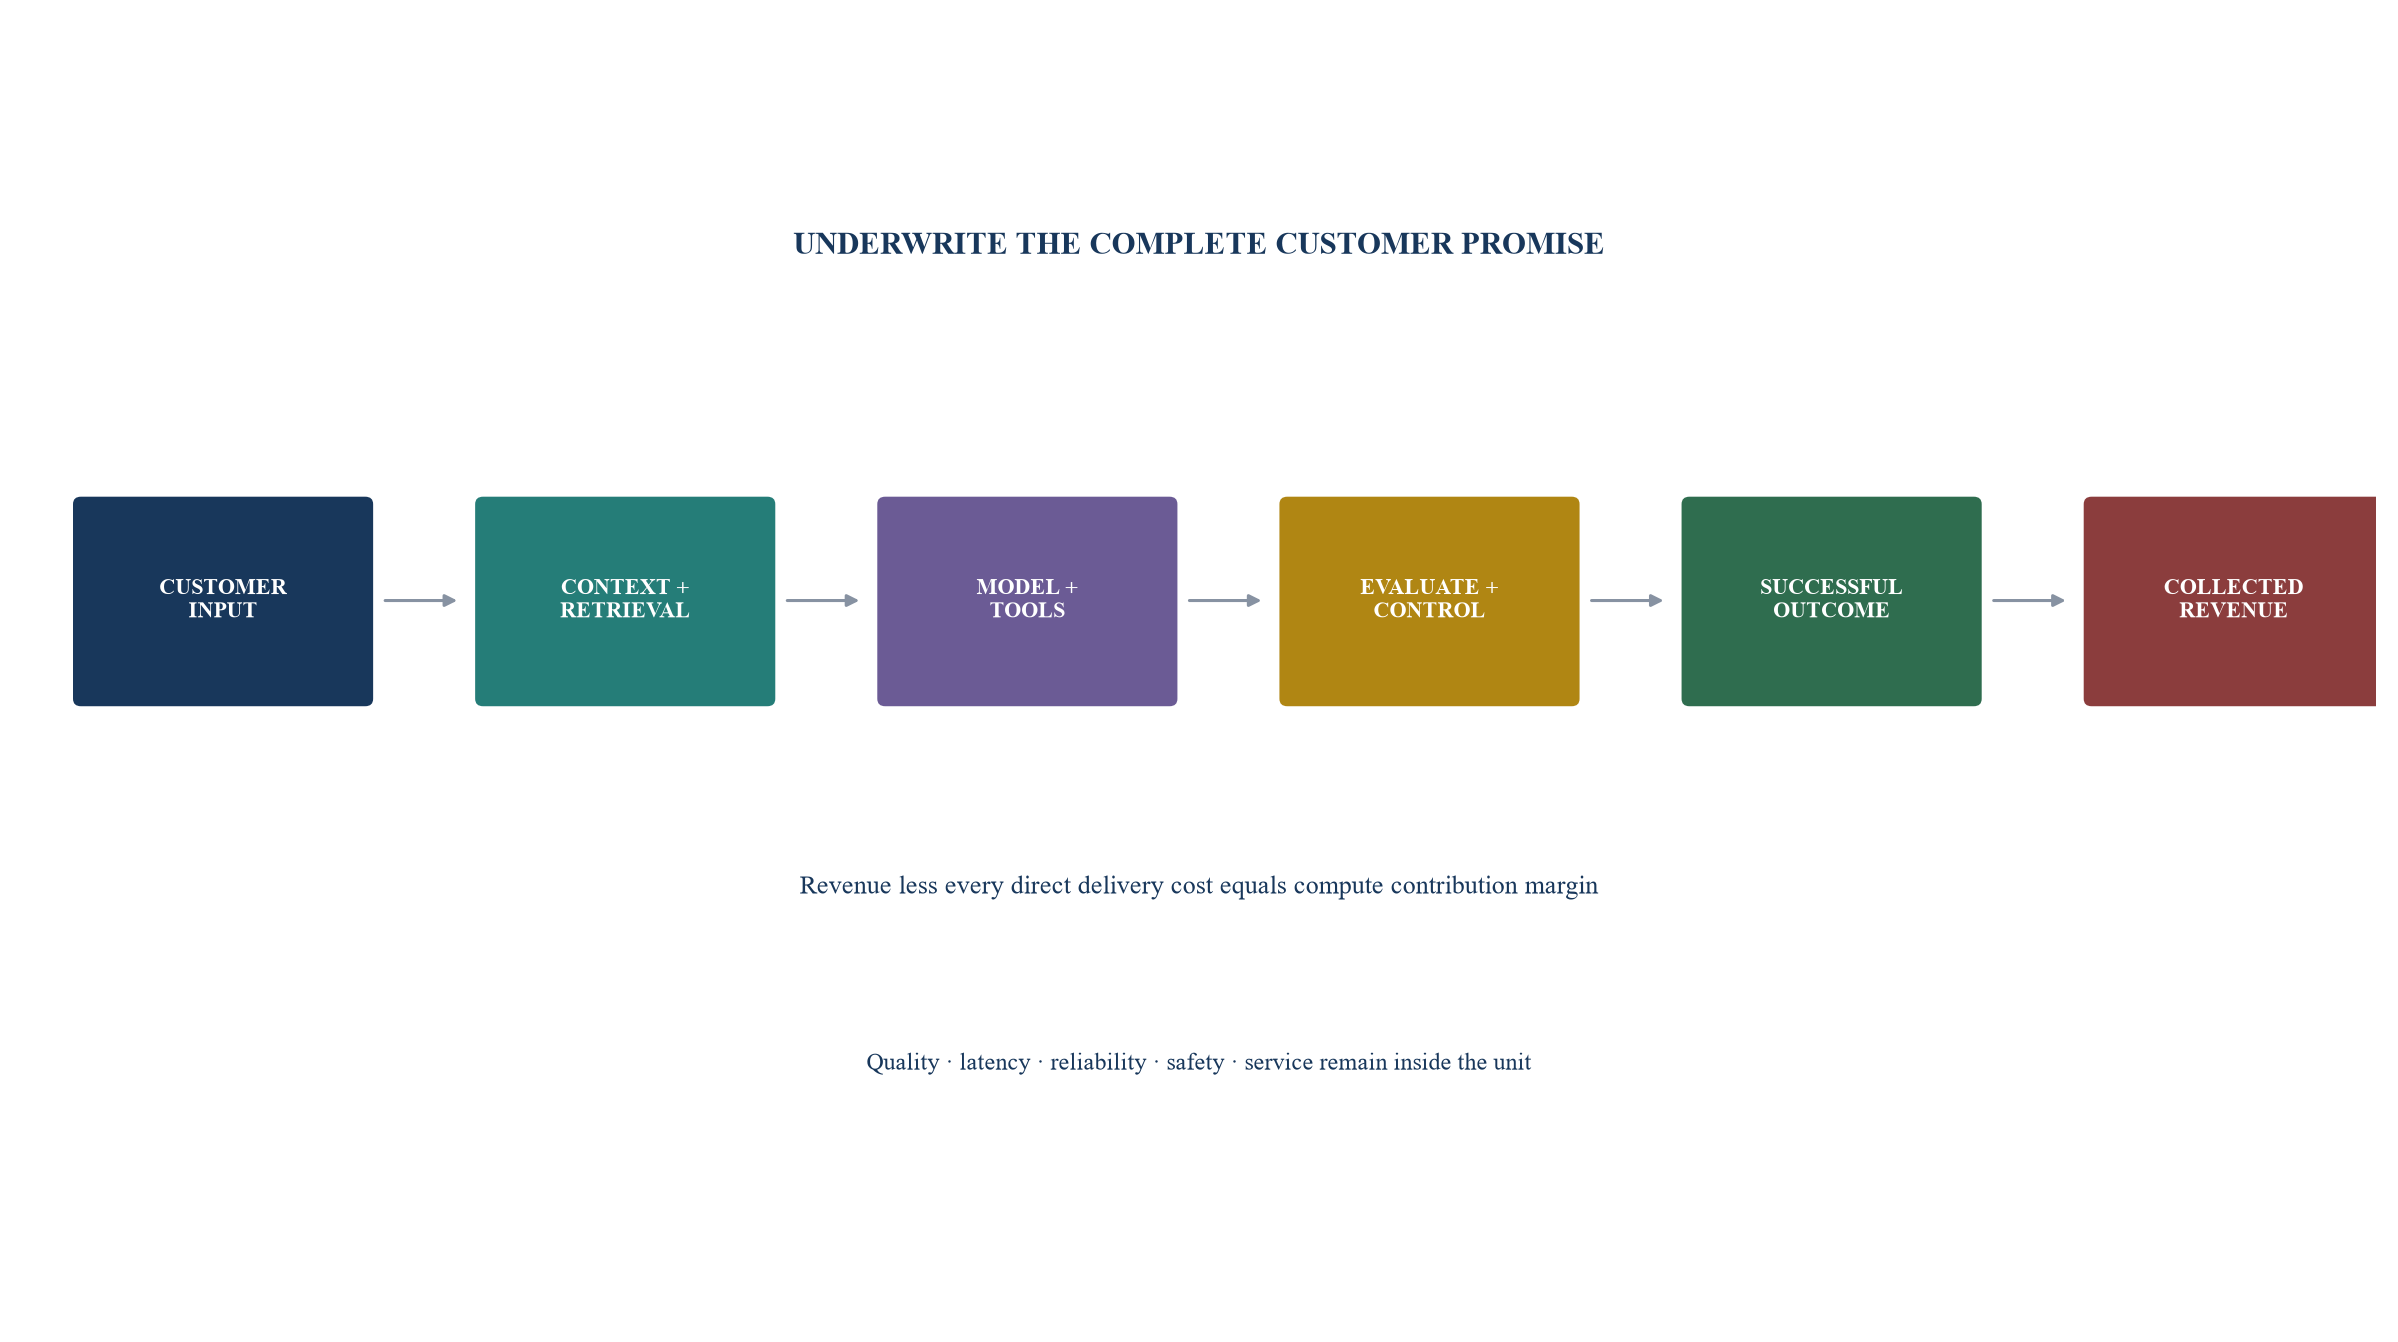
Author framework. The boundary follows the complete delivered service.
2. Read provider prices as a menu of production choices
Official model and cloud pricing pages describe several charging mechanisms. Token-metered services can price input, cached input and output separately. Audio, image, video, embeddings, search, storage and tools can use different units. Rates also vary by model and service tier.[1]
OpenAI's Batch API states that eligible asynchronous requests complete within 24 hours at a 50 per cent discount.[2] Amazon Bedrock states that selected foundation models receive a 50 per cent batch discount relative to on-demand inference.[3] These services suit workloads that can tolerate delayed completion and meet the applicable limits.
Google Cloud describes context caching as reuse of precomputed input. Its October 2025 product guidance states that supported Gemini models can charge cached input at 10 per cent of the standard input-token cost, alongside storage charges for explicit caches.[4] The economic benefit depends on repeated eligible context and cache utilisation.
Microsoft Foundry distinguishes token-based pay-as-you-go usage from provisioned throughput. Provisioned throughput units are billed on allocated capacity, whether or not requests consume the full allocation.[5] A reserved service can improve performance predictability and create utilisation risk.
Anthropic's published list-price document separates base input, output, cache write, cache hit and batch prices for each model and service scope.[6] The applicable price at the transaction date, region and account remains the source of truth.
The underwriting model should preserve the exact provider, model, version, region, tier, meter, discount and contract term behind every cost assumption.
3. Define the complete cost stack
Model inference is one layer. Retrieval can add embeddings, vector search, reranking, document parsing and storage. Agentic workflows can add web search, code execution, browser or computer control, external APIs and repeated planning calls.
Multimodal applications can incur speech recognition, text-to-speech, image, video and optical-character-recognition costs. Data transfer and private connectivity can matter at enterprise scale.
The direct service layer includes observability, evaluation, guardrails, moderation, audit logs, incident handling and customer-specific environments. Human review becomes cost of delivery when it is required to produce the contracted output.
Support should be classified consistently. Technical account management dedicated to a customer or workflow can belong in contribution margin. General corporate success and sales may remain operating expense. The policy should be documented and applied across periods.
| Measure | Definition | Source | Underwriting use |
|---|---|---|---|
| Successful outcome | delivered unit that passes the contracted product, quality and control criteria | product event plus evaluation record | common denominator for cost and revenue |
| Attempt | workflow execution initiated for an eligible input | orchestration telemetry | identifies volume and retry load |
| Success rate | successful outcomes divided by eligible attempts | telemetry and evaluation | converts request cost into outcome cost |
| Input units | billable input tokens, characters, seconds, pixels or other provider meter | provider usage file | reconciles consumed context to invoice |
| Output units | billable generated units under the provider meter | provider usage file | measures output intensity and control |
| Tool calls | search, retrieval, code, data, API or other paid actions | orchestration log and vendor invoice | captures non-model variable cost |
| Direct review minutes | human time required for delivery or quality acceptance | workflow or time record | captures service labour inside margin |
| Compute contribution margin | collected or recognised revenue less direct delivered-service cost under the stated policy | finance ledger and product allocation | evaluates product and cohort economics |
| Quality pass rate | outcomes meeting the defined evaluation threshold | versioned evaluation suite | prevents cost optimisation from degrading value |
| Service attainment | outcomes delivered within latency, availability and reliability commitments | monitoring and support records | prices performance and penalty exposure |
The company should define each measure once and reconcile it to systems of record.
| Cost layer | Typical meter | Evidence | Optimisation lever |
|---|---|---|---|
| Foundation model | input, cached input, output, request or provisioned capacity | provider usage and invoice | routing, smaller model, context control, caching, batching and commitment |
| Retrieval and data | embedding, index, query, reranking, storage and database compute | platform telemetry and invoice | chunking, index design, selective retrieval and retention |
| Tools and agents | search, browser, code execution, external API and repeated steps | trace and vendor invoice | tool policy, deterministic steps, call limits and workflow redesign |
| Multimodal processing | audio minute, image, frame, page, character or token | provider telemetry | preprocessing, modality choice, compression and selective analysis |
| Infrastructure | CPU, accelerator, memory, storage, network, egress and private link | cloud bill and allocation tags | autoscaling, utilisation, architecture, region and reservation |
| Evaluation and safety | evaluator calls, filters, classifiers, red teaming and audit storage | evaluation log and invoice | risk-tier evaluation, local classifiers and targeted testing |
| Observability and reliability | traces, logs, metrics, queue, retry and failover | monitoring and cloud bill | sampling, retention, retry control and root-cause reduction |
| Direct service labour | review, exception handling, implementation and dedicated support | workflow and payroll allocation | product improvement, automation and contract design |
Inclusion depends on the service and accounting policy; consistent application is essential.
4. Reconcile the provider invoice to product telemetry
The provider invoice establishes billed consumption. Product telemetry explains which customer, feature and outcome caused it. Investors need both.
The reconciliation should join request or batch identifiers, model, version, timestamp, account, region, product event, customer, workflow, outcome, retry and quality result. Some provider cost reports aggregate usage and may not expose a request identifier. AWS documentation notes that its Bedrock cost and usage report aggregates by usage type and operation and does not carry a per-request identifier.[7]
The company therefore needs its own usage ledger. It can apply contracted meter rates to detailed telemetry and reconcile the aggregate to the invoice. Differences should be investigated and retained as allocation variance until resolved.
Version changes, price changes, negotiated discounts, free credits and committed capacity require separate treatment. Promotional credits can improve reported cash and hide mature unit cost. Underwriting should show economics before credits and after contractual discounts.
5. Measure the request-to-outcome funnel
An incoming task can be rejected, filtered, abandoned, retried, escalated or completed. Every branch changes cost per successful outcome.
The success denominator should exclude invalid or out-of-scope inputs under a documented rule. It should retain product failures, timeouts and quality failures that the customer expected the service to handle.
Retries deserve specific attention. A declining per-token price can coincide with increasing total cost when agent loops, timeouts or quality failures trigger additional calls. The trace should state why each retry occurred.
Human escalation can preserve customer value. It should enter the direct-cost ledger and success metric. An automation rate can look high while the expensive or risky cases consume most service labour.
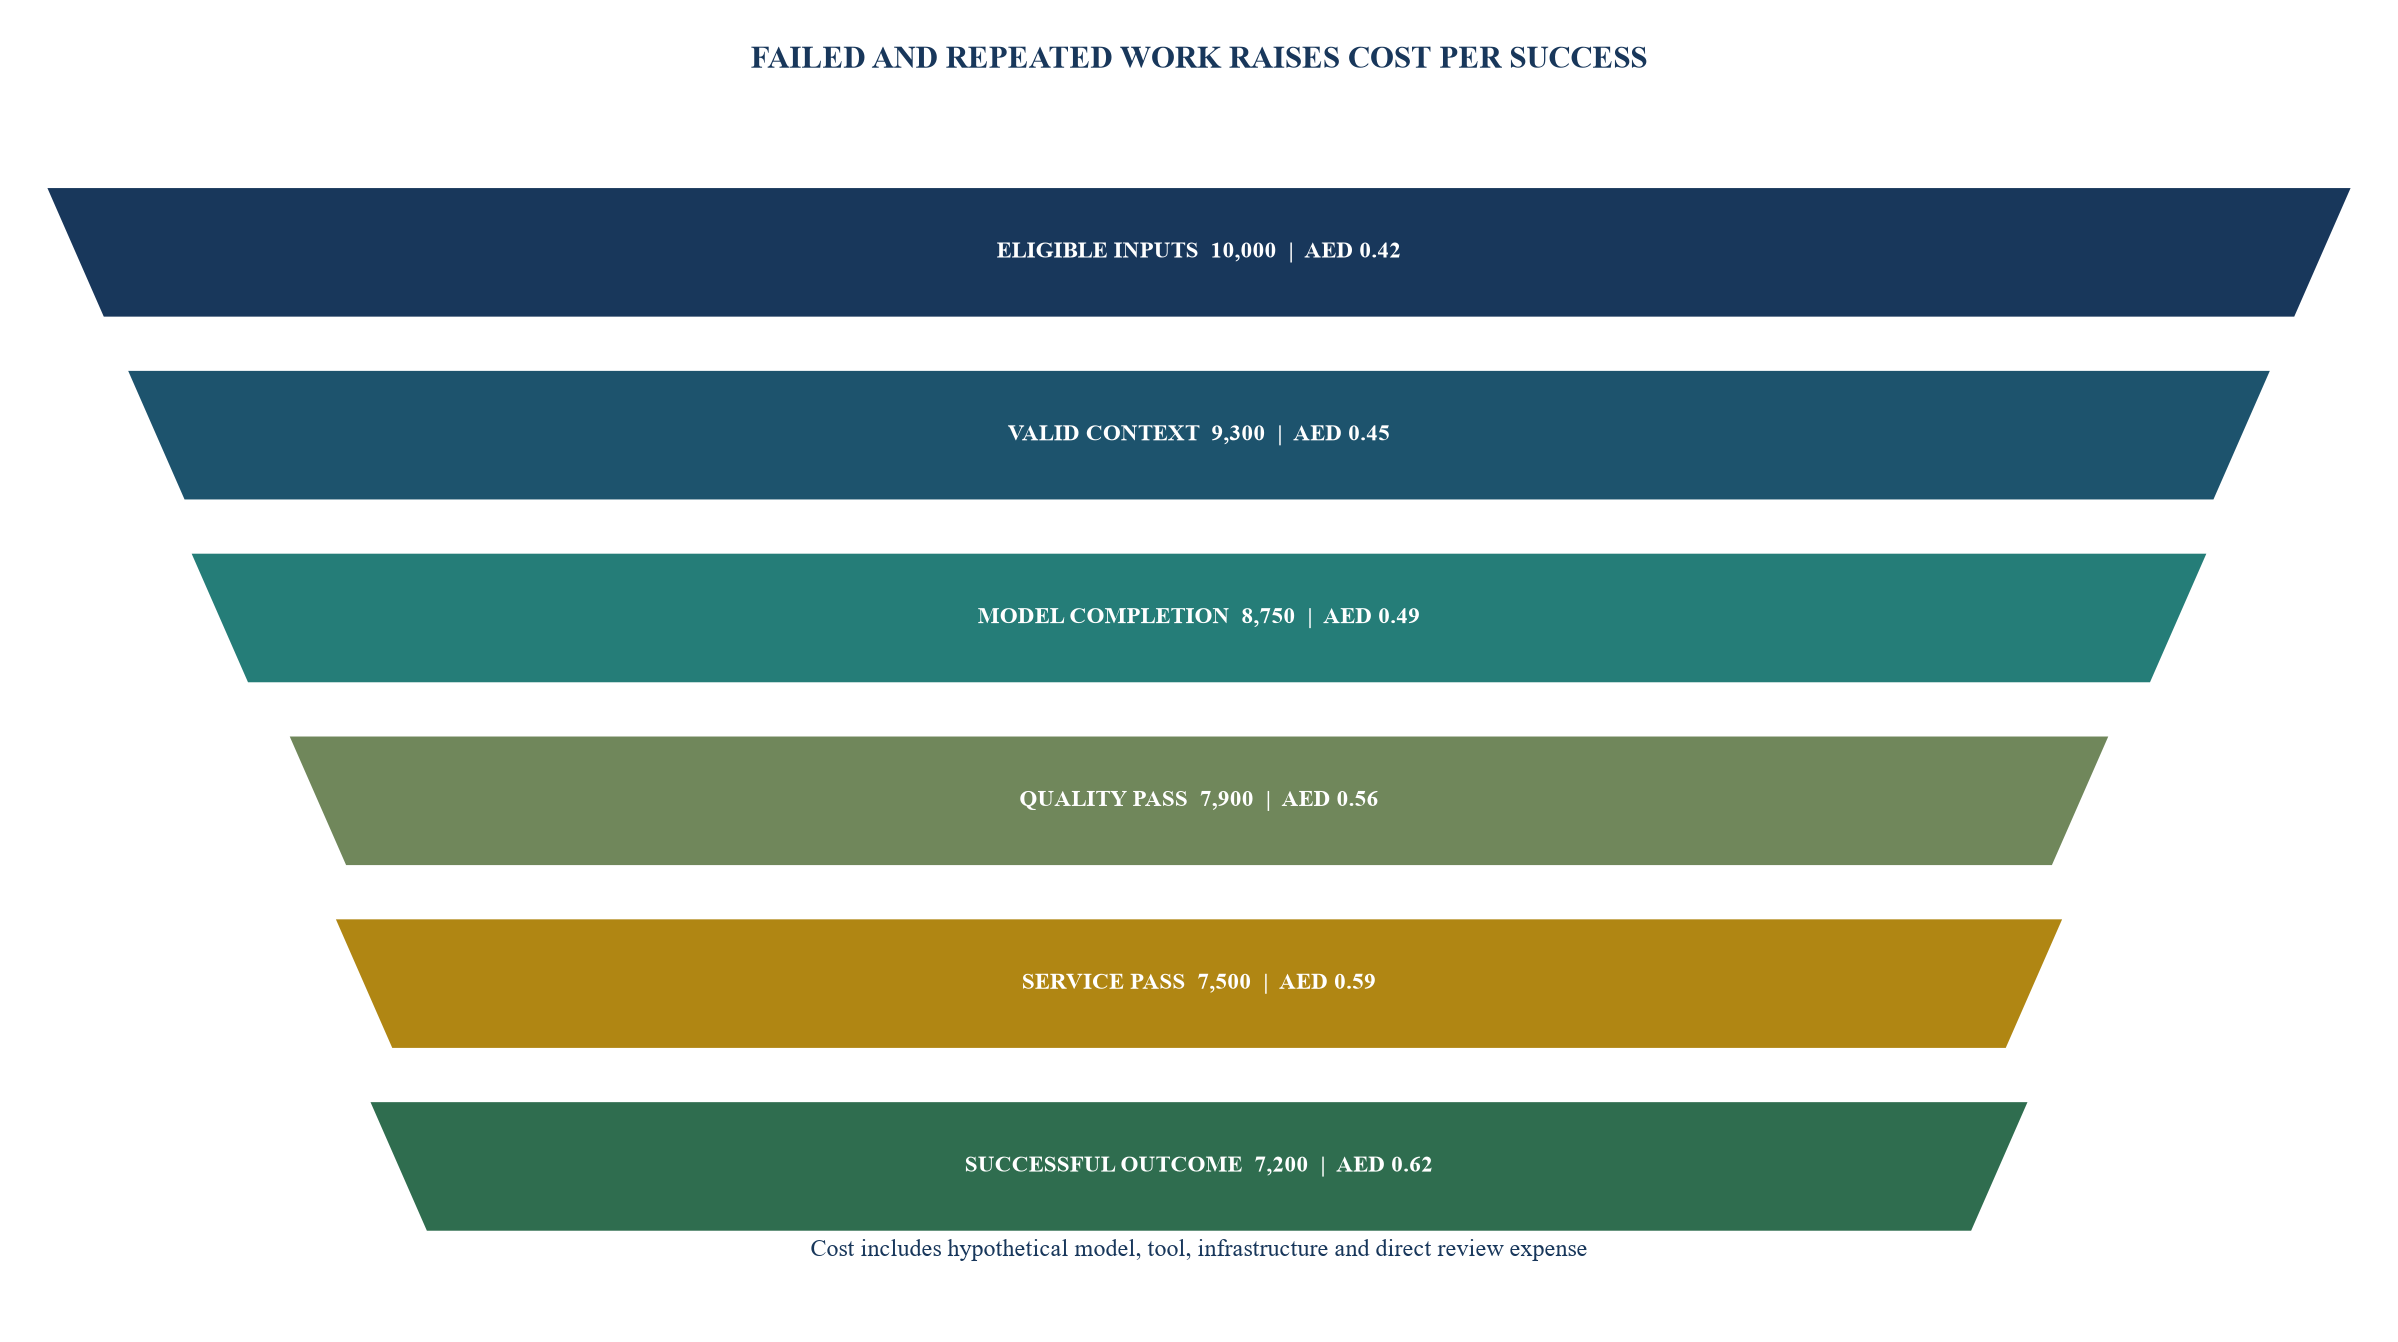
Every volume and cost is a hypothetical management assumption for method illustration.
6. Price quality, latency and reliability into the architecture
MLCommons' MLPerf Inference Datacenter suite defines workload-specific datasets, quality targets, load scenarios, latency constraints and throughput metrics.[8] The benchmark design illustrates an important financial principle: performance comparisons require a defined workload and quality target.
A startup should maintain a representative evaluation set for each material workflow and customer segment. The set should include routine, difficult, adversarial and failure cases. It should be versioned and protected from contamination.
Latency has economic value when the contract or product experience requires it. A real-time clinical support or fraud workflow has a different service envelope from overnight document processing. Priority service can carry a premium; batch service can carry a discount.
Reliability includes provider availability, quotas, timeout, failover, data dependencies and tool behaviour. The architecture should state which failure modes trigger another model, deterministic fallback, queue or human escalation.
7. Route by task, risk and service envelope
Model routing assigns each workload to an approved model and deployment path. The policy should consider quality, modality, context, latency, privacy, region, tool support, availability and cost.
A routing system needs control. Dynamic routing can shift behaviour after a provider or model change. The company should validate candidates, approve thresholds, monitor drift and retain the ability to reverse a change.
Smaller or specialised models can handle classification, extraction, ranking and bounded generation. Larger models can support complex synthesis or exception handling. Deterministic code can replace a model step where the rule is stable and testable.
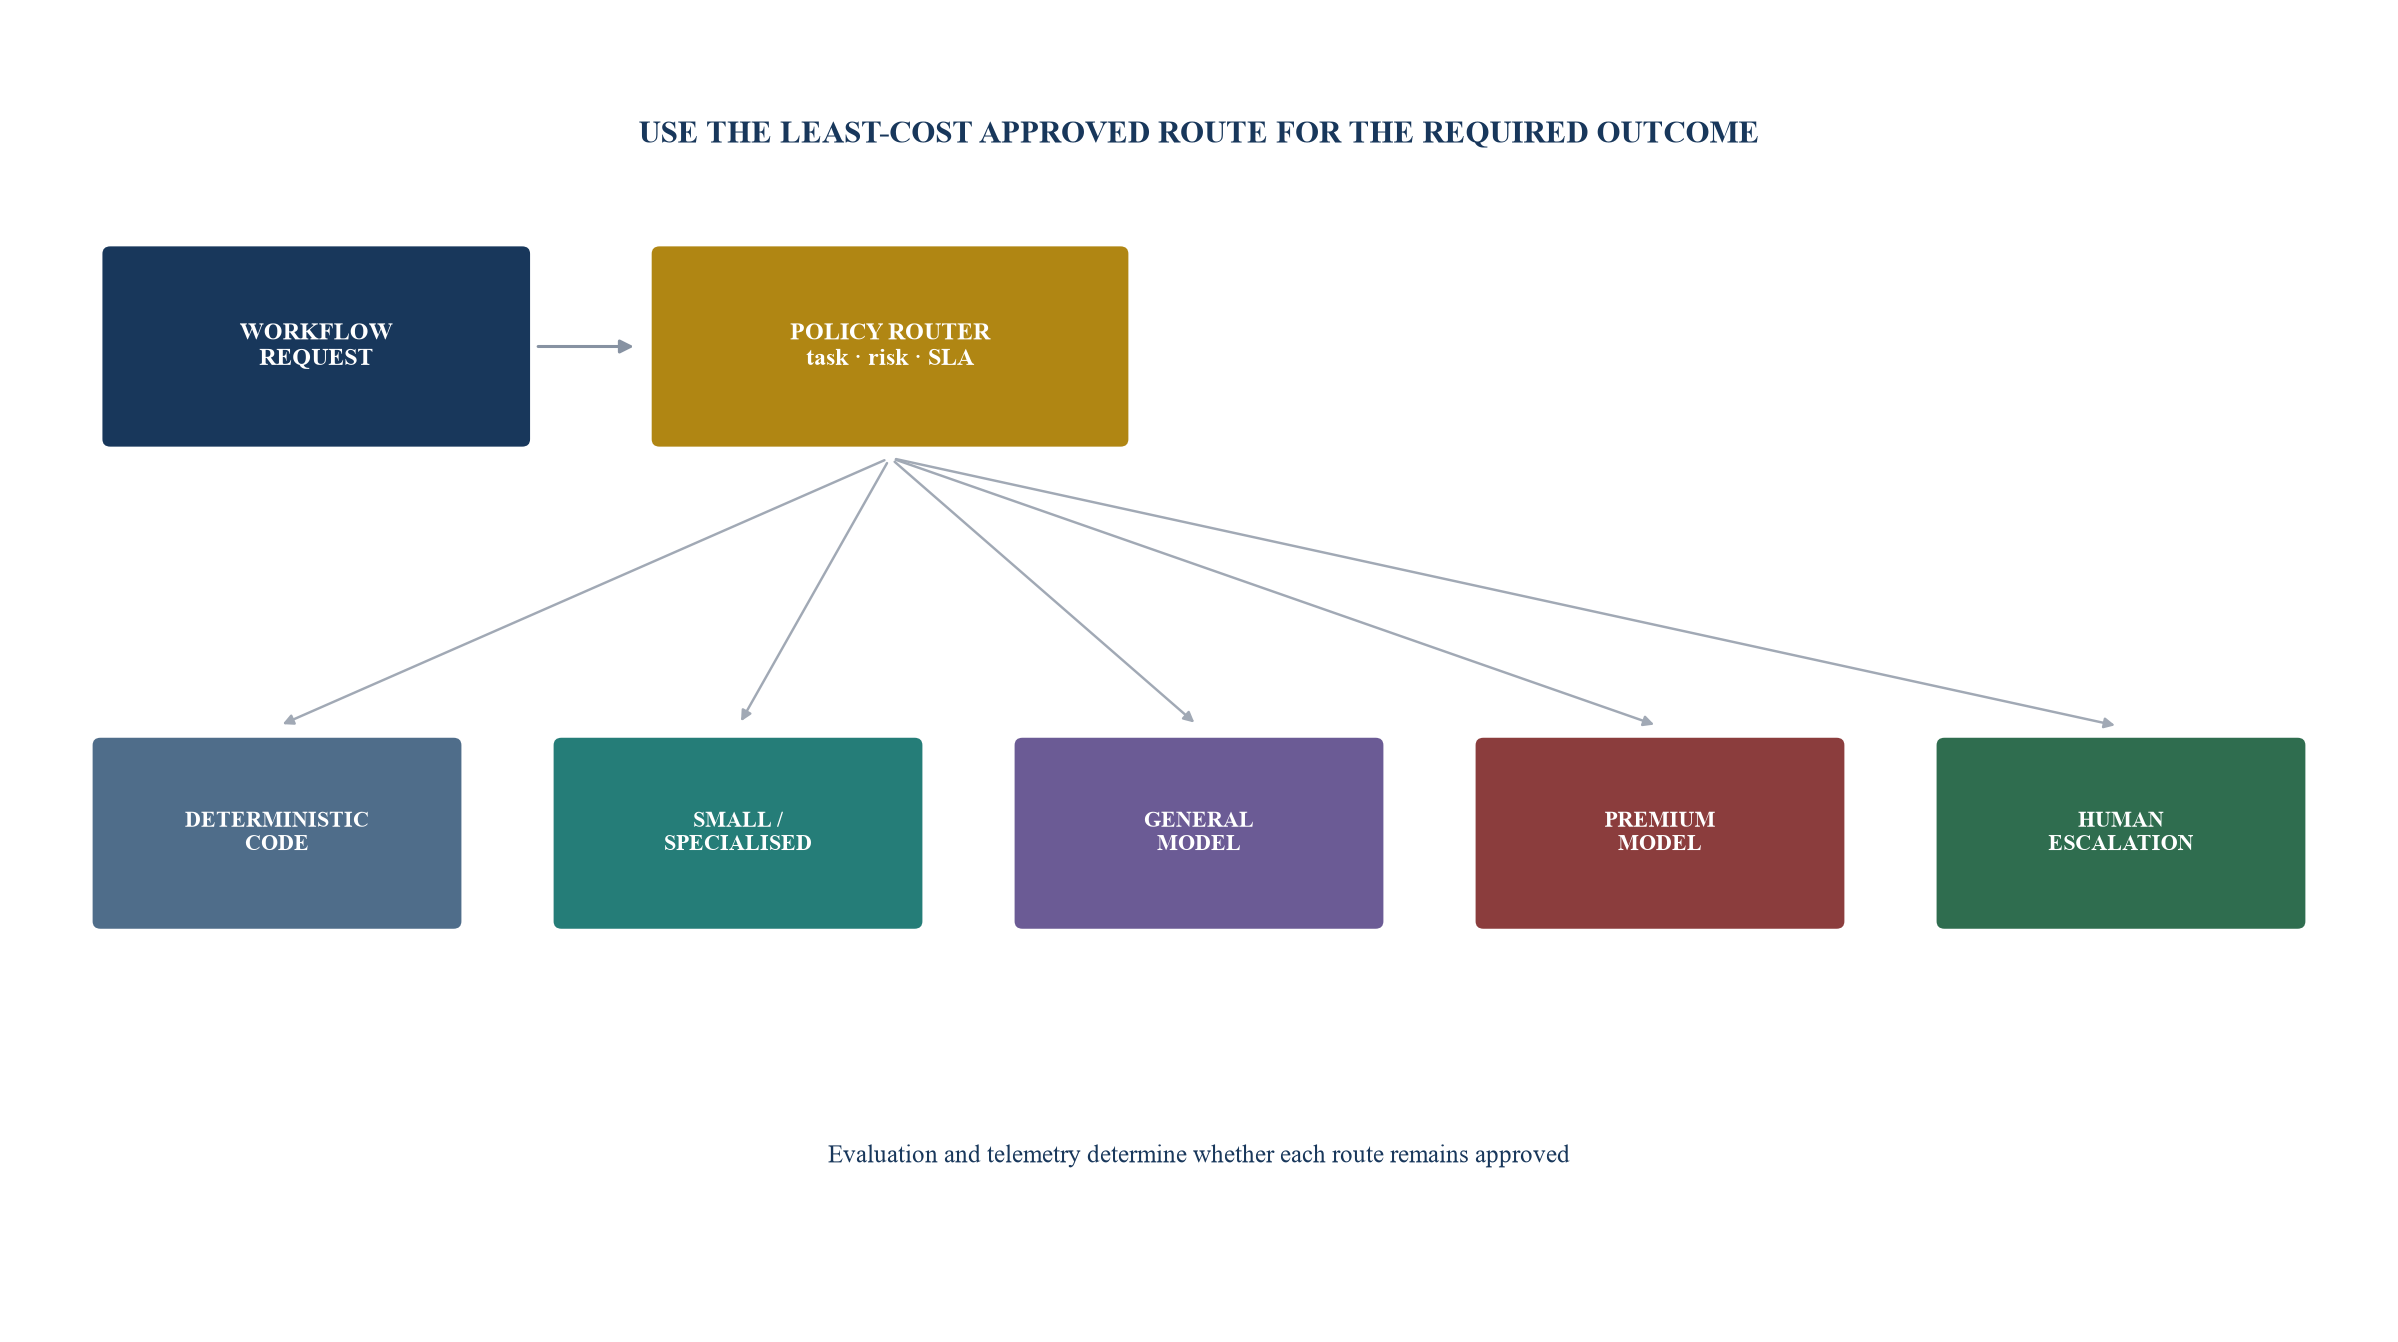
Author framework. Every route remains subject to quality, service, data and risk approval.
| Dimension | Evidence | Routing question | Control |
|---|---|---|---|
| Task quality | versioned evaluation by task and customer segment | which candidates meet the approved pass threshold? | pre-deployment gate and continuous sample evaluation |
| Latency | percentile end-to-end latency under representative load | which route meets the service commitment? | route-specific limit, timeout and fallback |
| Reliability | completion, error, quota and failover outcomes | can the route sustain required availability? | health monitoring, provider fallback and queue policy |
| Data and region | input category, retention, processing location and contract | which route can lawfully and contractually process the input? | data classifier and approved endpoint register |
| Tool capability | tool accuracy, permissions and side effects | which route can complete the workflow safely? | allowlist, limits, confirmation and audit trace |
| Unit cost | reconciled cost per successful outcome | which approved route creates the strongest contribution margin? | pricing ledger and cohort monitoring |
| Change risk | model version, provider terms, deprecation and behaviour drift | how will a route change be tested and approved? | version pinning where available, regression test and rollback |
Weights and thresholds are product-specific and require validation.
8. Control context before negotiating price
Long context can improve performance and create large recurring input bills. The product should identify which information is required for each step.
Retrieval should select relevant material, preserve provenance and avoid repeated payload. Prompt templates should separate stable instructions from variable data. Stable eligible content can support caching where the provider terms, privacy requirements and economics fit.
Conversation history can grow silently. Summarisation can reduce length and lose detail. The company should test both quality and cost. A policy can cap history, retrieve prior facts and preserve audit-required records outside the prompt.
Output also requires control. Maximum length, structure and stopping criteria reduce cost and latency. They should remain aligned with customer value.
9. Choose pay-as-you-go, batch or capacity with utilisation evidence
Pay-as-you-go transfers utilisation risk to the provider and supports uncertain demand. Batch can reduce unit rate for delay-tolerant work. Provisioned capacity can support predictable throughput and service levels when utilisation is sufficient.
The break-even calculation should use accepted output, peak-to-average load, queue tolerance, contract period and fallback. A capacity commitment that is 40 per cent utilised carries a different cost per outcome from the quoted capacity price.
Microsoft states that provisioned throughput is billed on deployed units rather than token consumption.[5] Google Cloud publishes weekly, monthly, quarterly and annual provisioned-throughput choices for supported services.[9] AWS offers standard, priority, flex and reserved service tiers for supported Bedrock workloads.[10]
The investment model should show committed spend, consumed capacity, unused capacity and spillover. Commitments also create counterparty and model-version exposure.
10. Separate technical optimisation from economic capture
A cost reduction creates value only when it improves cash, capacity or customer economics. A faster model can be absorbed by more agent steps. A cheaper model can encourage longer outputs. A caching improvement can be offset by storage and low reuse.
The ledger should bridge the change from technical metric to financial result. For example: input tokens decline, provider invoice falls, outcome success remains stable, direct review falls or remains stable, and contribution margin improves.
Savings can also support lower price or additional product capability. The company should state where the value goes. An investor cannot assume that every technical saving becomes margin.
11. Build a compute-gross-margin waterfall
Revenue should be recognised consistently with the contract and accounting policy. Usage credits, subscriptions and enterprise commitments can produce different timing from compute consumption.
Direct costs should be classified consistently. Model, retrieval, tools, dedicated infrastructure, evaluation and required review form the core. Customer implementation may be capitalised, expensed or included in service margin depending on policy and facts; the underwriting view should expose the cash.
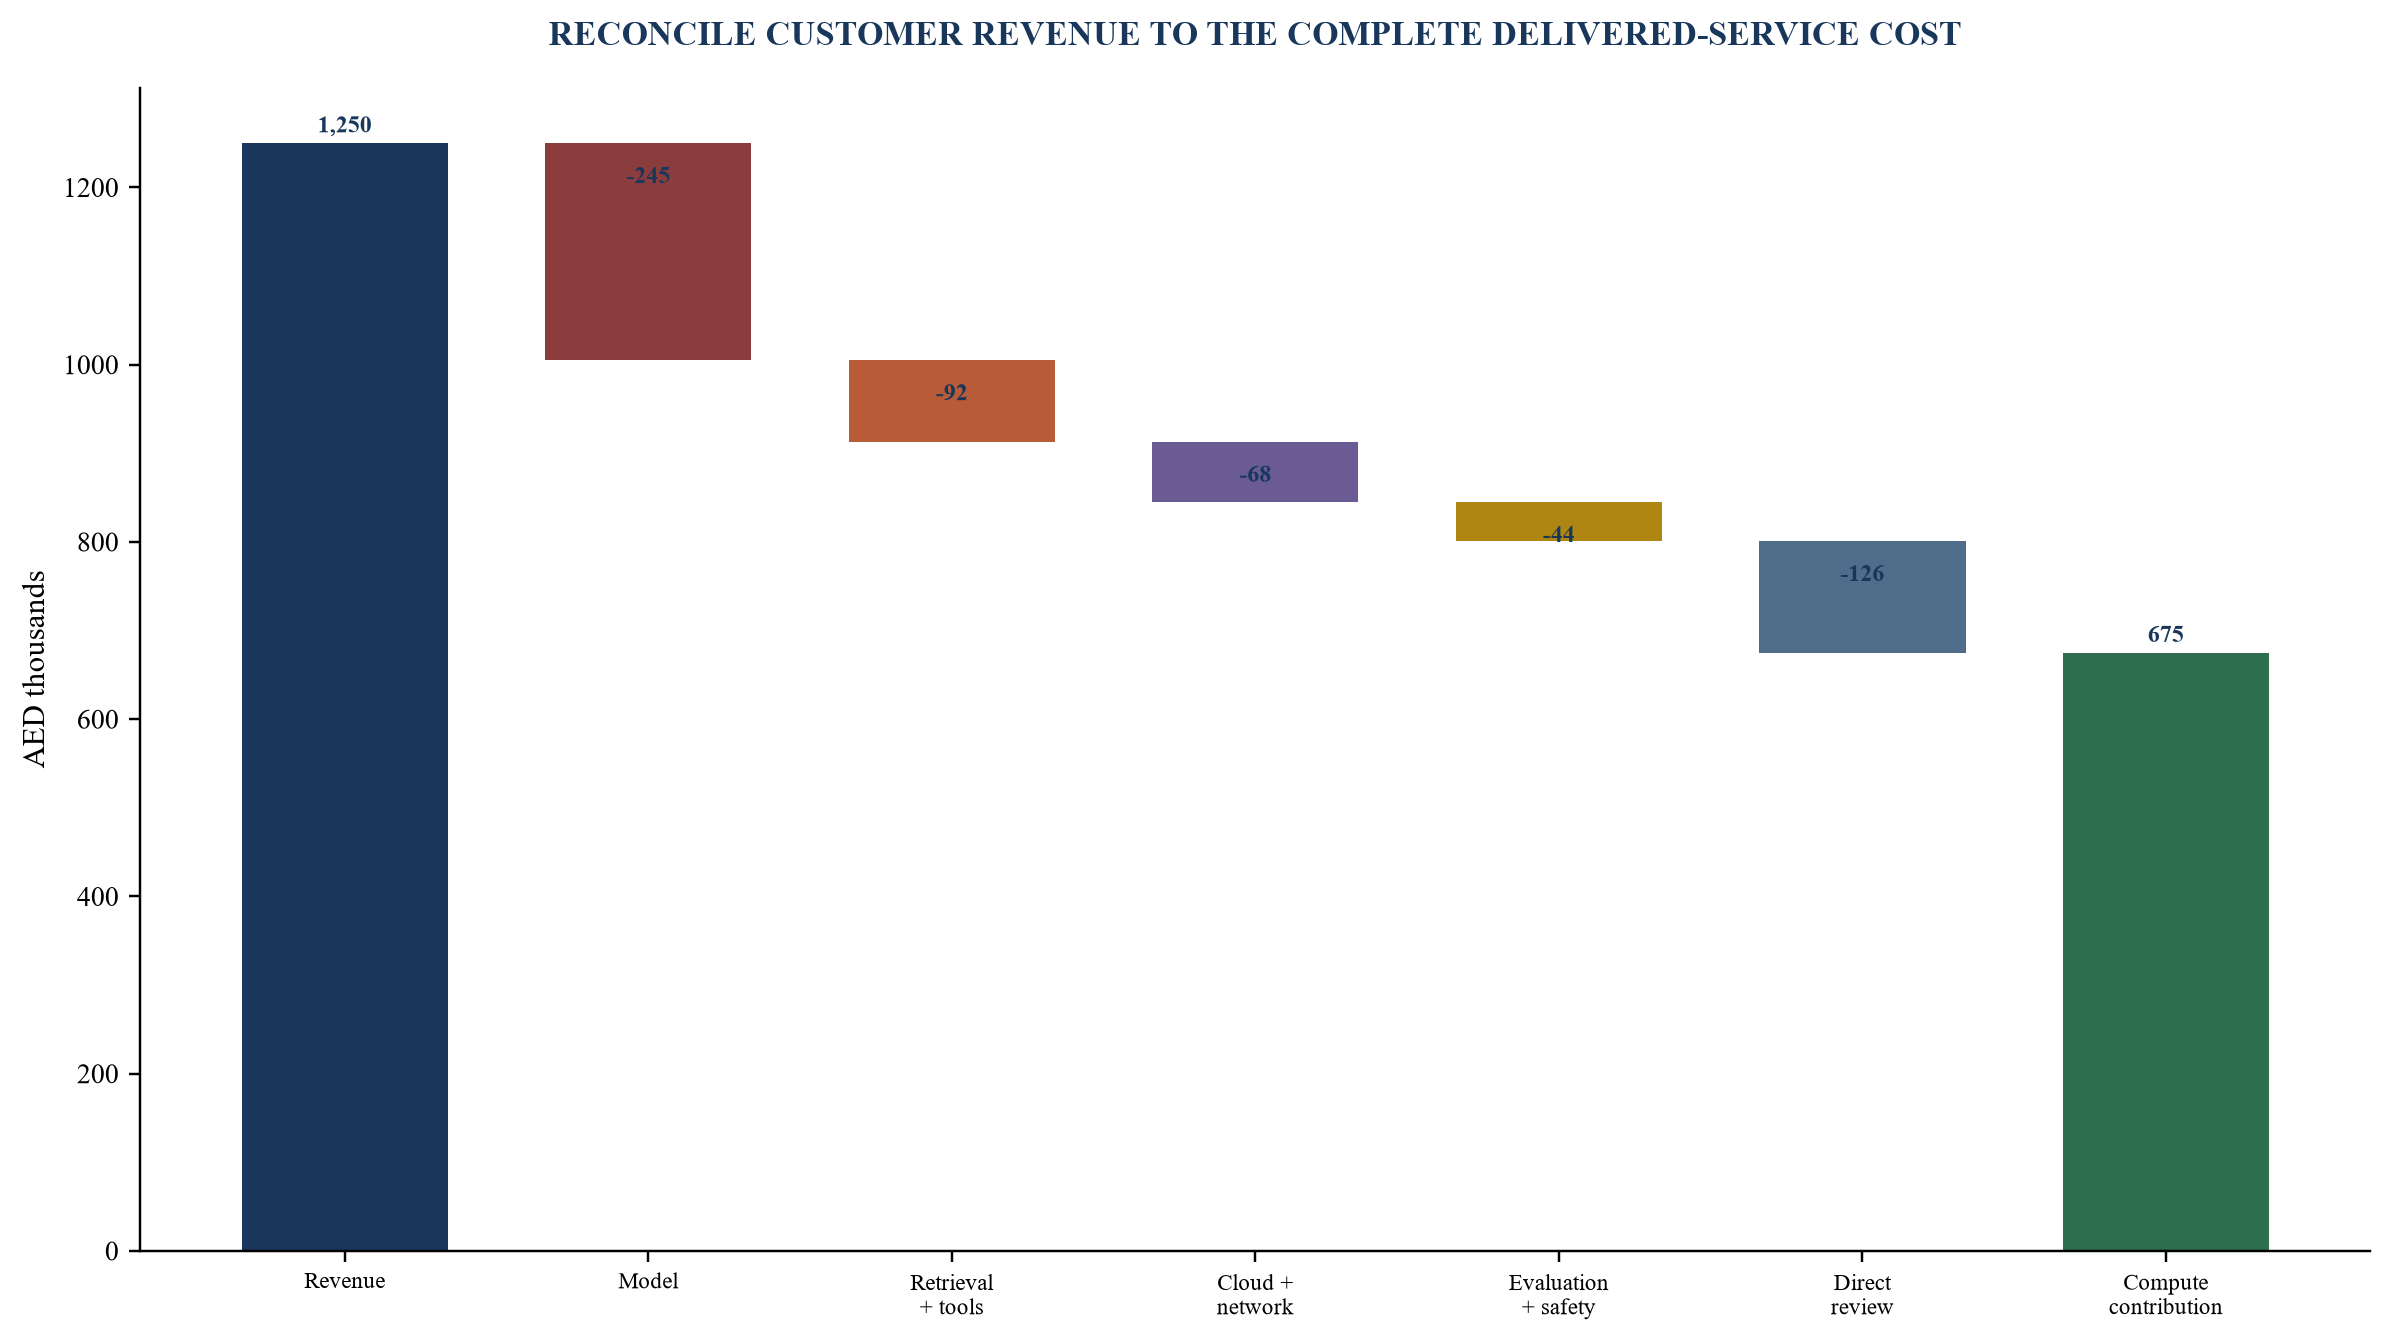
Every amount is a hypothetical management assumption in AED thousands.
12. Report margin by customer and cohort
A blended company margin can conceal a loss-making enterprise contract, free-heavy customer cohort or expensive feature. The board should see margin by customer, plan, workflow and acquisition cohort.
The cohort view should show price, usage, success, direct cost, support and contribution. It should also show contract limits and renewal date. Customers with bespoke environments or evaluations need a clear allocation.
Expansion can improve margin through more usage on shared infrastructure. It can reduce margin when the contract includes unlimited use or a low overage rate. Pricing and usage telemetry should be read together.
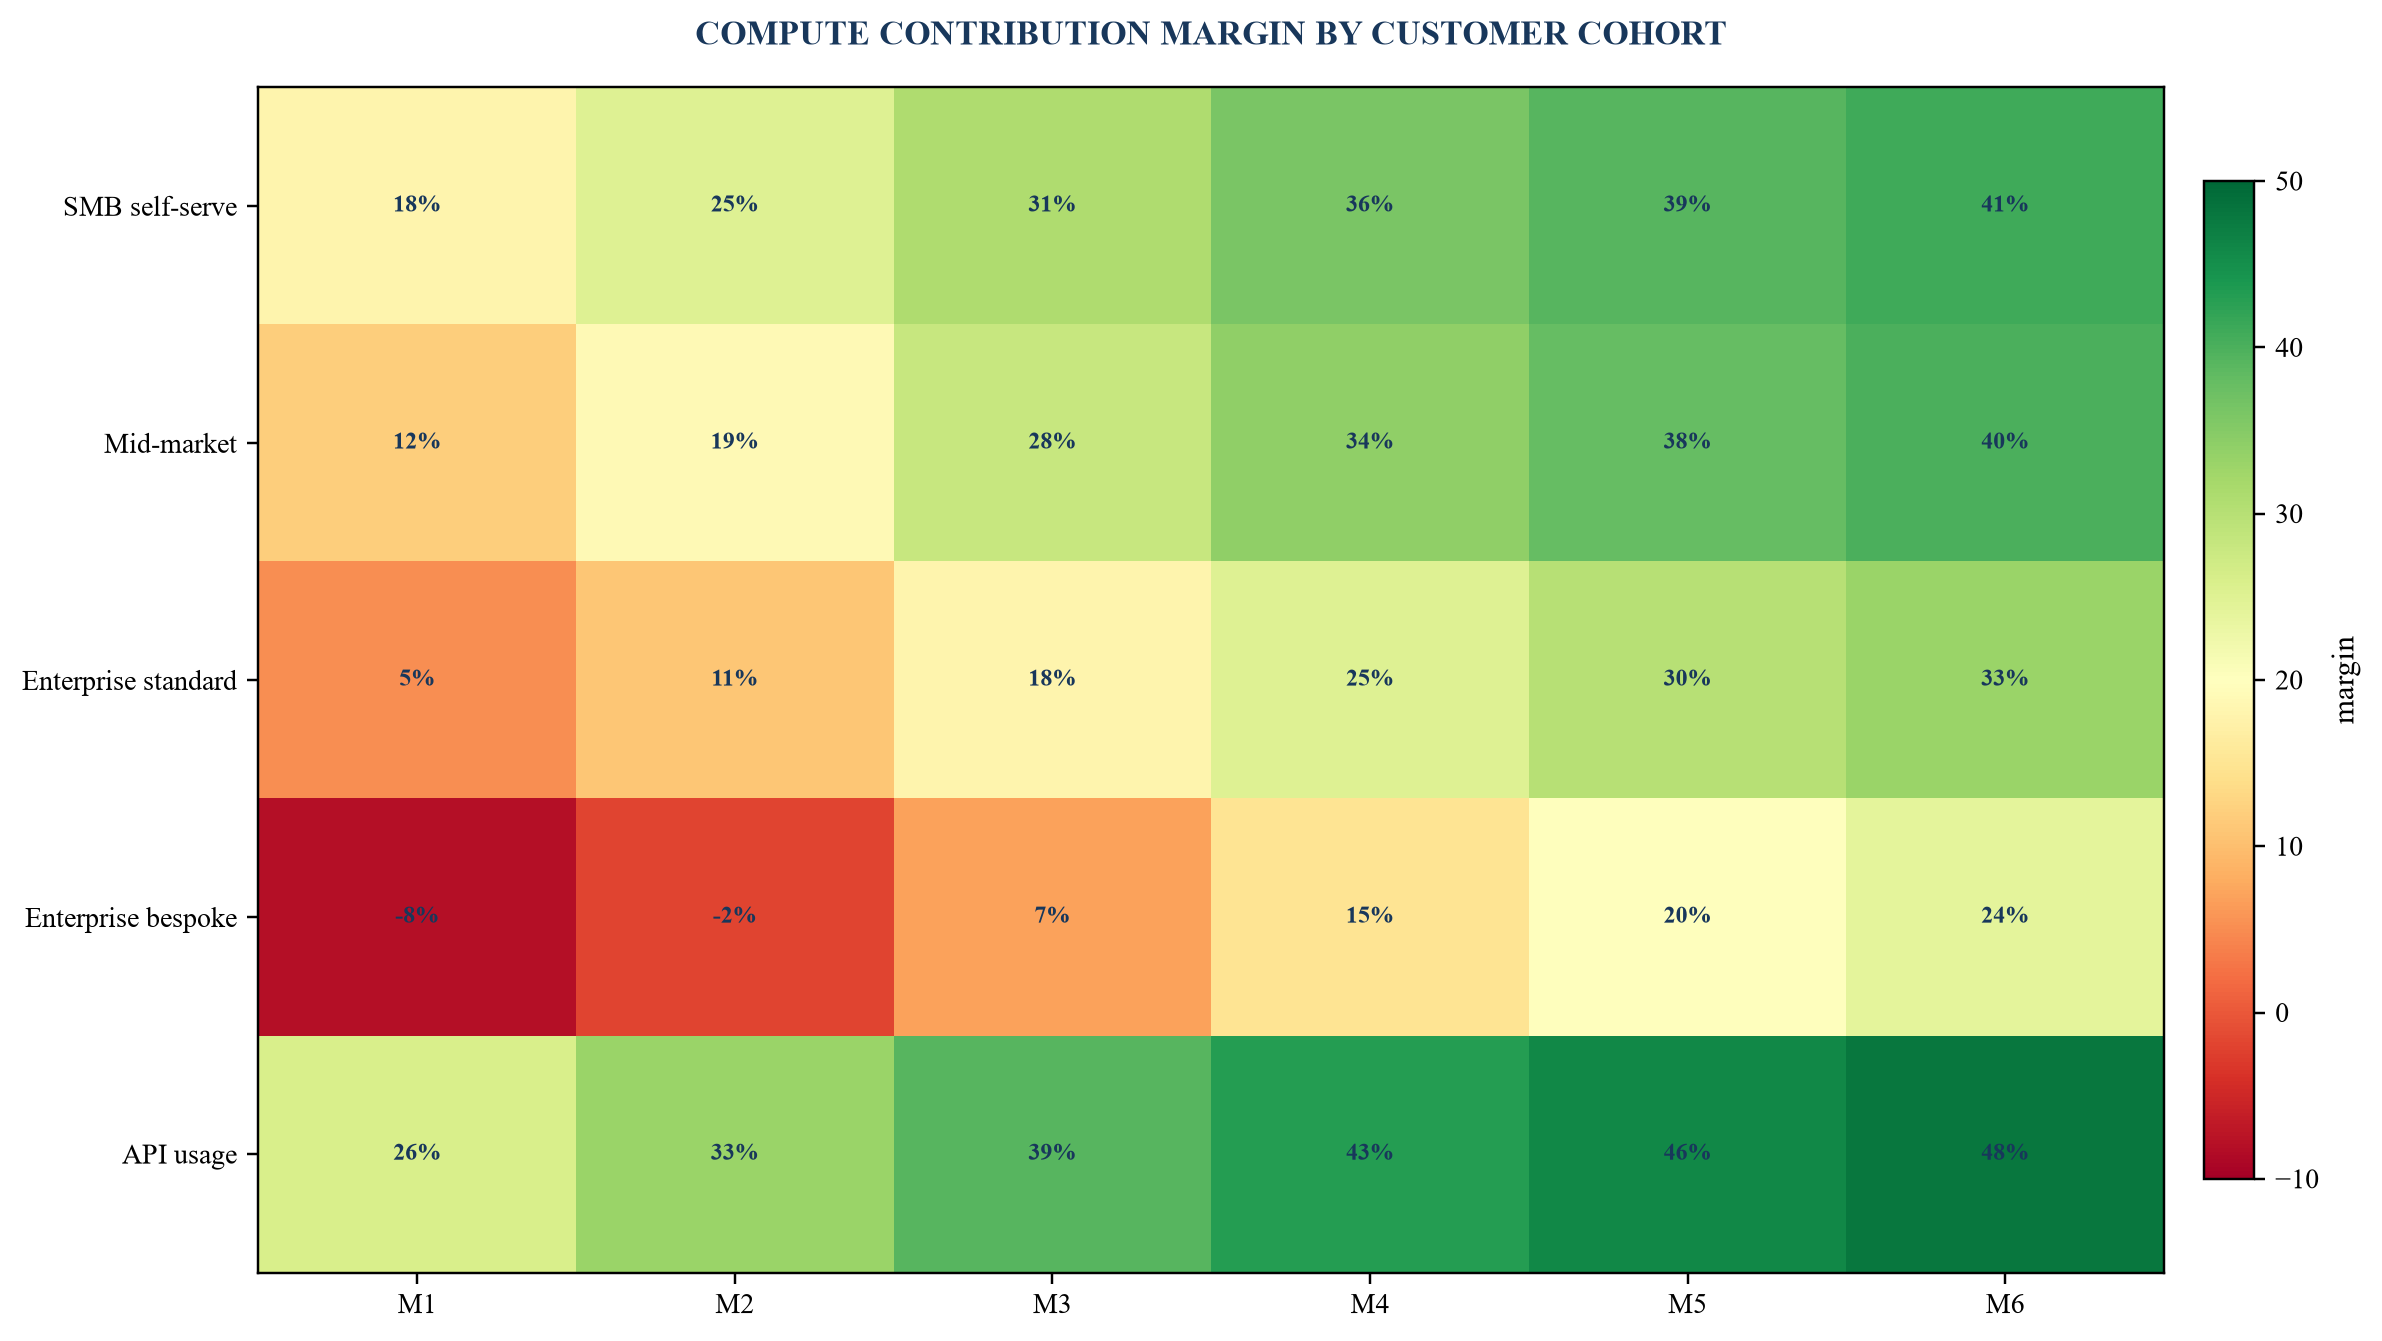
Every percentage is a hypothetical management assumption for method illustration.
13. Align pricing with the cost driver
Seat pricing works when usage per seat is predictable or limits are enforceable. Usage pricing transfers volume variability to the customer and can make budgets harder to forecast. Outcome pricing aligns value and requires a precise success definition.
Enterprise minimum commitments can fund reserved capacity and service operations. Overage rates should reflect marginal cost and customer value. Unlimited plans require fair-use, concurrency, context, modality or workflow boundaries.
Contracts should address provider price changes, material model changes, data location, service commitments, usage measurement, pass-through services and termination. A price-adjustment clause can protect the company and affect sales acceptance.
Discounting should be expressed through contribution margin. A strategic logo can justify an approved investment in product evidence or distribution. The board should see the cost, duration and renewal path.
The contract-to-cost model should also distinguish included usage from expected usage. Sales proposals commonly describe an entitlement, while the forecast applies an average. A customer whose production pattern reaches the entitlement can consume substantially more compute than the average embedded in the price. Finance should therefore maintain expected, contracted and maximum exposure for each material account.
Minimum commitments need corresponding service capacity and revenue analysis. A prepayment can strengthen cash while remaining deferred revenue until the performance obligation is satisfied under the applicable accounting policy. Committed provider capacity can create a cash outflow before the customer consumes the service. The forecast should show billing, collection, revenue recognition, service delivery and provider payment on separate timelines.
Renewal pricing should reflect the evidence accumulated during the initial term. The account file should show delivered outcomes, consumption, service attainment, direct support, realised value and forecast demand. This allows the company to renew with an appropriate package, usage boundary and margin target instead of applying a general percentage increase.
Multi-year contracts can protect revenue visibility and expose the company to model-price, regulation and service-cost changes. Price-review clauses, usage resets, change-control procedures and termination assistance should be assessed with qualified advisers. The financial case should preserve a scenario in which provider cost falls, one in which it rises, and one in which the workflow requires a higher-cost route to maintain quality.
14. Treat governance and evaluation as production cost
The NIST AI Risk Management Framework organises work across govern, map, measure and manage. Its Generative AI Profile provides a cross-sector resource for risks associated with generative systems.[11] Evaluation, documentation and incident processes consume real resources and support product trust.
European Commission guidance states that obligations for providers of general-purpose AI models entered into application on 2 August 2025. It identifies technical documentation, downstream information, copyright policy, training-content summaries and authorised representatives for relevant providers, with additional evaluation, incident and cyber-security duties for systemic-risk models.[12]
European transparency obligations under Article 50 apply from 2 August 2026 for relevant systems, including machine-readable marking and detectability for generated or manipulated content under the applicable rules and grace provisions.[13]
The exact legal role of a startup depends on its model, system, market and activity. The financial plan should fund qualified assessment, documentation, evaluation, transparency, security and incident handling where applicable.
15. Underwrite concentration and portability
Provider concentration can affect price, availability, region and roadmap. A startup should know which workflows can move and which depend on proprietary model behaviour, caching, tools or fine-tuning.
Portability has a cost. Alternative models need integration, evaluation and operational support. Maintaining several live providers can reduce concentration and reduce volume discounts.
The board should identify critical routes, approved alternatives, switch time, data implications and customer commitments. Portability should be demonstrated for material workflows where the risk justifies the expenditure.
16. Work a hypothetical AI software case
Consider a hypothetical enterprise research platform that charges subscriptions and usage for completed, cited analytical outputs. It uses retrieval, several model routes, web search, evaluation and human exception review.
Every figure below is a management assumption. The example demonstrates how revenue, outcome volume, success, direct cost and margin connect.
| Metric | Base month | Month six plan | Evidence gate |
|---|---|---|---|
| Collected and recognised revenue | 1,250 | 1,800 | contracts, invoices, collections and accounting policy |
| Eligible workflow attempts | 10,000 | 17,000 | product event with customer and workflow ID |
| Successful outcomes | 7,200 | 13,600 | approved quality and service result |
| Success rate | 72% | 80% | versioned evaluation and service telemetry |
| Foundation-model cost | 245 | 292 | provider usage, contracted price and invoice reconciliation |
| Retrieval and paid tools | 92 | 124 | trace and vendor invoice |
| Cloud, network and storage | 68 | 92 | tagged cloud cost and allocation |
| Evaluation and safety | 44 | 61 | evaluator, filter, testing and audit cost |
| Direct review and exception service | 126 | 148 | workflow minutes and payroll allocation |
| Compute contribution | 675 | 1,083 | revenue less listed direct costs |
| Compute contribution margin | 54.0% | 60.2% | consistent ledger and cohort reconciliation |
| Direct cost per successful outcome | AED79.86 | AED52.72 | complete cost divided by successful outcomes |
All amounts are hypothetical management assumptions in AED thousands per month unless stated otherwise.
17. Stress the variables that move margin fastest
Outcome success, model mix, output length, agent steps, customer usage, reserved-capacity utilisation and direct review can move together. The sensitivity model should change them coherently.
A provider price cut does not automatically flow to margin. The application can use more context or calls. A model downgrade can lower unit price and reduce success, increasing total cost per outcome.
The downside should retain required evaluation, safety and service. Removing control cost to preserve the margin target creates an unrealistic case.
| Scenario | Success rate | Model and tool cost | Direct review | Total direct cost | Compute contribution margin | Interpretation |
|---|---|---|---|---|---|---|
| Base | 72% | 337 | 126 | 575 | 54.0% | current operating assumption |
| Lower provider rate, higher usage | 73% | 340 | 122 | 574 | 54.1% | price saving absorbed by longer context and more calls |
| Controlled routing and caching | 75% | 286 | 108 | 497 | 60.2% | quality maintained with lower repeated input and escalation |
| Quality regression | 62% | 310 | 184 | 606 | 51.5% | cheaper route creates retries and review |
| Low capacity utilisation | 72% | 428 | 126 | 666 | 46.7% | committed throughput exceeds realised demand |
| Combined downside | 58% | 455 | 218 | 785 | 37.2% | model, workflow and contract require redesign |
| Upside execution | 82% | 275 | 86 | 464 | 62.9% | requires evidenced quality, routing, pricing and service gains |
Every value is a hypothetical management assumption for method illustration.
18. Diligence the telemetry, contracts and invoices together
An investor should reproduce the margin for selected customers and periods. The test should begin with contract and revenue, obtain product attempts and outcomes, trace provider and tool calls, apply invoice rates and add direct service cost.
Provider dashboards and management spreadsheets are useful and need reconciliation to invoices, general ledger and cash. Gross-margin definitions should be compared with statutory reporting and internal contribution metrics.
The data room should preserve model and provider versions. Historical economics can be difficult to reconstruct after price and routing changes.
Forecast diligence should start with customer-level drivers. For each material account, the model should state contracted price, expected eligible attempts, success rate, model mix, context and output intensity, paid tools, direct review, service tier and renewal assumption. Aggregating those drivers produces a testable provider and capacity forecast.
The board should then reconcile the operational forecast to cash. Provider invoices can be denominated in another currency, include tax, reflect billing lags or draw against committed spend. Customer collections can occur annually, quarterly or after acceptance. Contribution margin and liquidity therefore answer different questions and should both remain visible.
A monthly close process can lock the evidence. Product operations finalise eligible attempts and outcomes; engineering finalises usage and route allocation; risk finalises evaluation and incidents; finance reconciles provider invoices, direct labour, revenue and cash. Unresolved allocations remain visible rather than being silently absorbed into a favourable margin estimate.
| Workstream | Required evidence | Reperformance test |
|---|---|---|
| Customer economics | contracts, pricing, limits, invoices, collections, cohorts and renewals | reproduce revenue and outcome volume for selected customers |
| Product telemetry | workflow, request, route, model, token, tool, retry, latency and outcome records | trace a sample from customer input to accepted result |
| Provider cost | contracts, price sheets, discounts, commitments, usage exports, invoices and credits | recalculate billed usage and separate credits from mature cost |
| Quality and safety | evaluation sets, thresholds, results, incidents, red-team work and change approvals | rerun approved tests on material routes and versions |
| Architecture | data flow, orchestration, retrieval, tools, fallback, region, retention and recovery | identify every paid step and critical dependency |
| Direct service | review, exception, implementation and dedicated support records | allocate direct labour to customers and workflows |
| Finance | revenue policy, cost classification, ledger, budgets and cash forecast | reconcile product contribution to management and statutory accounts |
| Governance and law | AI role assessment, privacy, IP, security, sector rules and customer commitments | map obligations, owners, evidence and funded remediation |
Scope should follow the product, risk, business model and jurisdictions.
19. Run a 180-day margin programme
The programme begins with definitions and measurement. It then establishes an invoice-to-outcome ledger, validates routes, redesigns the largest cost and failure drivers, and aligns pricing and capacity.
Finance, product, engineering, risk and commercial teams should share the same margin bridge. A technical saving without financial reconciliation remains an experiment. A price change without usage evidence can damage retention.
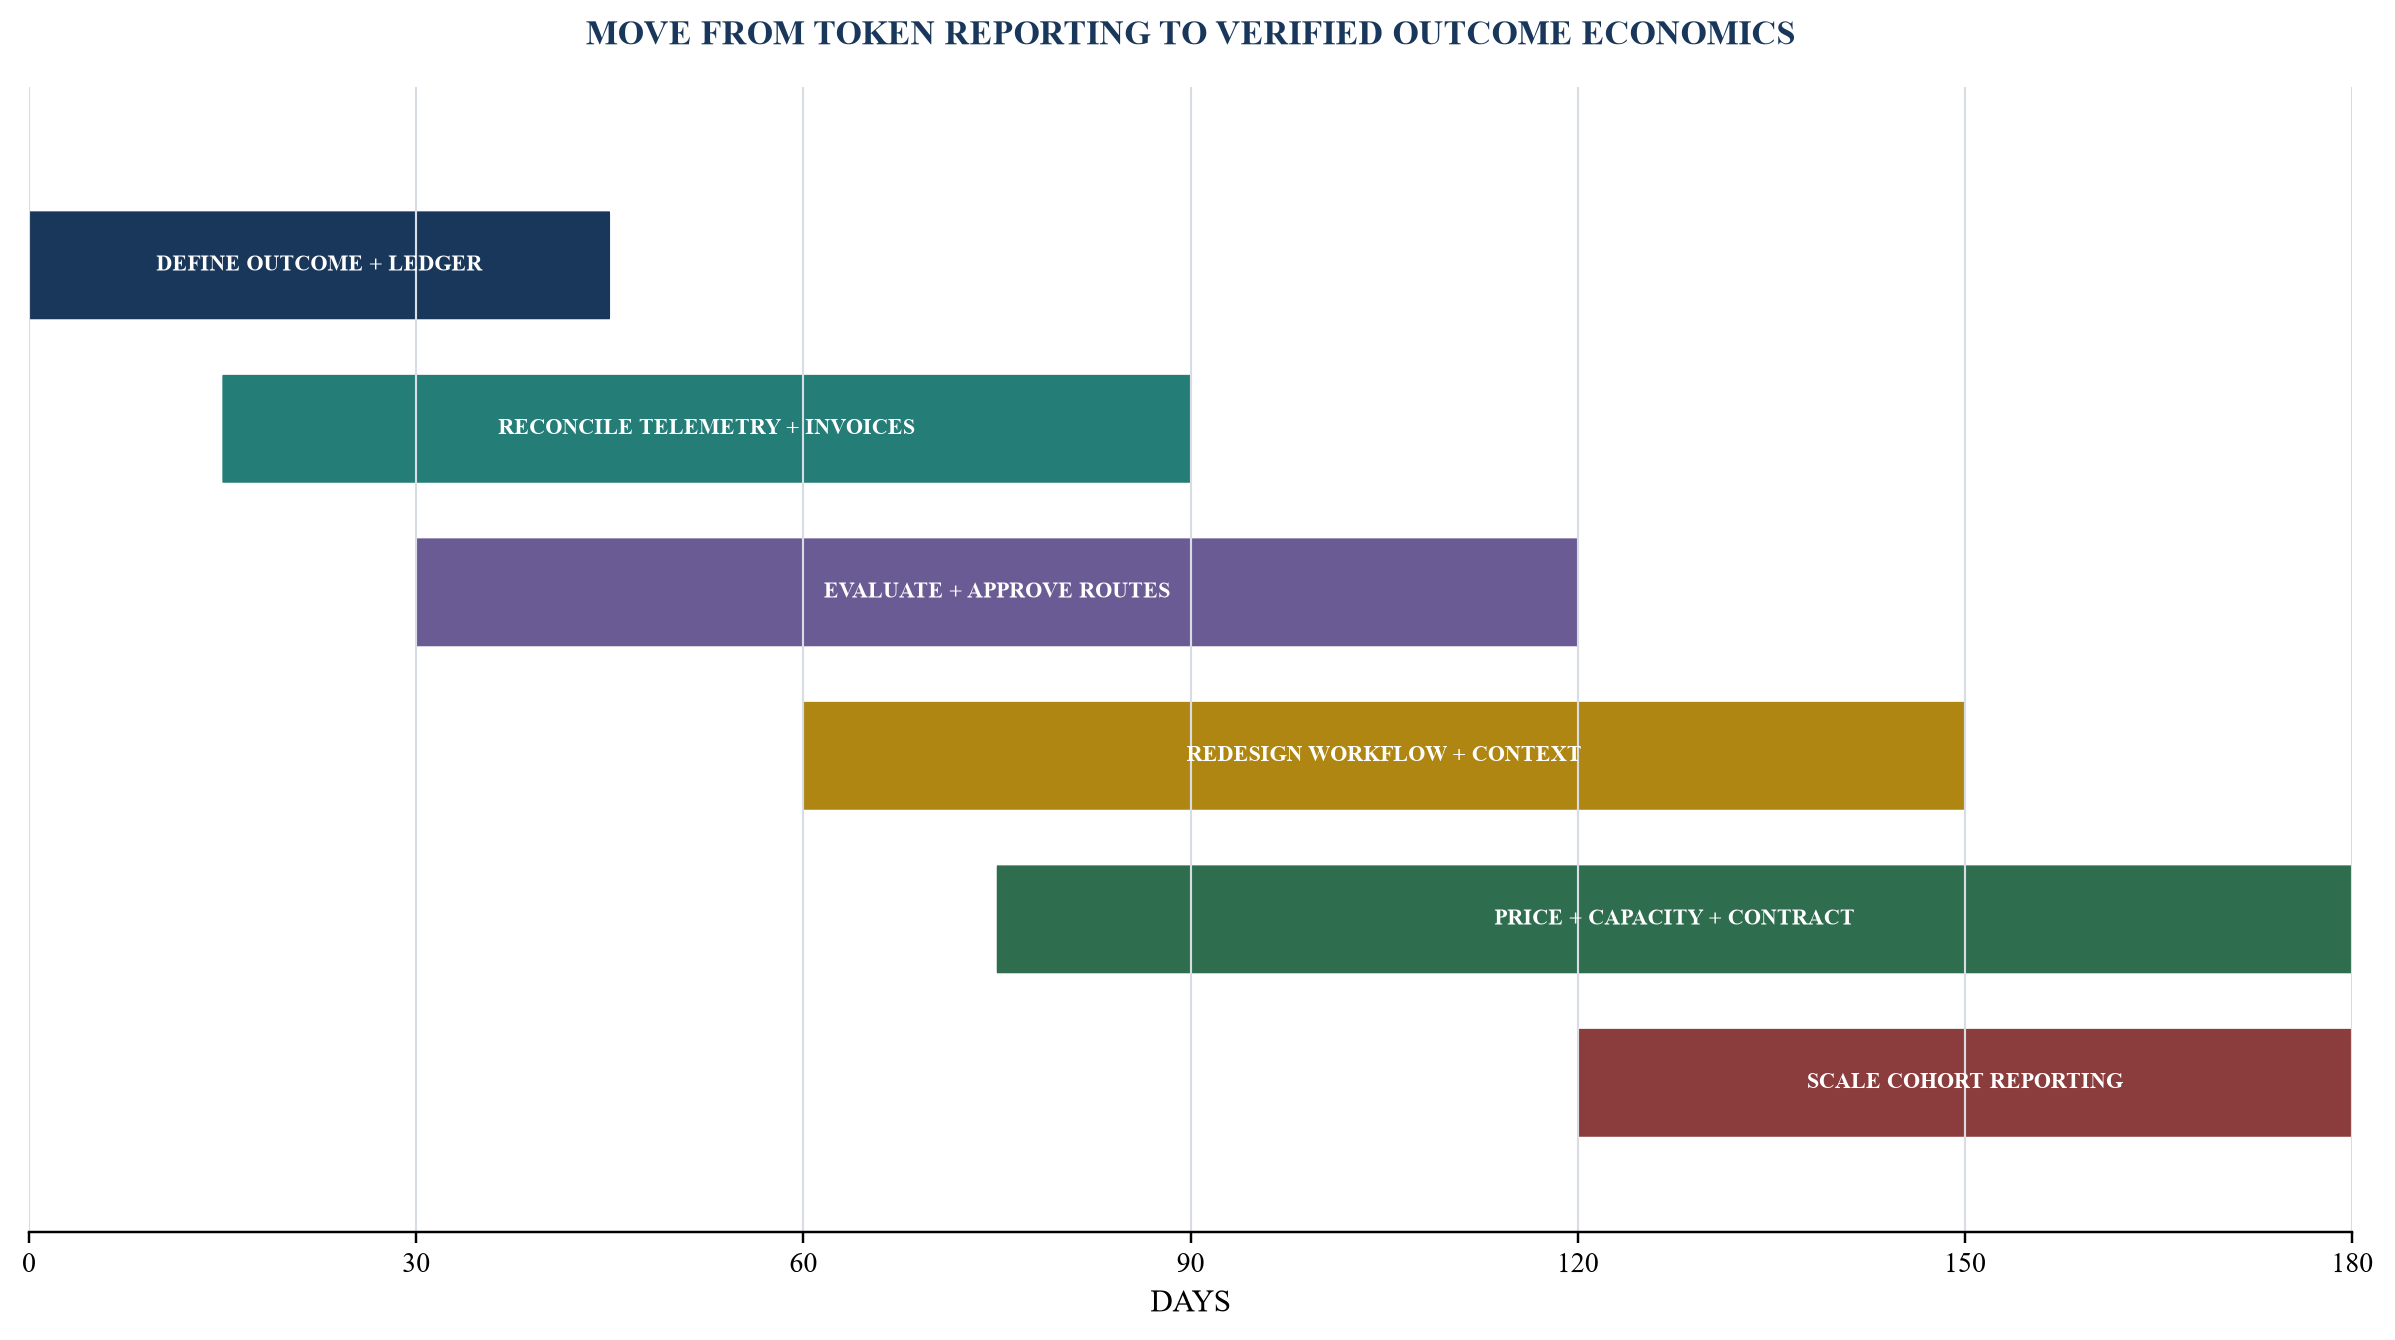
Author framework. Timing should be adapted to product risk and data readiness.
20. Use a board gate for scale capital
The investment committee should receive a reconciled view of revenue, successful outcomes, direct cost, margin, quality, latency, reliability, concentration and cash. The report should identify which metrics are measured and which remain management assumptions.
Scale capital can be released against evidence: invoice reconciliation, stable quality, declining cost per outcome, positive cohort margin, acceptable provider concentration and contract terms that protect economics.
The board can approve growth, require a pricing or architecture change, limit a product, gather evidence or stop an uneconomic route. The decision should name the owner, threshold and review date.
21. Translate falling inference cost into valuation
A valuation bridge should begin with observed unit economics and move through four separate ledgers: provider price, workload intensity, customer price and retained contribution. Provider price measures the contracted cost of input, cached input, output, tools and capacity. Workload intensity records calls, context, output, retries, model mix, paid tools and review per successful outcome. Customer price records list price, discounts, credits, included usage, overage and realised revenue per outcome. Retained contribution is the amount left after the complete direct cost of delivery. Combining the four ledgers into one gross-margin assumption obscures which party captures an efficiency gain.
The forecast should state the date, model version and contractual basis for every provider-price assumption. A published list-price reduction can apply only to eligible models, regions, service tiers or meters. Negotiated discounts can expire. Cached-input and batch rates require qualifying workload design. Provisioned capacity can lower the effective rate at high utilisation and increase it when committed capacity is unused. Finance should preserve these conditions rather than applying a general annual decline to the whole cost base.
Usage response requires its own assumption. A lower cost per call can lead product teams to offer longer context, higher output limits, additional tools, more frequent background tasks and deeper agent loops. Customers can increase activity when a feature becomes faster, more capable or included in a plan. The model should therefore forecast successful outcomes, attempts per outcome, units per attempt and route mix separately. Each relationship should be supported by observed cohort evidence when available and identified as a management assumption when it is not.
Price pass-through can take several forms. A vendor may reduce a usage rate, increase included credits, move a feature into a lower-priced tier, introduce an unlimited package, or preserve price while improving quality and service. The commercial response depends on competition, customer value, switching cost, contract terms and sales strategy. A lower technical cost creates an option for price action; it does not establish that the full saving will remain with the vendor.
The valuation model should connect this operating bridge to revenue growth, contribution margin, operating expense, working capital, capital expenditure, cash conversion and financing need. A discounted cash-flow approach can model the timing and durability of retained contribution. Market multiples can support a cross-check when comparable companies share revenue quality, growth, margins, capital intensity and risk. Transaction precedents require similar care. Headline software multiples do not replace a product-level view of AI delivery economics.
Durability matters more than a single favourable quarter. A temporary margin increase can arise from promotional credits, delayed provider invoices, suppressed usage, deferred support, favourable customer mix or incomplete allocation. A durable improvement is visible across repeated cohorts, reconciles to provider invoices and the general ledger, retains quality and service, and survives plausible provider, competition and usage scenarios.
The investment committee should use reverse stress tests. It can ask how much usage expansion, price concession or model-mix escalation would consume the forecast saving; how much customer retention would need to improve to justify lower prices; and which margin level would breach the valuation or financing case. These tests convert uncertainty into explicit decision thresholds.
| Bridge item | Base year | Year-two assumption | Evidence required | Valuation treatment |
|---|---|---|---|---|
| Provider rate for eligible workload | index 100 | index 65 | contract, invoice and eligible-meter mapping | apply only to verified eligible volume |
| Workload units per successful outcome | index 100 | index 135 | product traces, context, output, retries and tools | offsets part of the provider-rate decline |
| Customer realised price per outcome | AED 18.00 | AED 16.56 | contracts, discounts, credits and billing data | reflects an 8% assumed price concession |
| Successful outcomes | 1.0 million | 1.55 million | cohort demand, activation, retention and capacity | supports revenue growth when service is delivered |
| Complete direct cost per outcome | AED 8.25 | AED 6.95 | invoice-to-outcome ledger including review and controls | drives contribution after all direct delivery cost |
| Contribution margin | 54.2% | 58.0% | revenue and full direct-cost reconciliation | enters cash flow only after verification |
| Downside margin | 54.2% | 47.0% | higher usage intensity, weaker price and route escalation | used for liquidity and valuation protection |
| Upside margin | 54.2% | 62.0% | controlled routing, stable price and improved task success | retained as contingent until operating evidence exists |
Every percentage and amount is a hypothetical management assumption for method illustration.
22. Convert findings into price, terms and actions
The final decision record should identify the economics already proven, the assumptions that remain open and the actions required to close each gap. Verified cost savings can support value. Forecast savings can support a plan, milestone or contingent mechanism. Unresolved exposure can be allocated through price, holdback, earn-out, covenant, working-capital protection, service commitment or a funded operating programme.
For an acquisition, the buyer can tie part of consideration to retained contribution margin, successful-outcome growth or specified customer renewals, subject to carefully defined measurement rules. For growth capital, staged funding can follow telemetry readiness, gross-margin thresholds and pricing milestones. For debt, covenants and liquidity cases should use the downside route and capacity assumptions. Each structure requires qualified legal, tax, accounting and regulatory advice.
The board's first 100 days should establish the outcome ledger, approve workload classes, reconcile invoices, review pricing and identify the largest economically controllable drivers. This programme gives finance, product, engineering, commercial and risk teams one evidence base. It also gives investors a clear distinction between lower technical unit cost and durable enterprise value.
The valuation committee should receive a monthly variance bridge against the transaction case. The bridge should separate provider-rate variance, consumption variance, route-mix variance, quality and retry variance, human-review variance, customer-price variance and customer-mix variance. Each variance should have a named owner, supporting source and corrective action. A single favourable gross-margin variance can otherwise conceal an adverse customer-price movement or a temporary reduction in product usage.
Forecast governance should include a model-version register and a commercial-package register. The model-version register records approval date, task class, quality threshold, expected cost, failover path and retirement date. The commercial-package register records included usage, overage, discount, renewal date, price-review right and the operational assumptions used at approval. Linking these registers allows management to identify customers whose contracted package has become uneconomic after a model, product or usage change.
Transaction documents should define measurement consistently when consideration, funding or covenants depend on AI economics. Successful outcome, eligible workload, direct delivery cost, realised customer price and contribution margin require precise definitions. The parties should agree data sources, period boundaries, allocation policies, change controls, dispute procedures and treatment of new models or products. Ambiguous metrics can convert an operational improvement plan into a post-closing dispute.
Capital allocation should follow marginal evidence. Engineering effort can be directed to the routes with the highest contribution impact after quality and risk constraints. Commercial effort can focus on accounts where packaging, limits or minimum commitments improve both customer value and forecast reliability. Finance can evaluate reserved capacity only after eligible demand and utilisation have been measured. This sequencing preserves cash while management learns which improvements are repeatable.
Conclusion
AI inference offers expanding technical capability and a broad menu of prices, discounts and capacity structures. That market supports significant optimisation. It also increases the number of variables inside a delivered customer service.
The reliable economic unit is the successful outcome. Investors should connect the customer contract, product trace, provider invoice, evaluation result, direct service labour and collection to calculate margin by cohort.
Model routing, caching, batching, context control, workflow redesign and capacity commitments can improve economics when quality, latency, reliability, data and risk remain inside the approved envelope. Governance, evaluation and service continuity belong in the production plan and financial model.
An AI application becomes more valuable when growing customer value produces growing verified contribution cash. Falling inference prices create potential operating leverage; workload intensity, customer price, quality, controls and usage response determine how much of that leverage is retained. The valuation case should therefore follow provider price, workload mix, customer price and complete direct cost through one reconciled outcome ledger.
Sources
- OpenAI, API Pricing, Read the primary source
- OpenAI, Batch API Reference, Read the primary source
- Amazon Web Services, Amazon Bedrock Pricing, Read the primary source
- Google Cloud, Vertex AI context caching, 15 October 2025, Read the primary source
- Microsoft, Provisioned throughput billing and cost management, Read the primary source
- Anthropic, List Prices, 27 May 2026, Read the primary source
- Amazon Web Services, Understanding Amazon Bedrock Cost and Usage Report data, Read the primary source
- MLCommons, MLPerf Inference: Datacenter, Read the primary source
- Google Cloud, Generative AI on Vertex AI Pricing, Read the primary source
- Amazon Web Services, Amazon Bedrock service tiers, Read the primary source
- United States National Institute of Standards and Technology, AI Risk Management Framework and Generative AI Profile, Read the primary source
- European Commission, Guidelines on obligations for General-Purpose AI providers, Read the primary source
- European Commission, Transparency obligations under Article 50 of the AI Act, Read the primary source
- Microsoft, Plan and Manage Costs for Microsoft Foundry, Read the primary source
- MLCommons, MLPerf Inference v5.1 benchmark results, Read the primary source
- Organisation for Economic Co-operation and Development, Measuring the Environmental Impacts of AI Compute and Applications, Read the primary source
- Stanford Institute for Human-Centered Artificial Intelligence, AI Index Report 2025, Read the primary source
- Stanford Institute for Human-Centered Artificial Intelligence, AI Index Report 2026, Read the primary source
- Stanford Institute for Human-Centered Artificial Intelligence, AI Index 2026 economy chapter, Read the primary source
- OpenAI, API pricing documentation, Read the primary source
- OpenAI, Prompt caching guide, Read the primary source
- OpenAI, Batch API guide, Read the primary source
- OpenAI, GPT-4.1 announcement and pricing, Read the primary source
- Anthropic, Claude pricing documentation, Read the primary source
- Anthropic, Message Batches documentation, Read the primary source
- Anthropic, Prompt caching documentation, Read the primary source
- Google Cloud, Vertex AI generative AI pricing, Read the primary source
- Google Cloud, GKE Inference Gateway general availability, Read the primary source
- Google Cloud, Performance per dollar of GPUs and TPUs for AI inference, Read the primary source
- Google Cloud, Reduce cost and improve AI workloads, Read the primary source
- Amazon Web Services, AWS Inferentia, Read the primary source
- International Energy Agency, Energy and AI executive summary, Read the primary source
- International Energy Agency, Key questions on energy and AI, Read the primary source
- International Energy Agency, Energy demand from AI, Read the primary source
- International Energy Agency, Understanding the energy-AI nexus, Read the primary source
- National Institute of Standards and Technology, Generative Artificial Intelligence Profile, Read the primary source
- National Institute of Standards and Technology, AI Resource Center, Read the primary source
- GitHub, Copilot plans, Read the primary source
- GitHub Docs, Plans for GitHub Copilot, Read the primary source
- GitHub Docs, Copilot billing, Read the primary source
- Adobe, Creative Cloud pricing, Read the primary source
- Adobe, Generative AI product specific terms, Read the primary source
- Palantir Technologies, 2025 Annual Report on Form 10-K, Read the primary source
- IFRS Foundation, IFRS 15 Revenue from Contracts with Customers, Read the primary source
- IFRS Foundation, IAS 36 Impairment of Assets, Read the primary source
- IFRS Foundation, IFRS 3 Business Combinations, Read the primary source
- IFRS Foundation, IFRS 13 Fair Value Measurement, Read the primary source
- IFRS Foundation, IAS 38 Intangible Assets, Read the primary source
- United States Securities and Exchange Commission, Commission guidance on management discussion and analysis, Read the primary source
- International Organization for Standardization, ISO/IEC 42001 AI management systems, Read the primary source
