

1. Put transition inside the value-creation plan
Climate transition becomes economically useful when management can explain how a specific action changes revenue, margin, cash, capital intensity, risk or strategic optionality. A portfolio company may already publish emissions data, respond to customer questionnaires or purchase renewable power. Those activities form evidence and inputs. The value-creation plan needs the operating mechanisms that connect them to enterprise performance.
The board should begin with five questions. Which customer revenues depend on verified environmental information or lower-carbon products? Which costs are exposed to energy, fuel, materials, carbon prices or compliance? Which assets require investment, adaptation or retirement? Which financing relationships now examine transition risk and plans? Which management decisions must be taken during the ownership period? Answers convert a broad transition theme into a bounded performance agenda.
IFRS S2 defines a climate-related transition plan as an aspect of strategy that describes targets, actions or resources for moving toward a lower-carbon economy [1][2]. The IFRS Foundation's 2025 materials connect those plans to governance, strategy, risk management, metrics and anticipated financial effects [1][3]. The practical implication is that a plan should agree with the budget, capital plan, operating forecast and financial statements. A target without funded actions is an ambition. A funded action without an operating owner is a project. A value-creation initiative needs both and a measurable destination.
The plan should also preserve commercial choice. Some companies compete through lower operating cost; others need product redesign, supply-chain evidence or customer-specific solutions. Emissions-intensive businesses may require transition finance for investments that are material but cannot reach zero immediately [25]. The board's role is to govern the economic pathway, evidence and constraints, rather than apply one generic decarbonisation template.
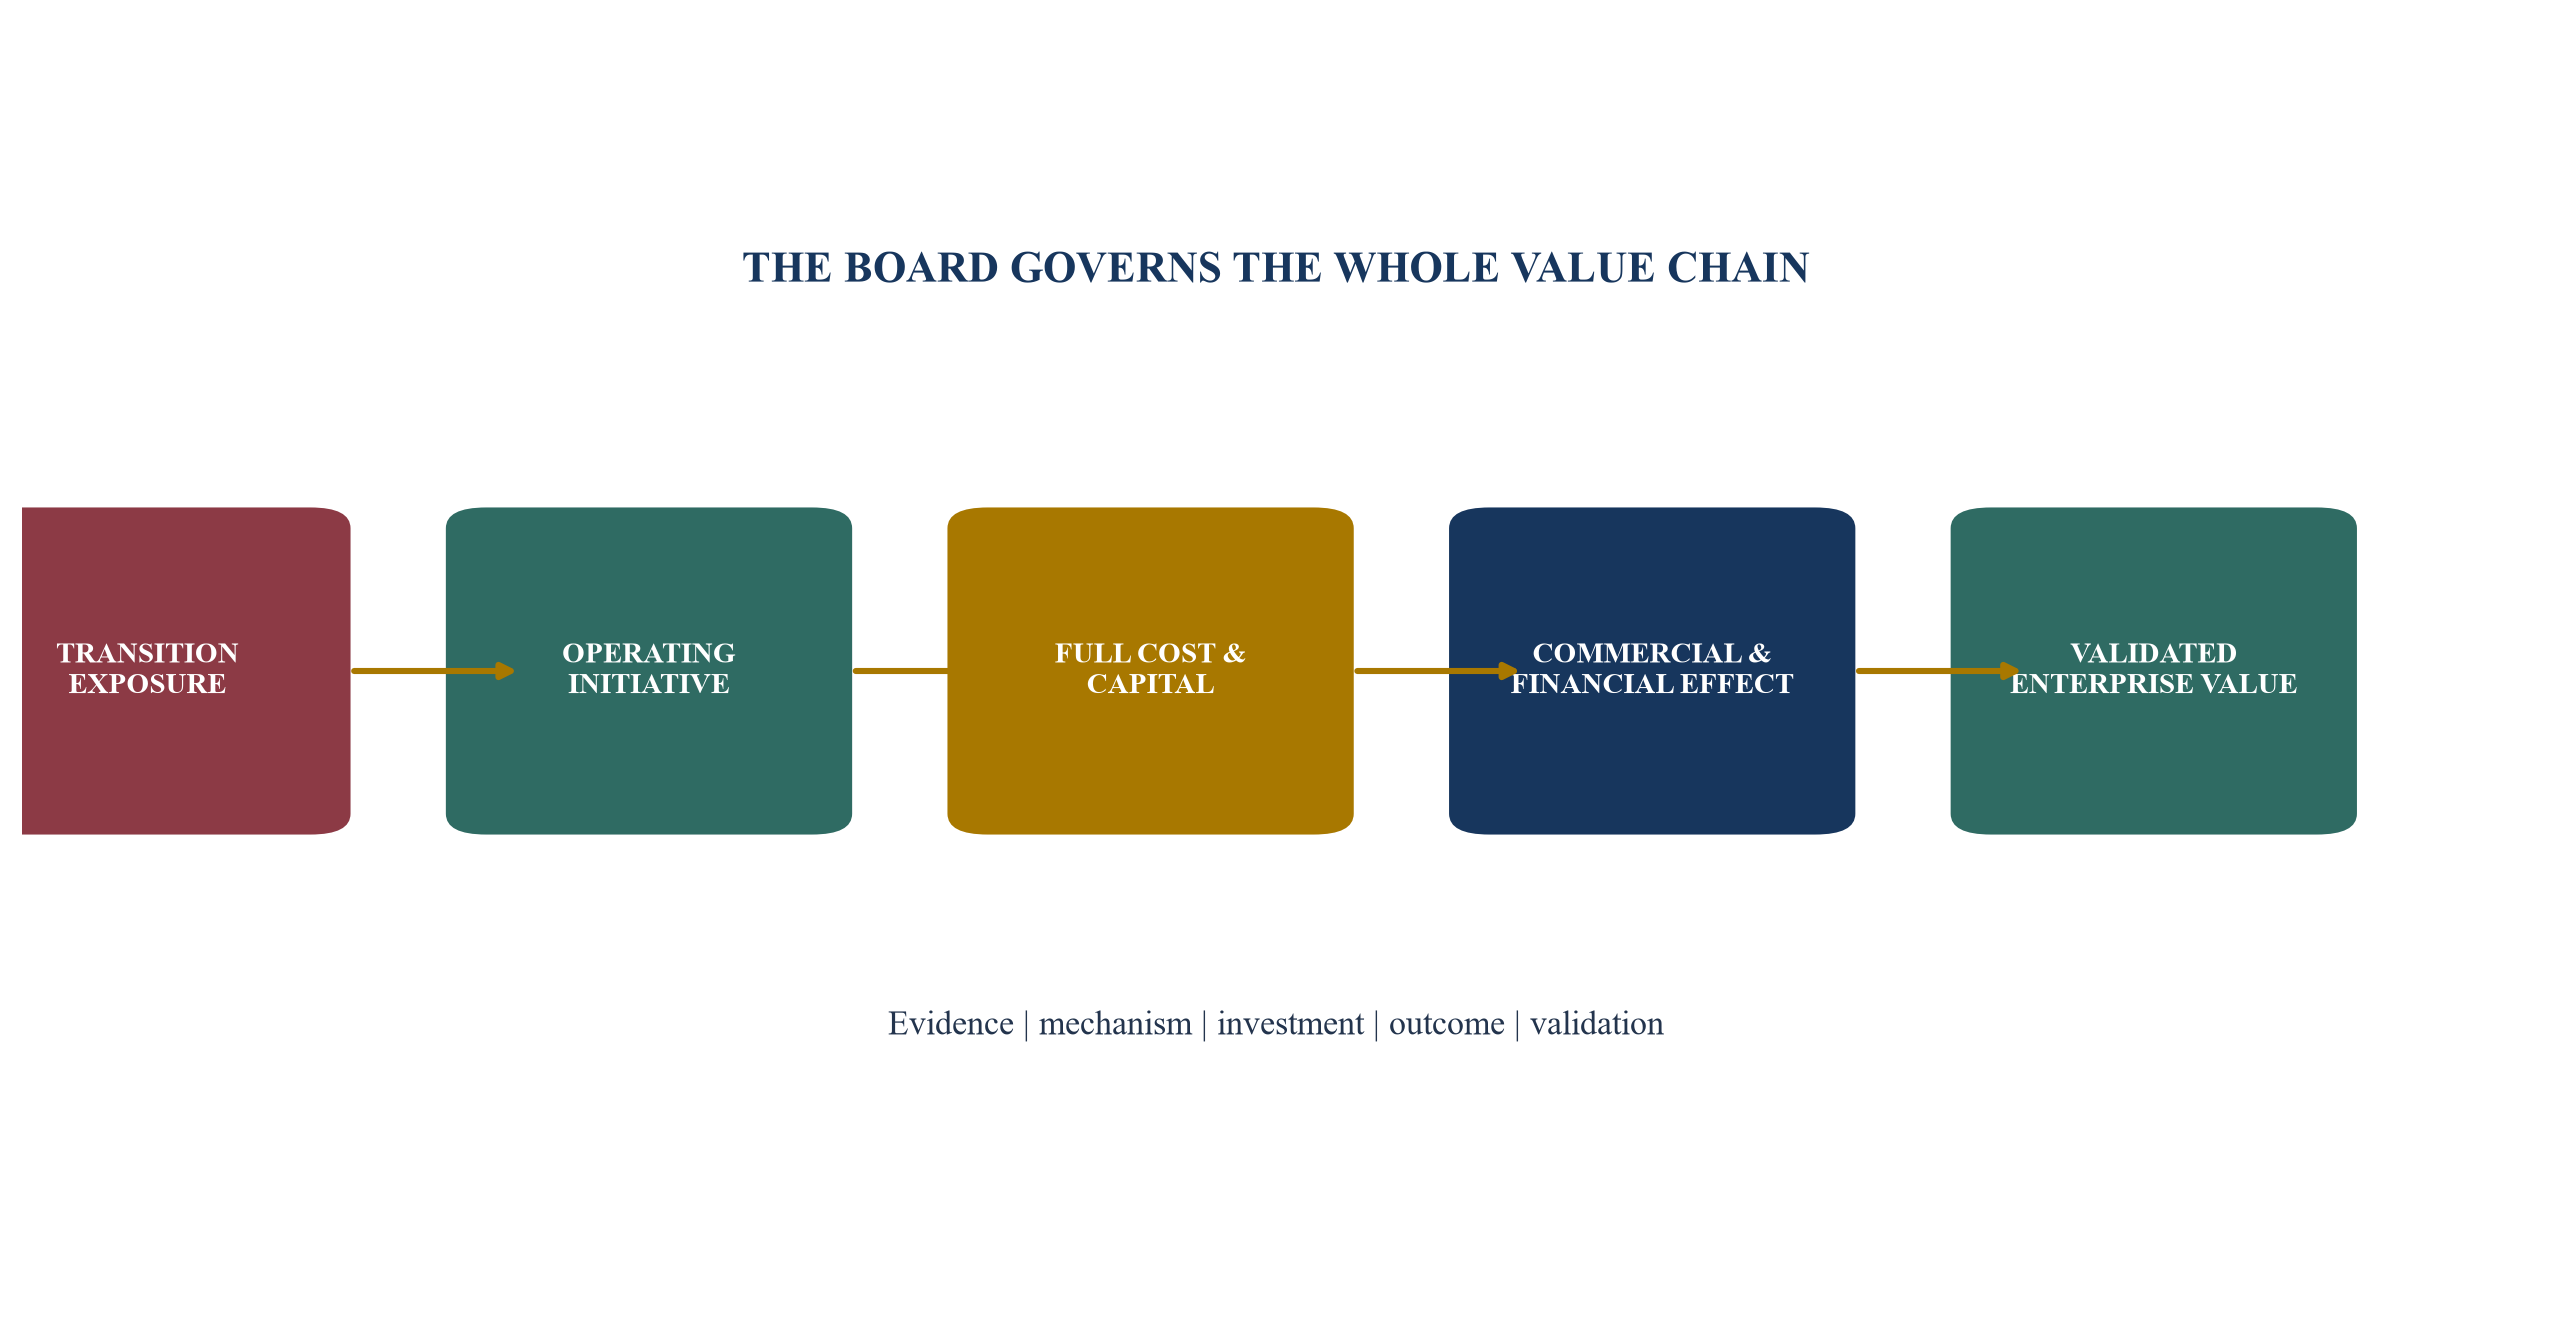
Each connection requires a baseline, owner, evidence and financial destination.
2. Define the decision boundary and material exposure
A transition programme can expand without limit unless the board defines its decision boundary. The boundary should cover the legal entities, operations, products, markets, customer segments, assets and value-chain relationships that can materially affect the company's performance during the plan horizon. It should also state which outcomes matter: margin protection, revenue retention, compliance, financing capacity, resilience, growth or an exit-quality evidence base.
Financial materiality and operational priority should be linked without being confused. IFRS sustainability disclosures focus on risks and opportunities that could reasonably be expected to affect prospects [2]. European sustainability reporting can apply a double-materiality lens under the relevant law. Customer procurement requirements can extend beyond either reporting perimeter. The operating plan should map each requirement to its source and decision use rather than collapse everything into one undifferentiated score.
The board should identify non-compensating red flags. A material regulatory breach, loss of customer qualification, unsafe engineering choice, unsupported public claim or unfunded critical asset requirement should not be offset by a high average score elsewhere. These conditions need an owner, immediate action and escalation. They also need qualified advice because the economic consequences can depend on facts outside the management model.
Time horizons should follow operating and capital cycles. A software company may adjust products rapidly but depend on long-duration data-centre contracts. An industrial company may have assets whose replacement cycle extends beyond the investment hold. The plan should show what management can complete, commit, enable or preserve during ownership. Long-dated ambitions should be translated into near-term decisions with stated dependencies and review dates.
3. Build the baseline that the board can reconcile
The baseline is the starting point for both transition and value measurement. It should combine operating volumes, energy and fuel, material inputs, logistics, emissions, waste, product mix, customer requirements, asset condition, capital expenditure and financial results. Each measure needs a defined boundary, unit, source, owner, period and evidence quality. Reconciliations should identify estimates, missing data and changes in organisational or operational scope.
Greenhouse-gas accounting can use the GHG Protocol Corporate Standard and Scope 3 Standard as methodological sources [27][28]. The inventory still needs management controls. Activity data should link to bills, meters, production systems, supplier records or other authoritative sources. Factors and calculation methods should be versioned. Acquisitions, disposals and changes in methodology can alter comparability, so the baseline should record recalculation decisions.
The financial baseline should show current cost and cash exposure. Energy consumption should reconcile to procurement volumes and expense; material use should link to purchasing and yield; waste should link to disposal cost and recoveries; carbon instruments should link to contracts and accounting review. Customer exposure should be traced to revenue, margin, contract term, renewal date and required evidence. This prevents the plan from reporting tonnes while the board decides in currency and customer outcomes.
Evidence quality should be visible. A metered quantity can carry a different confidence level from a supplier estimate or spend-based proxy. Management can prioritise better data where a decision is material, such as pricing an export contract, selecting a capital project or supporting a customer claim. A data-improvement plan should explain the decision it enables; collection effort without a decision use can consume resources without improving value.
Table 1. Board transition-readiness scorecard
| domain | decision-grade evidence | minimum gate | warning signal | accountable owner | board response |
|---|---|---|---|---|---|
| commercial | revenue and margin mapped to customer transition requirements | priority accounts have evidence and action owners | renewal depends on missing proof | commercial executive | protect account and close evidence gap |
| operations | energy, materials, yield and asset performance reconciled | material consumption and cost have controlled baselines | reported savings do not reconcile | operations executive | correct baseline before approving value |
| capital | initiative economics include full cost and dependencies | funded plan survives downside | return depends on unapproved subsidy or price | chief financial officer | condition, resize or defer |
| financing | lender requirements and information routes documented | material requests have accountable evidence | bank concern emerges late in refinancing | treasury executive | engage and remediate early |
| reporting | methods, boundaries, controls and approvals established | material disclosures trace to source | inconsistent financial and sustainability assumptions | finance and sustainability | reconcile before publication |
| governance | decisions, targets, claims and exceptions have authority | board cadence and escalation are operating | plan exists outside budget process | chief executive | integrate into value-creation governance |
Evidence gates should be calibrated to the company's activities, jurisdictions and customer obligations.
4. Map obligations, customers and capital providers by market
The company should maintain a market requirements map rather than a single global compliance statement. The map records each legal entity, listing venue, customer geography, product flow, financing relationship and value-chain position. It then identifies applicable reporting, carbon-border, product, procurement and financing requirements, their effective dates, thresholds, evidence owners and advisers.
The map changes over time. The European Union's CBAM definitive regime began on 1 January 2026 for covered goods and applies obligations to authorised declarants above the published mass threshold [7]. Simplifications published in 2025 changed the regime while preserving the need for embedded-emissions evidence in relevant supply chains [8]. The United Kingdom consulted in 2025 on transition-plan implementation routes and UK Sustainability Reporting Standards [5]. The United States federal position remains unsettled: the SEC proposed rescission of its 2024 climate-disclosure rules in May 2026, while the rules remained stayed and the proposal completed its comment period in August 2026 [21].
Other regimes create different demands. Australia phases mandatory sustainability reporting under the Corporations Act and AASB S2 [18][19]. Singapore's updated listing framework phases ISSB-aligned disclosures by issuer group and retains Scope 1 and Scope 2 reporting from financial years commencing in 2025 [16][17]. California is implementing corporate emissions and climate-risk reporting laws for entities within statutory scope [20]. India has BRSR Core and revised value-chain disclosure arrangements for covered listed entities [22][23].
These examples show why a company should avoid making universal claims. The requirements map should carry status fields such as enacted, effective, proposed, stayed, voluntary, customer-required or adviser-confirmed. Legal interpretation belongs to qualified counsel. Management needs the map to sequence data, contracts, capital and customer work.
Table 2. Illustrative market requirements map
| market or channel | current source of demand | operating implication | evidence owner | decision use | review trigger |
|---|---|---|---|---|---|
| European Union imports | CBAM for covered goods | embedded-emissions data and supplier traceability | supply chain and finance | pricing, sourcing and customer delivery | product, threshold or rule change |
| United Kingdom | existing disclosure rules and transition-plan policy development | connect plan, financial effects and governance | finance and company secretariat | reporting and capital-market readiness | final government or regulator action |
| Australia | phased statutory sustainability reports and AASB S2 | controlled climate statements and director process | finance and risk | assurance and board approval | cohort start or guidance update |
| Singapore | phased SGX climate requirements | emissions data, ISSB-aligned information and internal review | finance and sustainability | listing compliance and supply-chain access | issuer category or timetable change |
| California | corporate emissions and climate-risk laws | entity-scope assessment and reporting preparation | legal, finance and operations | compliance and customer response | final implementing rules or litigation |
| customer procurement | contract and tender requirements | product-level evidence and claim control | commercial and operations | retention, qualification and price | renewal, tender or specification change |
Current advisers should confirm entity scope, legal status and effective dates before reliance.
5. Convert exposure into a governed initiative portfolio
The transition plan should operate as a portfolio of initiatives rather than a list of aspirations. Each initiative needs an exposure, operating mechanism, baseline, intervention, owner, timetable, full cost, capital requirement, customer effect, risk treatment and measurable financial destination. It should also identify dependencies such as permits, grid capacity, supplier performance, technology maturity or customer acceptance.
Initiatives can be grouped into no-regret efficiency, commercial protection, compliance, resilience, strategic repositioning and longer-horizon options. The groups support different approval tests. An energy-efficiency measure can be assessed through direct cost and reliability. A low-carbon product line may require customer willingness, certification and differentiated pricing. A process conversion may depend on infrastructure and technology outside management control.
The initiative register should separate required actions from elective investments. A required action may protect licence, contract or market access even when its standalone return is low. Management should still test the least-cost compliant route and its effect on competitiveness. Elective actions should compete for capital against the company's other investments using consistent risk and cash assumptions.
Sequencing matters. Data and metering may precede a performance contract. Customer specification may precede product capital. Power availability may constrain electrification. A board that approves initiatives individually can miss these dependencies and double count benefits. The portfolio view should show the critical path, shared enabling investments and resource capacity.
6. Build a marginal value and abatement curve
A marginal curve helps management compare initiatives using common units while keeping value visible. The horizontal axis can represent annual emissions addressed or another operational unit; the vertical axis can show annualised net cost per unit. The board should also see capital required, payback, customer dependence, implementation risk, asset life and strategic value. One dimension cannot carry the whole decision.
Negative-cost initiatives can appear attractive because modeled savings exceed annualised cost. Their delivery can still depend on downtime, maintenance discipline, adoption or supplier guarantees. Positive-cost initiatives may protect a major customer or future market access. The curve should therefore include a value overlay and classify benefits as direct, contingent or strategic.
Energy efficiency remains a practical starting point across industry, buildings, appliances and transport, with the IEA emphasising competitiveness, affordability and energy security alongside emissions [26]. Transition finance can support emissions-intensive sectors where commercially available solutions and funding conditions differ [25]. The company should avoid presenting every project as green finance eligible; lenders and investors apply their own criteria, taxonomies and diligence.
The investment committee can use gates: technically feasible, commercially relevant, evidence-ready, financially supported, funded, and approved. An initiative should move across gates as evidence improves. Options that remain dependent on policy, technology or infrastructure can retain option value without entering the committed forecast.
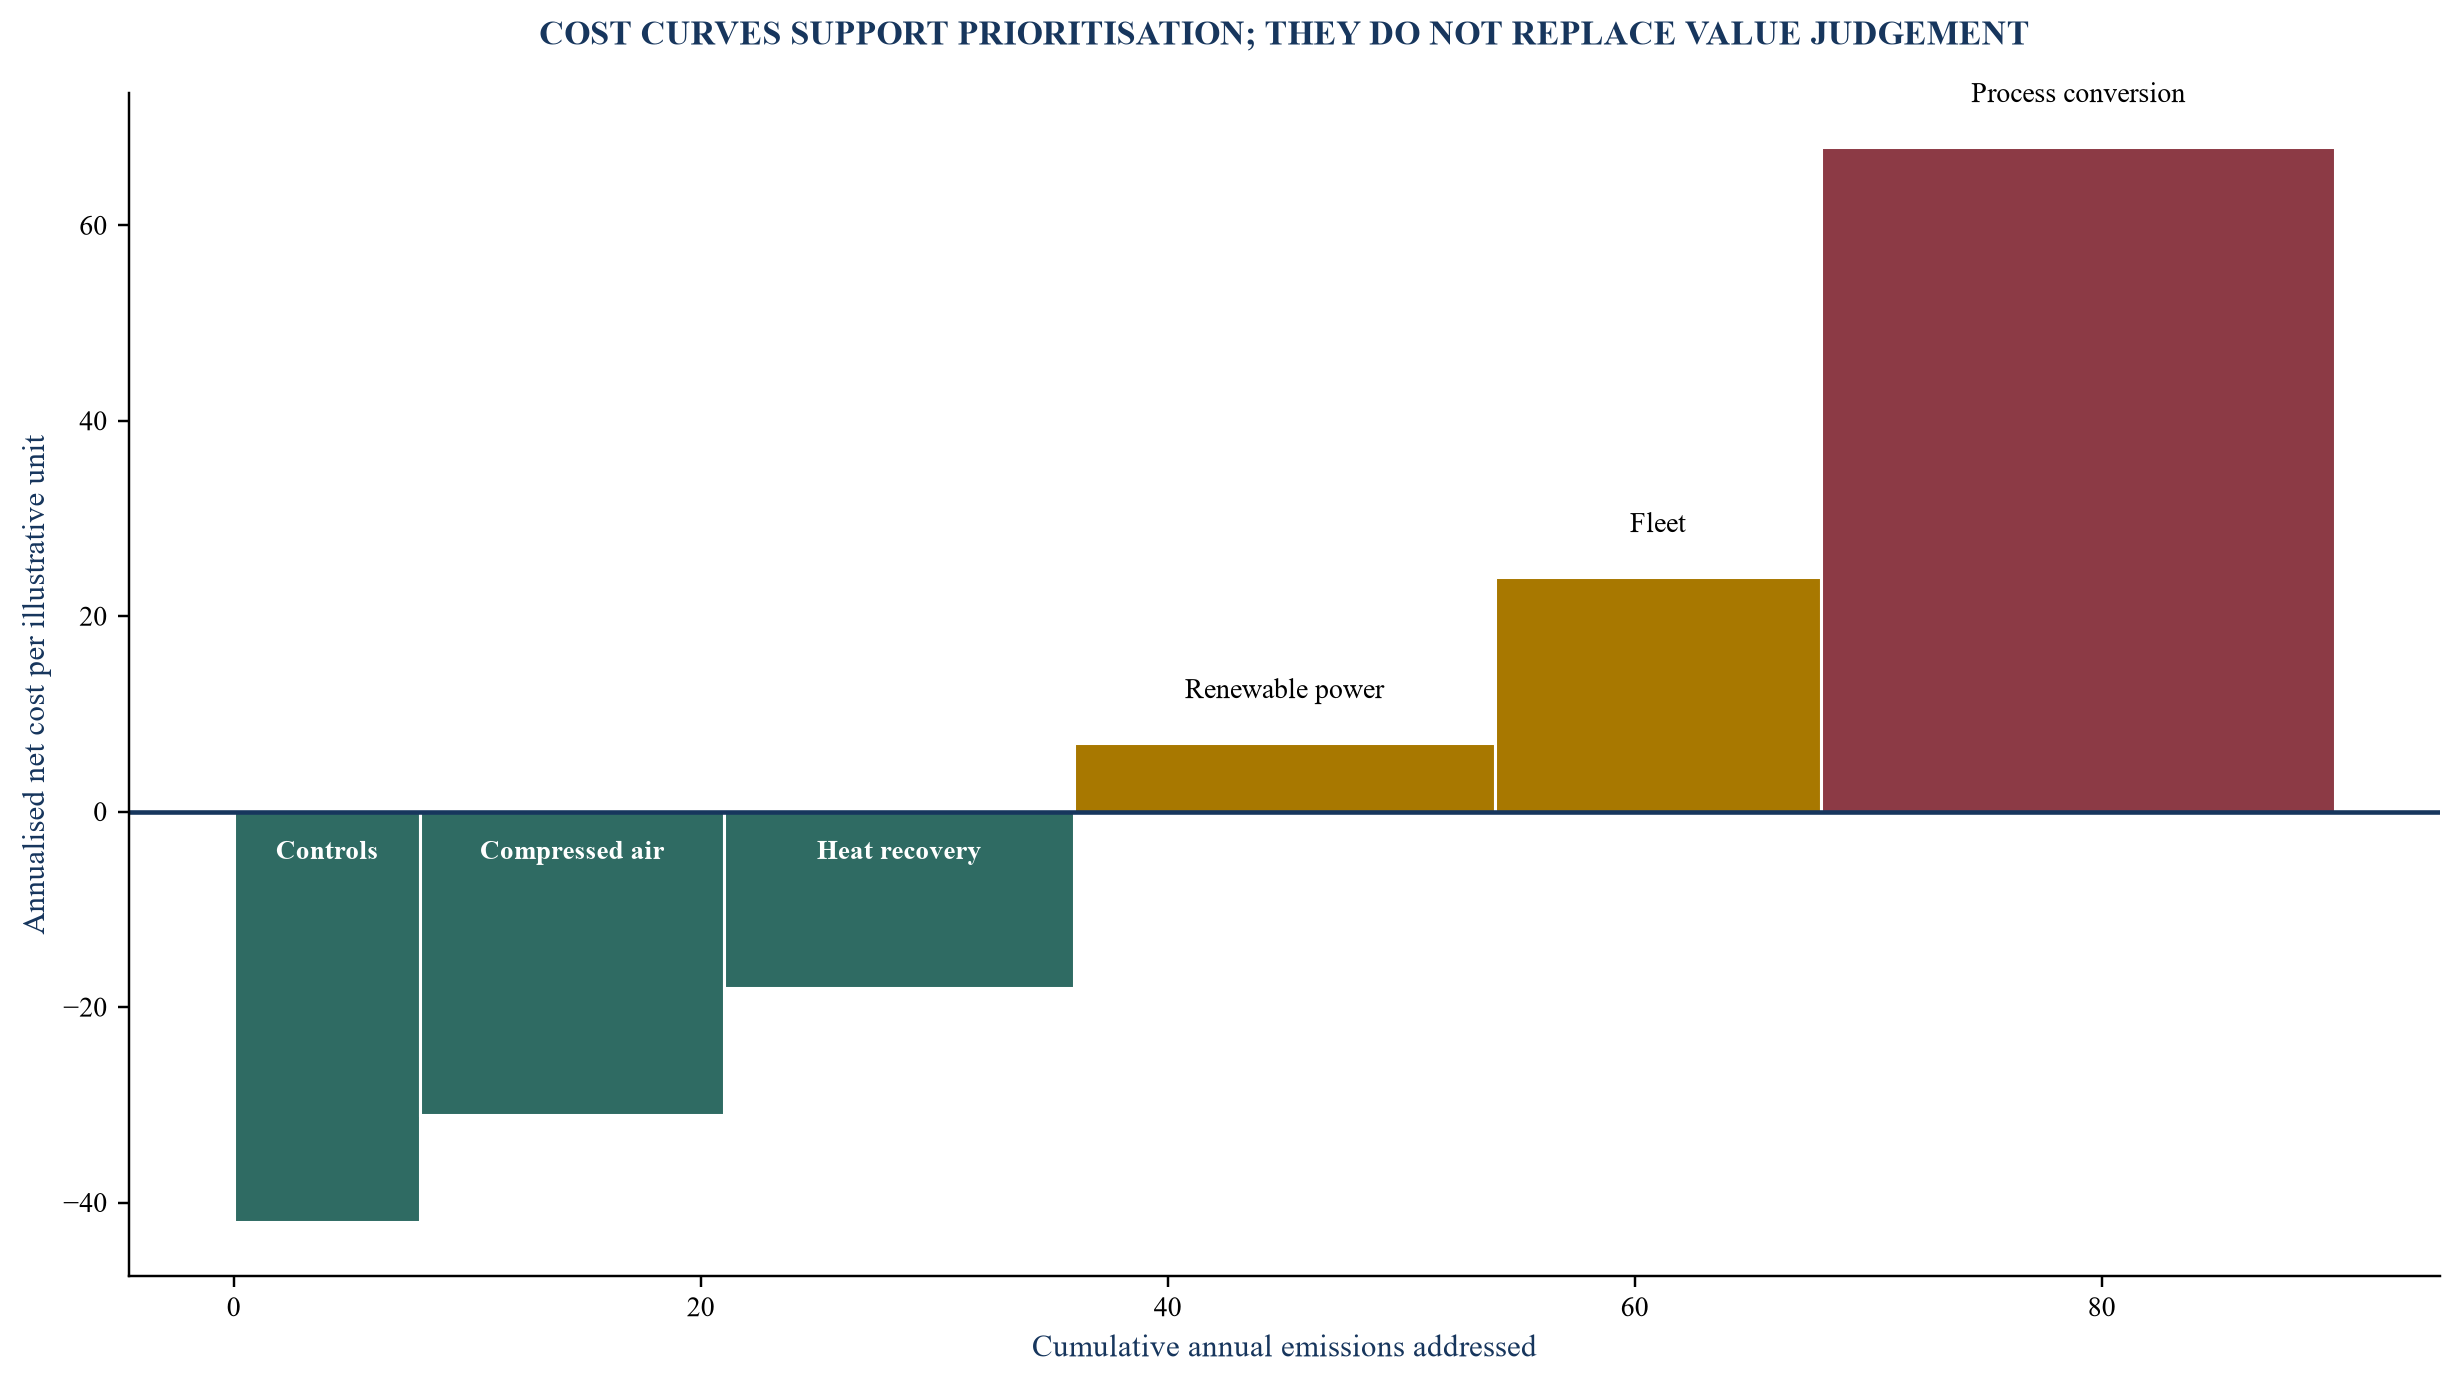
Costs, savings and emissions are hypothetical; the board should retain customer, capital and execution overlays.
7. Reconcile transition actions to EBITDA
The value bridge should start with the operating baseline and trace each initiative to a financial line. Energy savings can reduce cost of sales or operating expense. Yield improvement can reduce material consumption and waste. Product redesign can affect price, volume, mix and warranty. Compliance can protect revenue while adding operating cost. Capital investment creates depreciation, maintenance and financing effects in addition to cash outflow.
Management should report gross benefit, leakage, recurring cost, implementation cost and timing separately. A supplier price increase can consume part of an energy saving. Lower-carbon input material may raise unit cost while supporting price or retention. A project may release theoretical labour hours without reducing expense or increasing throughput. Finance should validate the route from operational outcome to the profit and loss account.
The baseline and counterfactual are central. Energy prices, production volume, weather, mix and foreign exchange can change independently of the initiative. Measurement should normalise material drivers where feasible and disclose uncertainty. The board can distinguish forecast, contracted, installed, operational, observed and finance-validated value.
Double counting often occurs between procurement, efficiency and product initiatives. One reduction in material use cannot be credited to both process yield and supplier change unless the mechanisms are separated. The value ledger should assign one primary destination and identify interactions. This discipline also improves the exit bridge because a buyer can reproduce the claimed result.
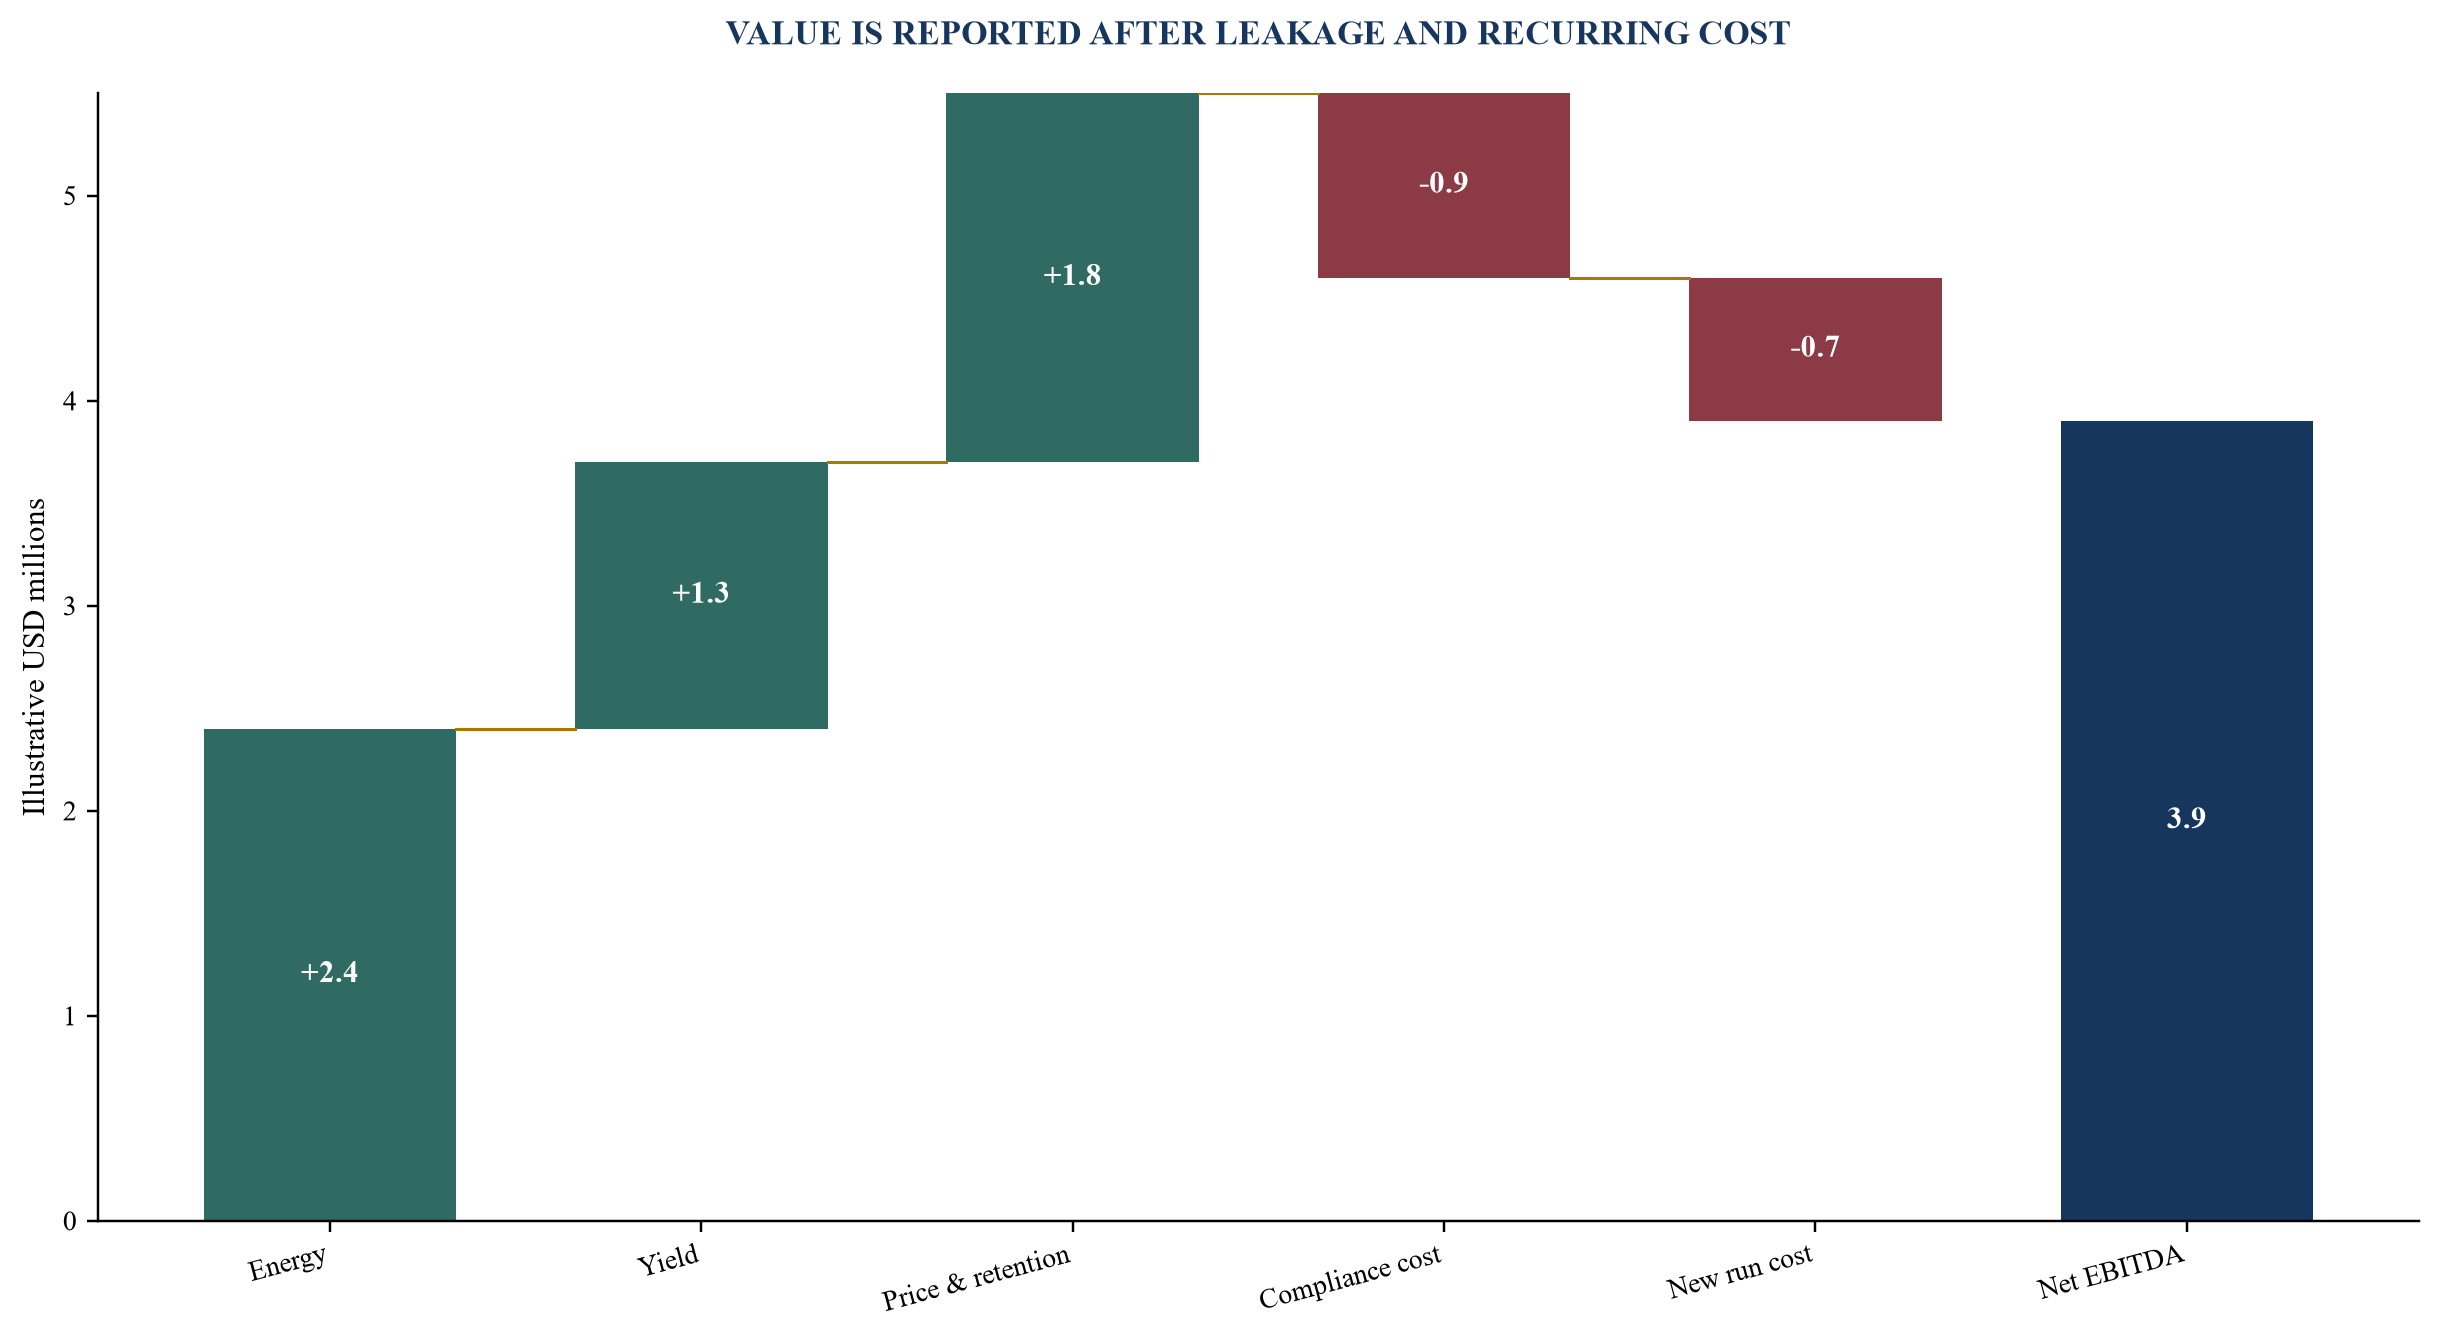
All amounts are illustrative management assumptions in USD millions.
8. Protect cash conversion and working capital
Transition initiatives can improve EBITDA while consuming cash. Equipment deposits, engineering studies, inventory changes, supplier prepayments, certification, data systems and implementation support can occur before benefits. The cash plan should show timing by legal entity and currency, including tax, duties, grants, incentives and financing conditions where relevant.
Working capital can change through the commercial model. A new material may require longer lead times or minimum orders. Customers may negotiate extended terms for transition projects. Exporters under carbon-border regimes may need more data and contract coordination before invoicing. Product changes can create obsolete inventory or parallel stock. The initiative case should include these effects.
The board should distinguish committed funding from anticipated support. A grant application, green facility or customer contribution is conditional until the relevant agreement is executed and conditions are satisfied. The downside case should delay support, raise implementation cost and test lower operating benefit. Minimum liquidity and covenant headroom should survive the selected downside.
Cash benefits need validation too. Reduced consumption may lower monthly spend only after tariffs, demand charges and contract terms are considered. Avoided capital expenditure requires evidence that the original spend remained necessary. Inventory release should reconcile to stock and cash. The cash ledger can prevent the transition programme from overstating liquidity while reporting accounting benefits.
9. Apply disciplined capital allocation
Transition capital should compete through a board-approved framework. The framework can score strategic necessity, compliance, customer value, operating return, risk reduction, technical readiness, reversibility, timing and financing availability. The decision should identify who bears construction, performance, price, technology and regulatory risk.
The model should use full lifecycle economics. Initial equipment cost is only one component. Engineering, downtime, connection, permitting, commissioning, training, maintenance, software, measurement, financing, decommissioning and residual value can be material. Management should compare ownership, lease, service contract, power-purchase agreement and supplier-financed structures where available and appropriate.
Carbon-price scenarios can support decisions but should not manufacture a return. The company should state whether a price is contractual, regulated, internal or hypothetical. Customer price and volume assumptions should remain separate. A project can pass only if its investment case is supported under the selected base and downside, or if the board explicitly approves a strategic or compliance rationale.
Stage gates preserve option value. Early engineering or a pilot can resolve uncertainty before full commitment. A board can approve development capital with conditions tied to performance, grid access, customer commitment or financing. The capital plan should show cancellation rights, sunk cost and the decision date at every gate.
Table 3. Transition initiative investment register
| initiative | value mechanism | full cost | critical dependency | evidence stage | approval gate |
|---|---|---|---|---|---|
| process controls | lower consumption and better yield | controls, instrumentation and training | stable production baseline | measured pilot | scale after normalised saving |
| renewable electricity | cost visibility and lower purchased-power emissions | contract, connection and credit support | supplier and grid performance | priced offer | contract and downside approval |
| product redesign | customer retention, price or new segment | research, testing, tooling and certification | customer acceptance | validated prototype | customer and margin gate |
| fleet transition | fuel and maintenance change | vehicles, charging and route redesign | infrastructure and utilisation | operating trial | lifecycle-cost gate |
| heat conversion | energy and transition-risk reduction | equipment, downtime and enabling works | technology and site capacity | engineering design | funded final investment decision |
| supplier programme | data, resilience and lower embedded exposure | onboarding, audit and sourcing effort | supplier capability | priority cohort | commercial and control gate |
Each initiative keeps technical, commercial and financial evidence connected.
Table 4. Capital-allocation gates
| gate | question | minimum evidence | downside test | decision authority | stop condition |
|---|---|---|---|---|---|
| strategic | does the initiative protect or create material value? | named customer, cost, risk or option mechanism | benefit absent or delayed | executive committee | no material decision use |
| technical | can it perform safely at required scale? | engineering design, pilot or warranted specification | lower performance and delayed start | operations and board | unsafe or unproven critical design |
| commercial | will customers accept the product, evidence and price? | account feedback, specification or contract route | price and volume underperform | commercial executive | material revenue at unmanaged risk |
| financial | do cash and return survive full costs? | integrated model and funding route | cost overrun and benefit delay | board or investment committee | liquidity or covenant breach |
| evidence | can outcomes be measured and claimed responsibly? | baseline, method, controls and approval | data gap or factor change | finance and claim owner | unsupported external claim |
| delivery | does the company have owners and capacity? | work plan, resources and dependencies | competing programme or supplier failure | chief executive | no accountable delivery route |
The weakest critical gate controls commitment; scores do not override red conditions.
10. Connect the plan to financing capacity
Lenders increasingly incorporate climate-related risk through ordinary credit, sector and client processes where relevant. The European Banking Authority's ESG risk guidelines apply from January 2026 for most institutions and require internal processes for identifying, measuring, managing and monitoring ESG risks, including plans for resilience [11]. The EBA's 2026 Pillar 3 update extends ESG-risk disclosures across institutions under CRR3 [12]. Banks can therefore ask borrowers for exposure, strategy, targets and implementation evidence even when the borrower is outside a particular corporate-reporting regime.
The UAE has moved from principles to an in-force climate-related financial risk management regulation for covered financial institutions [13]. Its rulebook connects climate transition planning with business strategy, financing, investment, underwriting and due diligence [14], and its credit standards allow climate-related risk to affect underwriting, engagement, tenor, loan-to-value and valuation practices [15]. A borrower should expect the quality of its plan and data to influence dialogue, while each institution retains its own risk criteria.
Management should prepare a lender evidence pack containing the exposure map, initiative portfolio, capital plan, scenario analysis, governance, targets, data controls and progress. The pack should reconcile to the financial model and explain uncertainty. It should avoid promising a financing advantage. Pricing, capacity, covenants and eligibility depend on lender policy, market conditions, credit quality and transaction structure.
Financing instruments should match the use of proceeds and risk. Asset finance, performance contracts, project finance, corporate debt, green or sustainability-linked facilities and equity can each allocate risk differently. Sustainability-linked terms need measurable, ambitious and controlled performance indicators, along with clear consequences and verification. Qualified advisers should assess documentation, disclosure, tax, accounting and regulatory treatment.
11. Make customer retention a governed workstream
Customer transition requirements can become a revenue condition before they become a legal obligation for the supplier. Large buyers may request emissions information, product footprints, targets, assurance, renewable-energy evidence or improvement plans. The company should map those requests to contracts, tenders, supplier portals and account conversations, then quantify the revenue and margin exposed.
Accounts should be segmented by requirement maturity and economic importance. A strategic customer with a near-term tender and detailed evidence request needs a joint commercial and operational plan. A customer with broad ambitions and no current specification may need monitoring and early engagement. Management should avoid overstating requirements based on questionnaires alone; the account owner should distinguish mandatory specification, scored criterion, informational request and future signal.
The retention plan should state the product, evidence, price and service response. A lower-carbon product that arrives late or fails quality will not protect the account. A technically strong product may remain uneconomic without contract duration or price recognition. Customer commitments can support capital approval when they are sufficiently specific and enforceable.
Claims need control. Sales materials should use approved boundaries, methods, periods and qualifications. Product-level claims should not be inferred from corporate targets. Offsets or certificates should be described accurately and supported by contracts and retirements where applicable. Legal and technical specialists should review material public statements to reduce conduct and greenwashing exposure.
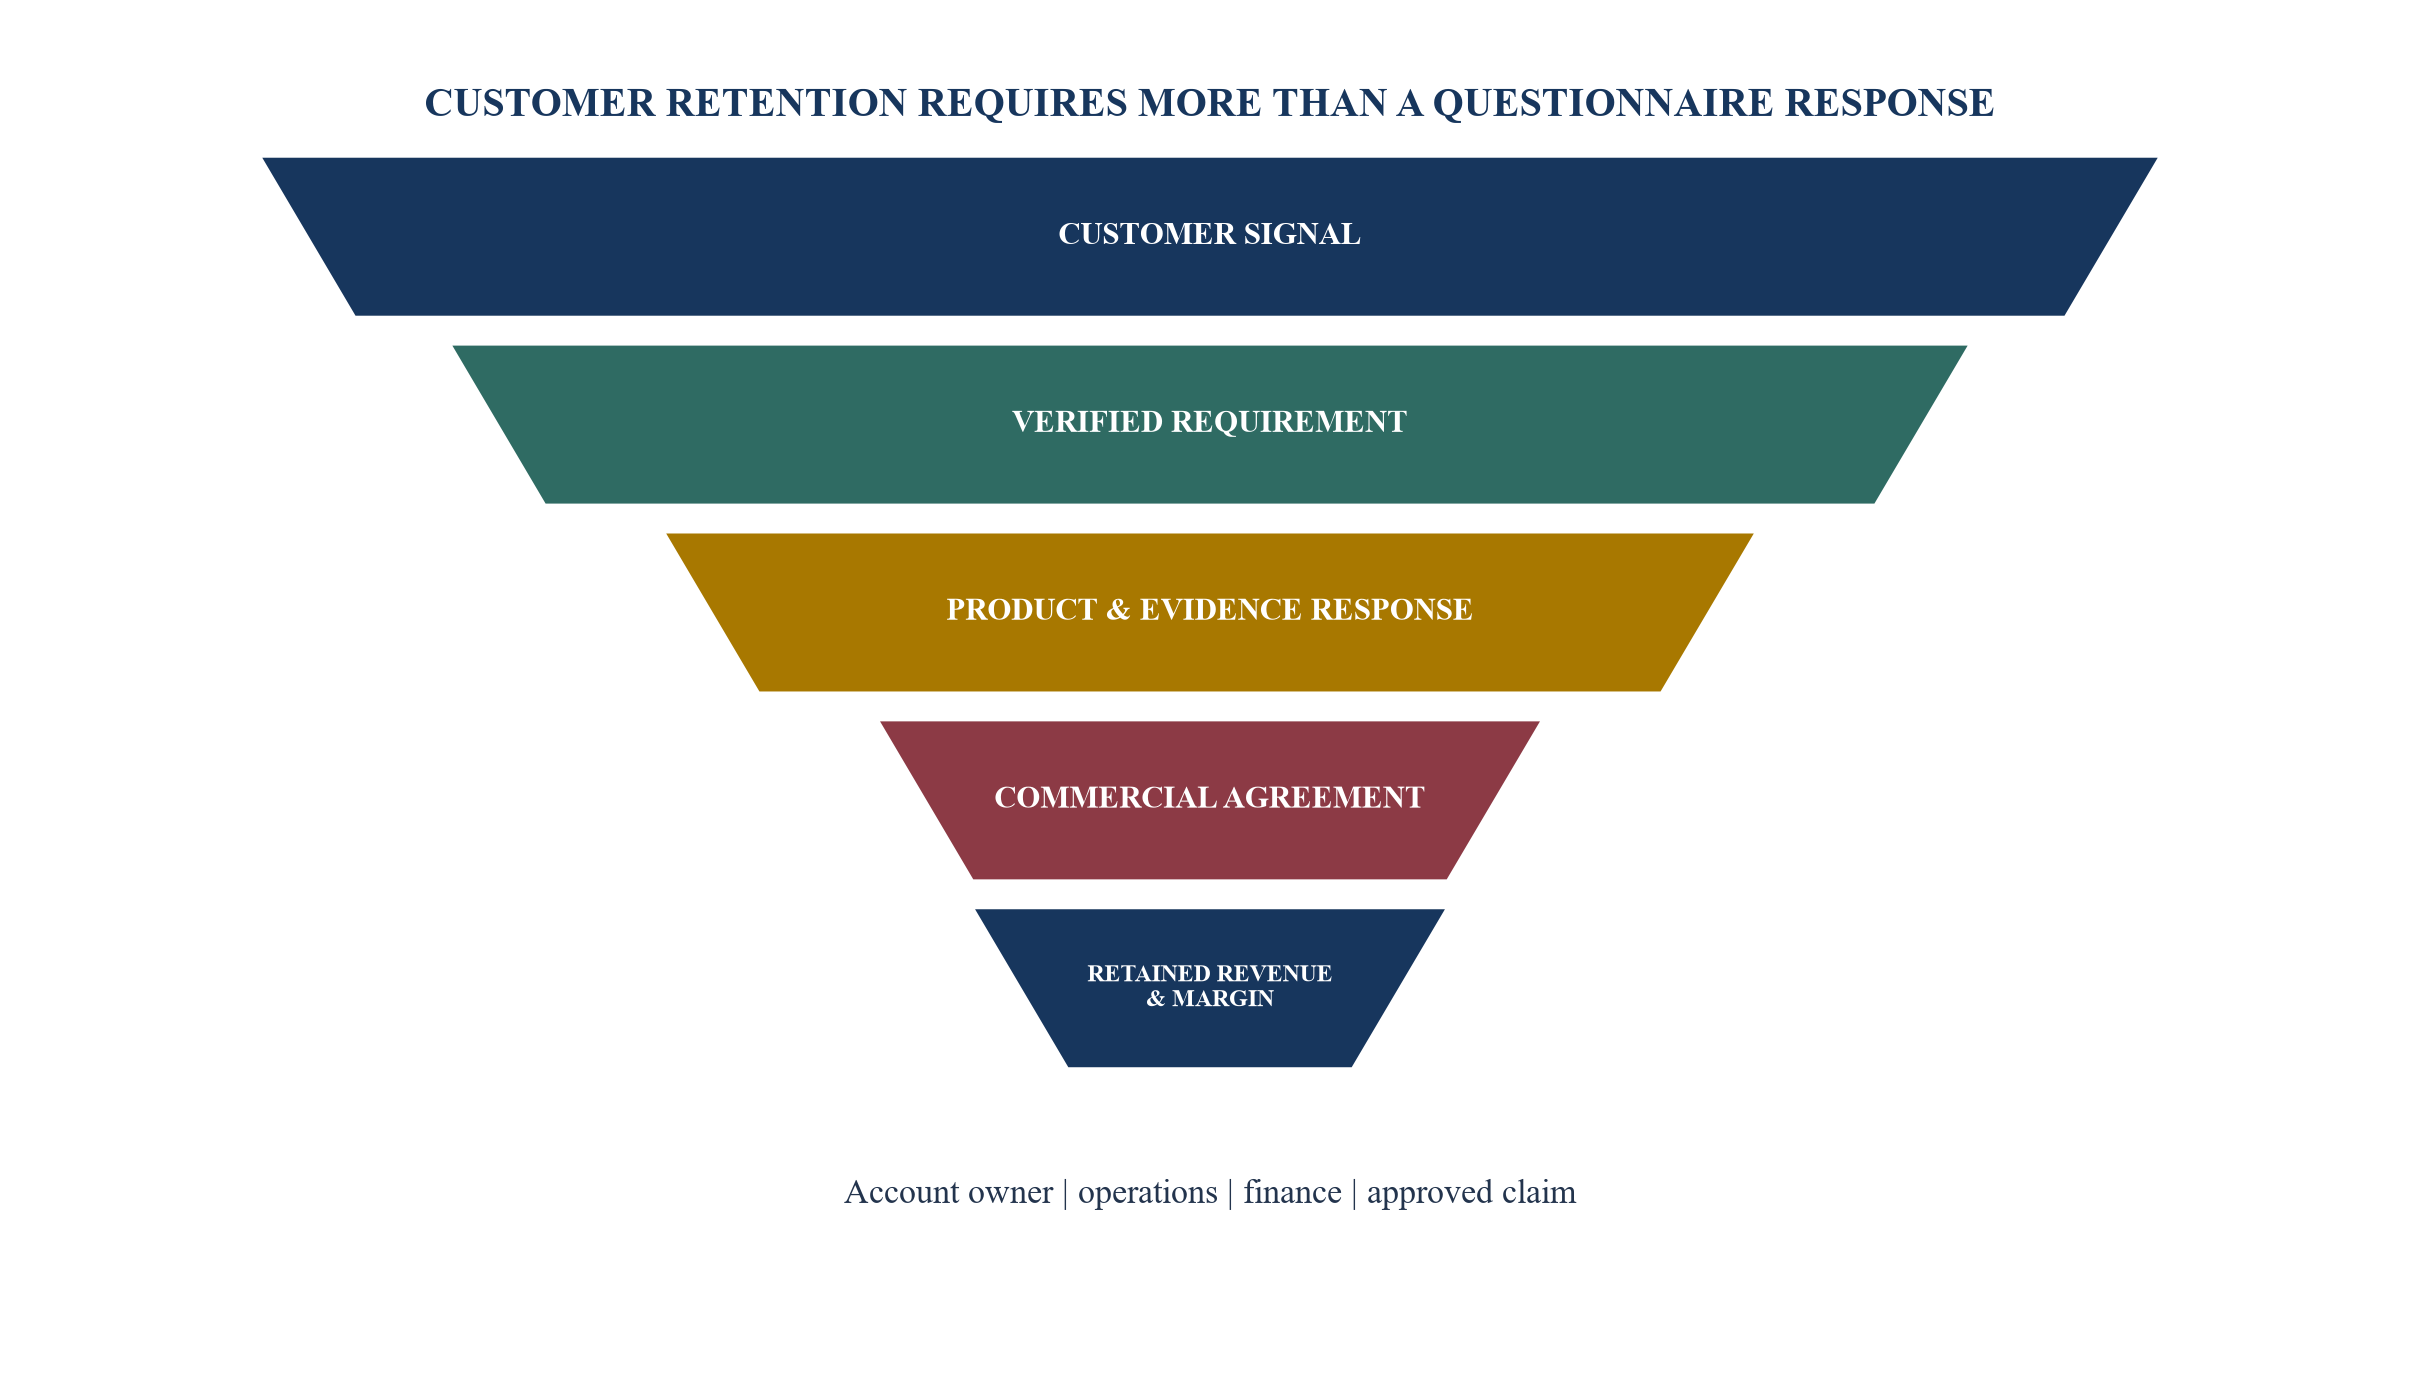
A request becomes value only when evidence, product performance and commercial terms align.
Table 5. Priority-account transition plan
| account segment | verified requirement | value at risk | response | proof required | decision trigger |
|---|---|---|---|---|---|
| renewal-critical | disclosed product and supplier data | renewal revenue and margin | close data gap and agree submission | controlled inventory and approved response | tender or renewal date |
| specification-led | lower-carbon product threshold | qualification and volume | redesign or source compliant input | tested specification and chain of custody | customer validation |
| price-sensitive | preference without premium | share and margin | lowest-cost operational improvement | product evidence and cost bridge | bid economics |
| partnership | joint reduction opportunity | retention and expansion | co-design initiative and governance | shared baseline and milestone record | signed programme |
| monitoring | broad future ambition | longer-term relevance | track account and preserve options | current request log | change in procurement rule |
Customer requirements should be evidenced in contracts, tenders or authorised correspondence.
12. Use product and pricing decisions to protect margin
Product transition should be managed through portfolio economics. Management can map products by current margin, customer demand, emissions exposure, technical pathway and capital requirement. The result can identify products to optimise, redesign, reposition, partner, harvest or retire. The decision should consider service, quality and customer switching cost alongside environmental characteristics.
Pricing should reflect differentiated value and cost. A verified lower-carbon product may support qualification, preferred-supplier status, longer contract duration or price. These outcomes require evidence from actual negotiations. The company should avoid embedding an assumed premium across the forecast without customer support. Scenario cases can separate price, volume, retention and cost.
Contract architecture can share transition risk. Pass-through clauses, indexation, volume commitments, take-or-pay, customer contributions, multi-year terms and change mechanisms can support investment. Their enforceability and accounting treatment require professional review. The commercial team should understand which terms are needed before promising a transition timetable.
The product roadmap should connect research, sourcing, production, certification, marketing and sales. A product claim can fail because the underlying data boundary differs from the customer's required method. Early alignment reduces redesign and unsupported claims. The board can track products through evidence gates similar to capital projects.
13. Treat suppliers as part of the operating model
Value-chain emissions and transition exposure often sit outside the company, while customer obligations flow through it. The supplier programme should begin with material purchased categories, critical suppliers and customer-linked products. Spend alone is an imperfect proxy; operational importance, emissions intensity, substitutability and data relevance also matter.
The company should define the supplier evidence required and the purpose. Requests can cover activity data, methodology, product footprint, energy source, target, audit or improvement plan. A smaller supplier may need a staged route and standard tool. Management should avoid imposing expensive data collection where it does not affect a decision.
Supplier engagement should connect to sourcing choices. The company can compare improvement, substitution, redesign, localisation, aggregation and contract changes. A low reported footprint is not sufficient if quality, delivery, human rights, resilience or total cost deteriorate. Procurement should retain a balanced supplier scorecard and document trade-offs.
Contract terms can address data rights, update frequency, methodology, audit, claims, confidentiality and remediation. Qualified advisers should review them. The supplier programme should also protect competition-sensitive and personal data. Evidence should flow into the product and customer response through controlled lineage.
14. Make operations and energy performance measurable
Operational transition should be embedded in daily management. Site teams need normalised energy and material intensity, yield, downtime, maintenance, waste, quality and throughput indicators. The measures should sit beside cost and service, allowing managers to see whether an initiative creates value or shifts a problem.
Measurement and verification plans should be designed before implementation. The plan defines baseline period, operating adjustments, meter boundary, factor source, exclusions, data frequency, owner and approval. Changes in production volume, mix, weather and equipment can otherwise make savings difficult to distinguish. Independent verification may be appropriate for contractual or external claims.
Maintenance is often part of the transition mechanism. Controls drift, leaks return, filters clog and operator behaviour changes. A project should include recurring operating routines and budget. The value ledger should reduce or suspend benefits when evidence shows performance has not persisted.
Energy sourcing also requires contract and risk analysis. Price, tenor, volume shape, curtailment, credit support, grid connection, certificates and change in law can affect economics. The emissions effect depends on the accounting method and evidence. Technical, legal, financial and accounting specialists should validate the selected structure.
15. Connect asset strategy, impairment and useful life
Transition assumptions can affect asset lives, residual values, impairment, provisions, inventories, contracts and forecasts. The IFRS Foundation issued illustrative examples in November 2025 on reporting uncertainties in financial statements, including climate-related fact patterns [4]. These materials emphasise applying existing accounting requirements and connecting material assumptions and uncertainties to financial reporting.
The asset register should identify transition exposure by site, process and equipment. Management should record maintenance need, energy source, emissions dependence, customer relevance, regulatory constraint, replacement window, retrofit option and residual value. The map supports capital sequencing and avoids committing growth capital to an asset whose transition pathway is unresolved.
Accounting conclusions remain the responsibility of management, auditors and qualified advisers. The value-creation plan should provide consistent operational assumptions to the accounting process. If the board expects a plant to retire earlier, a product to lose demand or operating cost to rise, financial forecasts and impairment models should be reviewed for consistency.
Exit planning benefits from this discipline. A buyer can test a clear asset pathway, funded capital plan and reconciled assumptions. Hidden transition capital or inconsistent useful lives can create price adjustments and delay. The data room should retain engineering, approvals, performance, contracts, accounting analysis and board decisions.
16. Build a controlled data and reporting spine
Transition information travels from meters, invoices, suppliers and operating systems into customer responses, financing packs, sustainability reports and financial statements. The company should maintain one governed data spine with source lineage, calculation rules, version control, review, approval and retention. Different outputs may have different boundaries, but their relationship should be explicit.
The control design should classify each metric by consequence. A management estimate used for prioritisation can follow a lighter route than a statutory disclosure, lender covenant or public product claim. Material outputs need source evidence, change control and responsible approval. Data gaps should remain visible rather than being hidden in a composite score.
Reporting should distinguish actual, estimated, modelled and targeted values. It should also distinguish gross operational changes from contractual instruments or offsets. Restatements and methodology changes need a controlled record. The GHG Protocol standards and jurisdictional rules provide methods and requirements; the company still needs an operating control environment [27][28].
Automation can improve collection and reconciliation, but authority remains important. Systems should not publish or submit material claims without an approved workflow. Access, confidentiality, cyber risk, model logic and vendor dependence should be governed. The board should receive exceptions and evidence quality, not only headline totals.
17. Govern carbon prices, certificates and credits separately
Carbon taxes, emissions trading systems, border adjustments, renewable certificates and voluntary credits have different legal and economic characteristics. The company should maintain an instrument register showing jurisdiction, obligation, contract, quantity, vintage, ownership, delivery, price, accounting assessment, claim use and retirement or surrender status.
An internal carbon price is a decision tool. It can test project resilience, prioritise capital or estimate exposure. It does not create an external cash cost unless linked to an actual obligation or internal charge. Management should identify the price path, scope and decision rule. Multiple scenarios can be more useful than one precise forecast.
Certificates and credits should not be blended into operational reduction. The board should see gross emissions, operating change and instrument use separately. Claims should explain boundaries and methods. Contractual quality, registry, additionality or corresponding adjustments can require specialist review depending on the instrument and claim.
CBAM further illustrates the need for precision. It addresses embedded emissions in covered imports and certificate obligations for authorised declarants under EU rules [7]. The commercial effect on a non-EU producer can arise through customer data requests, sourcing and price even when the importer carries the formal obligation. Contracts should allocate information, verification and cost responsibilities clearly.
18. Use scenarios to test decisions, not to predict one future
Scenario analysis should reveal vulnerabilities and choices. The NGFS Phase V scenarios provide current long-term climate macro-financial pathways and updated physical-risk estimates [24]. They are analytical inputs, not forecasts. A portfolio company can combine external pathways with company-specific variables such as energy price, customer demand, carbon cost, technology availability, weather disruption, financing and regulation.
The board should select a small number of coherent scenarios and identify the decisions they stress. A current-policy case can test exposure to physical risk and slower market change. An orderly transition can test planned capital and customer opportunity. A disorderly transition can test abrupt price, policy and financing effects. Company-specific severe cases can add grid constraints, supplier failure or loss of a major account.
Each scenario should flow through revenue, cost, working capital, capital expenditure, asset value, liquidity and covenants. Management should state assumptions and avoid false precision. The decision output can include investments that remain robust, options to preserve, thresholds to monitor and contingency actions.
Scenarios should be refreshed when external or company facts change. A new customer specification, energy contract, acquisition, regulatory rule or technology milestone can alter the pathway. The board pack should show which assumptions moved and which decisions require reconsideration.
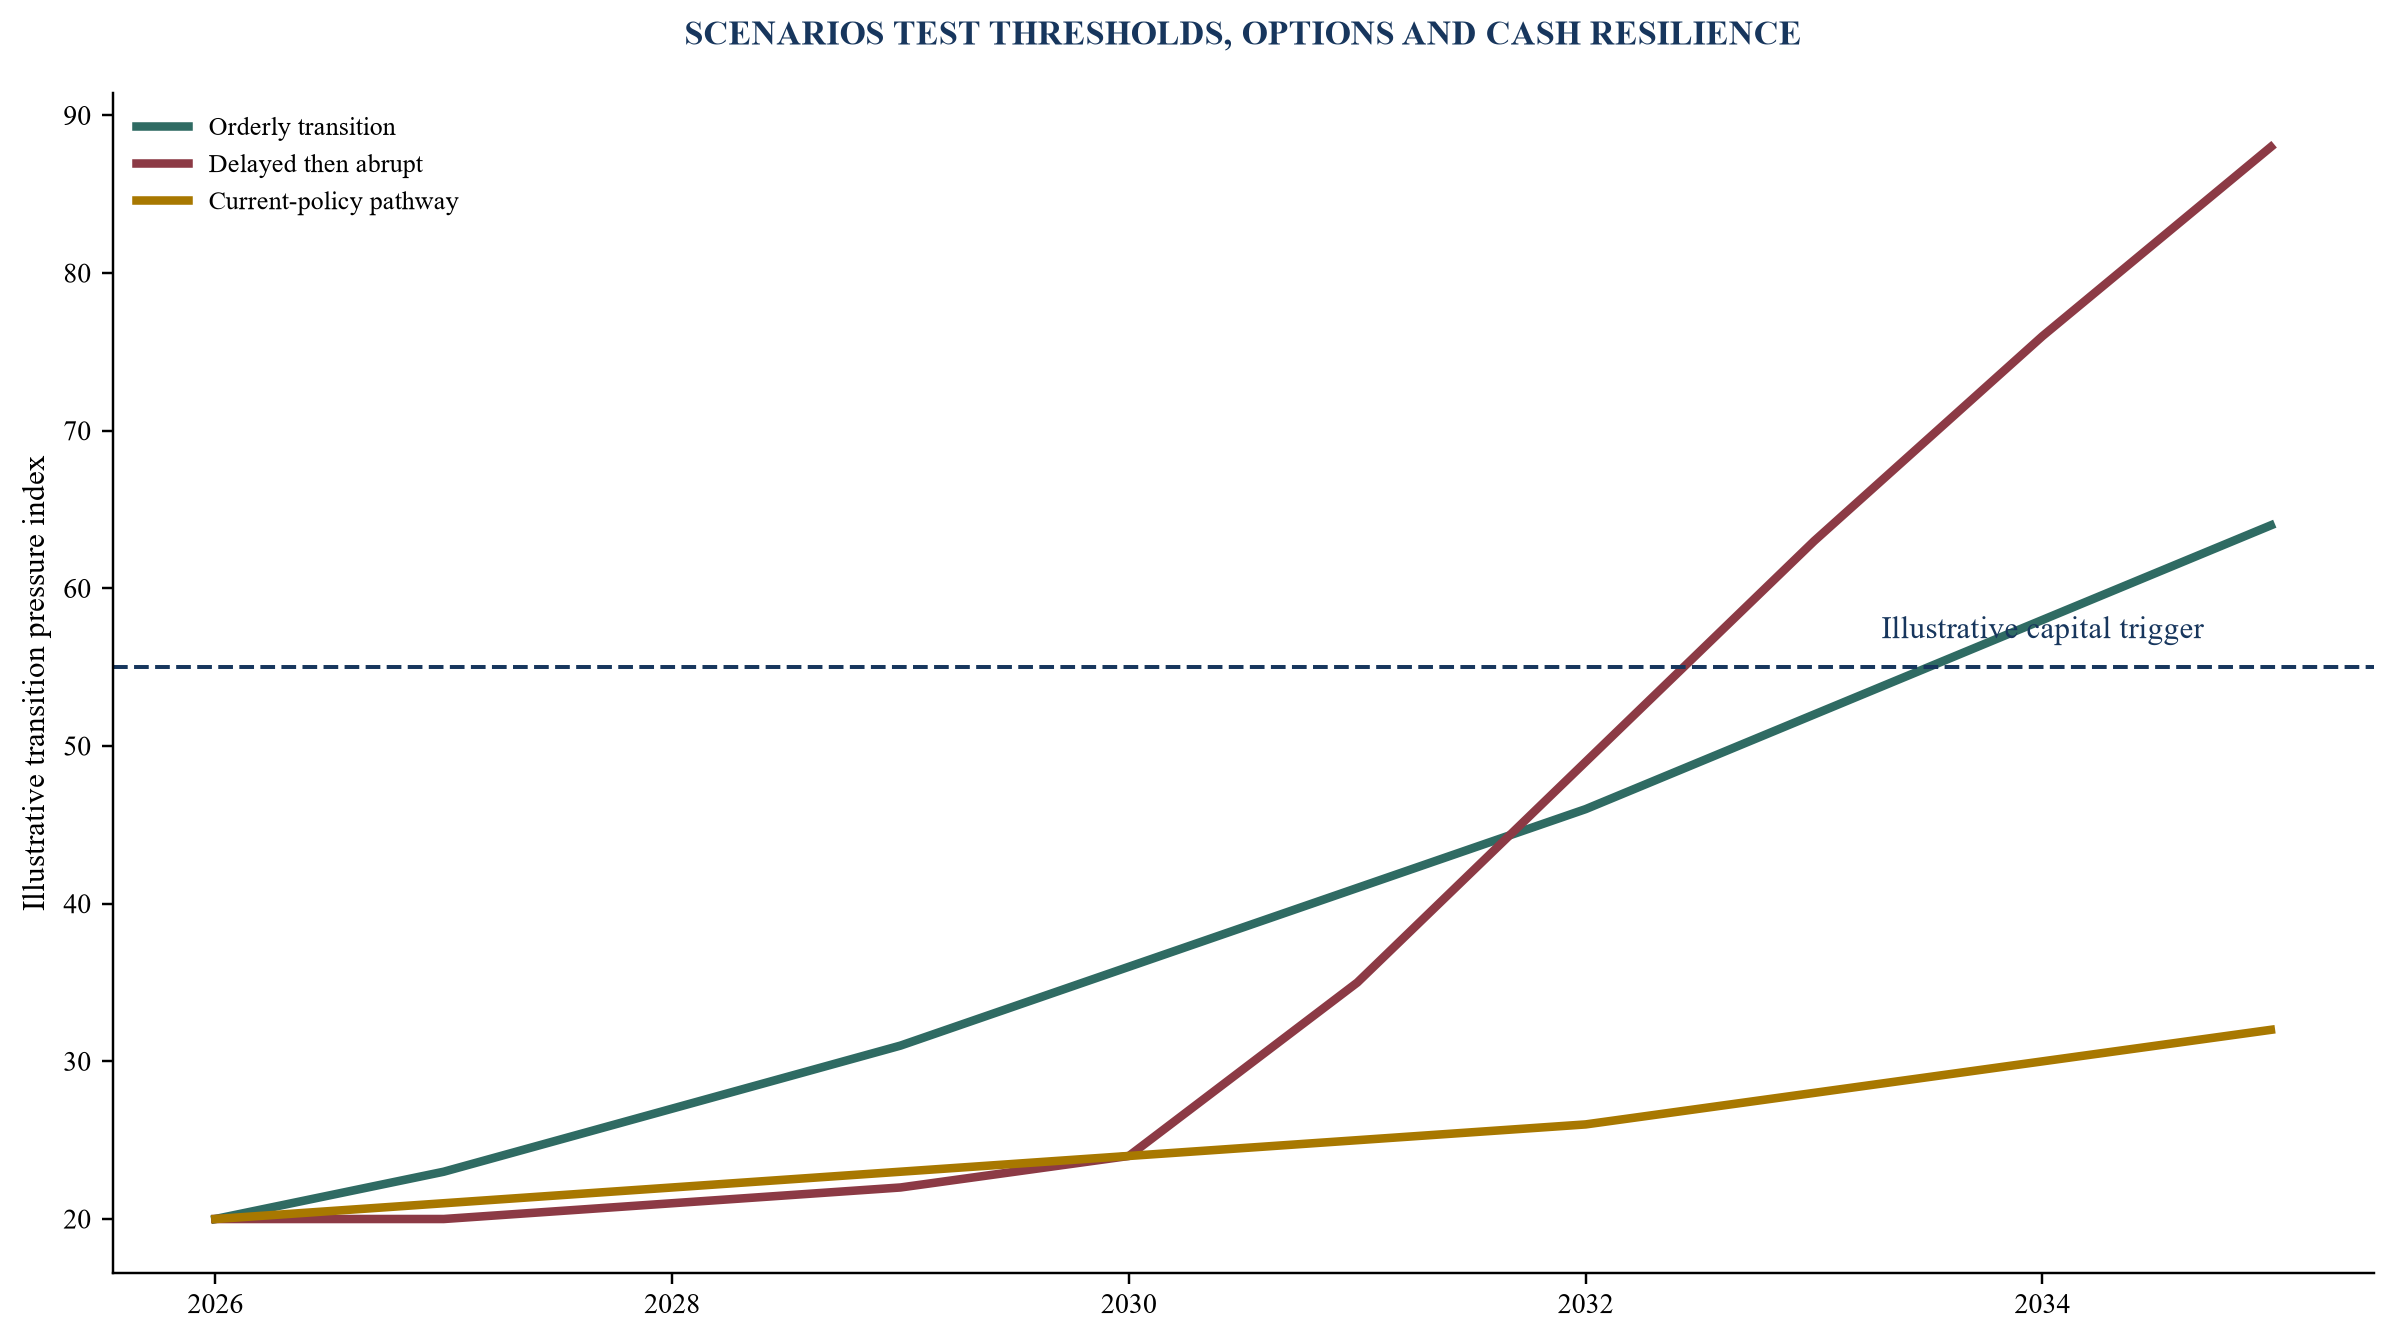
Illustrative paths test resilience; they do not predict future prices or outcomes.
19. Establish the transition operating model
The board approves the transition ambition, risk appetite, capital boundary, material targets and external claims. The chief executive owns integration with business strategy. Business leaders own operating outcomes. Finance owns economic baselines, capital allocation and validated value. Operations, procurement, commercial, technology, risk, legal and sustainability functions own their respective evidence and controls.
A transition office can coordinate the portfolio without absorbing accountability. It maintains the initiative register, dependency map, data standards, decision calendar, value ledger and board pack. Every initiative retains one operating owner and one finance reviewer. Specialist technical and legal conclusions remain with qualified professionals.
Decision rights should specify who can approve targets, capital, customer commitments, methods, instruments and claims. Exceptions need an expiry and remediation owner. Remuneration can include transition outcomes only where participants can influence them and measurement is controlled. The board should preserve discretion for safety, conduct, data quality and unintended outcomes.
The cadence can align with existing performance management. Sites review operating indicators weekly; executives review initiative and customer decisions monthly; the board reviews material value, capital, risk and claims quarterly or upon trigger. This keeps transition connected to management rather than creating a parallel reporting cycle.
20. Track value through a controlled ledger
The value ledger should contain one record for each initiative. It identifies baseline, counterfactual, operating mechanism, owner, full cost, timing, dependencies, evidence stage, profit and loss destination, cash effect and customer or risk outcome. Finance validates the classification and prevents duplication.
Stages can include hypothesis, approved case, contracted, commissioned, operational, observed and finance-validated. Movement between stages requires evidence. A signed equipment order does not create saving. Commissioning does not prove persistence. A customer conversation does not create retained revenue. The stage model helps the board distinguish delivery progress from value.
Benefits should remain reversible when evidence changes. If output rises, an absolute energy reduction may disappear while intensity improves. If a contract ends, retained revenue should leave the forward view. If a methodology changes, the baseline and claim may need restatement. The ledger should keep an audit trail.
The exit bridge can aggregate validated items and separately present enabled options. A buyer can inspect the mechanism, source and sustainability of each benefit. Unsupported targets and distant scenarios should remain outside realised value. This preserves credibility and makes remaining upside more transparent.
21. Apply the framework to a hypothetical industrial platform
Consider a hypothetical diversified industrial platform with USD 420 million of revenue and USD 54 million of EBITDA. Forty percent of revenue comes from customers that have introduced supplier transition requirements. Twelve percent relates to products potentially exposed through covered European import chains. Management is considering USD 18 million of transition capital over three years. These are illustrative assumptions only.
The baseline identifies four material mechanisms: energy and process efficiency, material yield, customer qualification and product redesign. The initiative model estimates USD 5.5 million of gross annual operating benefit. After recurring data, maintenance and compliance cost, the hypothetical net annual EBITDA contribution is USD 3.9 million. The downside case delivers USD 2.1 million and delays commissioning by twelve months. No valuation conclusion follows from these assumptions.
The customer map shows two strategic accounts representing USD 62 million of revenue with near-term tender requirements. Management links product evidence and account plans to capital gates. One product redesign receives development funding and a customer validation gate before tooling. A larger process conversion remains an option because grid capacity and customer price recognition are unresolved.
The financing pack reconciles the transition portfolio to the base and downside forecasts. The board protects minimum liquidity and approves a stage-gated USD 11 million committed envelope. The remaining USD 7 million stays conditional on engineering, customer and infrastructure milestones. Value is reported only after operational and finance validation.
This example demonstrates the framework's central discipline: the board does not approve a narrative target in isolation. It approves exposures, initiatives, costs, capital boundaries, customer actions, evidence and decision triggers as one connected system.
22. Build the board pack around decisions
The board pack should begin with decisions and exceptions. It shows changes in material exposure, customer revenue at risk, cost and cash performance, capital commitments, financing dialogue, initiative gates, evidence quality, claims and regulatory updates. A concise dashboard should open into source records when directors need detail.
Every red or amber signal needs an owner, action, deadline and requested decision. The pack should distinguish external change from execution variance. A new rule, customer demand or price path may change the plan even when initiatives are on schedule. Management should explain the value and cash consequence.
The pack should reconcile to the forecast and capital plan. Current and anticipated financial effects under IFRS sustainability materials connect transition information to financial position, performance and cash flows [3]. Accounting and sustainability assumptions should be compared before approval. Differences can be valid when boundaries or purposes differ, but they should be explained.
Board minutes should record material judgements, alternatives, dependencies and specialist advice. This evidence supports accountability, reporting, financing and exit diligence. It also creates organisational learning when assumptions prove wrong.
Table 6. Decision-oriented transition board pack
| board view | core question | evidence | decision or action | owner | trigger |
|---|---|---|---|---|---|
| exposure | what changed in regulation, markets, customers or assets? | requirements map and account evidence | revise scope or priority | chief executive | material external change |
| value | which mechanisms created observed and validated results? | operating baseline and finance ledger | scale, correct or stop | business and finance | variance beyond tolerance |
| customers | which revenues need product or evidence action? | account plan, tender and contract | approve offer or investment | commercial executive | renewal or qualification date |
| capital | which commitments are ready and affordable? | full-cost case, downside and funding | approve stage or retain option | board | investment gate |
| financing | what information or risk issue affects capacity? | lender pack and treasury record | engage, remediate or restructure | chief financial officer | refinancing or lender request |
| claims and reporting | can each material statement be supported? | source lineage, method and approvals | approve, qualify or withdraw | finance, legal and claim owner | publication or methodology change |
The pack focuses attention on value, cash, customers, capital and evidence.
23. Execute a 120-day value-creation programme
The first thirty days establish authority and evidence. The board confirms objectives, scope, materiality and decision rights. Management builds the requirements map, customer exposure view, operating baseline, asset screen and data-quality register. Finance establishes the value ledger and capital modelling standard. Immediate red conditions receive owners and containment.
Days thirty-one to sixty convert exposure into initiatives. Cross-functional teams define mechanisms, full costs, customer actions, technical dependencies and evidence. The company develops the marginal curve, capital gates, scenario variables and priority account plans. Qualified advisers confirm material legal, accounting, engineering and claims issues.
Days sixty-one to ninety validate and decide. Management runs site and customer tests, reconciles operating and financial baselines, prepares the lender evidence pack and assesses funding routes. The executive committee recommends committed projects, development options and deferred items. The board approves capital boundaries, targets, claims policy and stop conditions.
Days ninety-one to one hundred and twenty launch the operating system. Approved initiatives enter delivery with milestone and acceptance evidence. The board pack begins, account owners execute retention plans, data controls operate and finance validates early outcomes. The programme records unresolved dependencies and next decision dates.
The transition plan then becomes part of ordinary management. Weekly operations monitor the mechanisms; monthly performance reviews govern value and exceptions; quarterly board reviews govern capital, customers, financing, risk and external statements. The plan evolves as evidence, markets and rules change.
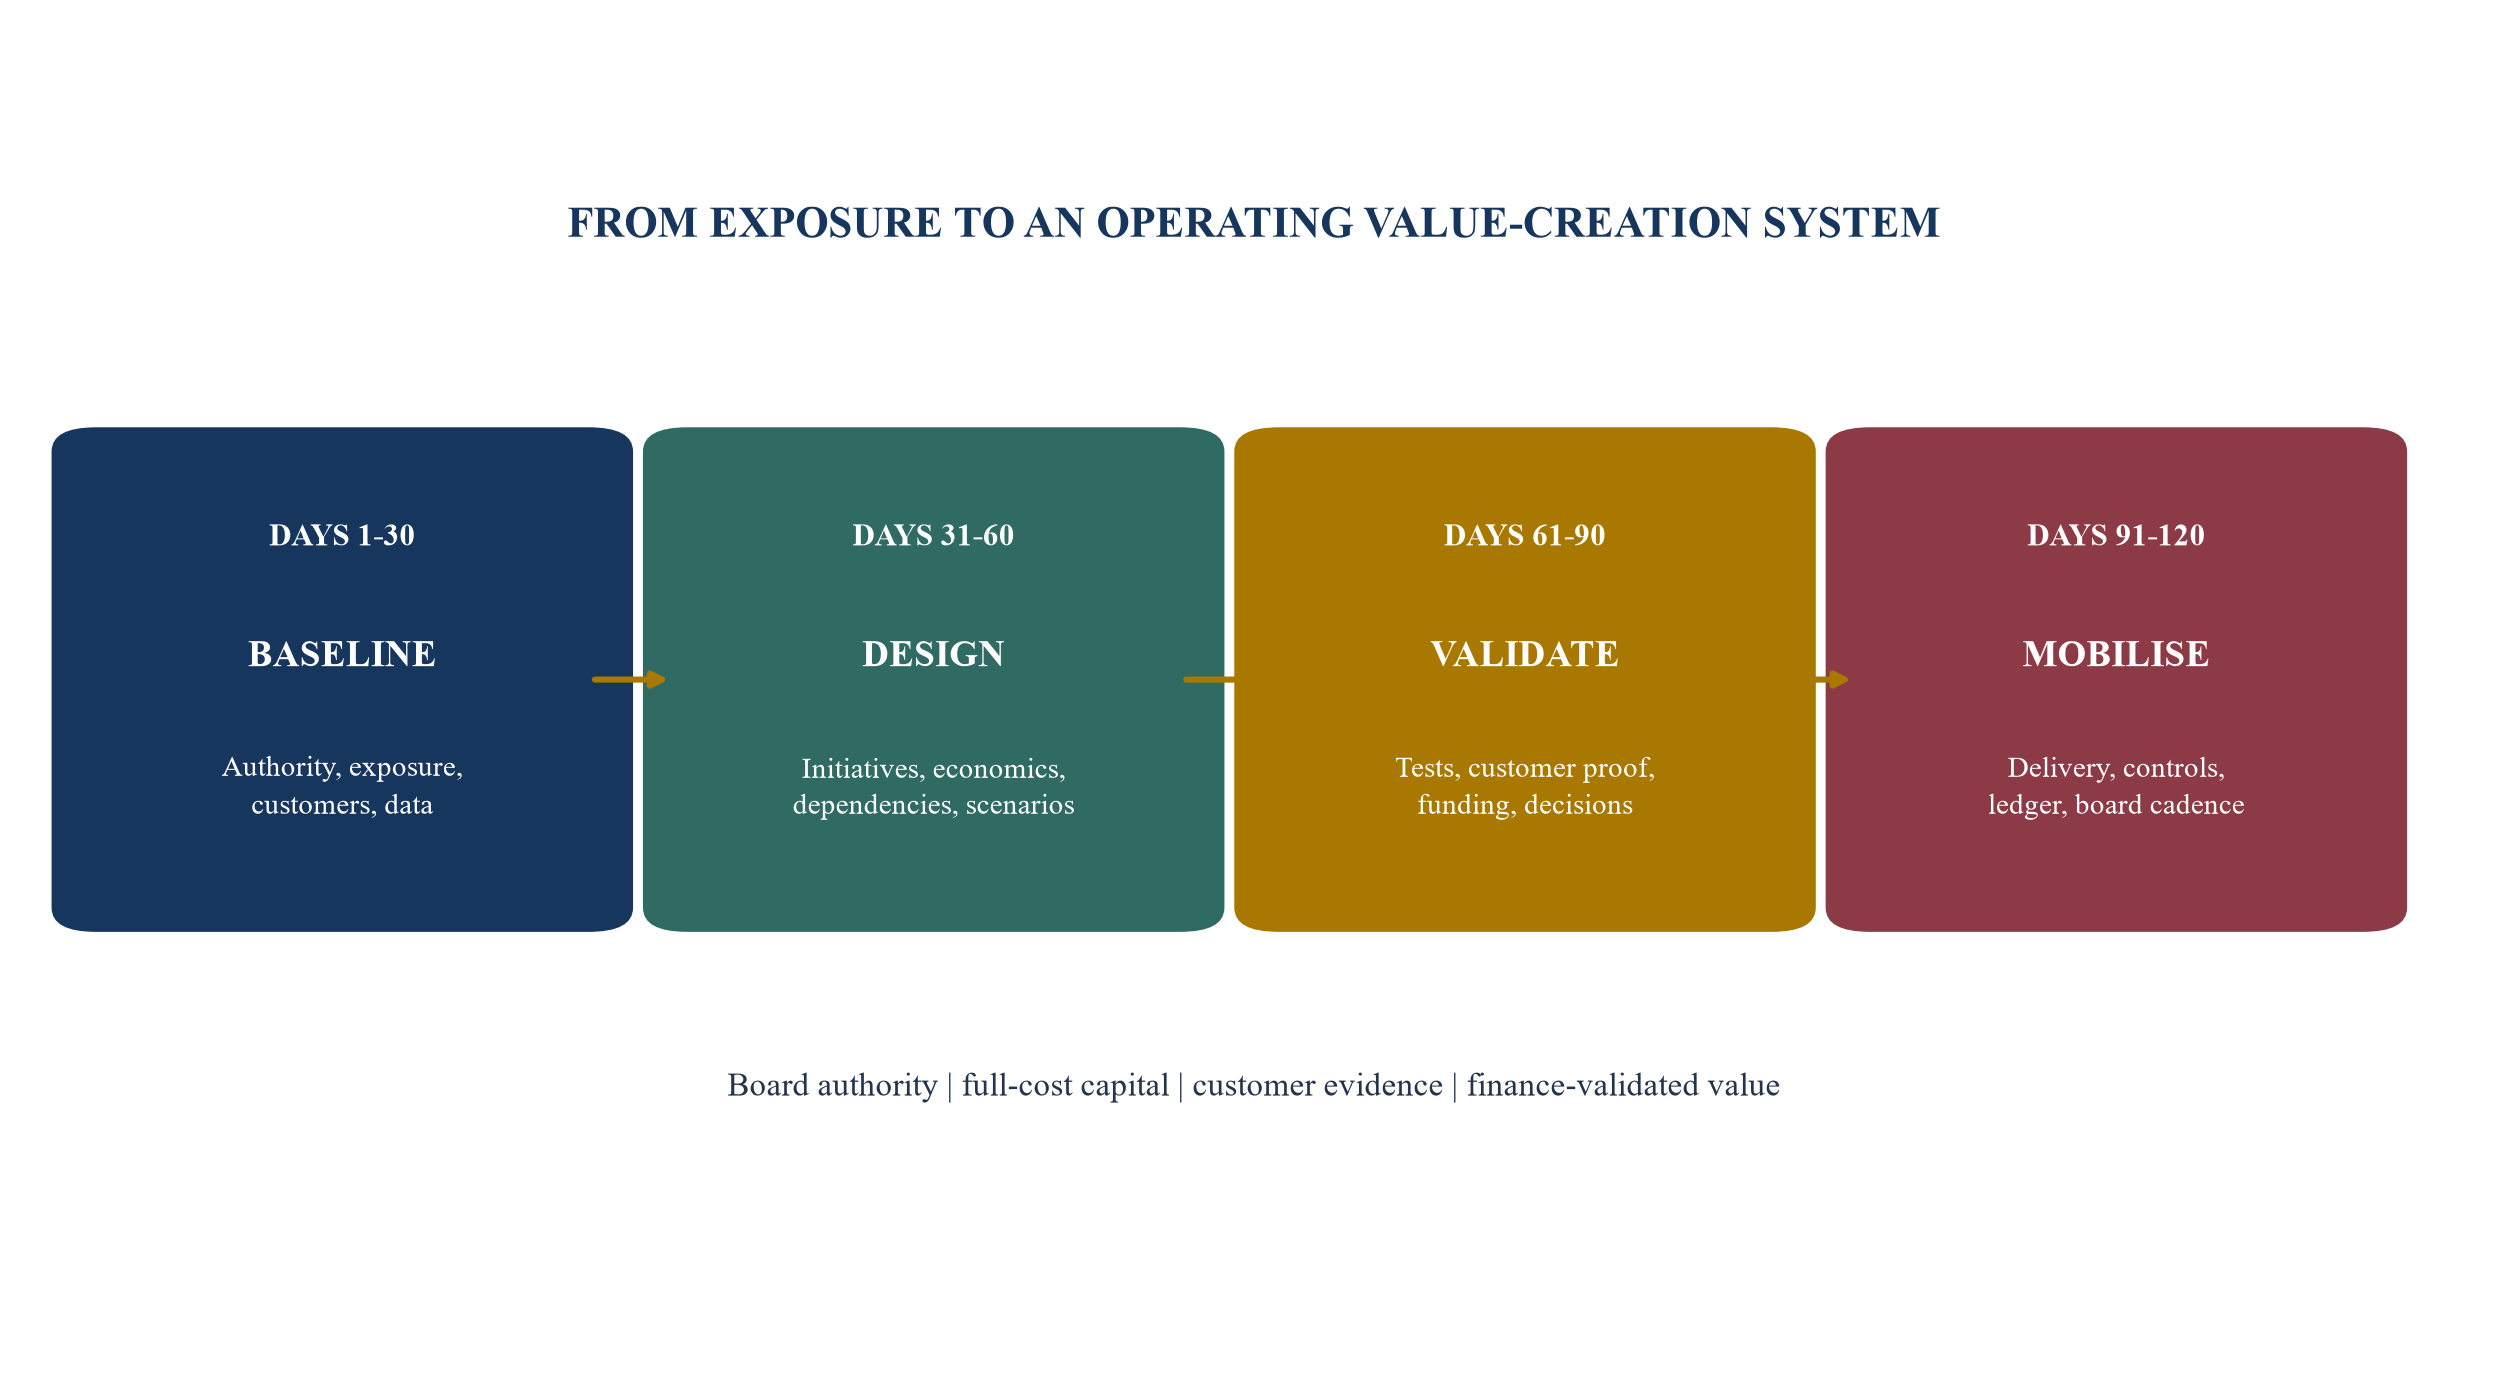
Workstreams overlap; stage gates preserve evidence and capital discipline.
References
- IFRS Foundation, Disclosing information about an entity's climate-related transition, including information about transition plans, in accordance with IFRS S2, June 2025. https://www.ifrs.org/content/dam/ifrs/supporting-implementation/ifrs-s2/transition-plan-disclosure-s2.pdf
- IFRS Foundation, IFRS S2 Climate-related Disclosures supporting materials. https://www.ifrs.org/supporting-implementation/supporting-materials-for-ifrs-sustainability-disclosure-standards/ifrs-s2/
- IFRS Foundation, Disclosing information about anticipated financial effects of sustainability-related risks and opportunities, August 2025. https://www.ifrs.org/news-and-events/news/2025/08/disclosing-information-anticipated-financial-effects/
- IFRS Foundation, Disclosures about Uncertainties in the Financial Statements, November 2025. https://www.ifrs.org/projects/completed-projects/2025/climate-related-risks-in-the-financial-statements/
- HM Government, Climate-related transition plan requirements: implementation routes, June 2025. https://www.gov.uk/government/consultations/climate-related-transition-plan-requirements/transition-plan-requirements-implementation-routes-accessible-webpage
- Transition Plan Taskforce, Disclosure Framework, October 2023. https://itpn.global/disclosure-framework/
- European Commission, Carbon Border Adjustment Mechanism definitive regime. https://taxation-customs.ec.europa.eu/carbon-border-adjustment-mechanism/cbam-definitive-regime_en
- European Commission, Officially published: Simplifications for the Carbon Border Adjustment Mechanism, October 2025. https://taxation-customs.ec.europa.eu/news/officially-published-simplifications-carbon-border-adjustment-mechanism-cbam-2025-10-20_en
- European Commission, Corporate Sustainability Reporting Directive transposition status, August 2026. https://finance.ec.europa.eu/regulation-and-supervision/financial-services-legislation/enforcement-and-infringements-banking-and-finance-law/monitoring-banking-and-finance-directives/corporate-sustainability-reporting-directive-20222464_en
- EFRAG, Transition Plan for Climate Change Mitigation: ESRS Implementation Guidance. https://www.efrag.org/sites/default/files/media/document/2025-02/03-02_-_transition_plan_esrs_implementation_guidance_v184.pdf
- European Banking Authority, Final Guidelines on the management of ESG risks, January 2025. https://eba.europa.eu/publications-and-media/press-releases/eba-publishes-its-final-guidelines-management-esg-risks
- European Banking Authority, EBA updates Pillar 3 disclosure requirements on ESG risks, June 2026. https://www.eba.europa.eu/publications-and-media/press-releases/eba-updates-pillar-3-disclosure-requirements-esg-risks-equity-and-shadow-banking-exposures-part
- Central Bank of the UAE, Climate-related Financial Risk Management Regulation, October 2025. https://rulebook.centralbank.ae/en/rulebook/climate-related-financial-risk-management-regulation
- Central Bank of the UAE, Incorporation of climate transition planning into overall business strategy and risk management processes. https://rulebook.centralbank.ae/en/rulebook/principle-3-incorporation-climate-transition-planning-overall-business-strategy-and-risk
- Central Bank of the UAE, Credit Risk Management Standards: climate-related credit risk. https://rulebook.centralbank.ae/en/rulebook/credit-risk-management-standards
- Singapore Exchange Regulation, Sustainability Report Rules 711A and 711B. https://rulebook.sgx.com/rulebook/sustainability-report
- Singapore Exchange Regulation, Practice Note 7.6: Sustainability Reporting Guide. https://rulebook.sgx.com/rulebook/practice-notes-3
- Australian Securities and Investments Commission, What should your sustainability report contain? https://asic.gov.au/regulatory-resources/sustainability-reporting/for-preparers-of-sustainability-reports/what-should-your-sustainability-report-contain/
- Australian Accounting Standards Board, AASB S2 Climate-related Disclosures. https://standards.aasb.gov.au/aasb-s2-sep-2024
- California Air Resources Board, Climate Corporate Data Accountability Act and Climate-Related Financial Risk reporting programme. https://ww2.arb.ca.gov/our-work/programs/california-corporate-greenhouse-gas-reporting-and-climate-related-financial-risk
- United States Securities and Exchange Commission, Proposed rescission of climate-related disclosure rules, May 2026. https://www.sec.gov/rules-regulations/2026/05/s7-2026-19
- Securities and Exchange Board of India, BRSR Core framework for assurance and ESG disclosures for value chain, July 2023. https://www.sebi.gov.in/legal/circulars/jul-2023/brsr-core-framework-for-assurance-and-esg-disclosures-for-value-chain_73854.html
- Securities and Exchange Board of India, Measures to facilitate ease of doing business with respect to BRSR, March 2025. https://www.sebi.gov.in/legal/circulars/mar-2025/measures-to-facilitate-ease-of-doing-business-with-respect-to-framework-for-assurance-or-assessment-esg-disclosures-for-value-chain-and-introduction-of-voluntary-disclosure-on-green-credits_93102.html
- Network for Greening the Financial System, NGFS long-term climate macro-financial scenarios Phase V. https://www.ngfs.net/sites/default/files/medias/documents/ngfs_scenarios_phase_v.pdf
- International Energy Agency, Scaling Up Transition Finance, October 2025. https://www.iea.org/reports/scaling-up-transition-finance
- International Energy Agency, Energy Efficiency 2025. https://www.iea.org/reports/energy-efficiency-2025
- Greenhouse Gas Protocol, Corporate Standard. https://ghgprotocol.org/corporate-standard
- Greenhouse Gas Protocol, Corporate Value Chain Scope 3 Standard. https://ghgprotocol.org/corporate-value-chain-scope-3-standard
- Science Based Targets initiative, Corporate Net-Zero Standard. https://sciencebasedtargets.org/corporate-net-zero
- International Organization for Standardization, ISO Net Zero Guidelines. https://www.iso.org/netzero
- OECD, G20/OECD Principles of Corporate Governance 2023. https://www.oecd.org/en/publications/g20-oecd-principles-of-corporate-governance-2023_ed750b30-en.html
- Japan Ministry of Economy, Trade and Industry, Transition Finance and Basic Guidelines on Climate Transition Finance. https://www.meti.go.jp/english/policy/energy_environment/transition_finance/
- European Commission, EU taxonomy for sustainable activities. https://finance.ec.europa.eu/sustainable-finance/tools-and-standards/eu-taxonomy-sustainable-activities_en
Sources and further reading
- IFRS Foundation, Disclosing information about an entity's climate-related transition, including information about transition plans, in accordance with IFRS S2, June 2025. Official source
- IFRS Foundation, IFRS S2 Climate-related Disclosures supporting materials. Official source
- IFRS Foundation, Disclosing information about anticipated financial effects of sustainability-related risks and opportunities, August 2025. Official source
- IFRS Foundation, Disclosures about Uncertainties in the Financial Statements, November 2025. Official source
- HM Government, Climate-related transition plan requirements: implementation routes, June 2025. Official source
- Transition Plan Taskforce, Disclosure Framework, October 2023. Official source
- European Commission, Carbon Border Adjustment Mechanism definitive regime. Official source
- European Commission, Officially published: Simplifications for the Carbon Border Adjustment Mechanism, October 2025. Official source
- European Commission, Corporate Sustainability Reporting Directive transposition status, August 2026. Official source
- EFRAG, Transition Plan for Climate Change Mitigation: ESRS Implementation Guidance. Official source
- European Banking Authority, Final Guidelines on the management of ESG risks, January 2025. Official source
- European Banking Authority, EBA updates Pillar 3 disclosure requirements on ESG risks, June 2026. Official source
- Central Bank of the UAE, Climate-related Financial Risk Management Regulation, October 2025. Official source
- Central Bank of the UAE, Incorporation of climate transition planning into overall business strategy and risk management processes. Official source
- Central Bank of the UAE, Credit Risk Management Standards: climate-related credit risk. Official source
- Singapore Exchange Regulation, Sustainability Report Rules 711A and 711B. Official source
- Singapore Exchange Regulation, Practice Note 7.6: Sustainability Reporting Guide. Official source
- Australian Securities and Investments Commission, What should your sustainability report contain? Official source
- Australian Accounting Standards Board, AASB S2 Climate-related Disclosures. Official source
- California Air Resources Board, Climate Corporate Data Accountability Act and Climate-Related Financial Risk reporting programme. Official source
- United States Securities and Exchange Commission, Proposed rescission of climate-related disclosure rules, May 2026. Official source
- Securities and Exchange Board of India, BRSR Core framework for assurance and ESG disclosures for value chain, July 2023. Official source
- Securities and Exchange Board of India, Measures to facilitate ease of doing business with respect to BRSR, March 2025. Official source
- Network for Greening the Financial System, NGFS long-term climate macro-financial scenarios Phase V. Official source
- International Energy Agency, Scaling Up Transition Finance, October 2025. Official source
- International Energy Agency, Energy Efficiency 2025. Official source
- Greenhouse Gas Protocol, Corporate Standard. Official source
- Greenhouse Gas Protocol, Corporate Value Chain Scope 3 Standard. Official source
- Science Based Targets initiative, Corporate Net-Zero Standard. Official source
- International Organization for Standardization, ISO Net Zero Guidelines. Official source
- OECD, G20/OECD Principles of Corporate Governance 2023. Official source
- Japan Ministry of Economy, Trade and Industry, Transition Finance and Basic Guidelines on Climate Transition Finance. Official source
- European Commission, EU taxonomy for sustainable activities. Official source
