

1. Treat compute runway as a financing system
Compute runway is the period for which a company can fund the infrastructure, model access, data operations, evaluation and technical controls required to deliver its product under a defined demand scenario. The denominator is broader than a cloud bill. It includes application-programming interface charges, accelerator time, central-processing-unit capacity, memory, storage, networking, data preparation, observability, evaluation, security, orchestration, support, power, cooling, facilities and the people required to operate them. It also includes capacity that is reserved but unused.
The board should connect four ledgers. The product ledger describes the use case and service promise. The workload ledger converts demand into measurable tokens, accelerator-hours, jobs, records, images, simulations or transactions. The cost ledger attributes full technical cost to those units. The capital ledger identifies the cash source, commitment, covenant, dilution and timing. Reconciliation between these ledgers is the foundation of a financeable plan.
The first discipline is to separate evidence from ambition. A successful demonstration establishes that a model can perform a task under defined conditions. A reproducible evaluation establishes performance across a controlled test set. A production service establishes reliability under real traffic. Contracted revenue establishes customer commitment subject to the commercial terms. Collected cash establishes realised demand. Each state can justify a different level of compute commitment.
Compute decisions are partly irreversible. Usage-based services can usually be reduced quickly, while reserved or dedicated capacity may involve up-front payment, a fixed hourly commitment, a long term or limited transfer rights. Owned infrastructure adds procurement lead time, power, cooling, networking, redundancy, maintenance and residual-value exposure. The cheapest quoted unit can therefore create the highest cash loss when utilisation, architecture or demand changes.
The board should approve a compute-risk appetite before fundraising. It should define the maximum pre-revenue experiment budget, the evidence required for a long commitment, permitted concentration by provider and region, minimum liquidity reserve, data-location rules, recovery objectives and the management authority for exceptions. These controls allow speed without converting technical enthusiasm into uncontrolled financial exposure.
The runway should also be reconciled to the corporate cash forecast. Infrastructure spend competes with product development, customer acquisition, implementation and governance for the same liquidity. A technical plan can be internally efficient and still be unaffordable at the company level. Finance should therefore show monthly compute cash alongside payroll, revenue collections, financing conditions and the minimum unrestricted-cash threshold. The board can then identify the date by which demand, cost reduction, new capital or a scope decision must occur.
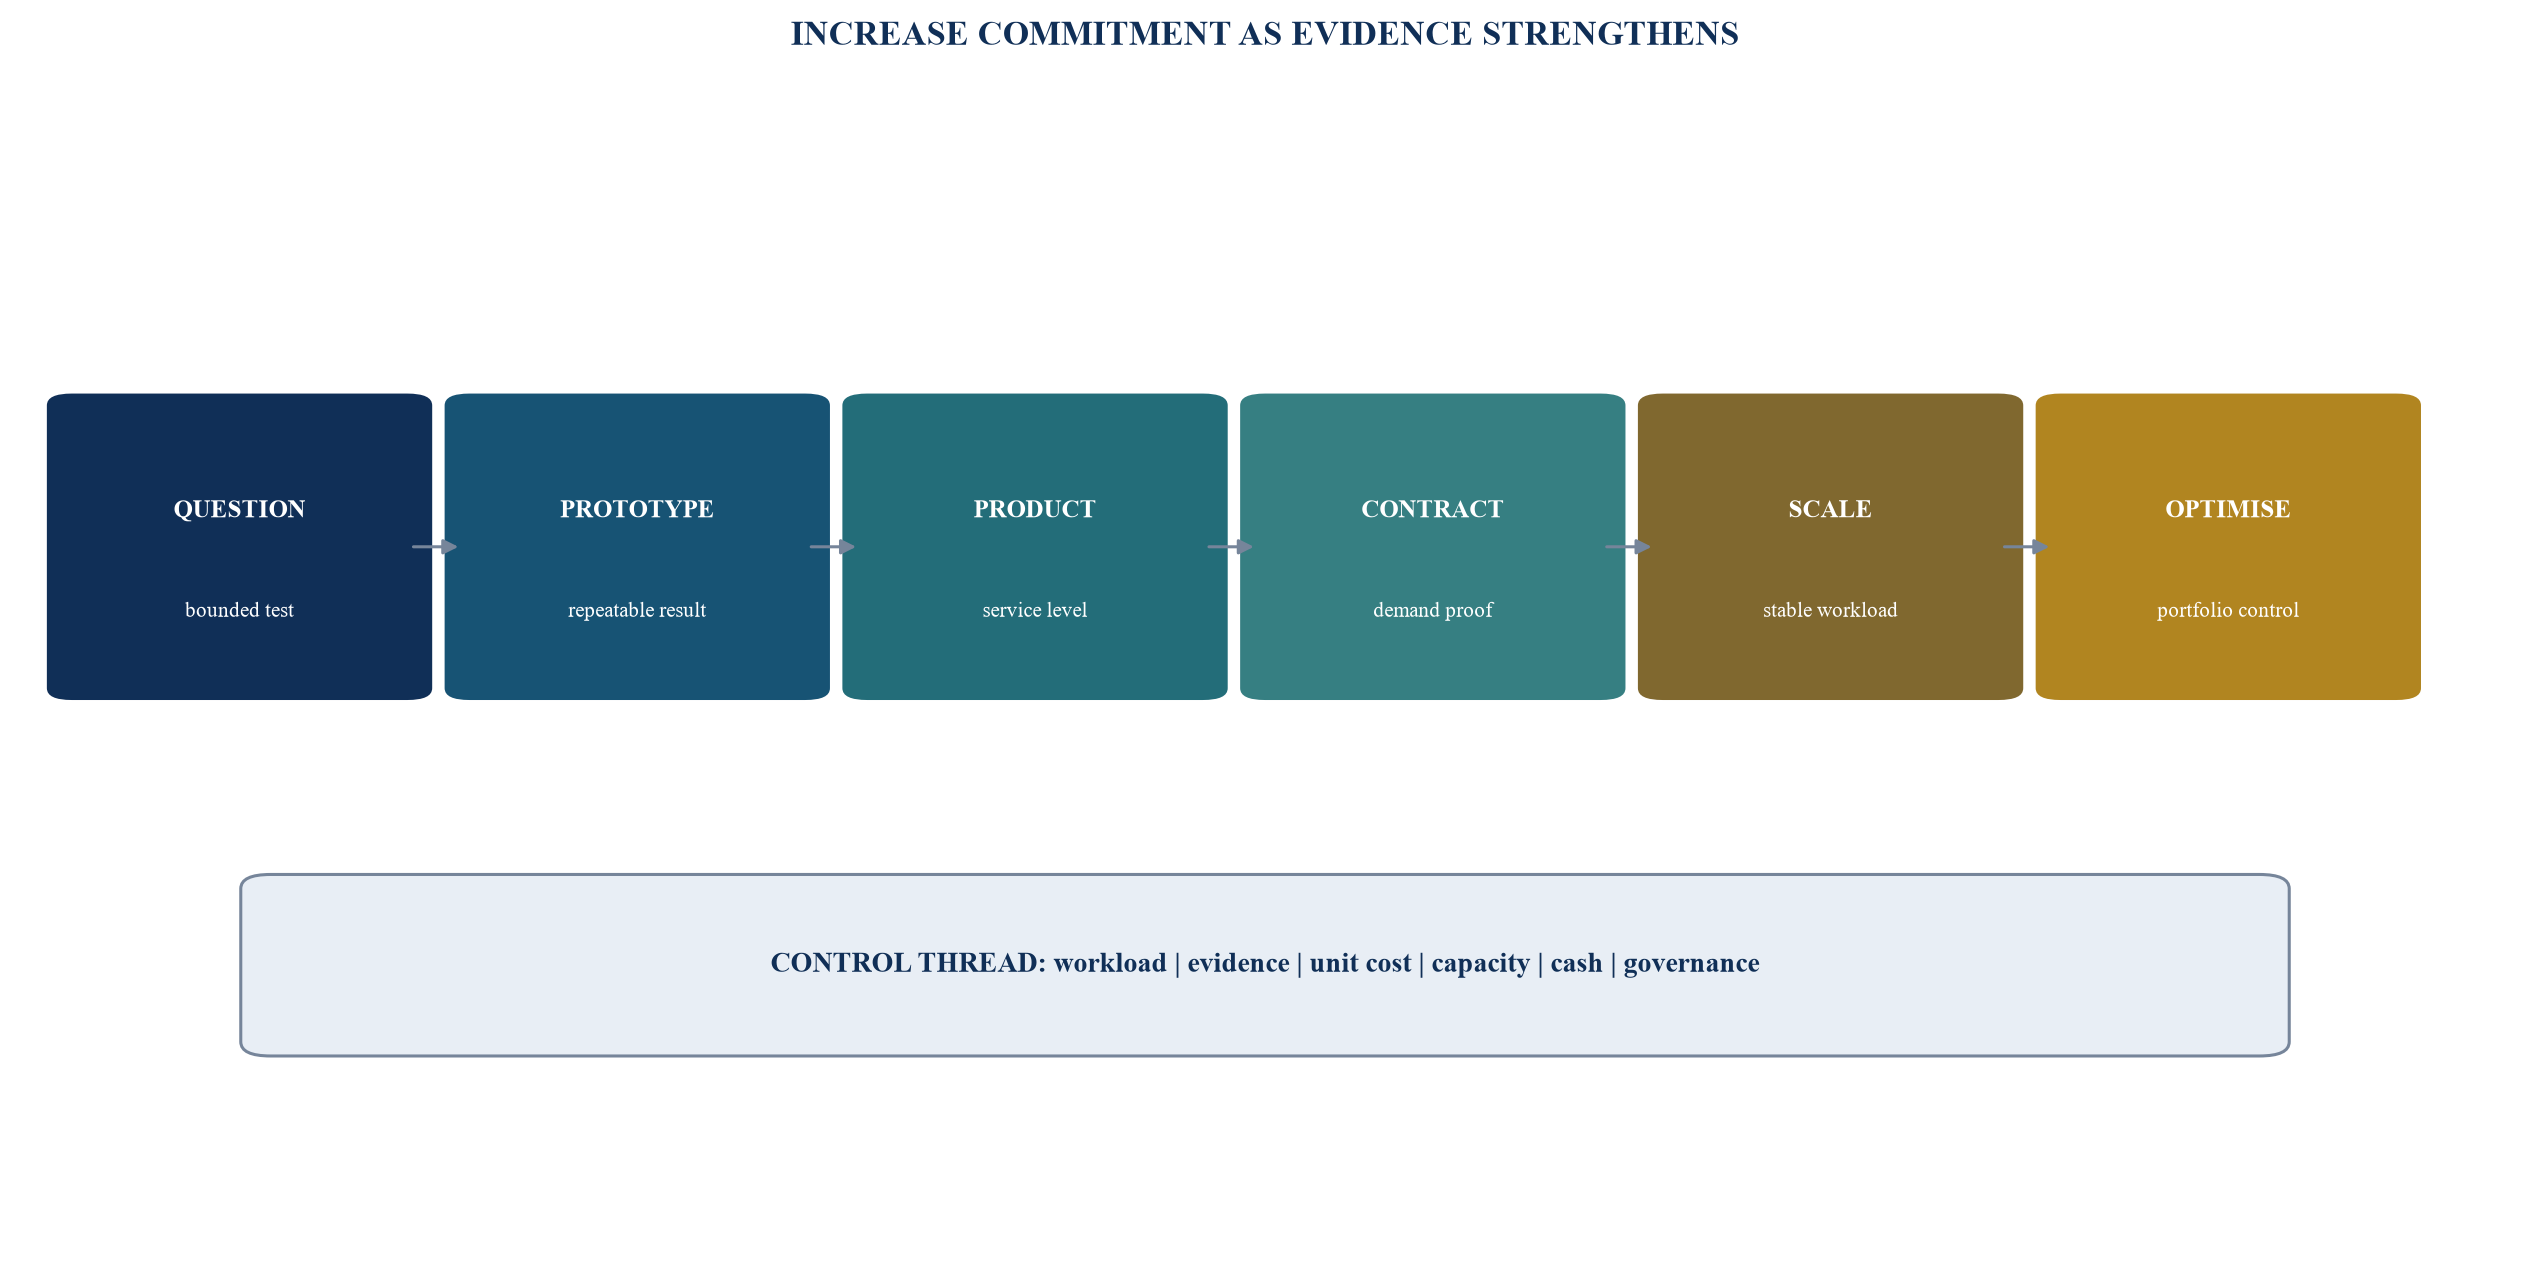
Capacity and capital commitments increase only when workload evidence supports the next controlled state.
2. Convert the product roadmap into a workload ledger
A fundraising model should begin with the product roadmap and customer promise. Management identifies every material AI workload, its owner, purpose, input, output, model, precision, latency, availability, data class, jurisdiction, volume driver and expected life. Training, fine-tuning, synthetic-data generation, evaluation, retrieval, inference and observability should be recorded separately because their cost curves and capacity needs differ.
The workload ledger must use an operational unit. A language application may use input and output tokens per completed task. A computer-vision service may use images or video-minutes per workflow. A scientific platform may use simulations, accelerator-hours or completed experiments. An agentic workflow may need model calls, tool calls, retries and human-review minutes per resolved case. The chosen unit should reconcile to customer value and provider billing.
Demand is represented as a range. The minimum case covers committed or highly visible workload. The base case reflects a board-approved operating plan. The upside case reflects credible sales conversion and usage. The stress case combines lower revenue with a cost shock, such as longer prompts, more retries, a higher-quality model, lower cache efficiency or a data-residency constraint. The model should preserve the individual drivers so management can explain variance.
Evidence quality is attached to every input. Measured production telemetry has higher confidence than a benchmark. A signed contract with a minimum commitment provides stronger demand evidence than an expression of interest. A provider quotation valid for a defined period has greater cost certainty than a public price page. Management should record the source, date, currency, tax treatment, discount, commitment and expiry for every rate.
Table 1. Workload and evidence register
| Workload | Operational unit | Primary evidence | Cost uncertainty | Financing treatment |
|---|---|---|---|---|
| discovery and prototyping | experiment, accelerator-hour or API call | experiment plan, capped budget and termination test | high; architecture and model may change | founder, grant or tightly bounded seed capital |
| training and fine-tuning | training run, token or accelerator-hour | data set, benchmark, run log and reproducibility record | medium to high; failed runs and retraining matter | milestone-based product capital |
| evaluation and safety | test case, red-team scenario or monitored output | evaluation suite, thresholds and release gate | medium; grows with products and jurisdictions | core product budget, never treated as optional overhead |
| production inference | completed customer task or transaction | production telemetry, service level and paid usage | medium; sensitive to model mix, caching and retries | working capital or growth capital after demand proof |
| retrieval, storage and data | indexed record, gigabyte-month or transfer unit | data architecture, retention policy and access logs | medium; network and retention surprises are common | product budget with data-governance reserve |
| dedicated capacity | reserved accelerator-hour or cluster-month | signed demand, utilisation history and provider term sheet | high downside if demand or architecture moves | commitment only after board threshold and liquidity test |
Each workload should have a measurable unit, current evidence and a financing consequence.
3. Build the full-stack compute cost bridge
Provider rates are inputs to the model rather than the model itself. The finance team should bridge quoted consumption to delivered product cost. Direct model or accelerator usage is followed by storage, retrieval, data transfer, networking, orchestration, monitoring, security, backup and support. The company then adds failed jobs, retries, idle time, reserved-capacity leakage, non-production environments and the engineering required to keep the service reliable.
The bridge should distinguish variable, step-fixed and fixed cost. Usage-based model calls can be substantially variable. A dedicated inference endpoint may be step-fixed because cost rises when another instance is added. A committed cluster, colocation cage or owned system can be fixed during the contract period. The difference determines operating leverage and downside exposure.
Cached input, batching, quantisation, smaller models, routing and asynchronous processing can reduce unit cost where performance remains acceptable. Their benefit must be measured at the completed-workflow level. A cheaper model that produces more retries, escalations or customer losses can reduce technical cost while damaging contribution margin. Quality, latency and human review belong in the same bridge.
Currency and tax also matter. A company earning dirhams, sterling, rupees or Singapore dollars may buy services priced in United States dollars. The runway model should show the billing currency, exchange-rate assumption, indirect tax, withholding exposure where applicable and payment timing. The board can then decide whether to hold a currency reserve or negotiate customer pricing that shares the exposure.
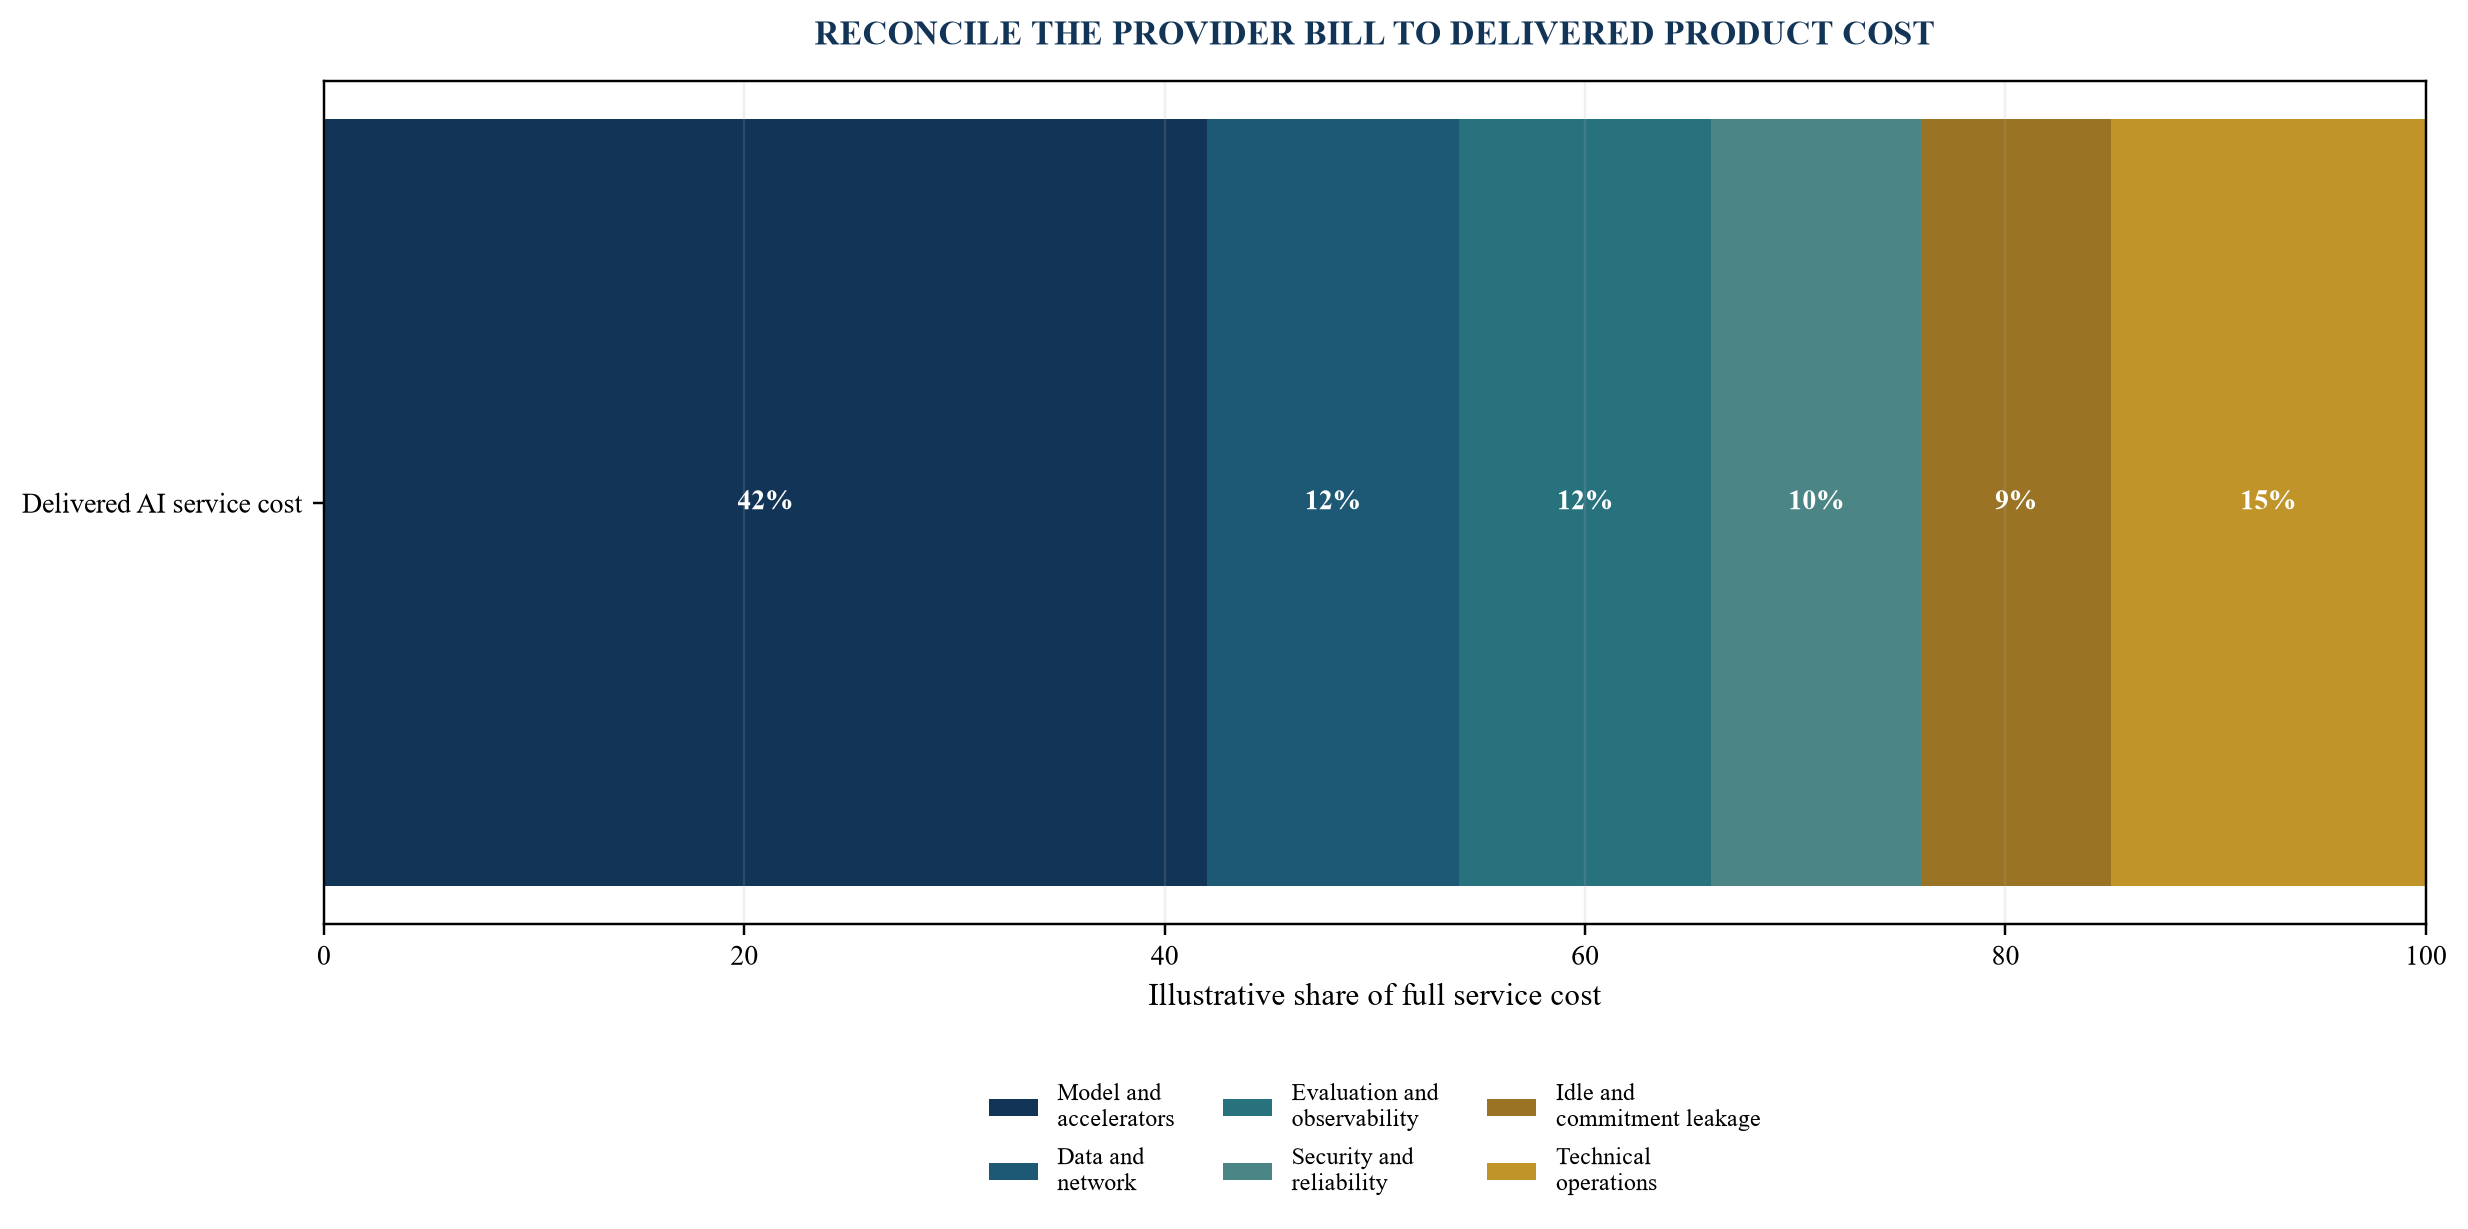
Illustrative shares show the categories to reconcile; they are management assumptions rather than market benchmarks.
Table 2. Full compute cost register
| Cost category | Common driver | Evidence source | Control question |
|---|---|---|---|
| model and accelerator consumption | tokens, accelerator-hours, model tier and batch mode | provider export, run telemetry and contract | can routing, caching or scheduling reduce cost without weakening outcome? |
| data and network | stored volume, retrieval, transfer, region and retention | cloud billing, architecture diagram and data policy | which transfers and retained copies are necessary? |
| evaluation and observability | test volume, logs, traces, model monitoring and red teaming | evaluation ledger and monitoring platform | does every release meet an approved evidence threshold? |
| reliability and security | redundancy, backup, recovery, encryption and support | service architecture and customer requirements | is the service level priced into the customer contract? |
| idle and commitment leakage | reserved units less productive use | reservation inventory and workload schedule | can capacity be pooled, rescheduled, exchanged or avoided? |
| technical operations | platform engineering, incident response and vendor management | payroll allocation and time records | is automation removing repeatable operational work? |
Management should reconcile each category to an owner, billing source, allocation rule and control.
4. Separate experimentation, training, evaluation and inference
Experimentation is an option-creation activity. Its budget should be capped by the next decision it can inform. A team can define the hypothesis, required benchmark, maximum runs, expected information gain and stop condition before it starts. This prevents open-ended exploration from consuming growth capital without producing a product or financing milestone.
Training and fine-tuning are project workloads. Their cost depends on model size, data volume, accelerator type, run duration, utilisation, failed runs and the number of iterations. The budget should include a reproducibility run and a reserve for one defined failure mode. When a foundation-model provider or open model can satisfy the product requirement, management should compare the full cost and strategic value of adaptation with proprietary training.
Evaluation is a continuing production requirement. It includes task performance, hallucination and error analysis, bias and robustness checks, security testing, regression testing, red teaming and monitoring. The EU AI Act includes obligations that can depend on system role and risk, and its treatment of general-purpose AI models uses training compute among the indicators for systemic risk. The exact legal position requires qualified advice, yet the budget implication is immediate: evaluation records, monitoring and governance consume compute and people.
Inference is the recurring delivery workload. Its unit cost depends on input and output size, concurrency, latency, throughput, model choice, batching, caching, retrieval and retry behaviour. Revenue should be modelled against completed customer outcomes rather than raw calls. A product that charges per user but incurs highly variable per-task compute can produce weak economics as engagement rises.
5. Make unit economics investor-ready
FinOps defines unit economics as the relationship between technology cost and a business-value unit. For an AI company, the unit should be traceable from customer invoice to technical consumption. The contribution bridge begins with collected or contractually earned revenue, deducts compute, data, human review, customer support, third-party licences and other variable delivery costs, and shows contribution before fixed operating expense.
Management should provide cohort and use-case views. An enterprise customer with strict data residency and low volume can have a different cost curve from a digital customer using asynchronous batch processing. One blended margin can conceal an unprofitable product or jurisdiction. The investor data room should allow a reviewer to reproduce the unit bridge from raw usage and billing records.
Cost improvement claims require operational proof. A routing change can be measured through a controlled experiment. A cache strategy can be measured through hit rate and retained quality. A smaller model can be measured through task accuracy, latency, escalation and churn. The board should recognise savings only after the change is stable in production and the customer outcome remains within tolerance.
Pricing should reflect workload risk. Contracts can include usage bands, fair-use limits, pass-through for exceptional volumes, premium service levels, data-residency charges and re-opener clauses for provider price changes. Commercial design can therefore share uncertainty rather than leaving all compute volatility on the company.
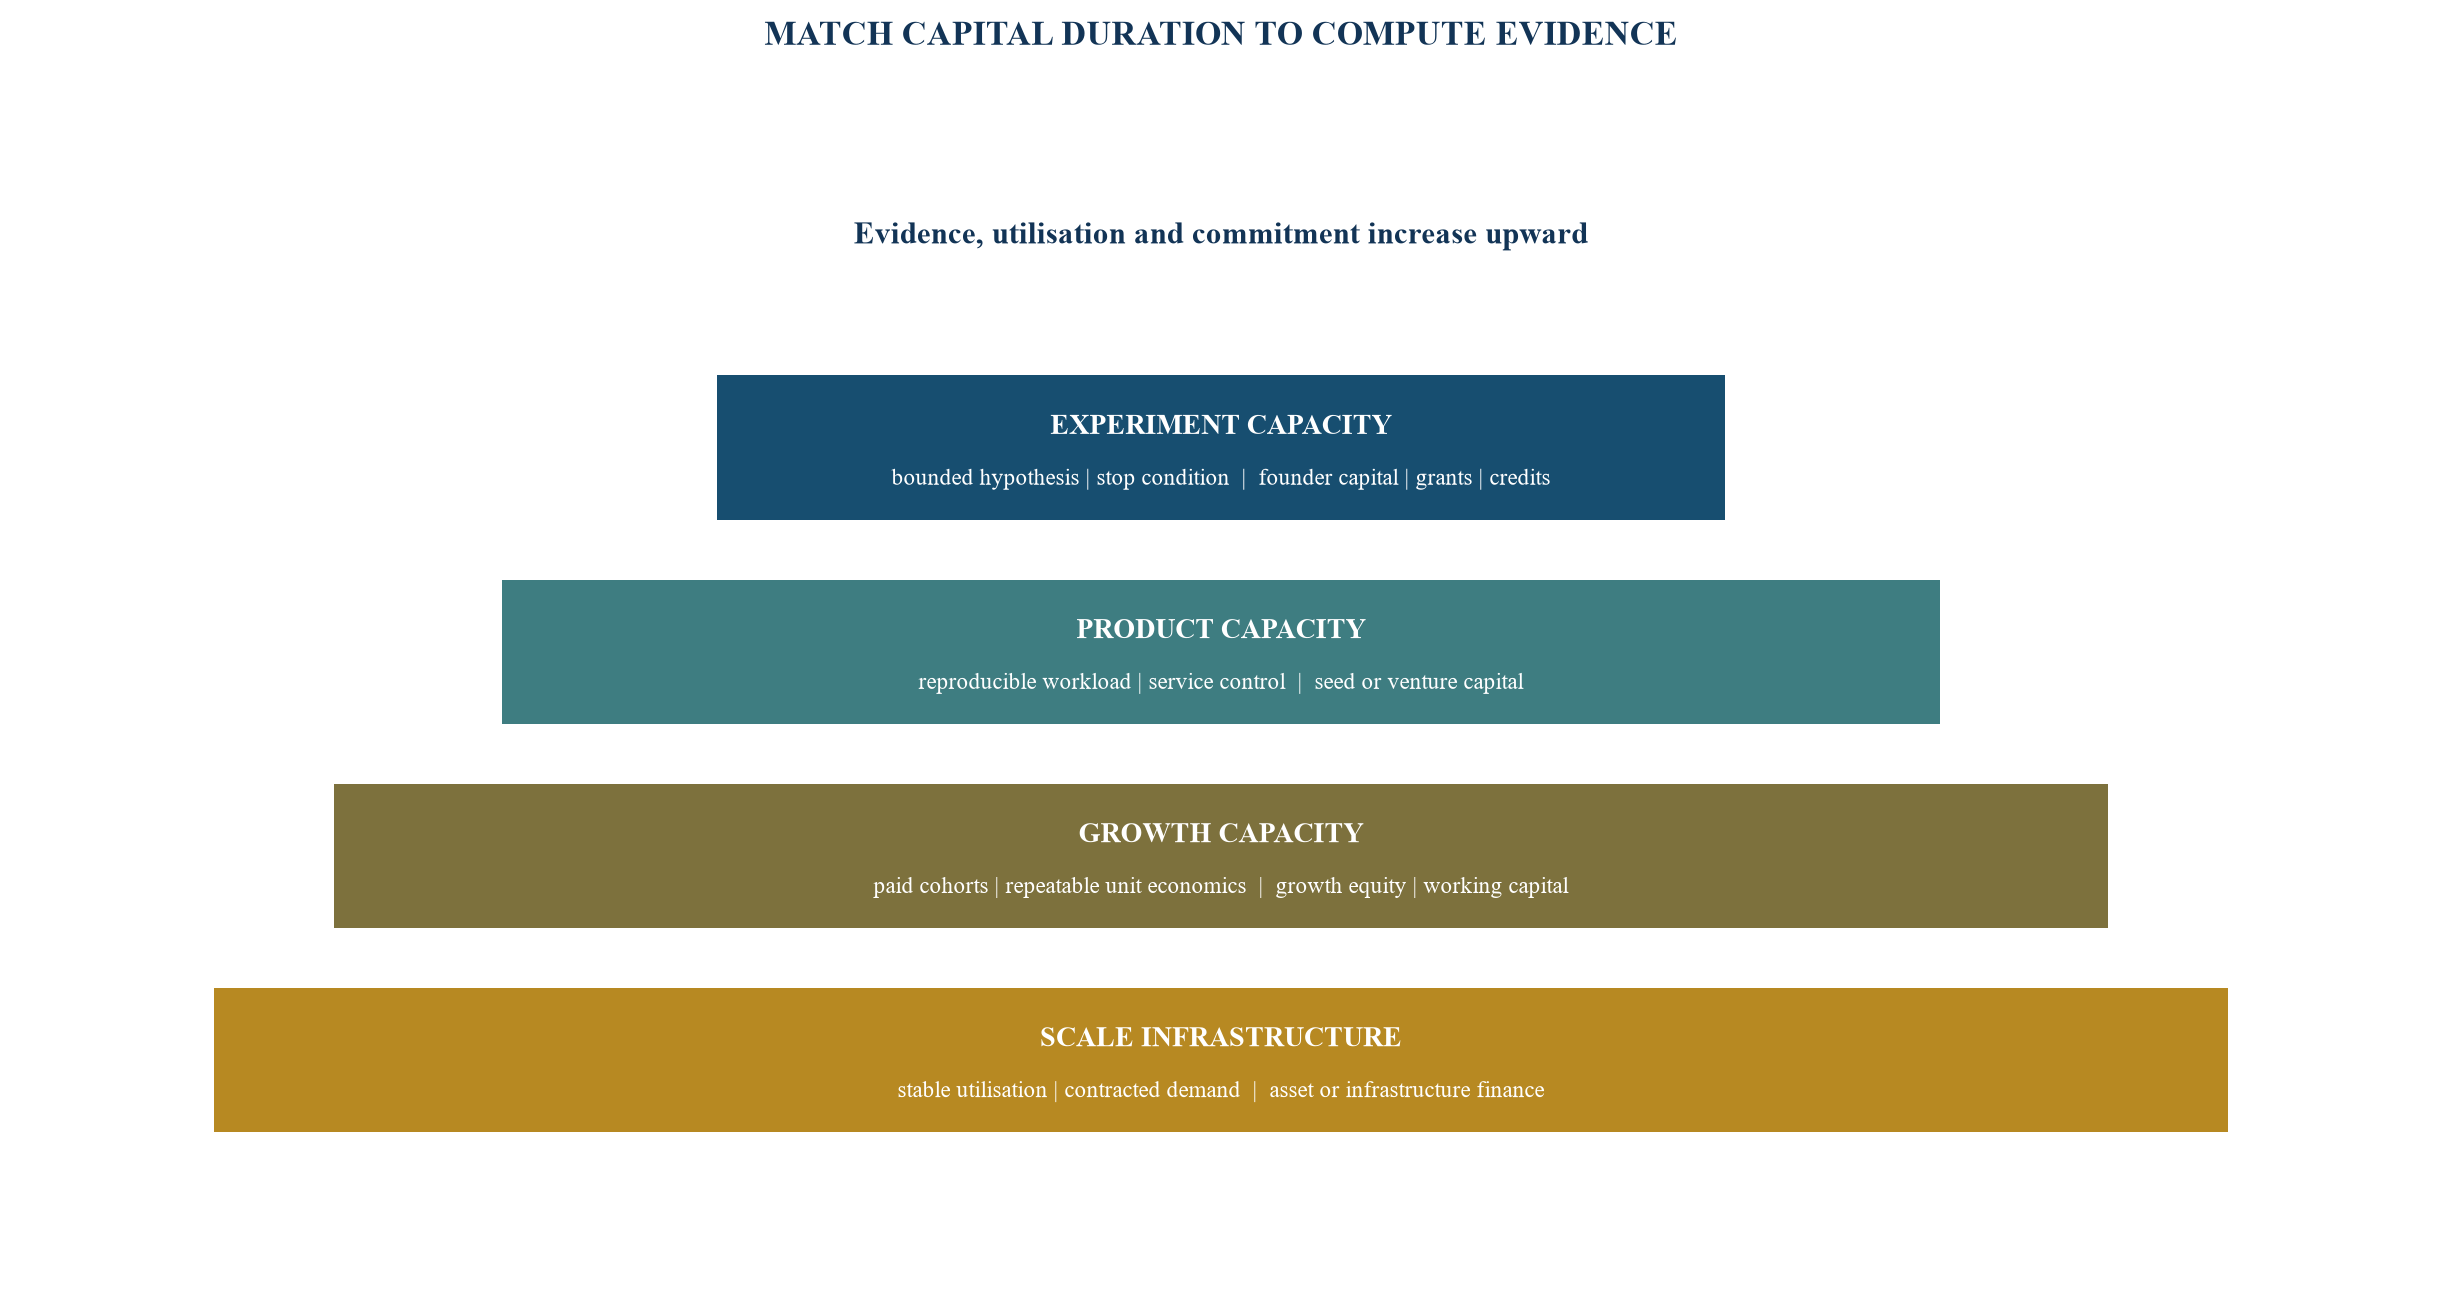
Each financing source is matched to the evidence and reversibility of the workload it supports.
6. Choose among API, cloud, commitment, dedicated and owned capacity
The architecture decision is a portfolio decision. Usage-based application-programming interfaces provide speed and low initial commitment. They can reduce engineering burden and make cost variable, while introducing provider dependency, price exposure and constraints on data, model control or customisation. On-demand cloud accelerators offer more control and can be started or stopped, although availability and on-demand rates may constrain large workloads.
Spot or pre-emptible capacity can support interruption-tolerant training, batch inference and experimentation when orchestration can resume jobs safely. Reserved capacity or committed spend can lower effective cost or improve access in exchange for term and utilisation risk. Dedicated clusters can support predictable high-volume workloads and stronger isolation. Owned infrastructure can provide control and attractive economics at sustained utilisation, while adding power, cooling, networking, staffing, maintenance and technology-obsolescence risk.
Official provider terms illustrate the trade-off. AWS Capacity Blocks allow eligible accelerated instances to be reserved for a defined future period and charge the block up front at the price shown when booked. Google Cloud offers committed-use discounts for defined resources and terms, with region and machine constraints. Azure savings plans commit a fixed hourly spend for one or three years, and unused hourly commitment does not carry forward; Azure reservations offer deeper discounts for stable, specific workloads. Contract terms and product availability can change, so the company should refresh quotations and legal terms before a decision.
The company should score options on cost, cash timing, capacity certainty, data control, performance, engineering burden, portability, termination rights and residual exposure. It should also test a hybrid portfolio: usage-based services for variable or frontier workloads, committed capacity for a stable base load and interruptible capacity for flexible jobs.
Table 3. Architecture and contracting decision matrix
| Option | Best-supported evidence state | Financial advantage | Principal exposure | Board gate |
|---|---|---|---|---|
| usage-based model API | discovery through early product | no infrastructure build and highly variable cost | price, provider, model and data dependency | data terms, quality, unit cost and exit path accepted |
| on-demand cloud accelerator | prototype through variable production | flexibility and direct architecture control | availability and high marginal rate | workload telemetry and budget cap in place |
| spot or interruptible capacity | flexible training, testing and batch work | lower quoted rate where interruption is manageable | termination, queue and orchestration risk | checkpointing, recovery and deadline tolerance tested |
| reservation or committed spend | stable, forecastable base load | discount or capacity assurance | unused commitment and architecture lock-in | minimum utilisation, downside liquidity and transfer rights approved |
| dedicated managed cluster | repeatable high-throughput service | isolation, predictable capacity and operational support | fixed term, concentration and scaling steps | contracted demand and service economics verified |
| owned or colocated infrastructure | sustained strategic workload | control and potential long-run unit cost | power, cooling, staffing, obsolescence and residual value | full TCO, financing, recovery and refresh plan approved |
Provider-specific pricing and availability should be refreshed at the decision date.
7. Price commitment and capacity risk
A commitment should be valued as a contract with an embedded utilisation option and a downside liability. Management estimates the minimum productive workload, expected workload and stress workload during the term. It applies the actual discount, payment schedule, cancellation or exchange rights, region limits and technical constraints. It then compares committed cost with an equivalent flexible portfolio.
The break-even calculation should include time value and operational cost. A reservation that saves thirty per cent at full utilisation can lose money if only half of the capacity is productive. Productive utilisation excludes debugging, queueing, failed runs and capacity held for a product that was delayed. The model should show the cash paid and the cost attributed to completed customer units.
Capacity certainty also has value. A company with a contractual launch date can incur revenue loss and reputational damage if accelerators are unavailable. That value should be estimated from the contract and recovery alternatives rather than assumed. The board can approve a capacity premium where the avoided downside is documented.
Concentration risk belongs in the financing model. Provider outage, service withdrawal, pricing changes, regional restrictions, sanctions, export controls or a model-policy change can affect revenue. The company should identify the cost and time required to move the workload. Portability investment can operate as insurance when dependence is material.
8. Build a twelve-month compute cash-runway model
The runway model is monthly and cash-based. It opens with unrestricted cash, adds expected collections and financing proceeds, and deducts compute cash payments, data and technical operations, other operating expenditure, debt service and required reserves. Non-cancellable commitments are shown separately from forecast variable spend. Deposits and prepayments are recorded when cash leaves rather than when accounting expense is recognised.
The illustrative base case in Figure 4 assumes a twelve-month compute envelope of AED 4.80 million: AED 0.55 million for model access, AED 1.10 million for experimentation and training, AED 1.55 million for production inference, AED 0.45 million for data and networking, AED 0.55 million for evaluation, observability and security, and AED 0.60 million for a contingency reserve. These are management assumptions created solely to demonstrate the method.
The illustrative downside is AED 6.90 million. It assumes faster workload growth, additional retraining, a higher-quality model tier, lower batching efficiency, a residency requirement and commitment leakage. Management should replace every amount and driver with provider quotations, telemetry and the approved operating plan. A board should see the downside before signing a capacity contract or deciding the fundraising amount.
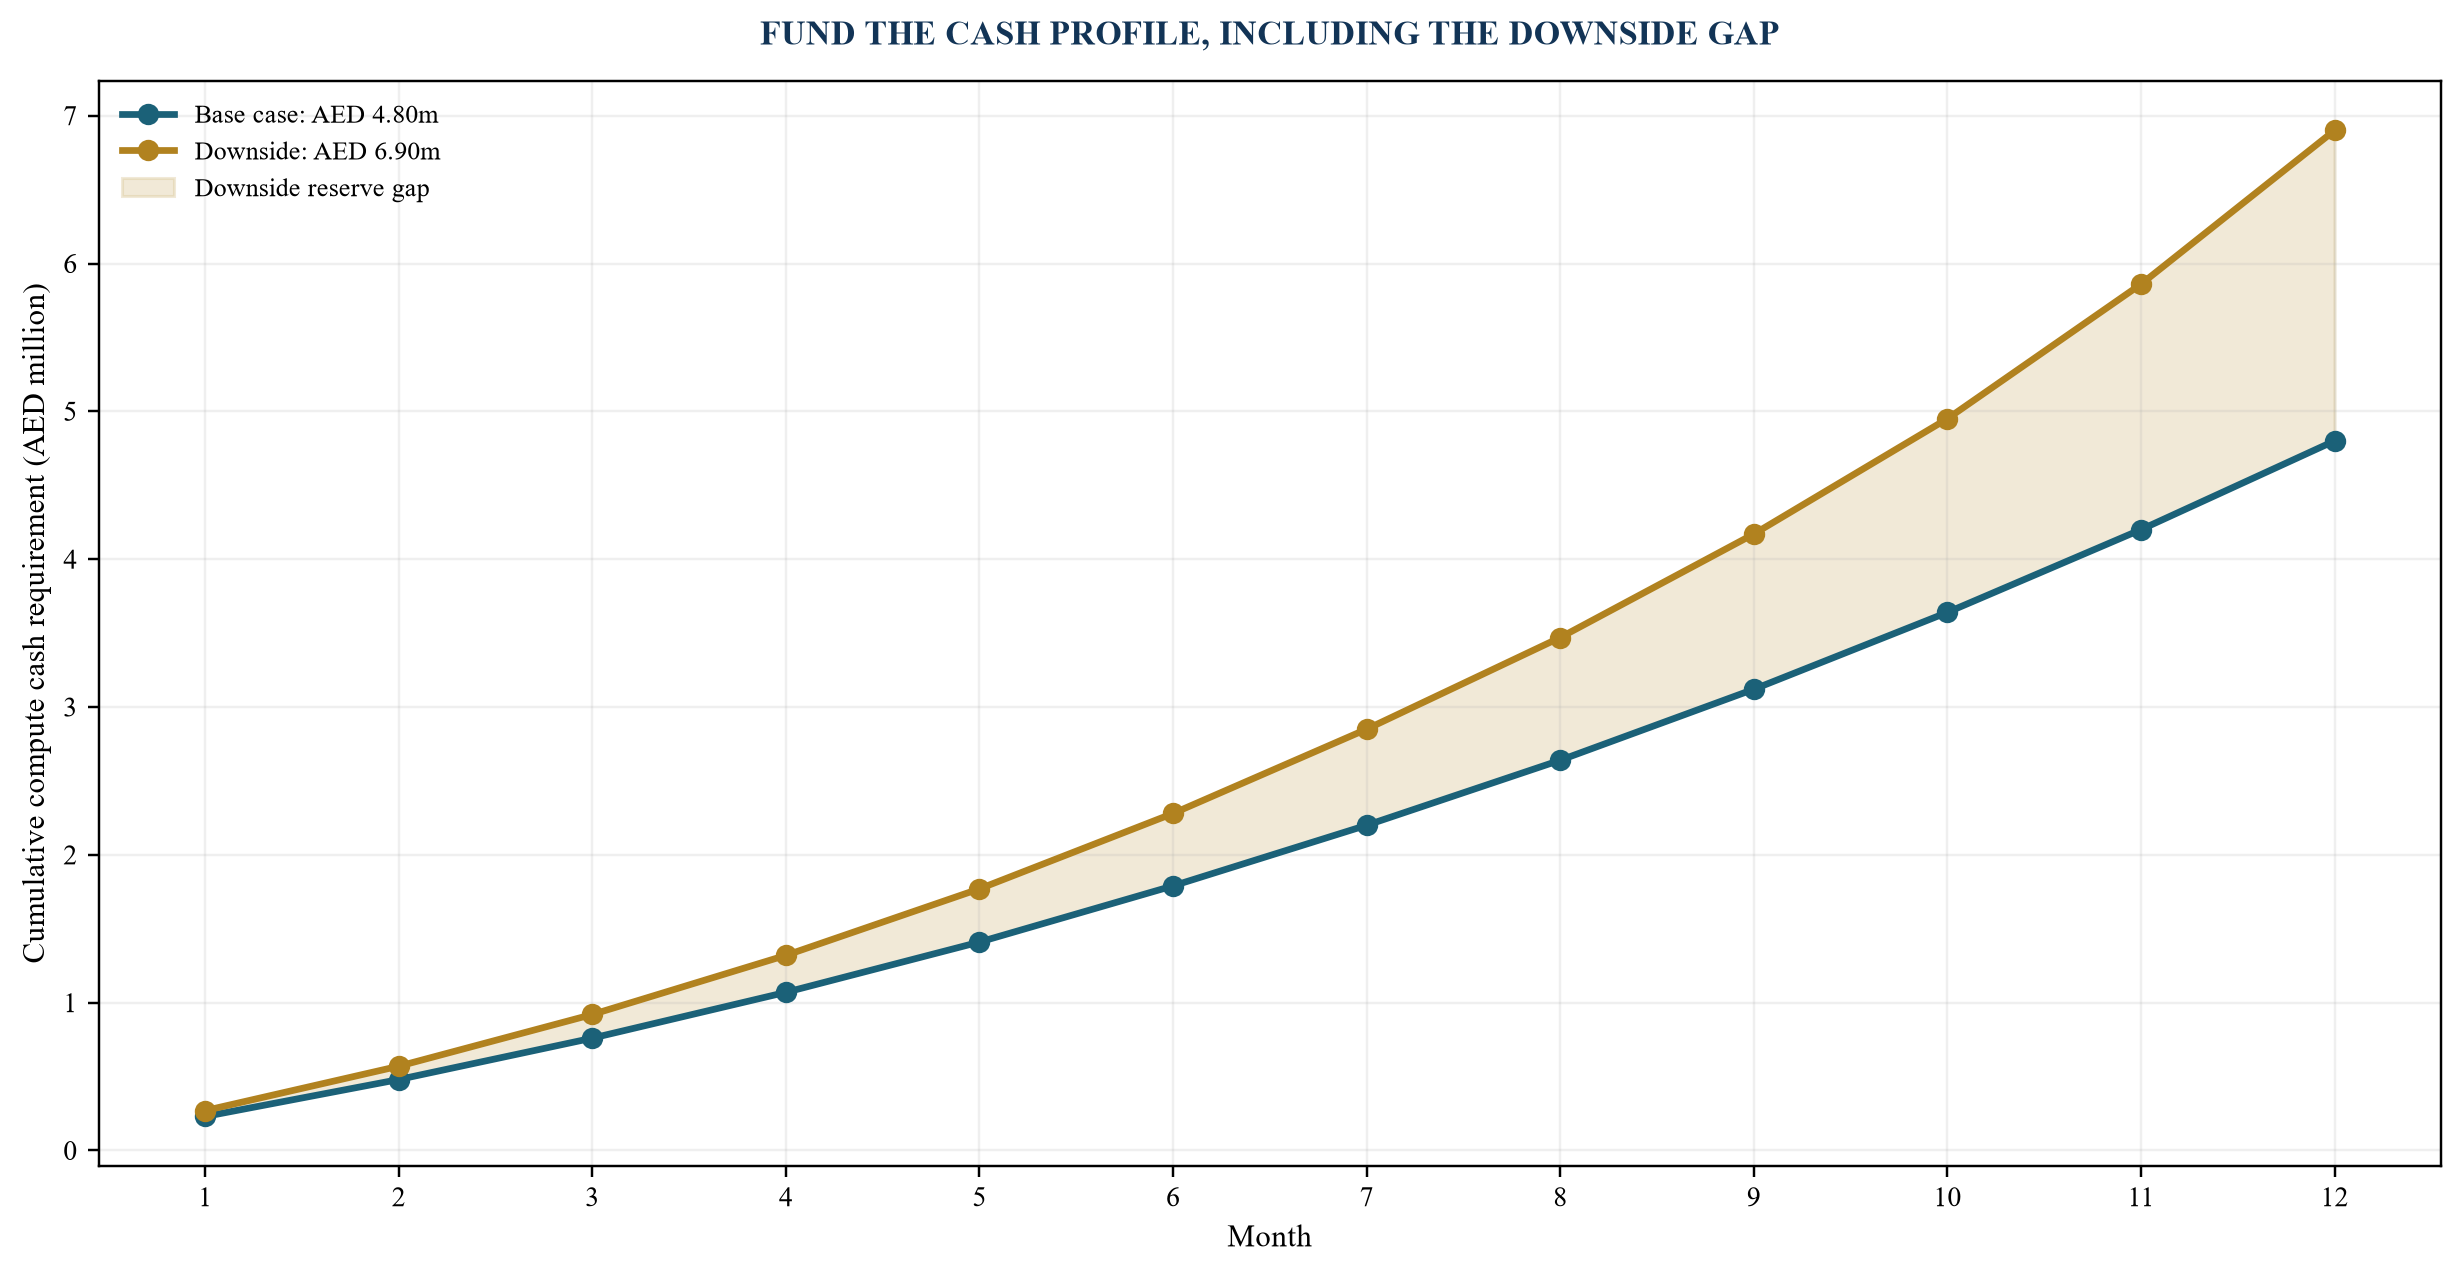
AED values are illustrative management assumptions and do not describe a specific company or market benchmark.
Table 4. Illustrative compute-runway scenario register
| Scenario | Twelve-month compute cash | Operating assumptions | Capital response |
|---|---|---|---|
| minimum | AED 3.35m | bounded product scope, slower customer activation, usage-based capacity | preserve flexibility; fund only verified product milestones |
| base | AED 4.80m | planned launches, measured model mix and controlled reserve | raise base requirement plus board liquidity buffer |
| upside | AED 5.85m | higher paid demand and earlier expansion | use customer collections and pre-agreed capacity steps |
| downside | AED 6.90m | retraining, higher model tier, residency and commitment leakage | protect liquidity; defer fixed capacity and activate contingency actions |
| severe | AED 8.10m | revenue delay combined with capacity and currency shock | stop non-core workloads, renegotiate commitments and rebase product scope |
All values and sensitivities are illustrative management assumptions for framework demonstration.
The scenario model should preserve cause and action. A single percentage contingency can hide the difference between a productive increase in paid usage and an uncontrolled increase in cost per task. For every downside driver, management should record an early indicator, an accountable owner, a decision date and an action. Higher paid volume can trigger a planned capacity step. Lower cache efficiency can trigger engineering work. A delayed customer launch can trigger the release of temporary capacity. A residency requirement can trigger a pricing and contract review before deployment.
Revenue and compute should be linked through cohorts. Each customer cohort has a start date, usage ramp, service architecture, billing term, collection pattern and churn assumption. The model converts the cohort into completed units and technical consumption, then into compute cash. This approach allows the board to see whether an upside sales forecast generates cash quickly enough to fund its own infrastructure. A customer can be economically attractive and still create a temporary financing gap when capacity is paid before the invoice is collected.
The model should also separate controllable and externally driven variance. Model routing, batch scheduling, cache policy, inactive environments and experiment limits are largely management controls. Provider rates, foreign exchange, regional capacity and regulatory requirements may be less controllable. The contingency plan can assign operational action to the first group and liquidity, contracting or portfolio action to the second. A combined stress should assume that two important drivers move adversely at the same time.
Cash thresholds should be explicit. Management can define a warning threshold that requires weekly review, an action threshold that freezes non-core experiments and a board threshold that requires a revised financing or product plan. The thresholds should take account of payroll, taxes, customer obligations and other corporate expenditure. The company should avoid presenting the whole cash balance as available for compute when legal, contractual or operating commitments restrict its use.
Forecast accuracy is itself evidence. Each month, finance compares forecast with actual compute cash and decomposes the difference into demand, price, mix, efficiency, timing and error. A forecast that repeatedly misses because workloads are not measured should not support a long capacity commitment. A forecast with stable drivers and explained variance can justify a more efficient contract. The record also helps investors distinguish learning from weak control.
The capital plan should include a financing lead time. Equity diligence, grant approvals, customer procurement, equipment finance and working-capital facilities can take longer than a technical scale event. The company should identify the cash decision date at which a financing process must begin, allowing for approval, documentation and funding. A runway reported only as a number of months can be misleading if the company crosses the financing decision date much earlier.
Management should report both gross and net compute runway. Gross runway assumes no new support and shows the underlying economic requirement. Net runway deducts verified, usable credits, subsidies, grants or customer prepayments according to their actual conditions. This presentation prevents temporary support from being mistaken for a durable margin advantage and shows the future capital step when support ends.
9. Design the funding roadmap around evidence
The funding roadmap should state which compute milestone each capital tranche buys. Discovery capital buys an answer to a bounded technical and customer question. Product capital buys a reproducible service with measured unit cost and governance. Commercial capital buys implementation for signed or highly credible demand. Growth capital buys capacity for repeatable economics. Infrastructure finance supports long-lived assets or contracted capacity when the cash flows and security support it.
Equity is appropriate for uncertain, value-creating development with no contractual repayment profile. Grants, cloud credits and public compute can extend the experiment runway where eligibility and availability are verified. Customer prepayments, implementation fees and minimum commitments can finance delivery and align demand. Working-capital facilities may support contracted receivables when documentation and lender eligibility are satisfied. Equipment or infrastructure finance may support owned assets with predictable use and residual-value analysis.
The raise amount should reconcile to the operating plan, downside reserve and next value milestone. Raising only the base compute bill ignores payroll, go-to-market, governance and the possibility that technical work takes longer. Raising a very large infrastructure budget before demand proof can create dilution and pressure to use stranded capacity. The board should choose the amount that finances a credible evidence transition with room for a defined downside.
Investor materials should disclose commitment and concentration. A provider credit can lower current cash use but expire before scale. A subsidised programme can be subject to approval or queue. A committed cluster can appear as a low unit rate while creating a large contractual liability. Transparent disclosure supports a more credible capital conversation.
10. Use grants, credits and public compute as controlled instruments
Public and provider support can lower the cash cost of experimentation and early product work. The board should treat it as an instrument with eligibility, scope, expiry, reporting and transition conditions. The runway model should show both gross cost and cash cost after support, then show the step-up when support ends.
The United Kingdom's AI Research Resource combines Isambard-AI and Dawn and provides specialised compute to researchers, academia and industry. Official Rapid Access materials identify UK-registered micro, small and medium-sized organisations as eligible applicants, subject to the call and allocation process. The UK Compute Roadmap states an ambition to expand public AI compute capacity substantially by 2030. A company should verify the current call, eligible workload, intellectual-property terms, data requirements, allocation and timetable before relying on access.
India's IndiaAI Compute initiative aggregates accelerator capacity and provides a published calculator showing providers, configurations, rates and potential subsidy. Official 2025 and 2026 communications report tens of thousands of GPUs onboarded and government support that can reduce eligible access cost. The actual allocation, maximum subsidy, queue, workload approval and provider terms require direct confirmation.
Singapore's updated National AI Strategy describes an Enterprise Compute Initiative with cloud compute, tools, training and engineering support. UAE and Saudi initiatives demonstrate significant sovereign investment in AI infrastructure. Abu Dhabi has announced sovereign-cloud development through Microsoft and Core42 within its digital strategy. Saudi Arabia's Public Investment Fund launched HUMAIN to build data centres, AI infrastructure, cloud capabilities, models and solutions. These announcements indicate ecosystem direction. They do not establish that a particular startup has subsidised or immediate capacity, so company-specific access should remain outside the committed runway until documented.
11. Build a geography and market-entry map
Compute geography affects latency, data location, customer confidence, provider availability, currency, regulation, energy and talent. A company serving regulated customers can require regional deployment, sovereign cloud, encryption controls or restricted administrative access. The product architecture and financing plan should therefore be designed together with market entry.
The map should distinguish customer location, user location, data origin, data storage, model endpoint, processing region, backup region, support access and legal entity. A single label such as Europe or GCC can conceal cross-border data movement and billing. The board should approve the intended flow and obtain legal and security advice for regulated or sensitive data.
Market-entry sequencing can preserve flexibility. The company can validate product demand using compliant managed services, establish telemetry and unit economics, and add dedicated regional capacity after signed demand supports the step. A jurisdiction with public compute or grants can be attractive for research, while production may need to be close to customers or within their approved cloud boundary.
Table 5. Geographic compute and market-entry map
| Geography | Verified official signal | Planning opportunity | Required company validation |
|---|---|---|---|
| UAE | Abu Dhabi sovereign-cloud programme and federal investment in digital infrastructure | regulated-sector, Arabic-language and sovereign deployment propositions | customer cloud boundary, data law, provider availability, price and procurement access |
| Saudi Arabia | PIF launched HUMAIN for data centres, infrastructure, cloud, models and solutions | local AI infrastructure and enterprise transformation partnerships | capacity access, localisation, procurement, licensing and data requirements |
| United Kingdom | AIRR public compute and Compute Roadmap | research, evaluation and SME access through eligible calls | current call, allocation, IP, security, data and production-transition plan |
| India | IndiaAI Compute capacity marketplace and subsidy framework | lower-cost experimentation and domestic product scaling | provider configuration, subsidy approval, queue, data location and support |
| Singapore | Enterprise Compute Initiative under the National AI Strategy | enterprise adoption and engineering support | programme eligibility, support scope, cloud terms and regional architecture |
| European Union | AI Act obligations and sustainability considerations | compliance-led product design and trusted AI controls | system classification, provider duties, logging, evaluation and country-specific data law |
Programme access and regulatory treatment require current, company-specific verification.
12. Budget data sovereignty, security and regulatory evidence
Security and compliance are workload drivers. Encryption, key management, private networking, access logging, data-loss prevention, backup, regional redundancy, model evaluation and audit retention all consume services and engineering time. A budget that adds these controls after a customer diligence process can understate delivery cost and delay revenue.
The data architecture should classify information before selecting a provider or region. Management identifies personal data, confidential customer data, regulated records, intellectual property, training data and model outputs. It records where each class can be stored and processed, who can access it and how long it is retained. The contract should allocate responsibility across the company, cloud provider, model provider and customer.
Regulatory requirements vary by system, role and jurisdiction. The EU AI Act can impose obligations on providers and deployers, and includes a framework for general-purpose AI models. NIST's AI Risk Management Framework provides Govern, Map, Measure and Manage functions that can structure internal control. These sources do not replace legal advice. They support an evidence budget containing evaluation, documentation, monitoring, incident response and review.
The company should price trust into the product. A regulated customer may pay for sovereign deployment, dedicated capacity, enhanced evaluation and audit evidence. If those costs are absorbed without a corresponding price or strategic rationale, the contract can dilute gross margin. The commercial proposal should define the approved architecture and charge for customer-specific controls.
13. Model power, cooling and operating risk before ownership
Owned infrastructure turns a digital workload into a physical system. Accelerators require power, cooling, networking, rack space, resilience, maintenance, spares and qualified operators. NVIDIA's DGX H100 data sheet describes a system containing eight H100 GPUs and a maximum system power in the order of ten kilowatts. A cluster multiplies this requirement and adds supporting equipment. The company should obtain site-specific engineering and utility advice rather than extrapolate a public specification directly into a facility design.
The International Energy Agency reports that global data-centre electricity demand is rising rapidly and projects generation serving data centres to exceed 1,000 terawatt-hours by 2030 in its base case. Renewables are expected to meet a significant share of growth, although grid availability, connection lead times and local power prices remain critical. An owned-compute decision should therefore include power certainty, connection capacity, cooling water or heat rejection, carbon requirements and the possibility of curtailment.
Obsolescence can be faster than accounting depreciation. New accelerator generations, interconnects, model architectures and software can change performance per unit of capital. The residual-value assumption should be stress tested. A finance lease or equipment loan can remain payable after the hardware has lost strategic relevance.
The board should require a make-or-buy case with three independent estimates: provider or asset cost, facility and operating cost, and workload performance. It should include installation, commissioning, downtime, spare capacity, insurance, import, tax, disposal and recovery. Ownership becomes credible when stable utilisation, strategic control and economics support the commitment.
Operational resilience has a financing consequence. If the product promises continuous availability, the company may need redundant regions, spare capacity, recovery tooling and tested procedures. Those resources can appear idle during normal operation while protecting contracted revenue during disruption. Management should define the service promise, quantify the credible loss from interruption and fund only the resilience that supports that promise. A premium architecture without a corresponding customer requirement can weaken capital efficiency; an underfunded architecture can place revenue and trust at risk.
14. Compare fundraising timing and dilution
Compute evidence can affect fundraising quality because it makes the use of funds, milestone and margin bridge more credible. It does not guarantee a valuation. Investors consider team, market, product, traction, competition, governance, legal structure and financing conditions alongside infrastructure planning.
Figure 5 demonstrates the arithmetic using illustrative assumptions. An AED 8 million primary raise at an AED 32 million pre-money valuation implies twenty per cent new-investor ownership before other adjustments. The same raise at an AED 48 million pre-money valuation implies about 14.3 per cent. The difference is arithmetic rather than a forecast that compute work produces the higher valuation. Option-pool changes, convertibles, warrants, preferences, fees and secondary transactions can change the result.
The board can compare two paths. An earlier raise may provide the runway to validate the product but create more dilution at the assumed valuation. A staged path can use grants, credits and bounded equity to establish workload evidence before a larger raise, while introducing execution and financing risk if milestones are delayed. The decision should be made from cash need, downside protection and financing availability.
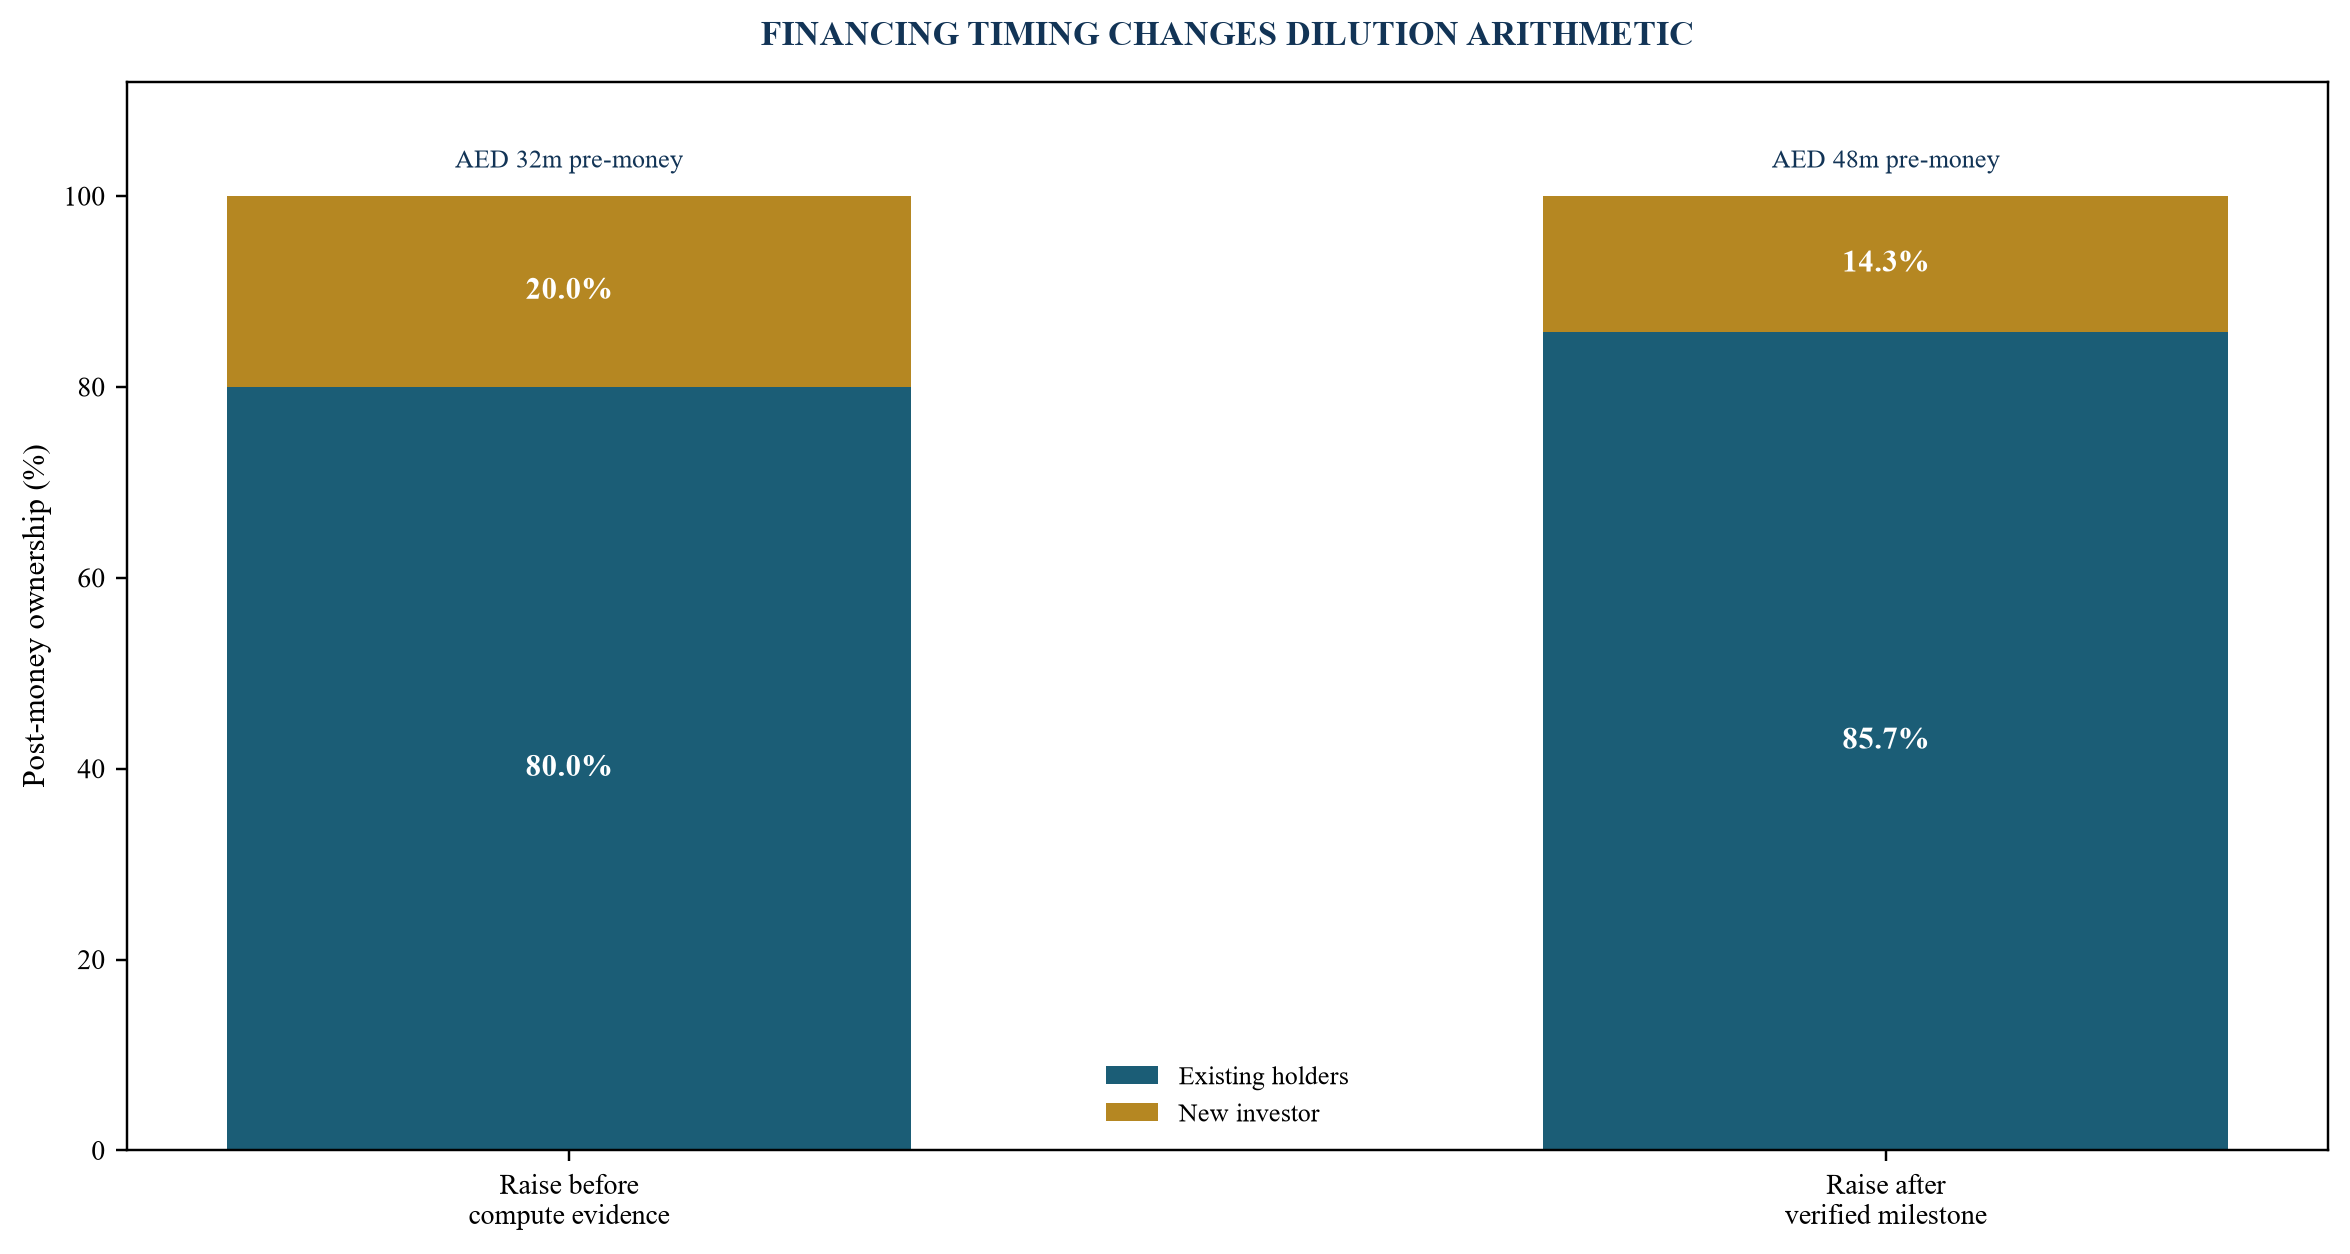
Valuations and financing amounts are illustrative management assumptions; no valuation outcome is implied.
15. Build the investor compute data room
The compute data room should allow an investor to trace technical demand into cash need. It contains the product architecture, workload ledger, provider invoices, unit-cost model, performance and evaluation evidence, customer contracts, service levels, capacity commitments, credits and grants, security and data-location maps, incident history, intellectual-property position and the board approvals for material contracts.
The model should be reproducible. A reviewer can select a customer cohort or product and reconcile completed units to model calls, accelerator-hours, data and human review. It can compare the rate in the model with the signed provider agreement and cash payment. It can identify which credits expire and which discounts depend on commitment.
Management should disclose limitations. Benchmarks may differ from production. Future provider prices are uncertain. Customer demand can be cancellable. Capacity can be unavailable in a preferred region. Savings opportunities can require engineering. A transparent limitations register usually supports a stronger diligence process than unexplained precision.
The board should also provide the transition plan. Investors need to understand what happens when credits expire, utilisation crosses a step, a model is retired, a customer demands a new region or a public programme ends. The transition cost and funding source should be explicit.
16. Operate a compute control room
The compute control room is a management cadence rather than a software product. Finance, product, engineering, security and commercial owners review one reconciled dashboard. The meeting tracks productive units, full unit cost, gross contribution, forecast demand, capacity utilisation, committed spend, cash runway, provider concentration, service performance, security evidence and decision deadlines.
Variance is decomposed into price, volume, mix, efficiency and waste. Price variance comes from rates, currency or discount. Volume variance comes from demand. Mix variance comes from model, region or service tier. Efficiency variance comes from prompt, caching, batching, model architecture and orchestration. Waste includes idle resources, failed jobs and forgotten environments. This decomposition directs action to the accountable team.
The control room also owns a commitment calendar. It records reservation renewal, credit expiry, grant reporting, provider notice periods, contract re-openers and fundraising milestones. A ninety-day warning can allow the company to renegotiate, change architecture or raise capital before a cliff.
Table 6. Board compute-governance checklist
| Control area | Board question | Required evidence | Escalation trigger |
|---|---|---|---|
| workload and demand | which measured demand justifies the forecast? | production ledger, contracts and cohort bridge | forecast depends materially on unsigned or unmeasured demand |
| unit economics | what does one completed customer outcome cost? | usage-to-invoice reconciliation and contribution bridge | cost per outcome rises beyond approved tolerance |
| commitments | what cash is non-cancellable and when does it expire? | signed contracts, reservation inventory and downside case | utilisation falls below break-even or liquidity buffer |
| concentration | can the service move if a provider, model or region fails? | dependency map, recovery test and migration estimate | single dependency threatens contracted service |
| data and AI risk | are data, evaluation and monitoring controls funded? | data map, risk register, evaluation and incident records | product launches without approved evidence or jurisdictional review |
| capital | does the raise fund the next evidence milestone and downside? | integrated cash model, funding roadmap and cap table | runway falls below board threshold or milestone slips |
Each item should have an owner, evidence source, decision date and escalation route.
17. Execute a 120-day compute-finance programme
The first thirty days establish truth. Management inventories workloads, providers, regions, commitments, credits, invoices, telemetry, customer service levels and data classes. It freezes unowned resources, assigns owners and reconciles the prior three months of technical usage to cash payments. It defines the unit of customer value and documents model limitations.
Days thirty-one to sixty build the model. The team allocates full cost to workloads and cohorts, creates minimum, base, upside, downside and severe scenarios, and tests architectural alternatives. Security and legal advisers validate data and regulatory requirements. Commercial teams review pricing, usage limits and service levels.
Days sixty-one to ninety align capital. The company maps grants, credits, customer funding, equity, debt and infrastructure finance to the evidence states they can support. It obtains current provider quotations, negotiates flexibility and prepares the investor data room. The board approves the risk appetite, liquidity reserve and permitted commitments.
Days ninety-one to 120 execute and monitor. The company signs only approved capacity, implements cost and evaluation controls, updates customer terms where appropriate and launches the compute control room. Fundraising materials present the workload evidence, use of funds, downside and milestone without promising a valuation outcome.
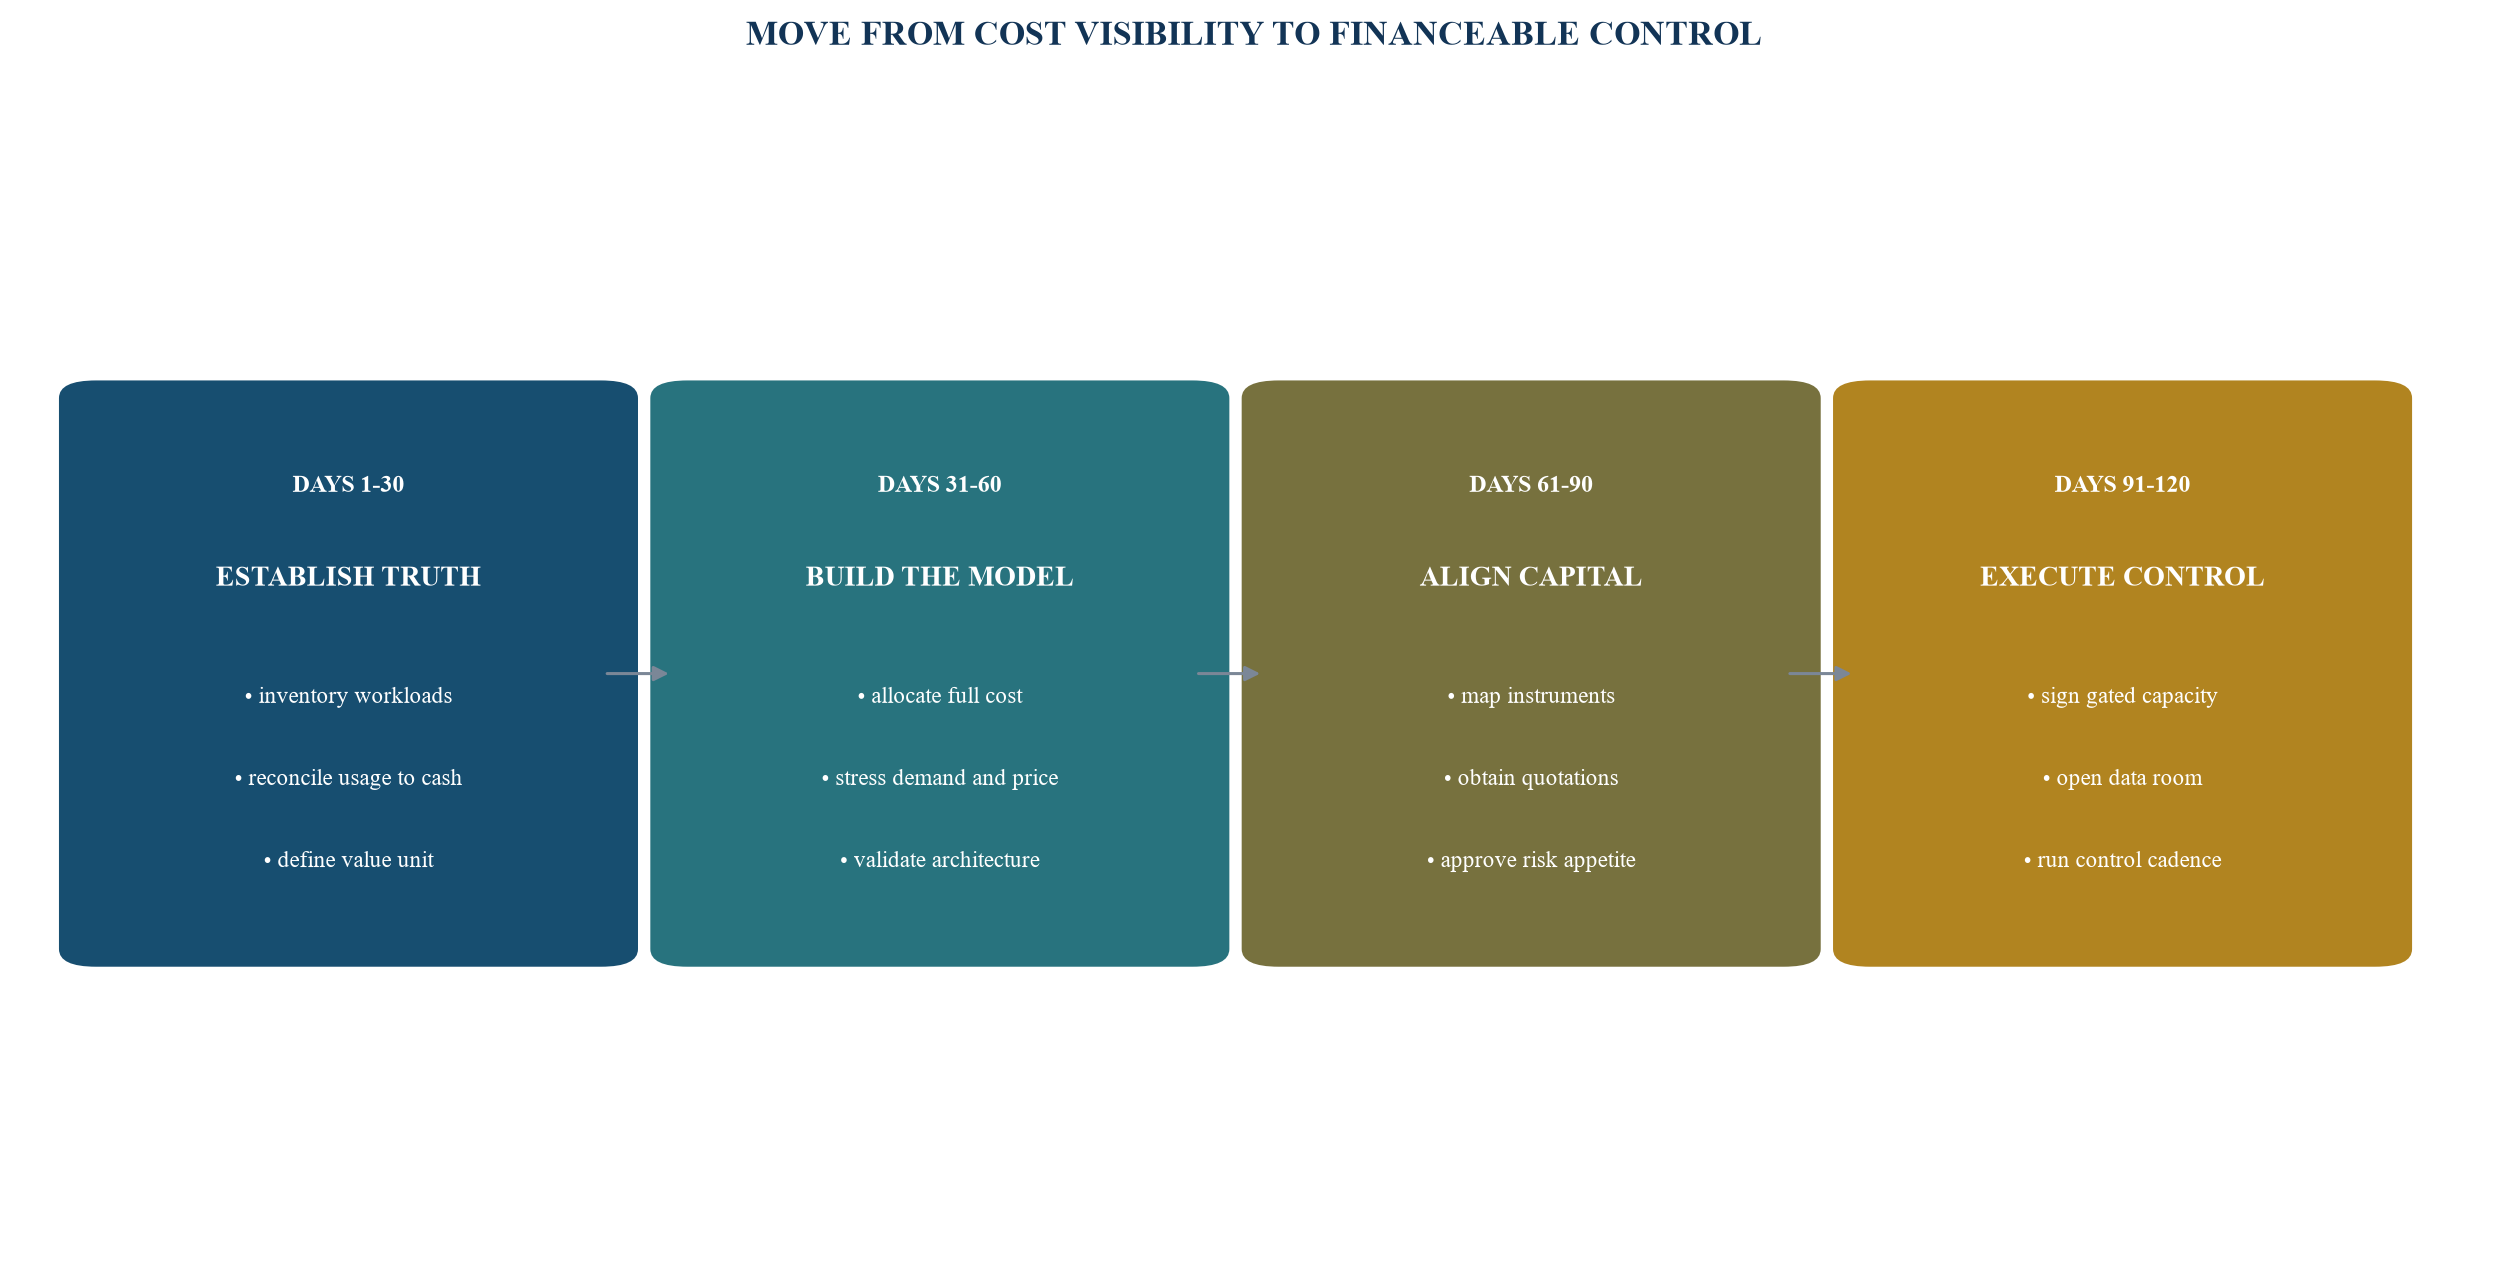
The programme creates a repeatable operating cadence rather than a one-off cost exercise.
18. Use compute discipline to create enterprise value
Compute discipline can improve capital allocation, product reliability and diligence quality. It gives the board a common language for engineering and finance. It can reveal which use cases create contribution, which customers require premium architecture, where a commitment is justified and how much capital is needed to reach the next evidence state.
The value mechanism is operational. Better workload attribution can improve pricing and product focus. Capacity gates can reduce stranded commitments. Evaluation and data controls can support enterprise sales. A reproducible cost bridge can strengthen investor diligence. A credible downside case can reduce the risk of an emergency raise. These outcomes remain dependent on execution, market demand and financing conditions.
The board decision should answer seven questions. What customer outcome is being delivered? Which measured workload produces it? What is the full cost per outcome? Which capacity portfolio supports the service promise? What cash commitment and downside follow? Which capital instrument has the matching duration and risk? What evidence will permit the next commitment?
A company that answers these questions can present compute as a controlled productive asset. It can enter fundraising with an explicit use of funds, a measurable milestone, a full unit-economic bridge and a transition plan. That is the practical purpose of the compute runway.
References
- International Energy Agency, Energy and AI: Energy Supply for AI, 2025. https://www.iea.org/reports/energy-and-ai/energy-supply-for-ai
- Amazon Web Services, Amazon EC2 Capacity Blocks for ML. https://aws.amazon.com/ec2/capacityblocks/
- Amazon Web Services, Capacity Blocks pricing. https://aws.amazon.com/ec2/capacityblocks/pricing/
- Amazon Web Services, Capacity Blocks pricing and billing documentation. https://docs.aws.amazon.com/AWSEC2/latest/UserGuide/capacity-blocks-pricing-billing.html
- Google Cloud, GPU pricing. https://cloud.google.com/products/compute/gpus-pricing
- Google Cloud, Committed use discounts for Compute Engine. https://docs.cloud.google.com/compute/docs/instances/signing-up-committed-use-discounts
- Microsoft Azure, Azure savings plan for compute. https://learn.microsoft.com/en-us/azure/cost-management-billing/savings-plan/savings-plan-overview
- Microsoft Azure, Decide between a savings plan and a reservation. https://learn.microsoft.com/azure/cost-management-billing/savings-plan/decide-between-savings-plan-reservation
- Microsoft Azure, Pricing calculator. https://learn.microsoft.com/en-us/azure/cost-management-billing/costs/pricing-calculator
- OpenAI, API pricing. https://openai.com/api/pricing/
- Google AI for Developers, Gemini Developer API pricing. https://ai.google.dev/gemini-api/docs/pricing
- NVIDIA, NVIDIA DGX H100 data sheet. https://www.nvidia.com/content/dam/en-zz/Solutions/Data-Center/nvidia-dgx-h100-datasheet.pdf
- UK Government, AI Research Resource. https://www.gov.uk/government/publications/ai-research-resource
- UK Government, UK Compute Roadmap. https://www.gov.uk/government/publications/uk-compute-roadmap/uk-compute-roadmap
- UK Government, Sovereign AI AIRR launch opportunity. https://www.gov.uk/government/publications/sovereign-ai-airr-launch-opportunity-call-for-researchers/sovereign-ai-airr-launch-opportunity-call-for-researchers
- Government of India, IndiaAI Mission compute capacity announcement, 2026. https://www.pib.gov.in/PressReleasePage.aspx?PRID=2245069&lang=1®=1
- Government of India, IndiaAI compute capacity update, 2025. https://www.pib.gov.in/PressReleasePage.aspx?PRID=2150204&lang=2®=48
- IndiaAI, AI compute capacity and subsidy calculator. https://compute.indiaai.gov.in/indiaaipricecalculator
- Smart Nation Singapore, National AI Strategy. https://www.smartnation.gov.sg/initiatives/national-ai-strategy/
- European Union, Regulation (EU) 2024/1689, Artificial Intelligence Act. https://eur-lex.europa.eu/eli/reg/2024/1689/oj?locale=en
- Abu Dhabi Media Office, Abu Dhabi Government accelerates Digital Strategy with Microsoft and G42 partnership, 2025. https://www.mediaoffice.abudhabi/en/technology/abu-dhabi-government-accelerates-digital-strategy-with-landmark-microsoft-g42-partnership/
- Emirates News Agency, UAE AI infrastructure developments, 2025. https://www.wam.ae/en/article/15xmr3g-uae-marks-2025-with-strategic-transformation
- Public Investment Fund, HRH Crown Prince launches HUMAIN as global AI powerhouse, 2025. https://www.pif.gov.sa/en/news-and-insights/press-releases/2025/hrh-crown-prince-launches-humain-as-global-ai-powerhouse/
- FinOps Foundation, FinOps terminology and unit economics. https://framework.finops.org/assets/terminology/
- National Institute of Standards and Technology, AI Risk Management Framework. https://www.nist.gov/itl/ai-risk-management-framework
