

1 Introduction
An investor acquiring a data-centre business buys a combination of physical assets, legal rights and operating relationships. The building can remain serviceable after several generations of computing equipment have been replaced. A connection may be scarce yet subject to milestones, transfer restrictions or customer-specific conditions. Cooling equipment may still operate while failing to support the rack density required by the next customer. Contracts can protect near-term cash flows while leaving renewal prices exposed. These differences require separate valuation judgments.
The investment question is how a change in the cost of useful computing reaches the cash flows and recoverable assets of a particular business. A benchmark improvement alone supplies little information about that chain. The operator must identify the customer workload, service definition, billing unit, equipment configuration, power commitments and renewal dates. Each determines whether a technical improvement increases volume, lowers cost, reduces purchased hours or changes the acceptable price.
The framework developed here is intended for acquisition analysis, debt sizing, refinancing and capital allocation. It treats valuation as a set of explicit claims about capacity, contracts and recoverable cash. Those claims can be tested against technical records and legal documents. It also provides a practical way to explain a valuation disagreement: two parties may agree on installed capacity yet differ substantially on usable density, future renewal prices, upgrade expenditure or the transferability of the connection.
The paper uses public evidence available on 4 October 2026. Company disclosures describe individual business risks and accounting judgments. Regulatory materials apply within their own jurisdictions. Numerical cases are hypothetical and illustrate mechanisms rather than market forecasts. A transaction requires project-specific engineering, legal, tax, accounting and valuation advice.
2 Evidence and analytical boundaries
The International Energy Agency describes AI electricity demand as the interaction of improving efficiency, adoption and changing applications. Its 2026 report also identifies constraints across physical supply chains. These observations support using several demand cases when considering an individual campus. They provide no direct estimate of the probability that a particular tenant renews, or of the price paid for a particular computing service. [1]
MLCommons publishes inference benchmarks with defined workloads and performance requirements. Its documentation distinguishes benchmark modes and identifies how measured power is reported. Benchmark results can inform a technical comparison when the configurations and service requirements are comparable. Translating a result into site cash flow requires additional information about the operator's workload mix, customer acceptance, actual billed throughput and full operating costs. [2]
CoreWeave's annual report describes risks connected with technology competitiveness, capital investment and estimates of asset lives. The disclosure is relevant evidence that these judgments matter commercially. The operator's disclosures should be read in their complete business context. They do not supply a residual-value curve that can be applied unchanged to another operator, equipment generation or jurisdiction. [3]
This paper combines those documented observations with an original analytical framework. The framework is a proposal for organising diligence and decisions. It has not been validated against a representative transaction sample. The hypothetical calculations intentionally isolate a small number of variables. They omit tax, working-capital timing, financing fees, many categories of operating expenditure and engineering constraints that would be necessary in a transaction model.
The analysis uses the term residual in two ways and keeps them distinct throughout. Equipment recovery means net proceeds from sale or redeployment after identified costs. Business terminal value means the value of cash flows beyond the explicit forecast period. Accounting residual estimates, collateral recovery and going-concern terminal value have different purposes. A valuation report should state which meaning applies before presenting a number.
3 Define the asset and revenue perimeter
The first step is a component register tied to legal ownership and economic responsibility. The register should identify land and buildings, grid connection infrastructure and rights, electrical systems, cooling systems, racks and computing equipment. It should also identify customer contracts, software dependencies, leases, warranties, maintenance obligations and any assets provided by customers. A seller's operating description may combine these items, while the lender's security package captures only some of them.
An equipment lender may have a security interest in computing assets without a practical route to operate them after enforcement. An infrastructure investor may own the shell while a customer owns the accelerators. A campus operator may depend on a connection agreement held by an affiliate. These arrangements change the relationship between physical capacity and realisable value. Diligence should record the documents required for continued operation and the consents required for a transfer.
The revenue perimeter deserves the same precision. Colocation charges, reserved power fees, managed computing revenue and usage-based inference revenue have different sensitivities. A rental arrangement can place technology renewal with the customer. A managed service can leave the operator responsible for equipment competitiveness. A minimum commitment can support cash flow, subject to customer credit, acceptance, service credits and enforceability. Revenue should be disaggregated by contract mechanism before any efficiency assumption is applied.
Figure 1 provides the physical and contractual architecture used in this paper. Value passes through several dependencies. Each component requires its own evidence of capability, entitlement and recovery. An investor should be able to reconcile the diagram with the asset register, the customer contracts and the financial model. Any component omitted from one of those records deserves investigation before a consolidated valuation is accepted.
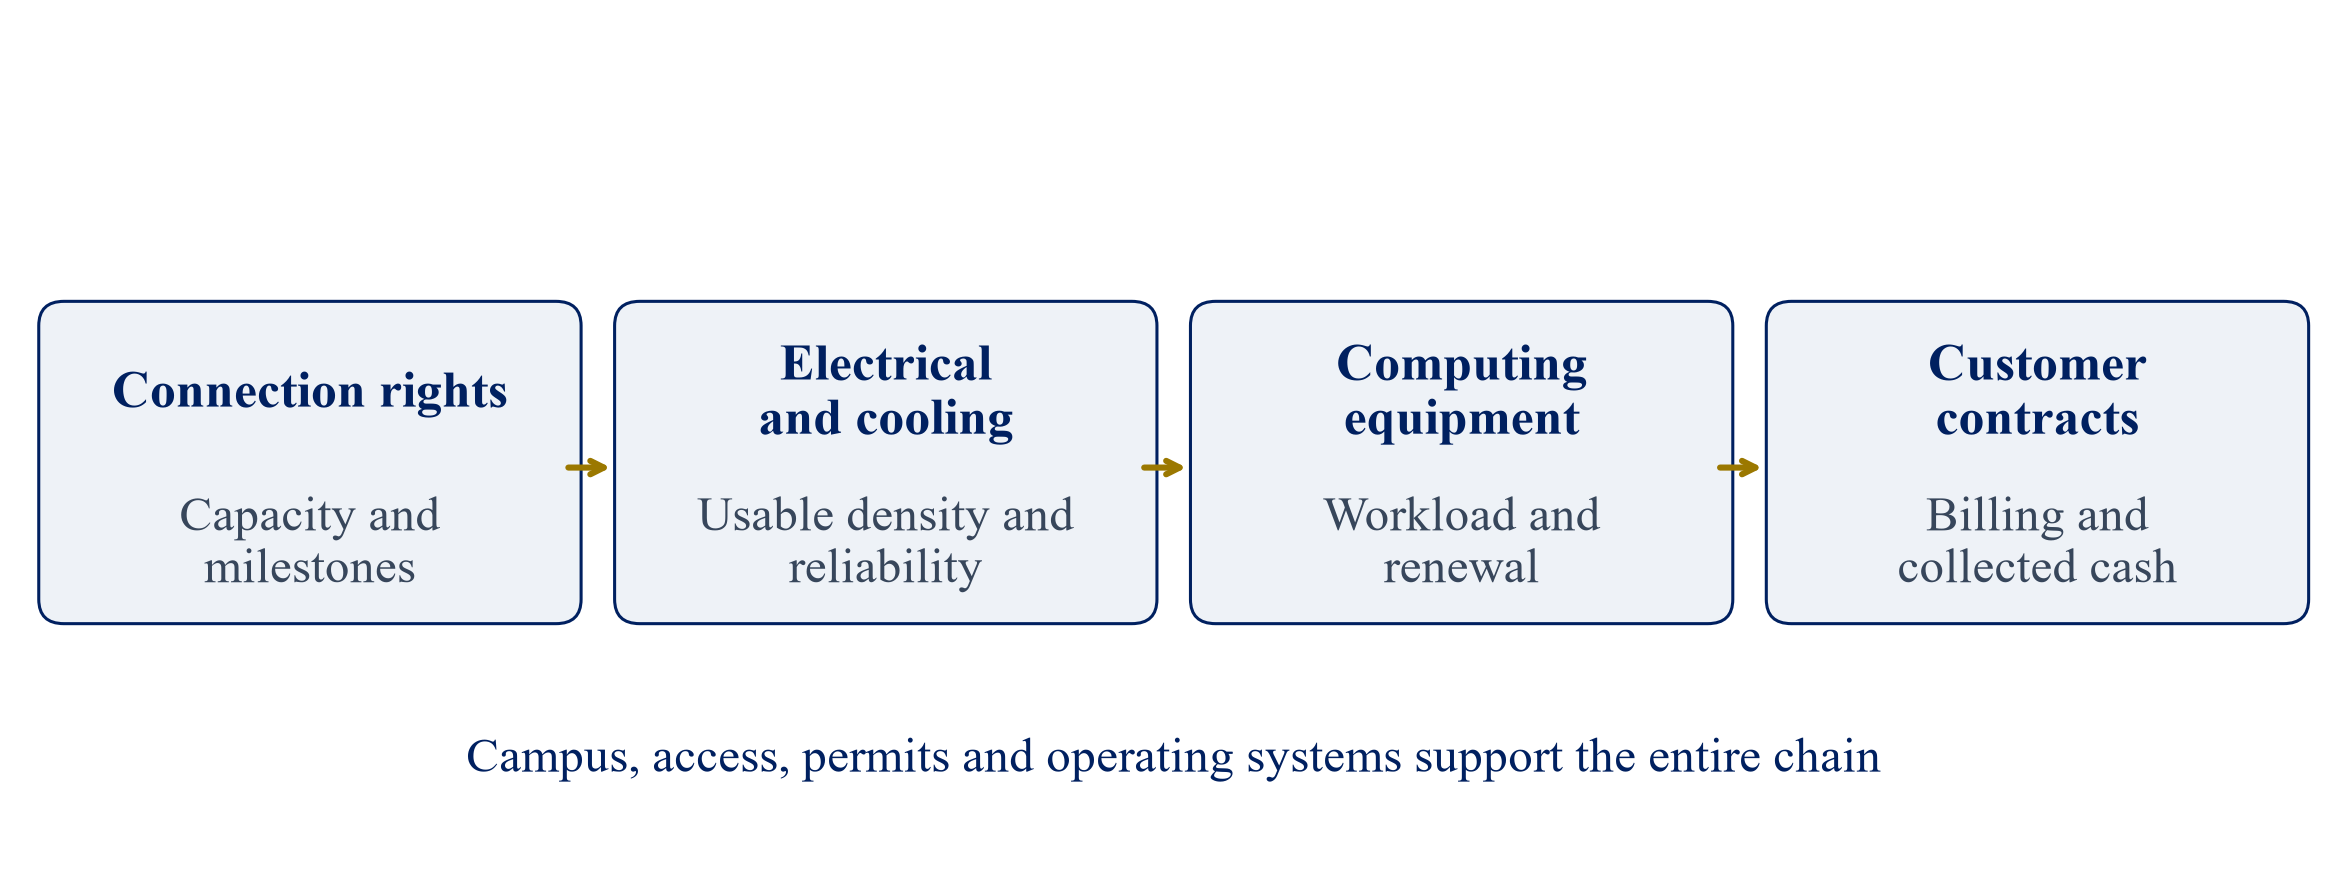
Author-developed framework. Arrows show operating dependencies; they do not establish legal ownership, security or transferability.
4 Distinguish technical performance and commercial output
Useful computing should be defined in the customer's terms. A language-model workload might depend on output quality, latency, context length and concurrency. A training job might depend on completion time, communications performance and checkpoint reliability. An engineering simulation can have a different set of constraints. A price per accelerator-hour measures access to equipment; it does not necessarily measure the cost of completing a commercially useful task.
Technical diligence should reconstruct a workload using a documented configuration. Record the hardware generation, memory, network, software version, precision settings and performance requirements. Compare results using the same quality and latency conditions. Report which tests use measured system power and which rely on specifications or estimates. A supplier's ideal throughput should not be inserted directly into a revenue forecast without testing the operator's delivery environment.
The commercial bridge then asks who captures the improvement. A customer paying a fixed monthly reservation may initially receive better throughput without an immediate billing change. A customer paying per unit of completed work may create more revenue from the same equipment, depending on demand and contract terms. A customer paying per hour may buy fewer hours for an unchanged task. At renewal, competitive prices and alternative providers can alter the allocation again.
Consider a hypothetical service that completes twice as many accepted jobs per operating hour after a software improvement. Holding jobs demanded and hourly prices unchanged, the hours required fall by half. If billing is per accepted job, the immediate revenue mechanism differs. If new applications increase demand, the operator may recover some or all of the released hours. These are separate hypotheses requiring evidence. Combining them into one assumption hides the source of the valuation change.
5 Measure utilisation in four distinct layers
Booked utilisation is capacity reserved under signed agreements. Physical utilisation measures the equipment actually used over an identified period. Billable utilisation measures the activity for which the operator can invoice under the contract. Cash utilisation measures invoices converted into collected cash. All four should use defined denominators and time periods. The distinction is essential when a site has committed customers, delayed acceptance or equipment operated below its assumed throughput.
For each month, reconcile installed capacity to technically available capacity after maintenance and failures. Reconcile that quantity to customer reservations and actual consumption. Identify excluded test hours, free credits, non-billable migration and performance penalties. Finally reconcile invoices to cash collection, preserving disputes and overdue balances. This sequence connects engineering performance to financial evidence and exposes where capacity claims become less certain.
Peak demand and average use answer different questions. A campus may need to provide high peak capacity while generating revenue from lower average use. A project can also report high accelerator utilisation while part of its power reservation remains idle. For valuation, request interval power records and workload records alongside commercial reports. Aggregated annual averages can conceal seasonal limitations, coincident peaks and persistent underuse of a particular asset generation.
A useful monthly report shows availability, booked capacity, accepted service output, invoiced output and cash received by customer and equipment cohort. It should explain every material difference. Treating a single headline occupancy figure as a proxy for all five quantities increases modelling ambiguity. Clear definitions also improve transaction negotiations because the buyer and seller can agree precisely on the metric underlying an earn-out, covenant or adjustment.
6 Separate the efficiency and demand hypotheses
Efficiency changes the resources required per accepted task. Demand changes the number and nature of tasks customers purchase. Price changes the revenue generated per task or service unit. These variables should be independently adjustable in the valuation model. A campus forecast should explain the assumed relationship between them, including the period over which customers and competitors react.
Three original cases are useful. The first holds useful work constant and lets purchased hours fall. The second lets lower service costs encourage additional work. The third combines lower prices with more demanding applications, so the aggregate resource requirement increases. Each can be technically possible under different conditions. None becomes a forecast until supported by contract evidence, measured workload behaviour and a defensible customer demand analysis.
A global growth projection cannot settle which case applies to one campus. Location, network access, sovereignty requirements, customer concentration, service quality and competing supply affect local demand. An efficient site with weak customer acquisition can lose volume. A less efficient site with a valuable location and protected contract may retain cash flow for a period. The model should show the timing of those contractual protections and the uncertainty after they expire.
The practical question for an investment committee is therefore which evidence changes the decision. A customer renewal letter has a different evidential status from a verbal expression of interest. Measured paid workload growth has a different status from a sector projection. A completed technical acceptance test has a different status from planned commissioning. Assign each forecast input a source, date, owner and sensitivity so the committee can see the assumptions that remain exposed.
7 Connection timing and the economic age of equipment
A commissioning delay can reduce the economic usefulness of computing equipment before the campus earns operating revenue. Equipment may be purchased to secure supply or obtain a commercial discount. During the delay, interest, storage, maintenance and contractual obligations can accumulate. New equipment generations can change customer preferences. The relevant transaction question is how much flexibility remains between procurement and verified energisation.
Figure 2 uses a hypothetical timeline to demonstrate the mechanism. Early procurement occurs six months before the assumed connection date. A delayed connection shifts accepted operations by another nine months. The period between procurement and accepted operations consequently becomes fifteen months. The figure does not predict an equipment life or a grid completion date. It shows why those two schedules should be evaluated together.
The procurement plan can retain options through staged deliveries, conditional orders, contractual storage arrangements or delayed customer-specific configuration. Each arrangement has a cost and depends on supplier agreement. An operator should quantify cancellation fees, price protection, title transfer, warranties, storage risks and the ability to substitute a newer configuration. Broad statements about being ready for AI demand provide little information about these rights.
NESO's connection reform materials and FERC's large-load proceeding illustrate active regulatory work on connection arrangements. They should be read within their respective systems and current procedural status. They do not certify the readiness of an individual campus. A transaction needs the executed connection agreement, milestone evidence and a review of responsibility for upgrades, curtailment and delay. [4,5]
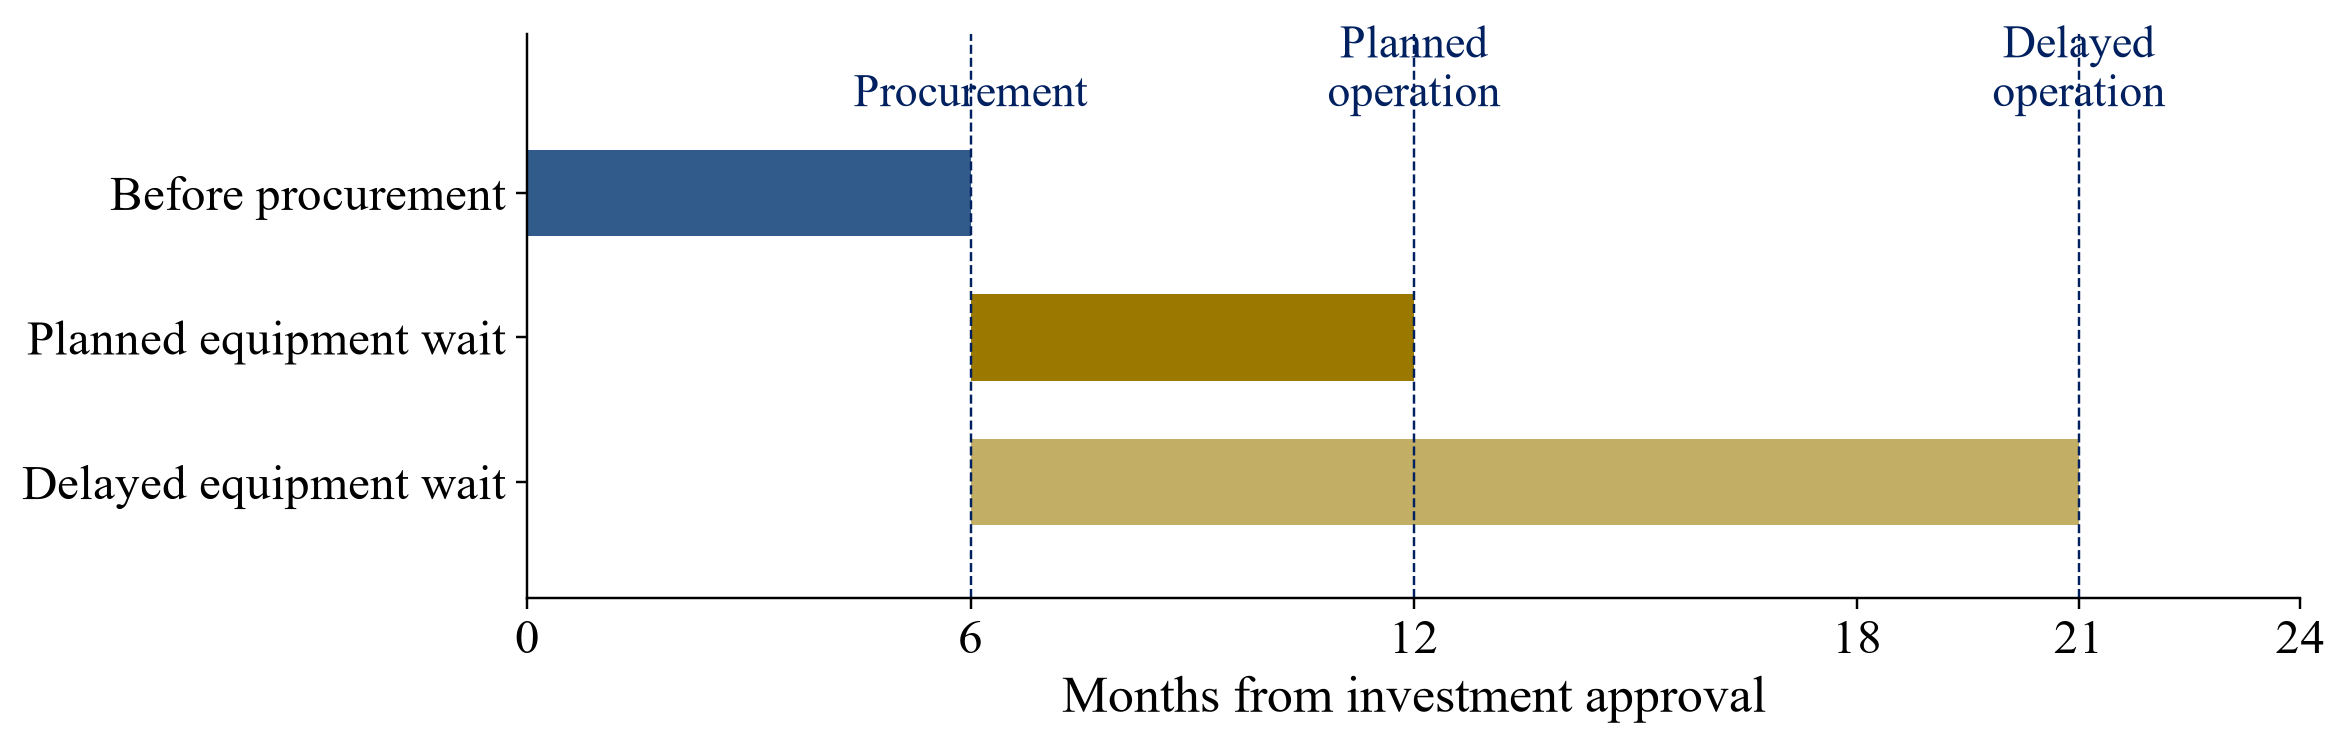
Hypothetical timeline in months from investment approval. Procurement at month 6, planned operation at month 12 and delayed operation at month 21 are illustrative assumptions.
8 Value components against their own recovery evidence
The campus should be evaluated for permitted use, alternative tenants, configuration, tenure and restoration obligations. A building designed for one density can require significant work to support another. A desirable location can have value even when current computing equipment becomes obsolete, subject to usable power and permissions. An appraisal should identify the expenditure and time required to reach the assumed alternative use.
Connection-related value depends on enforceable rights and the ability of an incoming owner or tenant to use them. A capacity allocation might be subject to use milestones or restrictions. The transaction team should obtain advice on whether capacity survives a change of control, equipment replacement or customer change. A connection asset shown in the balance sheet and a legal right to future service can have different boundaries.
Electrical and cooling systems require technical assessment of supported density, redundancy, condition, compatibility and operating cost. Their residual usefulness depends on the demands of prospective users. Computing equipment requires a separate assessment of workload suitability, support, licence dependencies and the practical costs of relocation. A quoted resale price should be adjusted for transport, brokerage, taxes, data sanitisation and reinstatement where relevant.
Table 1 organises the required evidence. It intentionally supplies no standard residual percentage. A fixed percentage applied across components would conceal differences in serviceability, legal transfer and marketability. Recovery estimates should state the assumed sale process and time horizon. An orderly sale and an accelerated enforcement sale can produce different outcomes, particularly where equipment must be removed from a facility controlled by another party.
Table 1. Component evidence needed before assigning residual value
| Component | Recovery basis | Evidence required |
|---|---|---|
| Campus and land | Alternative use or continued operation | Tenure, permits, condition, conversion costs and comparable transactions |
| Connection entitlement | Continued usable service | Executed agreement, milestones, transfer consent and upgrade obligations |
| Electrical and cooling systems | Compatible future workloads | Density capability, condition, maintenance and replacement expenditure |
| Computing equipment | Sale or economic redeployment | Configuration, accepted workloads, support, buyer quotes and removal costs |
| Customer contracts | Collectable remaining commitments | Acceptance, termination, credits, counterparty credit and assignment rights |
Author-developed diligence matrix. Recovery assumptions require project-specific legal, technical and market evidence.
9 Keep accounting estimates and valuation purposes separate
IAS 16 addresses recognition and measurement of property, plant and equipment, including depreciation and impairment. IAS 36 addresses impairment and recoverable amount. IFRS 13 establishes a framework for fair value measurement. These standards serve defined financial-reporting purposes. A lender's advance rate, an acquisition price and a management capital-allocation case may require additional assumptions and a different decision context. [6,7,8]
The IFRS Interpretations Committee discussed estimating residual value under IAS 16 in September 2026. The published update records the committee's process and the matters considered. Transaction teams should check the final applicable guidance and their reporting framework with their accounting advisers. An active interpretation discussion should not be presented as a new settled rule governing all equipment recovery estimates. [9]
An original valuation register should record the purpose, basis, date and unit of account for each estimate. It should identify whether the estimate concerns an asset in continued use, an orderly sale, an impairment test or enforcement proceeds. State assumed access to the campus, the status of customer contracts and any liabilities transferred with the assets. Otherwise a residual can appear precise while representing an undefined transaction.
The register should also reconcile assumptions across the operating model and asset appraisal. If the cash-flow forecast assumes a technology replacement in year four, the year-five equipment residual needs to describe which equipment remains. If a terminal cash-flow multiple assumes continued refresh expenditure, a separate sale of the same operating equipment may double count value. A clear reconciliation supports both negotiation and financial reporting without substituting for professional judgment.
10 Construct a transparent capacity economics model
The following case uses a hypothetical campus with 100 megawatts of installed IT capacity. Annual full-utilisation service revenue is assumed to be USD 250 million at the initial service price. Average billable utilisation is 80 percent. Power usage effectiveness is assumed to be 1.25. Electricity is assumed to cost USD 80 per megawatt-hour. These figures are modelling inputs and describe no observed project.
The model separates a fixed annual capacity charge of USD 25 million from metered electricity. Other cash operating costs are assumed to be USD 25 million and a maintenance and refresh reserve USD 20 million. Scheduled debt service is USD 45 million. Taxes, working-capital movements, initial construction costs and financing fees are omitted. The reserve is a simplified annual cash deduction; an actual model needs equipment-specific replacement dates and reserve balances.
Annual metered electricity equals installed IT megawatts multiplied by 8,760 hours, billable utilisation, assumed power usage effectiveness and an energy-intensity factor. The factor initially equals one. This deliberately assumes billable utilisation tracks energy-consuming activity; a real model must separate the two using metered information. Under the baseline, annual electricity is 876,000 megawatt-hours and the metered bill is USD 70.08 million.
Cash flow available for debt service, abbreviated CFADS, equals service revenue less the capacity charge, metered electricity, other cash operating costs and the refresh reserve. Baseline CFADS is USD 59.92 million. The illustrative debt-service coverage ratio, CFADS divided by scheduled debt service, is 1.33 times. The calculation establishes a transparent reference against which price, utilisation and efficiency changes can be tested.
11 Test the combined price and efficiency effects
In the first sensitivity, the service price falls by 25 percent, utilisation increases to 85 percent and energy intensity falls by 10 percent. Annual service revenue becomes USD 159.375 million. Metered electricity falls to 837,675 megawatt-hours, costing USD 67.014 million. The fixed cash deductions remain USD 70 million. CFADS consequently becomes USD 22.361 million and coverage falls to approximately 0.50 times.
The arithmetic shows the scale of the revenue mechanism. The increased utilisation raises sold capacity relative to the starting case. The efficiency improvement lowers the electricity required for each unit of activity. Together they still leave a cash shortfall against the assumed debt service because the reduced service price has a larger effect. Any investment recommendation based on this case must specify which revenues are exposed to repricing and when that exposure arises.
In the stronger demand case, utilisation reaches 95 percent and energy intensity falls by 20 percent, with the same 25 percent price reduction. CFADS is USD 41.549 million and coverage approximately 0.92 times. The case demonstrates that an optimistic volume response can remain insufficient under the assumed fixed commitments. A combined downside case uses 65 percent utilisation, a 35 percent price reduction and a 15 percent efficiency improvement; CFADS is negative USD 12.774 million.
Table 2 keeps every scenario assumption visible. The cases assign no probabilities. They should be replaced with contract-specific prices, paid workload evidence and measured energy data in a transaction. Sensitivity testing is valuable precisely because it makes disagreement explicit. It does not establish the likelihood of a price change or prove that demand will follow any particular path.
Table 2. Hypothetical annual capacity economics and debt coverage
| Case | Utilisation | Price factor | Energy factor | Revenue | CFADS | Coverage |
|---|---|---|---|---|---|---|
| Baseline | 80% | 1.00 | 1.00 | 200.000 | 59.920 | 1.33x |
| Price and efficiency change | 85% | 0.75 | 0.90 | 159.375 | 22.361 | 0.50x |
| Stronger demand response | 95% | 0.75 | 0.80 | 178.125 | 41.549 | 0.92x |
| Combined downside | 65% | 0.65 | 0.85 | 105.625 | -12.774 | -0.28x |
All monetary amounts are USD millions. PUE 1.25, full-capacity initial revenue 250, electricity USD 80/MWh, fixed deductions 70 and debt service 45 apply throughout. Negative CFADS denotes an operating cash shortfall before debt service.
12 Identify the operating thresholds before sizing debt
The model can be written as CFADS equals utilisation multiplied by the difference between full-capacity revenue and full-capacity metered energy cost, less fixed deductions. At the baseline price and intensity, that difference is USD 162.4 million. The cash operating break-even utilisation is therefore USD 70 million divided by USD 162.4 million, or approximately 43.1 percent. Debt coverage imposes a higher threshold.
For an illustrative minimum coverage of 1.20 times on USD 45 million debt service, required CFADS is USD 54 million. Baseline required utilisation is therefore USD 124 million divided by USD 162.4 million, or approximately 76.4 percent. This threshold is a case assumption, not a recommended covenant or an observed lending standard. It gives the committee a clear way to compare expected paid use with the obligations proposed.
After the 25 percent price reduction and 10 percent energy-intensity improvement, the contribution coefficient falls to USD 108.66 million. Required utilisation for the same coverage becomes approximately 114.1 percent. That result exceeds the assumed installed capacity. The response must involve different economics, lower scheduled debt service, reduced fixed commitments or additional validated capacity. Raising an utilisation assumption beyond physical limits would invalidate the case.
Figure 3 shows the original baseline-intensity sensitivity across price and utilisation. The contour indicates the case's 1.20-times threshold. It is intended to make the boundary visible, including combinations that fail to generate enough cash. A transaction model should use separate monthly customer ramps and energy constraints so the annual arithmetic does not conceal a liquidity shortfall during commissioning or renewal.
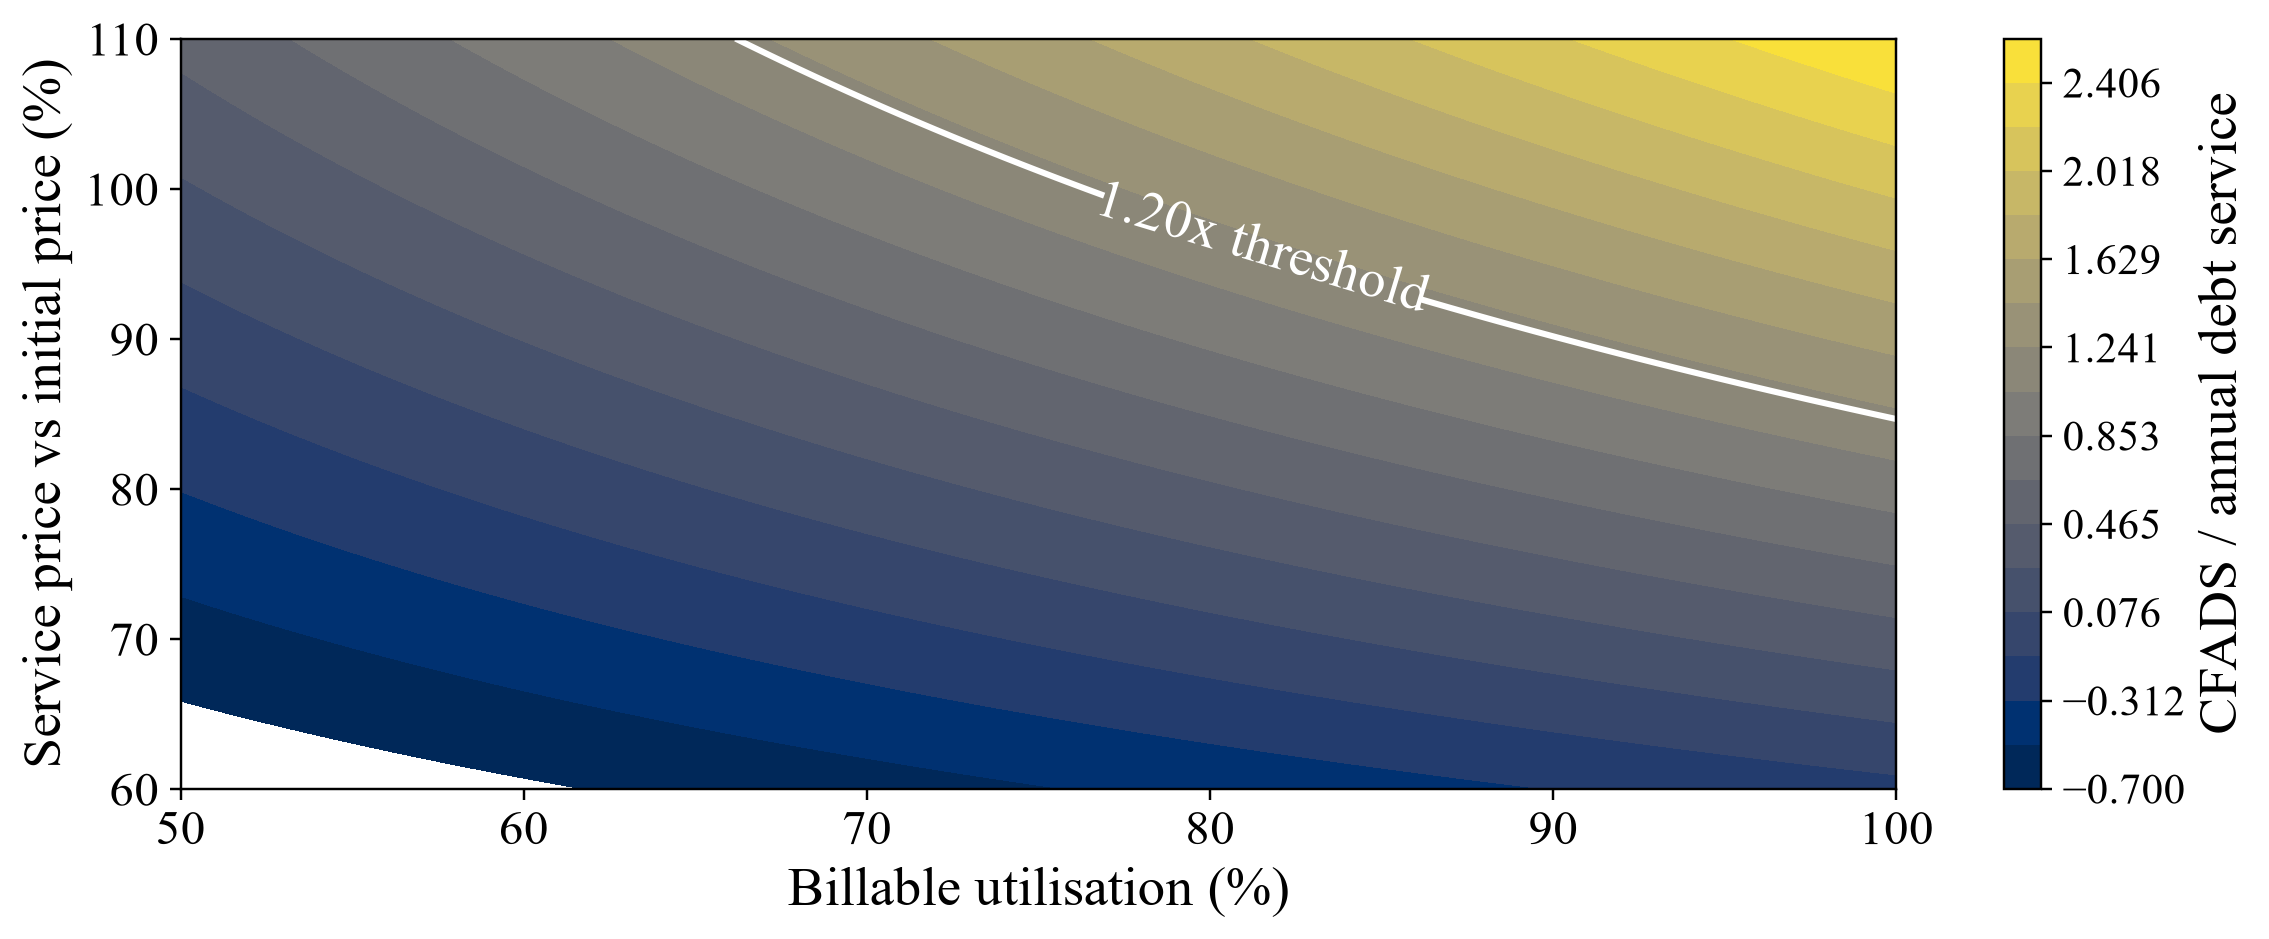
Author-developed hypothetical model. Electricity intensity remains at baseline; fixed annual deductions are USD 70 million and debt service USD 45 million. The contour marks the illustrative 1.20x threshold.
13 Evaluate residual recovery without counting cash twice
A hypothetical equipment pool acquired for USD 100 million illustrates a separate recovery analysis. The valuation date is four years after purchase. An orderly-sale case assumes gross sale proceeds of USD 25 million and removal, brokerage and restoration costs of USD 5 million. Net recovery is USD 20 million. A stressed case assumes gross proceeds of USD 12 million and costs of USD 7 million, producing net recovery of USD 5 million.
A redeployment case assumes USD 15 million of annual operating cash contribution for two further years. It requires an immediate USD 8 million upgrade and a USD 3 million net disposal receipt at the end of the second year. At a hypothetical 12 percent annual discount rate, the redeployment value is approximately USD 19.74 million: negative eight plus fifteen divided by 1.12 plus eighteen divided by 1.12 squared. That estimate is conditional on the stated workloads, access and costs.
The sale and redeployment alternatives should be evaluated on the same valuation date and consistent assumptions about liabilities. The owner cannot sell the equipment and simultaneously retain all of its future operating cash flow. If redeployment cash is included in the business forecast, adding the full redeployment value separately overstates the total. An equipment appraisal and a business valuation should explicitly reconcile this potential overlap.
Table 3 also exposes a practical issue with collateral coverage. A hypothetical USD 30 million loan balance exceeds both the orderly and stressed net sale recoveries. Ongoing operations could still support refinancing under different assumptions, but that requires an independent cash-flow and credit assessment. A balance-sheet cost or a long depreciation schedule does not supply a buyer, an enforceable access right or cash proceeds at enforcement.
Table 3. Hypothetical equipment recovery alternatives four years after purchase
| Alternative | Gross sale proceeds | Immediate costs | Net value |
|---|---|---|---|
| Orderly equipment sale | 25.00 | 5.00 | 20.00 |
| Stressed equipment sale | 12.00 | 7.00 | 5.00 |
| Two-year redeployment | Cash flows 15 then 18 | Upgrade 8.00 | 19.74 present value |
| Illustrative loan balance | Not applicable | Not applicable | 30.00 obligation |
USD millions at the recovery assessment date. Redeployment value uses a 12% assumed discount rate and includes final disposal; alternatives cannot be added together. No market residual percentage is asserted.
14 Test renewal capital and terminal value together
A business that remains competitive through recurring equipment replacement needs a forecast of that replacement expenditure. An annual reserve can help illustrate the issue, but a full model should identify each cohort, expected upgrade date and source of funds. It should include compatibility works, migration, downtime and the treatment of replaced equipment. Operating earnings measured before those cash needs can give an incomplete picture of distributable cash.
Terminal cash flow should describe a sustainable operating condition. If the explicit forecast ends shortly before a major refresh, a terminal multiple applied to the preceding year's earnings can capitalise a temporarily favourable period. The model should identify the refresh expenditure required to maintain the terminal revenue assumption. It should also state whether the terminal owner receives existing equipment, a refreshed fleet or a business with an unfunded replacement requirement.
A buyer can request a bridge from enterprise value to component values as a reasonableness check. The bridge does not require adding every component appraisal to a business valuation. It explains which assets support the projected cash flow, where liabilities sit and whether a component assumption is inconsistent with the operating case. Reconcile customer-owned equipment, leases and contracts that terminate on a change of control.
Terminal-value sensitivity should cover renewal prices, capacity utilisation, replacement costs and the discount rate. Avoid applying the same sector multiple to campuses with materially different customer credit, power access or upgrade liabilities without analysing those differences. A transaction report should make clear whether the value conclusion depends mainly on cash flows during the contracted period or on assumptions after the contracts expire.
15 Allocate power commitments and efficiency gains contractually
Power procurement can combine fixed reservation fees, minimum purchase obligations, variable metered charges, hedges and penalties. Each should be modelled according to its contractual formula. An efficiency improvement may reduce metered consumption while leaving reservation fees unchanged. Under a minimum energy obligation, some of the reduced consumption may fail to produce equivalent cash savings. A hedge can also create settlements that differ from physical energy use.
Customer agreements determine whether the operator can pass through those obligations or must absorb them. Review the relationship between contracted IT capacity, actual energy consumption, demand charges and service credits. Where a customer reserves capacity but uses less energy, identify which party bears idle reservation cost. Where a customer demands greater density, identify the party responsible for cooling modifications and electrical upgrades.
An original negotiation approach is to match the duration and termination exposure of major commitments. A long utility obligation supported by a short customer contract creates a renewal exposure. A customer minimum commitment can reduce that exposure, subject to credit and enforceability. Release provisions should state how capacity is reallocated after termination and what restoration or connection consequences follow. These provisions require local legal advice.
Efficiency sharing can be explicitly negotiated. For example, a hypothetical agreement might split verified metered-energy savings after defined upgrade costs, or retain a fixed capacity price while adjusting usage charges. The commercial case should identify measurement boundaries, baseline changes, audit rights and treatment of workload migration. Without those definitions, claimed savings can become difficult to verify and disputes can weaken the cash-flow assumption used at financing.
16 Structure acquisition consideration around measurable uncertainty
In an acquisition, disagreement about future utilisation or residuals can be addressed through the structure of consideration. A fixed price may reflect verified assets and contracted cash flows. Additional consideration can be tied to accepted capacity, paid workload, renewal contracts or realised recovery. Every contingent mechanism needs a clear definition, a measurement period and protection against actions that change the result without creating the intended economic value.
An earn-out based only on headline booked capacity can reward reservations that do not produce cash. One based only on revenue can reward discounted growth with weak contribution margins. A carefully designed mechanism can include collected revenue and clearly allocated energy and service costs, subject to accounting consistency and dispute procedures. Such structures remain transaction-specific; no mechanism removes counterparty or litigation risk.
The diligence model should identify who controls decisions during the measurement period. A buyer that changes equipment, customer pricing or sales policy may influence an earn-out outcome. A seller retaining operational control may defer maintenance or accept weak customer terms. Reserved decisions and information rights should match these incentives. Legal drafting must also address termination, customer assignment and changes in relevant accounting policies.
The asset perimeter can support separate debt facilities, leases or acquisition tranches. These arrangements require review of intercreditor rights, access, step-in, cross-default and operating continuity. An equipment creditor's recovery case can weaken if another creditor controls the premises or power contract. Coordinating enforcement assumptions before signing is a practical way to expose inconsistency between the financing model and the actual security package.
17 Apply geography and regulation to the specific asset
Geographic comparison should begin with the service requirement and the relevant legal and physical systems. A site serving latency-sensitive workloads faces a different competitive perimeter from a batch-computing site. Data residency, customer procurement rules, network connectivity, permitting and power arrangements can constrain relocation. A cheaper remote computing offer becomes relevant only if it meets the customer's applicable requirements.
In Great Britain, connection reform requires careful review of the specific project position and applicable documents. In the United States, federal transmission proceedings and local utility arrangements have distinct roles. The FERC large-load docket records a regulatory process; its existence alone supplies no approved tariff or project consent. Across jurisdictions, obtain the actual service and interconnection documents before assigning a scarcity premium. [4,5]
The European Commission's data-centre energy-performance materials describe reporting and policy development. The September 2026 common-rating proposal and ongoing work on minimum performance requirements should be identified by their procedural status. A proposal should not be treated as an enacted universal operating constraint. Nevertheless, buyers can examine whether the asset has reliable measurement systems and the capital flexibility to respond to future requirements. [10]
For the UAE, India or another market, the framework requires locally sourced tariff, permitting and contract evidence. This paper assigns no country premium, tax benefit or standard valuation multiple. A transaction team should document currency exposure, equipment import and export requirements, title, enforcement, customer concentration and insurance. Geography enters the valuation through those identifiable constraints and cash flows, with unsupported generalisations excluded.
18 Use AI and data tools with reproducible controls
Data tools can assist diligence by connecting asset records, customer contracts and interval operating information. An original implementation would create a common identifier for the campus, equipment cohort, customer service and meter. Analysts could then examine whether paid demand, equipment use and energy consumption move consistently. Missing records should be visible, with coverage measured before any automated conclusion is accepted.
AI-assisted contract extraction can propose fields for human review: minimum commitments, renewal, termination, credits, assignment and upgrade responsibility. The original clause and document version should remain attached to every extracted field. An extraction model's output is an analytical aid. Commercial and legal conclusions require review by the responsible professionals. Evaluation should include omissions and misclassifications as well as correctly extracted clauses.
For engineering and financial analysis, preserve the formulas and inputs outside any language-model narrative. Run deterministic calculations for power, revenue, reserves and coverage. Compare the resulting numbers to independently reconciled financial records. A generated explanation should refer to the actual calculation version and identify assumptions. This design lets a committee reproduce the result and challenge a specific input without relying on a conversational answer.
Predictive utilisation models require historical data with consistent definitions and treatment of outages, migration and customer changes. Backtesting should use periods excluded from model fitting. Confidence intervals and failure cases belong in the decision materials. Where the historical sample is small or materially unlike the planned operation, scenario analysis can be more transparent. This paper asserts no measured improvement from deploying AI in diligence or valuation.
19 Organise the investment decision and monitoring plan
The investment committee should receive a decision record that identifies the price or debt amount requested, the evidence supporting near-term cash flow and the assumptions supporting residual or terminal value. Separate conditions that must be satisfied before funding from sensitivities accepted as investment risk. A promised technical report, unsigned customer agreement or unresolved connection condition should retain that status throughout the pack.
The model should contain a contracted case, a renewal case and a combined downside case. The contracted case uses enforceable terms and verified acceptance where available. The renewal case describes the assumptions after expiry. The downside combines price, use, energy and delay mechanisms that can occur together. Their probabilities should be left unassigned unless there is a defensible estimation method. Funding can then be linked to observed milestones rather than a blended assumption hiding unresolved conditions.
Monitoring should focus on evidence that would change the valuation. Monthly metrics include accepted capacity, collected service revenue, energy payments, available equipment, committed refresh expenditure and material contract events. Review residual assumptions when there are relevant buyer quotes, technology changes or changes in the feasible alternative use. Record whether each event affects the operating model, collateral appraisal or both.
A decision record should specify escalation responsibilities and information access. The operating team needs practical authority to resolve customer and equipment problems. The investment or credit team needs timely notice of events affecting coverage and recovery. A clear change log supports disciplined reassessment. It also reduces the temptation to preserve an acquisition valuation after the assumptions that supported it have changed.
20 Limitations and research agenda
The principal limitation is the absence of a representative dataset linking computing efficiency, customer billing and realised data-centre transaction values. Public disclosures rarely provide all relevant variables at the same asset boundary. Benchmark evidence is technically valuable yet does not measure contract enforceability, renewal negotiation or realised equipment recovery. The original framework is therefore a diligence and modelling proposal, with empirical validation still required.
Future research could compare equipment cohorts using consistent workloads, measured energy and paid service revenue. It could examine realised disposal proceeds after removal and restoration costs, distinguishing orderly transactions from enforcement. Another useful dataset would pair connection milestones with procurement dates, equipment acceptance and first collected revenue. Those records would improve understanding of the financial effect of commissioning delays without assuming a universal equipment life.
Geographic work should evaluate actual rights and obligations. Comparable datasets would need tariff structures, demand charges, curtailment terms, customer assignment, permitted density and upgrade costs. Standardising those fields could improve the interpretation of transaction prices across regions. A broad sector multiple with incomplete underlying asset information would remain difficult to use as evidence of component value.
The numerical cases simplify operations to show the mechanism clearly. They assume annual averages, constant fixed deductions and an electricity relationship tied to billable utilisation. Real operations require interval and monthly modelling, taxes, working capital, liquidity, nonlinear engineering constraints and contract-specific default analysis. The calculations support understanding of a decision boundary; they provide no investment recommendation or project valuation.
21 Conclusion
Computing efficiency changes the economics of useful work. Asset value depends on how that change reaches collected revenue, operating obligations, replacement expenditure and recoverable components. A credible data-centre valuation traces that chain using explicit definitions and evidence. It separates the campus and connection from the equipment fleet, and separates continuing operating value from alternative recovery proceeds.
The hypothetical model demonstrates a practical concern for financing. Better energy efficiency and higher utilisation can coexist with reduced debt coverage when service prices fall and fixed commitments remain. The model's threshold analysis also identifies cases in which utilisation alone cannot restore coverage within physical capacity. Those outcomes direct attention to customer terms, funding structure, fixed obligations and supported capital expenditure.
The recommended transaction process begins with component and contract diligence, reconciles booked use to collected cash, stages procurement around verified connection progress and tests renewal economics. Residual assumptions require their own evidence and a consistent recovery date. The final valuation should make the remaining uncertainty visible so investors, lenders and operators can decide which risks they accept and which conditions require resolution before committing capital.
References
- International Energy Agency (2026). Key Questions on Energy and AI, executive summary. https://www.iea.org/reports/key-questions-on-energy-and-ai/executive-summary Accessed 4 October 2026.
- MLCommons (2026). MLPerf Inference Datacenter benchmark documentation and results guidance. https://mlcommons.org/benchmarks/inference-datacenter/ Accessed 4 October 2026.
- CoreWeave, Inc. (2026). Annual report on Form 10-K for the year ended 31 December 2025, risk factors and financial-statement disclosures. https://www.sec.gov/Archives/edgar/data/1769628/000176962826000104/crwv-20251231.htm Accessed 4 October 2026.
- National Energy System Operator (2026). Connections Reform, current programme and implementation materials. https://www.neso.energy/industry-information/connections-reform Accessed 4 October 2026.
- Federal Energy Regulatory Commission (2026). Interconnection of Large Loads to the Interstate Transmission System, Docket RM26-4-000. https://www.ferc.gov/rm26-4 Accessed 4 October 2026.
- IFRS Foundation (2026). IAS 16 Property, Plant and Equipment, standard overview and supporting material. https://www.ifrs.org/issued-standards/list-of-standards/ias-16-property-plant-and-equipment/ Accessed 4 October 2026.
- IFRS Foundation (2026). IAS 36 Impairment of Assets, standard overview. https://www.ifrs.org/issued-standards/list-of-standards/ias-36-impairment-of-assets/ Accessed 4 October 2026.
- IFRS Foundation (2026). IFRS 13 Fair Value Measurement, standard overview. https://www.ifrs.org/issued-standards/list-of-standards/ifrs-13-fair-value-measurement/ Accessed 4 October 2026.
- IFRS Interpretations Committee (2026). IFRIC Update September 2026, estimating residual value discussion. https://www.ifrs.org/news-and-events/updates/ifric/2026/ifric-update-september-2026/ Accessed 4 October 2026.
- European Commission (2026). Energy performance of data centres, reporting and policy-development status. https://energy.ec.europa.eu/topics/energy-efficiency/energy-efficiency-targets-directive-and-rules/energy-efficiency-directive/energy-performance-data-centres_en Accessed 4 October 2026.
About the Author
Chennakeshav (CK) is a corporate finance and investment banking executive with 25+ years of global experience in deal origination, structuring and execution across M&A, growth capital and corporate strategy. He has led value-creation mandates for founders, corporates and funds, bridging the boardroom view to hands-on execution and close.
His career spans Morgan Stanley, HSBC, Lloyds Banking Group, EWEC, ADQ portfolio companies and Emirates Growth Fund, across TMT, real estate, fintech, deeptech, cleantech, infrastructure and energy. He has partnered with C-suite leaders, private equity and venture funds, sovereign wealth funds and family offices to finance complex fund raises and scale-up ventures, and has led M&A due diligence, post-merger integration and business-transformation initiatives to create value.
At Matchpoint Partners he is Managing Partner, leading the firm's corporate finance, M&A and capital-raising practice. He holds an MBA from London Business School, an engineering degree from VTU and a Master of Laws (LLM, in progress) from UCL London.
An active start-up mentor, CK mentors at Techstars, DIFC FinTech Hive, Startup Grind, Founder Institute and IN5, serves as Entrepreneur Mentor in Residence (EMiR) at London Business School, and judges the Entrepreneurship World Cup.
