

1. Define the credit question before applying an AI label
The relevant question is whether the borrower can meet interest, amortisation, maturity and other fixed obligations through a range of plausible operating conditions. An AI label does not answer that question. The committee needs to understand how technology change affects revenue durability, gross margin, operating expenditure, capital needs, liquidity and recovery.
The analysis should identify the facility, legal borrowers, guarantors, ranking, security, requested term, currency, amortisation, purpose and exit. It should then map each material AI exposure to a cash-flow line, balance-sheet item, contract, customer behaviour or execution dependency. Exposure that cannot be connected to a financial mechanism should remain a question rather than become a scoring adjustment.
Timing matters. Revenue displacement can appear first in pipeline conversion, discounting, seat contraction or product mix before reported revenue declines. Compute obligations can begin before products monetise. A credit case should align evidence dates, contract start dates, renewal windows and debt-service dates so that apparent growth does not conceal an approaching liquidity trough.
The committee should state the decision it is making and the uncertainty it accepts. Approval, sizing, pricing, covenant design and monitoring may use different evidence thresholds. A conservative structure cannot compensate for a borrower whose revenue and obligations remain insufficiently understood.
2. Define the AI-exposed borrower
An AI-exposed borrower earns revenue, incurs cost, holds assets or depends on counterparties whose economics may change materially through artificial intelligence. This includes software vendors, data and workflow businesses, compute providers, technology-enabled services, content firms and conventional companies making large AI commitments. Exposure can be direct, embedded or second order.
Direct exposure arises when AI is the product or a material feature. Embedded exposure arises when AI changes delivery cost, product usefulness or customer workflow. Second-order exposure arises through suppliers, customers, platforms, regulation, energy, data rights or labour. The same borrower can benefit in one layer and face pressure in another.
The perimeter should include subsidiaries, unconsolidated vehicles and contractual arrangements that support compute, data or distribution. A special-purpose entity holding equipment or a long-term cloud reservation can carry economic obligations relevant to the operating borrower even when legal recourse differs. Credit documentation and legal review determine the actual claim path.
The classification should be refreshed as products, contracts and customer behaviour change. A company that began as a conventional subscription business may become compute intensive after launching agentic features. A model provider may reduce training expenditure while inference obligations rise with adoption. Static industry labels can therefore become stale quickly.
3. Separate six channels of exposure
The framework uses six channels: product substitution, customer adoption, monetisation and pricing, delivery cost, concentration and contractual commitments. Each channel has distinct evidence, timing and mitigants. Combining them into one risk score can hide offsets and correlations.
Product substitution asks whether customers can replace the borrower's product or material features. Adoption asks whether the borrower can deploy useful AI safely and reliably. Monetisation asks whether usage produces paid revenue, protects renewal or merely increases cost. Delivery cost covers models, cloud, accelerators, data, engineering and support. Concentration covers customers, models, clouds, chips and routes to market. Commitments cover minimum spend, reserved capacity, leases, purchases, power and guarantees.
The channels interact. Faster adoption may improve retention while increasing inference cost. A strategic cloud partnership may accelerate distribution while creating dependency and minimum spend. A multi-year customer contract may support financing while concentrating revenue and imposing service-level or capacity obligations.
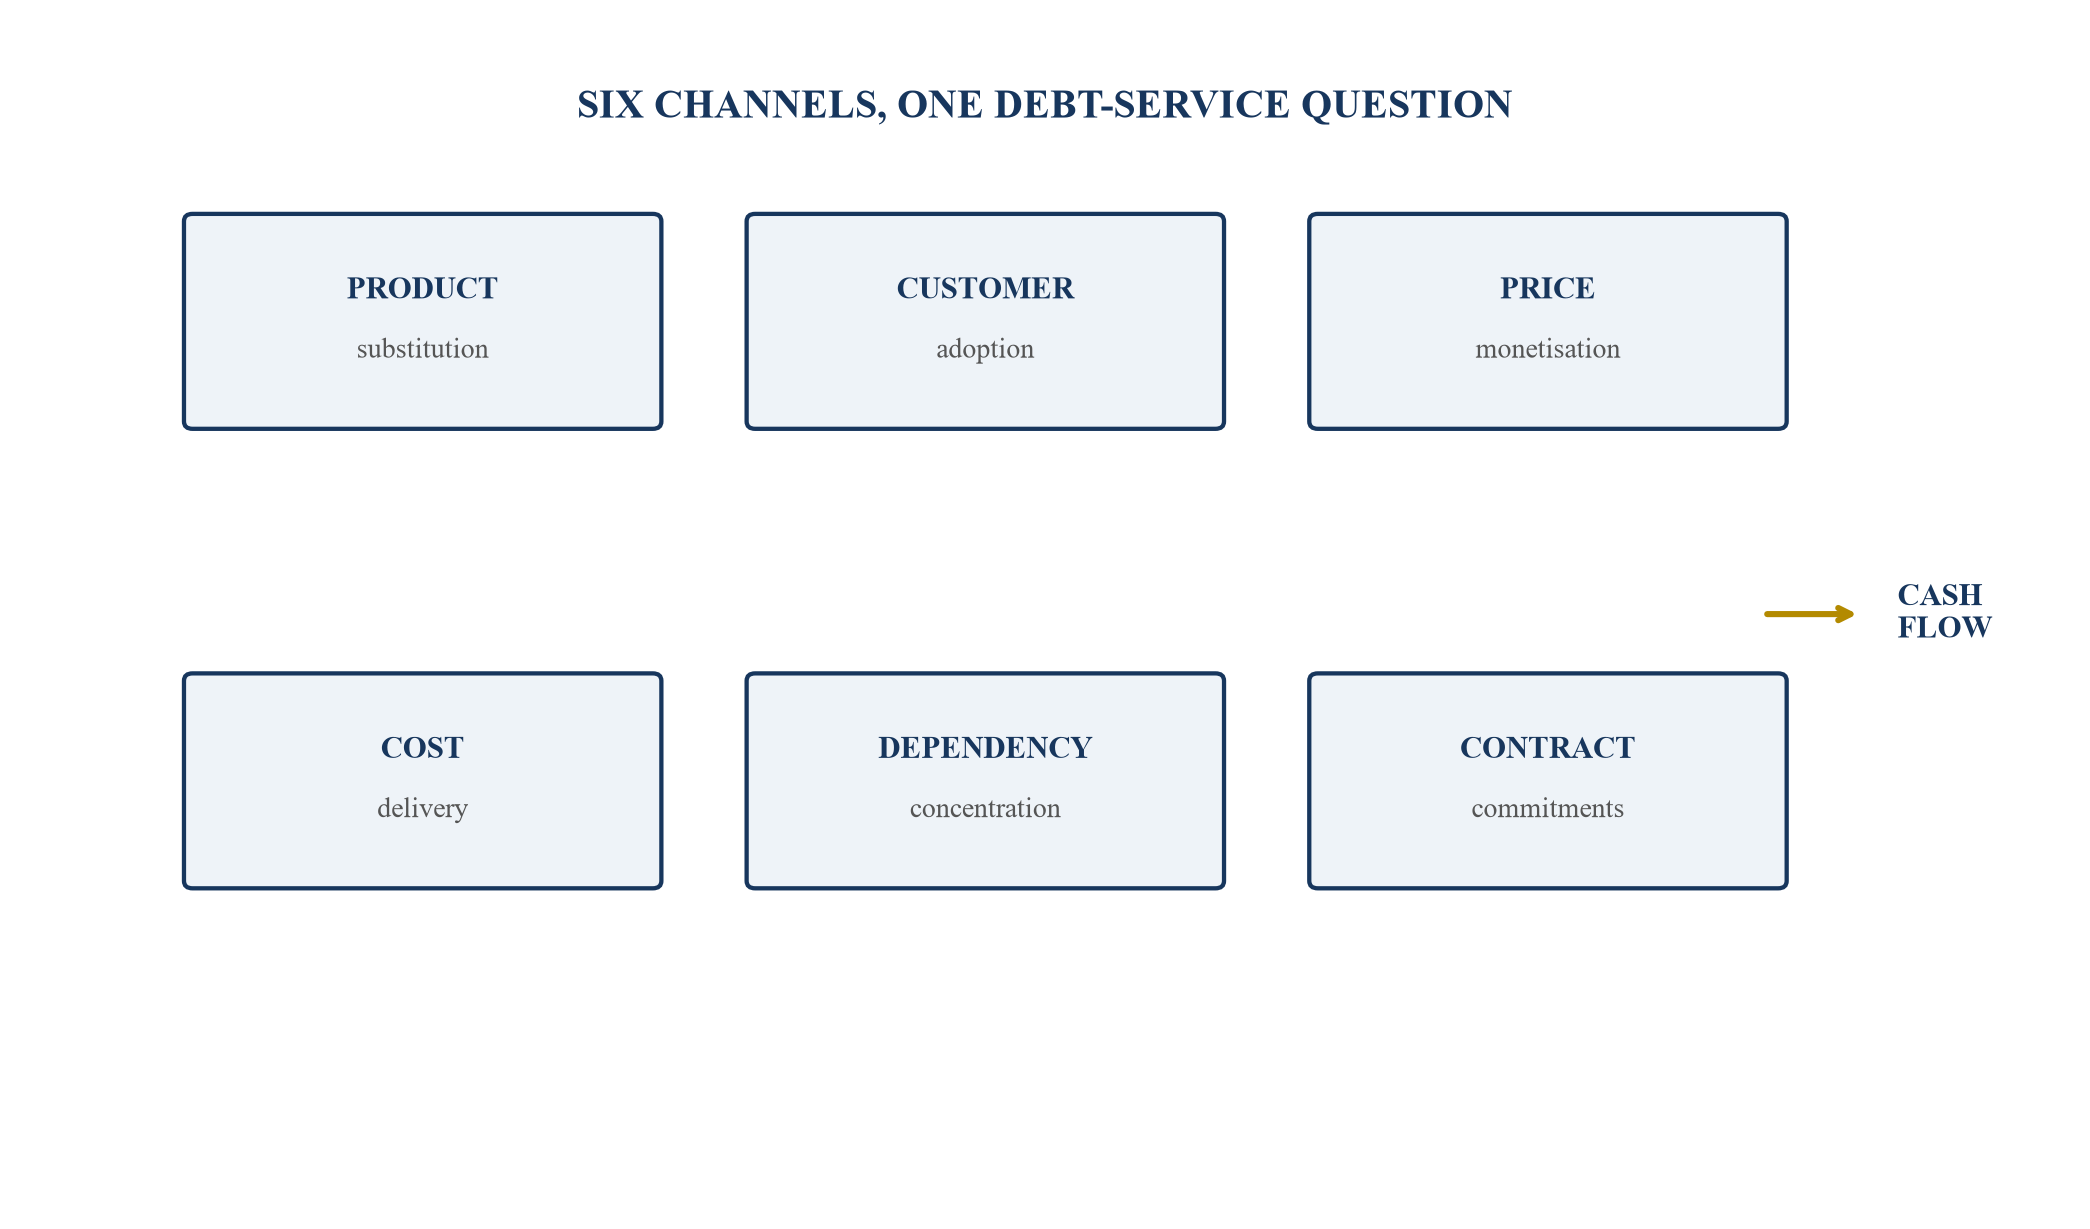
Each exposure channel should connect to evidence, cash flow, timing and a defined credit response.
Table 1. AI-exposure evidence matrix
| Channel | Core evidence | Downside mechanism | Credit response |
|---|---|---|---|
| product | feature map, usage, alternatives | substitution or commoditisation | cohort stress and product milestones |
| customer | adoption, renewal, workflow data | slower conversion or contraction | liquidity and retention triggers |
| pricing | price, discount, mix, unit economics | lower revenue or gross margin | margin floor and downside sizing |
| cost | model, cloud, data, talent spend | fixed or rising delivery cost | commitment schedule and reserves |
| concentration | customer, cloud, chip, platform | correlated interruption or bargaining power | limits, diversification and contingency |
| contract | minimums, leases, purchases, guarantees | fixed claims before or after revenue | fixed-charge tests and consent rights |
The table is a diligence structure; actual materiality depends on the borrower and transaction.
4. Distinguish substitution from augmentation
Substitution occurs when a customer can remove the product, reduce paid scope or replace a material workflow with an alternative. Augmentation occurs when AI increases the value, usage or efficiency of the existing product. A borrower may experience both across modules and customer segments.
Evidence should be product specific. Management demonstrations, model benchmarks and feature announcements do not establish renewal behaviour. The lender should examine usage, customer interviews where authorised, win-loss evidence, seat and transaction trends, time to value, product migration and willingness to pay. The analysis should distinguish paid adoption from free trial or bundled usage.
Substitution risk can emerge through partial unbundling. A customer may retain the system of record while reducing adjacent analytics, content, support or workflow modules. Reported logo retention can remain stable while contract value contracts. The credit model should therefore test product and revenue components within accounts.
Augmentation can support debt capacity when it creates repeatable cash benefit, defensible workflow integration and monetisation. The case should identify who receives the benefit, how it is priced and whether competitors can reproduce it. Expected productivity without observed commercial evidence should remain a scenario.
5. Build the product replacement map
The replacement map decomposes the product into jobs performed, decision rights, proprietary data, workflow position, integration depth, regulatory requirements and switching cost. It identifies which components a model, agent, cloud platform, customer-built tool or competitor could replace.
Features that generate text, summarise information or provide generic assistance may face different pressure from systems that hold authoritative records, execute regulated controls or integrate deeply with operations. The map should avoid broad claims about defensibility and show the evidence for each job.
Replacement can change the commercial unit. A seat-priced tool may face declining seats while transaction or outcome pricing grows. An agent may reduce human users while increasing automated calls. Debt analysis should test the path between old and new units, including billing systems, customer approvals and gross-margin effects.
The map also identifies reinvestment needs. Defending a product may require model access, proprietary data, engineering, security, evaluation and go-to-market expenditure. A successful response can therefore reduce free cash flow before supporting renewal or growth. The lender should size the funding runway through this transition.
6. Reconcile recurring revenue to contracts and cash
Annual recurring revenue is commonly used to describe the annualised value of subscription or contracted activity. Definitions vary. The lender should reconcile management's measure to executed contracts, invoicing, revenue recognition, cash receipts, deferred revenue and remaining performance obligations where reported.
The bridge should separate new sales, expansion, contraction, churn, price, usage, currency, acquisitions and product migration. It should identify whether consumption estimates or cancellable arrangements enter the measure. A current run-rate can overstate cash available for debt service when billing is delayed, implementation conditions remain open or customers can reduce usage.
Contracted backlog also needs timing and enforceability analysis. Performance obligations, acceptance, service levels, termination rights, credits, ramp schedules and customer dependencies can affect conversion. A large nominal contract does not necessarily create equivalent near-term cash flow.
Credit conclusions should use consistent definitions across historical periods and forecasts. Changes in methodology, customer segmentation or product packaging should be restated where practical. Reconciliation differences should have named owners and treatment in the base and downside cases.
7. Test renewal and expansion by cohort
Cohort analysis groups customers by start date, product, size, industry, geography, channel or risk characteristic and follows recurring value through time. It can reveal whether aggregate growth depends on recent bookings while older cohorts contract.
The lender should examine gross retention, net retention, logo retention, price, usage, seat or transaction volume, product migration and cash collection. Each metric answers a different question. Net retention above one hundred per cent can coexist with material churn when expansion among surviving accounts offsets losses.
AI exposure may differ across cohorts. Customers using the borrower's AI features may renew better, incur higher service cost or receive promotional pricing. Legacy customers may resist migration. Large enterprises may adopt slowly but provide longer contracts; smaller customers may move faster and churn faster.
The stress should apply different changes to renewal, contraction, expansion and new sales rather than impose one percentage reduction on total revenue. It should also reflect the timing of renewal windows. A borrower with annual contracts concentrated in one quarter can face a sharper liquidity event than annual averages imply.
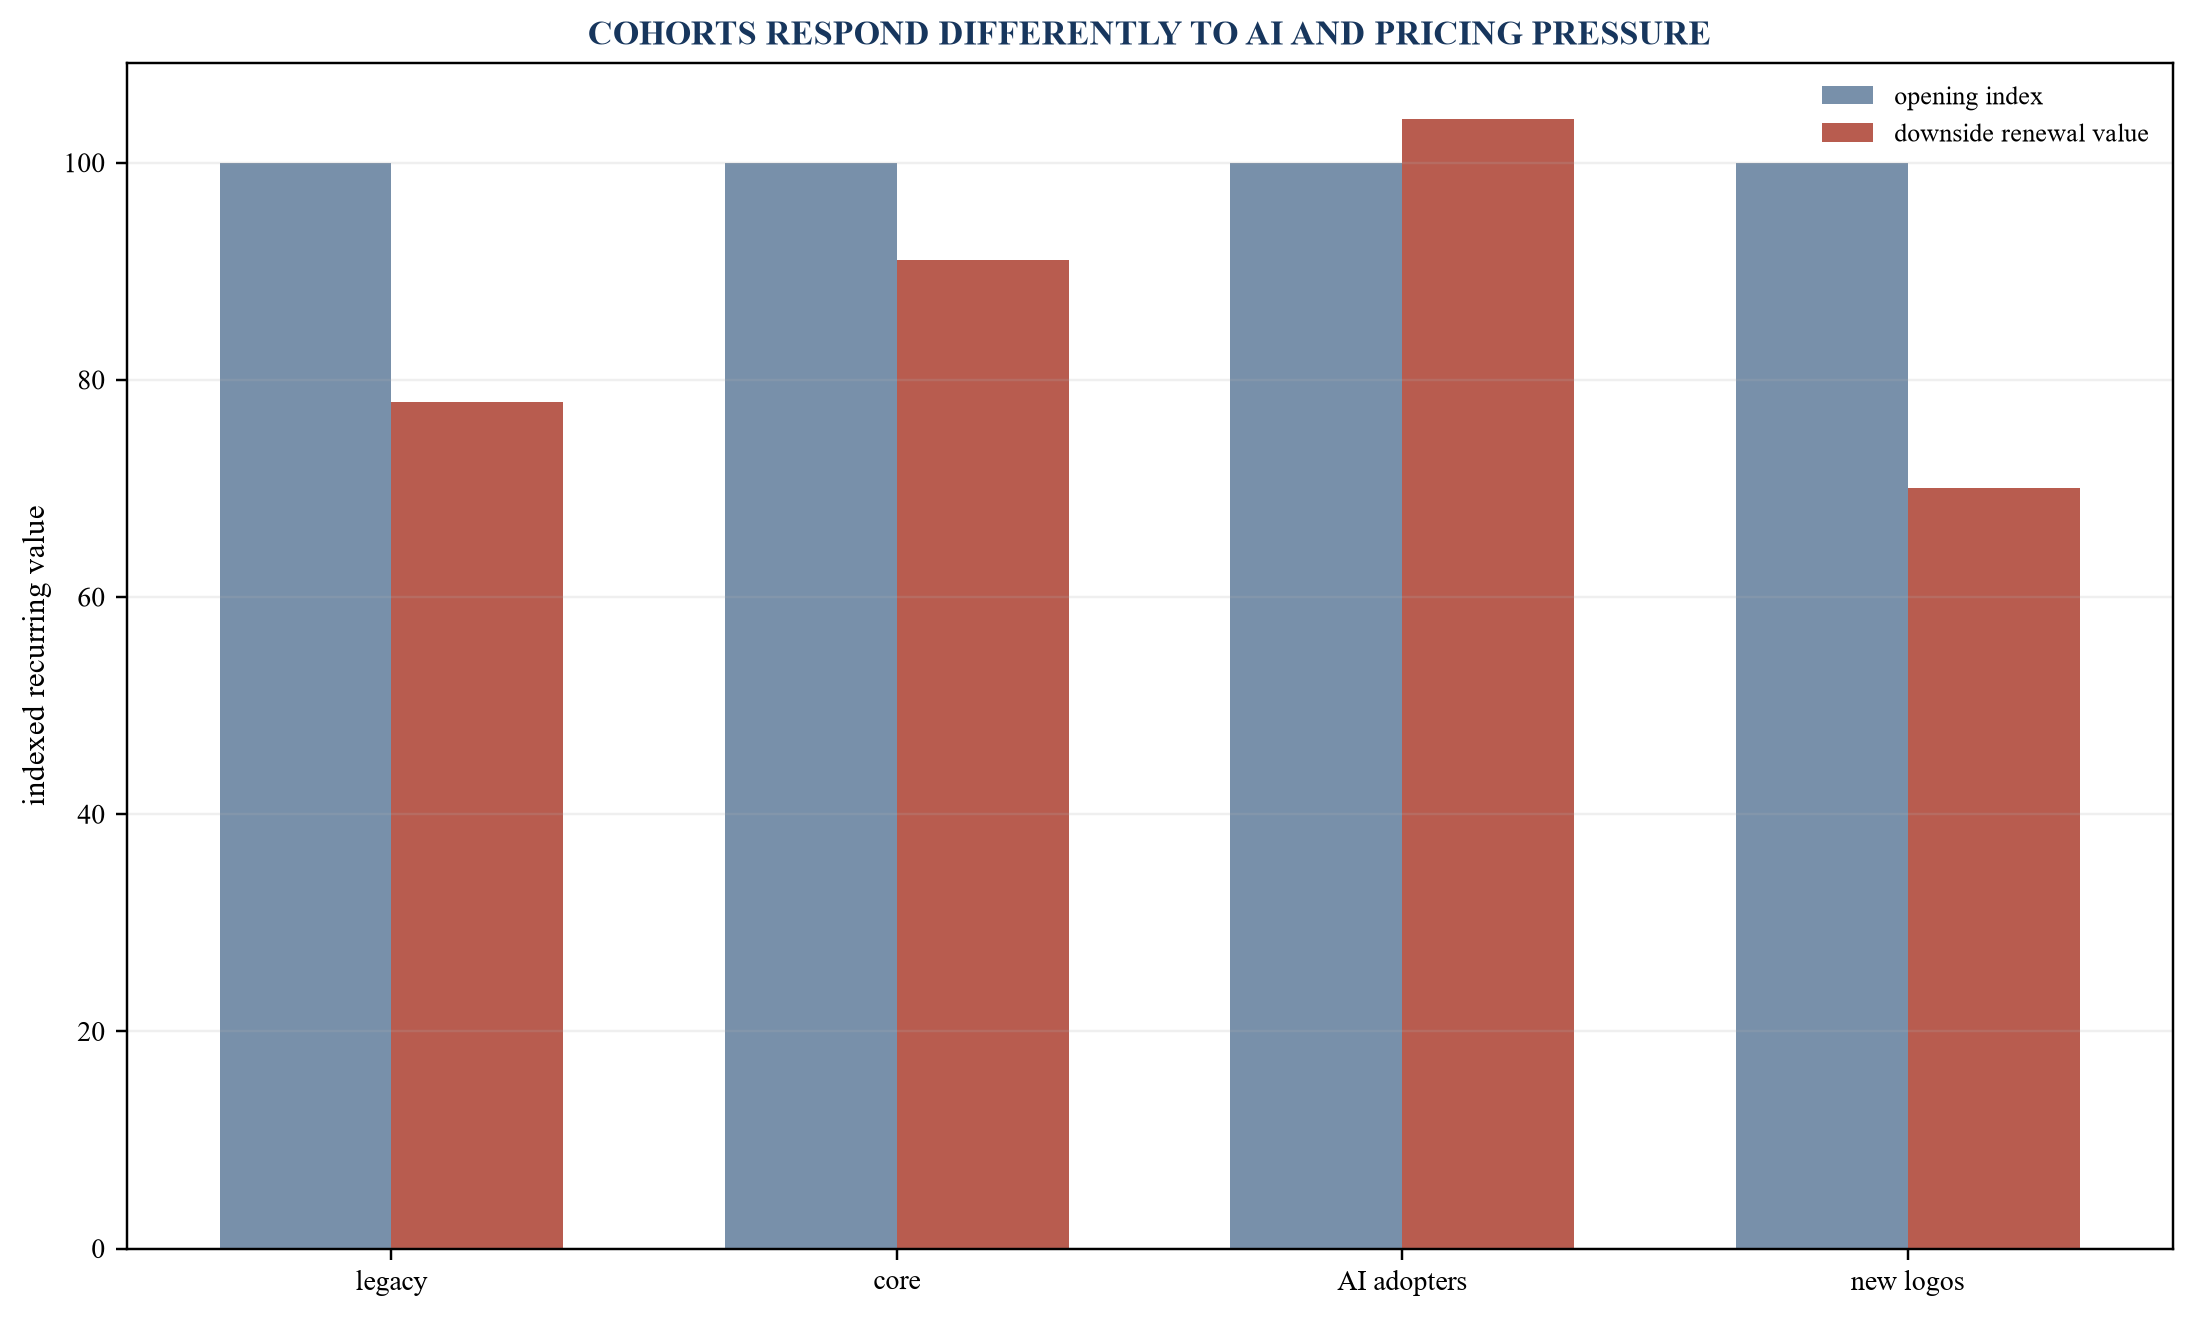
Indexed values are hypothetical assumptions and do not represent an observed borrower.
Table 2. Illustrative revenue-cohort stress
| Cohort | Opening value | Renewal | Contraction | Expansion | Downside ending value |
|---|---|---|---|---|---|
| legacy product | 30 | 88% | 12% | 2% | 23.4 |
| core workflow | 35 | 94% | 5% | 4% | 32.6 |
| AI adopters | 20 | 96% | 3% | 11% | 20.8 |
| new logos | 15 | 82% | 10% | 0% | 11.1 |
| total | 100 | mixed | mixed | mixed | 87.9 |
Values are hypothetical assumptions for framework demonstration.
8. Test new sales and pipeline conversion
New sales can weaken before renewals because buyers delay decisions, run pilots, consolidate vendors or wait for product roadmaps. The lender should analyse qualified pipeline, stage definitions, conversion, sales-cycle duration, average contract value, discounting and implementation conditions.
Pipeline coverage is meaningful only when definitions and historical conversion are stable. Management may reclassify opportunities or include larger early-stage transactions during periods of pressure. Credit analysis should reconcile opening pipeline to wins, losses, slips and scope changes by cohort.
AI can create unusually large contracts that require capacity, custom development or customer acceptance. The committee should test whether the borrower funds delivery before receiving cash and whether a delayed start produces committed cost without revenue. Sales concentration can also increase forecast volatility.
The downside case should reduce both volume and timing. A transaction delayed by two quarters can create a more severe liquidity effect than a permanent small reduction spread evenly across the year. Debt sizing should reflect the minimum cash point, not only full-year EBITDA.
9. Analyse pricing and packaging transitions
AI can shift software pricing from seats toward usage, credits, transactions, outcomes or hybrid structures. The transition changes revenue visibility, customer incentives, billing, gross margin and working capital. The lender should understand the unit sold and the mechanism that protects or exposes value.
Bundled AI can defend renewal while obscuring monetisation. Separate charges can improve unit economics but slow adoption. Usage pricing can align value and cost while increasing volatility. Outcome pricing can support premium economics when outcomes are measurable and attributable, but disputes and long collection cycles may arise.
The model should bridge old and new packages by customer cohort. It should show effective price, consumption, discounts, overages, minimums and unused credits. Reported list prices are insufficient when negotiated enterprise terms determine cash flow.
Downside analysis should test lower price, lower usage and higher delivery cost together where competitive pressure can affect all three. A price cut that stimulates volume may still weaken debt capacity if inference and support cost rise faster than contribution margin.
10. Measure gross margin after AI delivery cost
Gross margin should include the direct cost of models, cloud, accelerators, data services, customer-specific environments, support and other resources required to deliver the contracted service. Classification may vary by accounting policy; credit analysis should reconstruct economic contribution consistently.
Average margin can conceal expensive customers or features. The lender should examine margin by product, customer tier, workload and contract. Minimum commitments, reserved capacity and burst usage can create different cost profiles. Internal development and capitalised costs may also affect reported metrics without changing cash expenditure.
Unit economics should use operational drivers such as tokens, queries, accelerator hours, storage, retrieval, transactions or successful tasks where relevant. The analysis should show how caching, model routing, smaller models, hardware efficiency and contract negotiation affect cost.
Forecast cost reductions should have evidence and sensitivity. Technology cost can decline while usage intensity, reliability requirements or premium-model mix rise. The credit case should avoid assuming that headline compute-price reductions automatically translate into borrower margin expansion.
11. Inventory compute and infrastructure commitments
The obligation inventory should cover cloud minimum spend, reserved instances, dedicated capacity, accelerator purchases, equipment leases, data-centre leases, colocation, power, networking, model licences, data contracts, guarantees and termination charges. It should include commitments that have not commenced.
For each contract, record legal entity, provider, currency, start, expiry, minimum, variable component, escalation, cancellation, assignment, security, prepayment, service level and remedies. Contract summaries should be tied to executed documents and qualified interpretation.
The inventory should distinguish capacity that can support third-party revenue, internal research or only a specific product. Fungibility affects downside mitigation and recovery. A commitment that can be resold or redirected under contract differs from one locked to a customer, location or hardware generation.
Consolidated financial statements may not present all economic commitments in one line. Credit diligence should reconcile leases, purchase obligations, cloud arrangements, guarantees, capital expenditure and management schedules. Unreconciled amounts should reduce confidence and may require conservative treatment.
12. Convert commitments into a fixed-claim schedule
The fixed-claim schedule places cash obligations by month or quarter alongside debt service, payroll, tax, working capital and committed capital expenditure. It distinguishes unconditional minimums from forecast usage and separates prepaid amounts from future cash requirements.
Some contracts allow rescheduling, reduction or termination subject to conditions or fees. The model should present the enforceable base obligation, management's expected use and the downside cash cost. Legal interpretation determines which rights are available and whether consent is required.
Capacity commitments may create a mismatch when revenue starts after delivery, commissioning or customer acceptance. The schedule should capture deposits, progress payments, ramp periods, acceptance dates and revenue commencement. A delayed customer can leave the borrower financing capacity without matching receipts.
The committee should examine maturity concentration. A borrower may appear liquid annually while several compute, lease and debt payments fall in the same quarter. Minimum liquidity and reserve design should address the cash calendar.
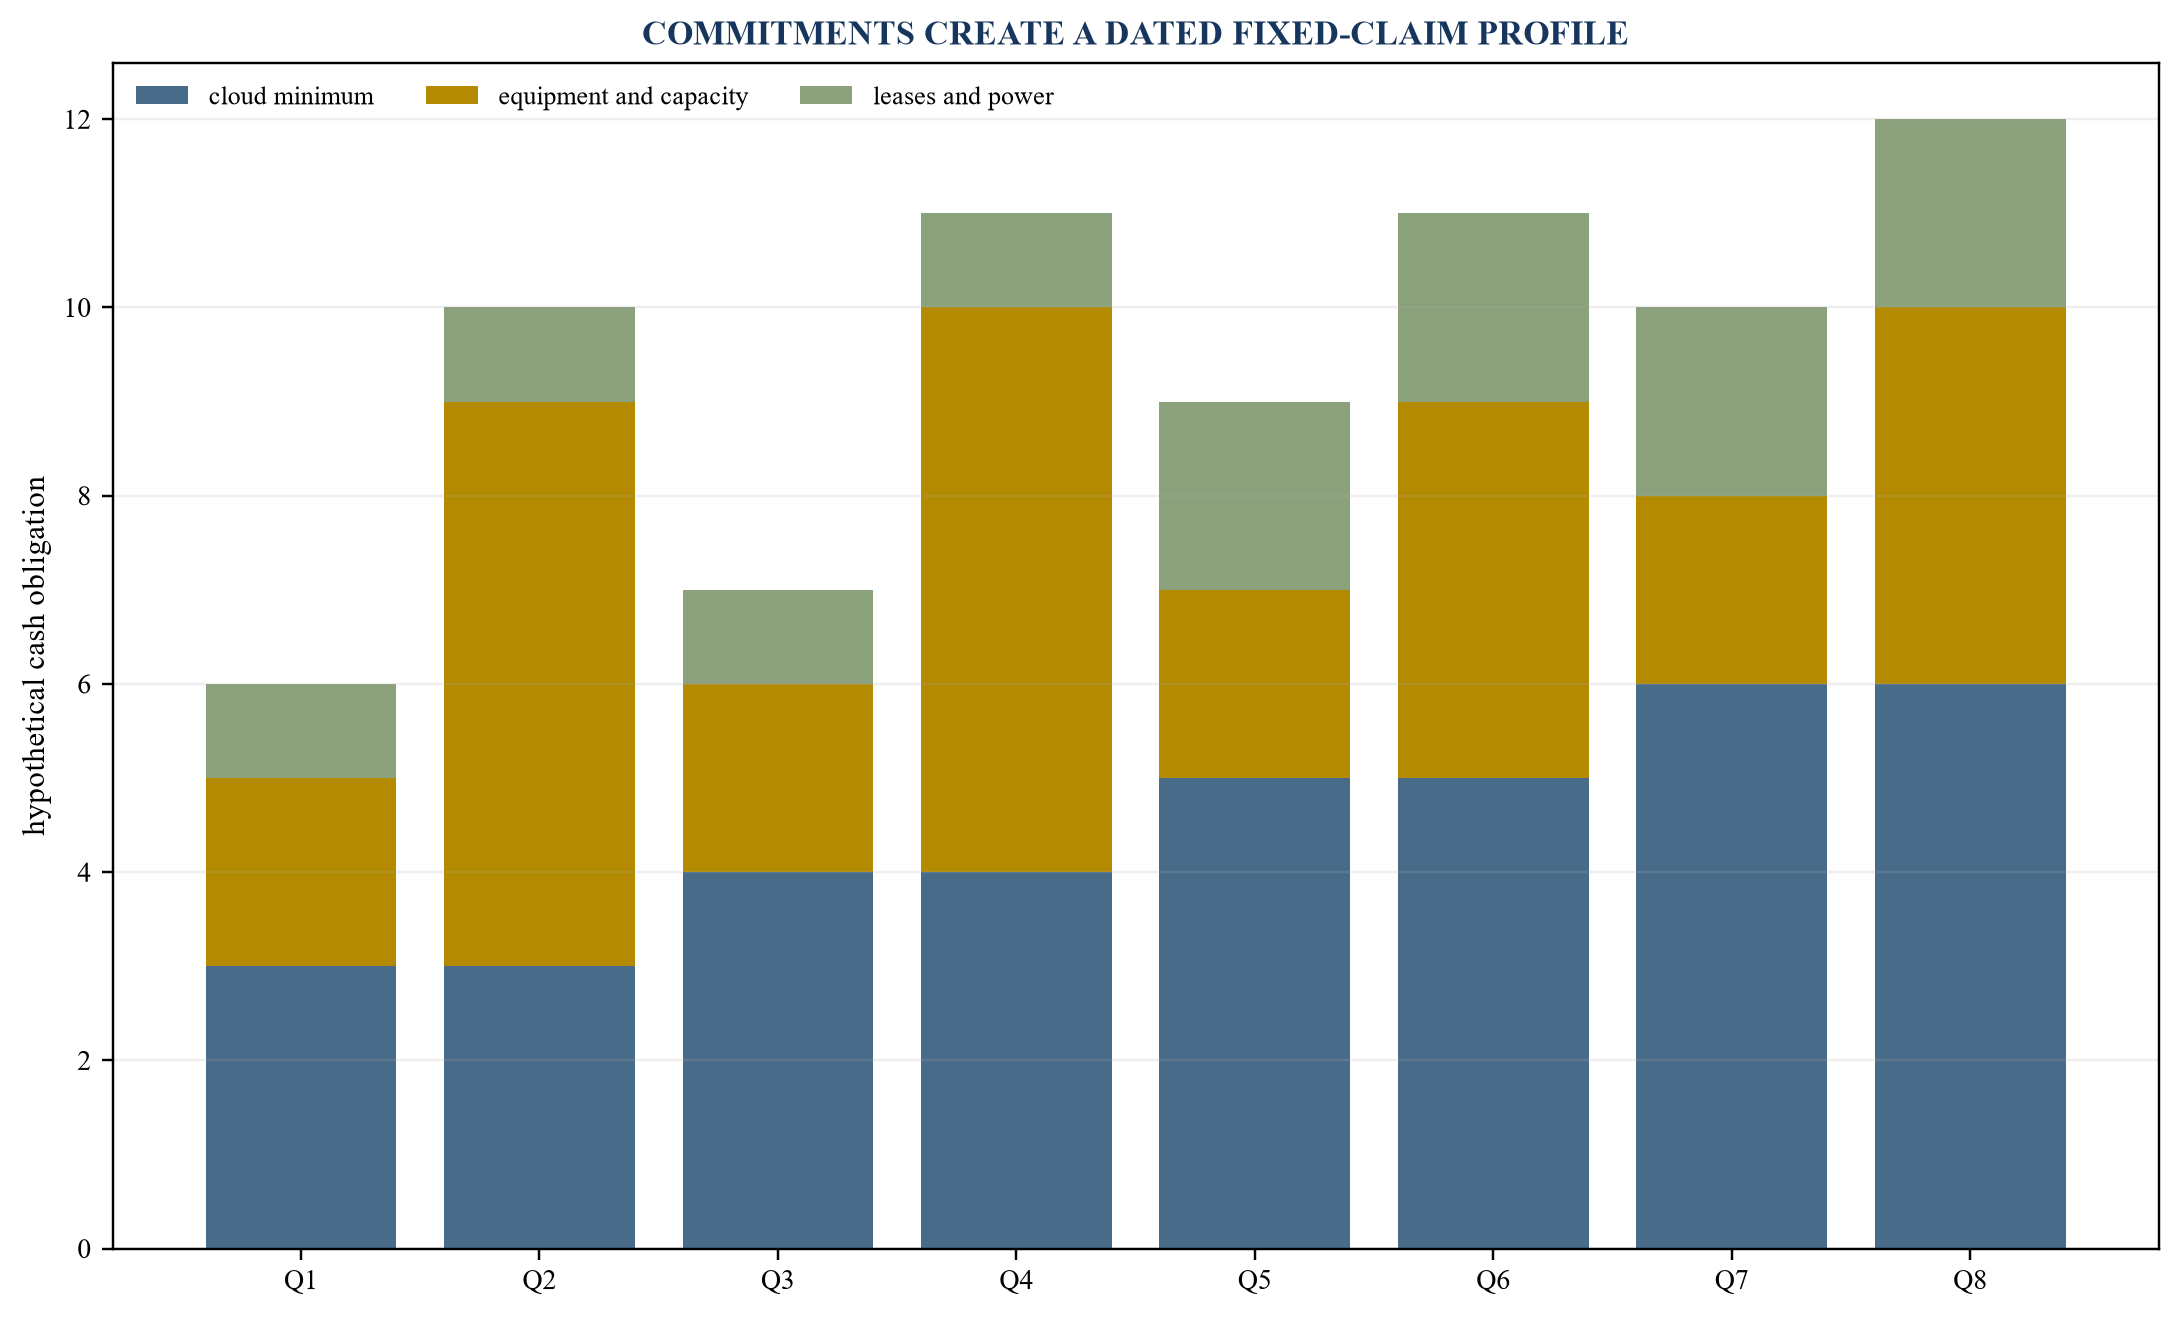
Quarterly amounts are hypothetical assumptions; contract enforceability requires document review.
Table 3. Compute-commitment diligence schedule
| Obligation | Evidence | Cash characteristic | Downside treatment |
|---|---|---|---|
| cloud minimum | executed agreement and invoices | periodic minimum plus usage | fixed claim unless reduction right is verified |
| reserved capacity | reservation, deployment and acceptance | deposit and scheduled payments | test delay, resale and termination |
| accelerators | purchase, lease or financing | upfront or amortising | test value, obsolescence and security |
| data centre | lease, colocation, power and network | long-dated fixed and indexed | include ramp, restoration and exit cost |
| model and data | licence and usage contracts | minimum, tiered or variable | stress price, access and portability |
| guarantee | guarantee and supported contract | contingent claim | model trigger, cap and claim path |
The schedule separates legal obligation, expected use and downside response.
13. Test utilisation and capacity mismatch
Utilisation measures whether committed resources produce revenue or required capability. The lender should define capacity in operational units and reconcile purchased, available, allocated, billable and collected usage. Different resources can create bottlenecks, so one aggregate utilisation percentage may mislead.
The analysis should examine idle capacity, customer reservations, internal workloads, maintenance, service levels and geographic constraints. High booked capacity can still generate weak cash if commissioning, acceptance or billing lags. Low utilisation may be strategic during ramp, but the liquidity cost remains real.
Downside cases should test slower customer onboarding, lower usage, provider interruption and capacity that cannot be redeployed. Management's ability to sell excess capacity requires contractual rights, technical compatibility, sales capability and market demand. Each should have evidence.
The credit response may include funded reserves, staged drawdown, customer prepayments, provider consents, minimum contracted coverage or restrictions on new commitments. Controls should focus on the mismatch that threatens debt service rather than on utilisation as an isolated operational target.
14. Assess provider, model and hardware concentration
AI delivery can depend on a small number of cloud providers, accelerator vendors, model providers, data sources or specialist contractors. Concentration affects bargaining power, continuity, pricing, security, portability and recovery.
The map should show spend, workloads, contract duration, technical dependency, substitution time and exit cost by provider. A nominal multi-cloud architecture may rely on one environment for material production workloads. Portability claims should be tested through documentation, deployment evidence and realistic migration plans.
Concentration can correlate with customer risk. A borrower may serve customers through the same platform that supplies its models or compute. Commercial, technical or regulatory change at that platform can therefore affect both revenue and cost.
Credit structure can require notification of material provider changes, limits on incremental commitments, contingency testing and access to critical contracts. Security over equipment or accounts may have limited value if operation depends on licences, data or provider access that cannot transfer.
15. Build an economic cash-flow bridge
The cash-flow bridge begins with collected customer cash and deducts delivery cost, payroll, sales expenditure, capital expenditure, working capital, taxes, compute minimums, leases and other fixed claims before debt service. It should reconcile to reported financial statements and management forecasts.
Adjusted EBITDA may exclude costs that remain necessary for product competitiveness or delivery. Credit analysis should examine capitalised development, restructuring, stock compensation, one-time model migration, customer acquisition and infrastructure ramp. Treatment should follow economic recurrence and cash consequence.
The bridge should separate maintenance from growth investment while recognising uncertainty. Reducing research, model access or customer success may preserve near-term cash and damage renewal or product relevance. The downside case should avoid assuming that all discretionary expenditure can be removed without revenue effect.
Monthly liquidity matters during transitions. The model should show opening cash, receipts, obligations, revolver availability, covenant headroom and minimum cash. It should identify the first period in which management action or lender intervention is required.
16. Model revenue displacement by mechanism
Revenue displacement can arise through churn, contraction, lower price, lower usage, slower new sales, delayed implementation, product cannibalisation or customer insourcing. Each mechanism has different leading indicators and recovery prospects.
The model should avoid applying a single haircut without explaining the path. Churn removes future contract value after renewal. Contraction reduces scope within continuing accounts. Price pressure affects both new and renewed business. Usage decline may affect consumption revenue immediately. Implementation delay shifts recognition and cash.
Mechanism-based modelling enables operational responses. Product migration may mitigate feature displacement; contract redesign may protect price; customer success may reduce contraction; cost routing may defend margin. The lender can then evaluate timing, cost and evidence for each action.
Correlations should be explicit. A competitive shock may lower price, increase sales cost and accelerate product investment simultaneously. A broad stress that combines these effects can be more credible than independent sensitivities that assume other variables remain unchanged.
17. Create product and customer stress cohorts
Stress cohorts should reflect exposure rather than convenient reporting segments. Relevant groups may include legacy products, AI-enhanced products, regulated workflows, discretionary tools, small customers, strategic enterprises, high-cost workloads and customers near renewal.
For each cohort, estimate opening recurring value, renewal timing, contraction, expansion, price, usage, gross margin, collection and concentration. The lender should preserve the bridge from customer-level data to cohort output and total forecast.
Cohorts allow differentiated evidence. Regulated customers may have higher switching cost and longer approvals. Small customers may adopt alternatives faster. AI-enhanced cohorts may grow while carrying higher inference cost. Results should be interpreted within contract and product context.
The committee should receive both aggregate and tail views. A stable portfolio average can conceal a material cohort near a renewal cliff. Exposure amount, decision count and timing help determine whether a small cohort is credit material.
18. Interpret backlog, bookings and remaining obligations carefully
Backlog, bookings and remaining performance obligations can provide evidence on contracted demand. Their definitions, cancellation rights, timing, acceptance and conversion differ. Credit analysis should reconcile the measures to contracts, revenue and cash.
Large multi-year arrangements may contain variable consideration, customer options, ramp schedules or renegotiation risk. A committed customer can still delay deployment or dispute service. The lender should identify conditions required before billing and revenue recognition.
Backlog concentration should be shown by customer, product, start date and capacity dependency. A contract that supports project financing or GPU debt requires scrutiny of counterparty credit, prepayments, termination, performance obligations and remedies.
The downside model should not recognise backlog conversion automatically. It should apply evidence-based timing, cancellation, acceptance and collection assumptions. Differences between management, accounting and credit definitions should remain visible.
19. Test customer concentration and correlated exposure
Customer concentration affects revenue volatility, bargaining power, working capital and recovery. The analysis should show revenue, recurring value, backlog, receivables, margin, renewal timing and infrastructure allocated to each material customer.
AI businesses may have a small number of hyperscaler, model-lab or enterprise customers under large contracts. The contract can support financing while creating dependency. A customer default, delay or capacity reduction may leave specialised assets and fixed obligations.
Correlated exposure can arise when customers depend on the same funding market, model ecosystem or end demand. Diversified names do not eliminate common risk. The lender should test clusters by sector, platform, use case and capital source.
Mitigants can include prepayments, deposits, termination payments, diversified capacity, creditworthy guarantees, milestone billing and staged financing. Their value depends on enforceability, amount, timing and claim ranking.
20. Examine data rights, intellectual property and regulatory constraints
AI product value can depend on rights to training data, customer data, model outputs, software, licences and third-party components. A dispute, restriction or licence change can affect product operation, cost or transferability.
Diligence should identify ownership, permitted use, confidentiality, retention, localisation, indemnity, audit, deletion and termination. Customer contracts may limit model training or require specific environments. Open-source components and third-party models can carry obligations that need qualified review.
Regulation and customer policy can alter adoption timing and cost. The lender should distinguish enacted requirements, applicable obligations, management plans and broader uncertainty. Compliance expenditure should enter cash forecasts when supported; unsourced estimates should remain scenarios.
Recovery analysis should ask which rights and systems can transfer in enforcement. Proprietary code without data rights, model access, specialist staff or customer consent may have limited standalone value. Legal and technical diligence should inform collateral assumptions.
21. Distinguish operating expenditure from durable investment
AI expenditure can support current service delivery, product development, infrastructure capacity or a future strategic option. Accounting classification does not by itself determine credit treatment. The lender should identify cash timing, contractual commitment, useful life, substitutability and the consequence of stopping expenditure.
Capitalised development can improve reported earnings while consuming cash. Expense treatment can reduce EBITDA while reflecting investment with future value. Credit analysis should reconcile both to cash flow and assess whether the expenditure is required to maintain competitiveness, fulfil contracts or generate incremental revenue.
The forecast should separate baseline delivery, maintenance, committed expansion and discretionary experiments. Management should identify decision gates and shutdown rights. A programme described as discretionary may become difficult to stop after customer commitments, hiring or provider contracts are signed.
Debt structure can respond through capex limits, permitted investment baskets, reporting and consent for material new commitments. Controls should allow economically sound adaptation while preventing a borrower from creating fixed claims beyond liquidity and contracted demand.
22. Assess working capital and billing mechanics
AI-related contracts can produce unusual working-capital patterns. The borrower may prepay cloud capacity or equipment, fund implementation, receive customer deposits, bill by milestones or wait for acceptance. Revenue growth can therefore consume or release cash differently across contracts.
The lender should bridge bookings to invoices, receivables and collection. It should identify billing frequency, payment terms, disputes, credits, service levels and concentration. Receivables from strong customers can still be delayed by procurement, acceptance or integration.
Customer prepayments can reduce funding need and create performance obligations. The model should avoid treating all deferred revenue as free liquidity when delivery cost remains. Deposits may also be refundable under defined conditions.
The downside case should test slower billing, delayed acceptance, higher credits and provider payments that remain on schedule. A borrowing base or liquidity covenant can use eligible receivables and cash, but definitions should address concentration, disputes, ageing and contract dependencies.
23. Determine sustainable fixed-charge capacity
Fixed-charge capacity measures cash available after required operating and investment expenditure against interest, amortisation, leases, compute minimums and other unavoidable claims. The measure should be defined consistently and reconciled to the cash-flow bridge.
The denominator should include obligations that behave as fixed in the relevant stress, even when accounting presentation differs. A cancellable cloud contract may have a termination charge rather than a full minimum. A lease may be essential to service delivery. Qualified document review determines treatment.
The numerator should avoid unsupported add-backs and growth assumptions. It should reflect collections, gross margin, maintenance investment, working capital and taxes. Where product investment is necessary to preserve revenue, a realistic amount should remain in the downside case.
Coverage should be tested through the minimum liquidity period and maturity, not only on a last-twelve-month basis. A borrower can report acceptable annual coverage while failing during a capacity ramp or renewal concentration.
24. Size leverage to downside cash flow
Leverage should be sized to sustainable cash generation, volatility, asset recovery, structure and exit rather than to a technology label or headline growth. The lender should use multiple measures where reported EBITDA, annual recurring revenue and cash flow diverge.
The base case should already include execution risk. Downside cases should test displacement, pricing, compute, customer concentration and delay. Severe but plausible combinations help identify whether debt can amortise, refinance or be repaid through recoveries.
An ARR multiple can provide market context but should not replace debt-service analysis. Recurring value can contract, carry negative margin or require reinvestment. Enterprise value is also volatile and subordinate to the lender's claim.
The committee should show gross and net leverage, fixed-charge coverage, minimum liquidity, cumulative cash generation and maturity repayment under each case. It should identify which variables drive failure and whether structural protections act early enough.
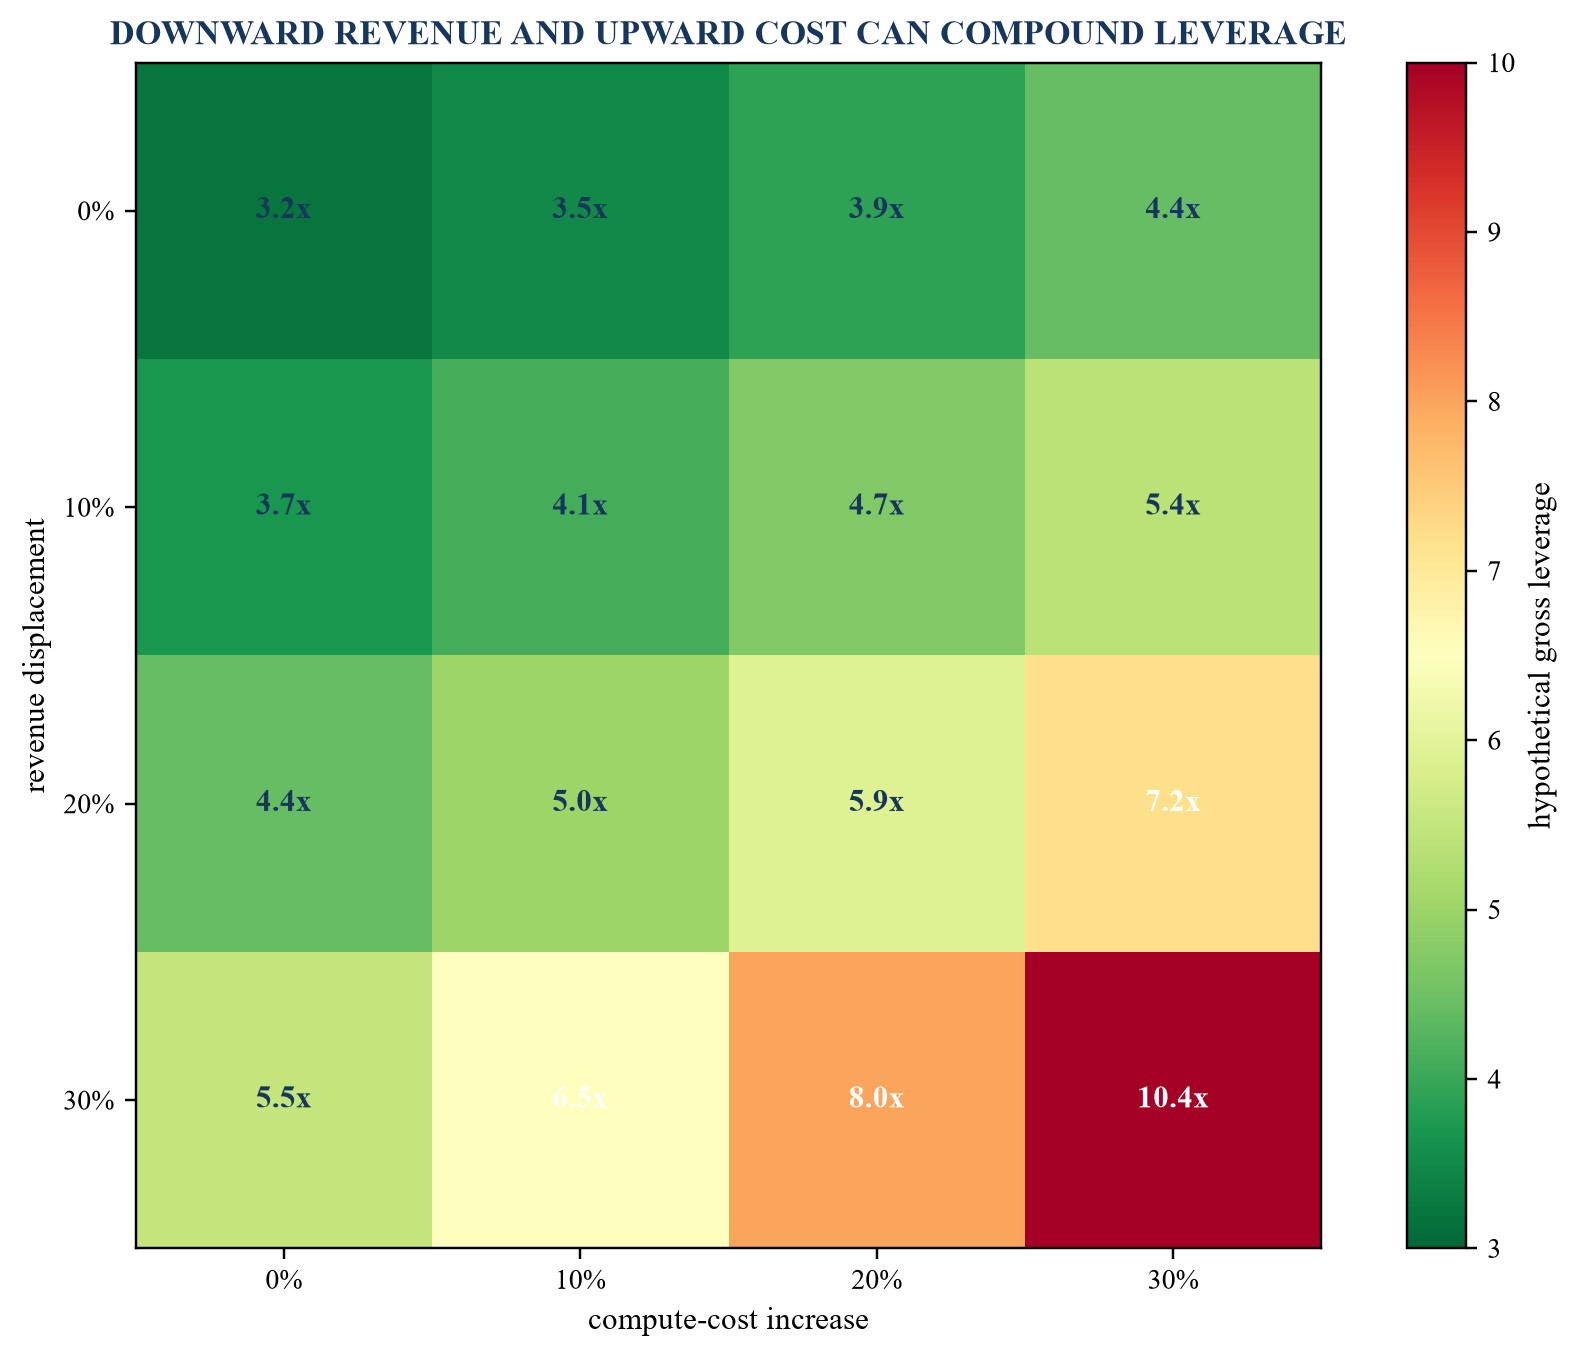
Multiples are hypothetical assumptions; the figure demonstrates sensitivity rather than a lending recommendation.
Table 4. Illustrative leverage and liquidity sensitivity
| Case | Revenue change | Compute cash change | Cash EBITDA | Gross leverage | Minimum liquidity |
|---|---|---|---|---|---|
| base | 0% | 0% | 25 | 3.2x | 24 |
| price and contraction | -10% | +5% | 19 | 4.2x | 16 |
| product displacement | -20% | +10% | 13 | 6.2x | 7 |
| compute lock-in | -10% | +25% | 14 | 5.7x | 5 |
| combined stress | -25% | +25% | 7 | 11.4x | below zero |
Amounts and outcomes are hypothetical assumptions for framework demonstration.
25. Select amortisation and maturity deliberately
Amortisation should reflect expected cash generation, investment needs, contract duration and risk decay. A bullet structure preserves liquidity during growth but concentrates refinancing risk. Heavy early amortisation can force underinvestment or draw on reserves.
The schedule should align with customer contracts and compute commitments. Capacity funded for a defined customer may support amortisation from contracted receipts. A general corporate facility relying on product transition may need cash sweeps, staged drawdown or milestone-based availability.
Maturity should allow time for evidence to emerge while preserving intervention before major contracts expire. A maturity that falls immediately after a concentrated renewal season can create avoidable uncertainty. Extension options should have objective conditions and authority.
The case should identify the repayment source: free cash flow, contracted run-off, asset financing, refinancing or strategic sale. Each source requires evidence and a downside. An assumed future equity raise should not be the sole credible repayment path.
26. Design liquidity, reserves and draw conditions
Liquidity protects the borrower and lender against timing error, delayed monetisation and commitment mismatch. The required amount should reflect monthly cash volatility, customer concentration, provider payments, capex, cure periods and access to facilities.
Minimum cash can be supplemented by funded reserves, blocked accounts, delayed draw, equity contribution, customer prepayment and availability tests. Each mechanism has operational and legal consequences. The committee should understand who controls cash, when it releases and how it ranks.
Draw conditions can connect financing to customer contracts, capacity acceptance, provider commitments, product milestones and reporting. They should rely on verifiable evidence rather than broad management certification. Conditions that require subjective lender satisfaction can create execution uncertainty and should be drafted carefully.
Liquidity monitoring should use actual cash, eligible undrawn capacity and dated obligations. Forecast headroom without reconciliation can create false comfort. The trigger should allow action before the borrower reaches a payment failure.
27. Evaluate collateral and recovery separately
Cash-flow lending and collateral recovery answer different questions. A strong growth case does not establish recovery value, and specialised assets do not establish operating cash flow. The committee should assess both.
Potential collateral includes receivables, cash, equipment, shares, intellectual property and contractual rights. Eligibility depends on ownership, perfection, transferability, concentration, disputes, licences, location and prior claims. Technical assets can depreciate quickly or require a functioning platform.
Accelerators and servers may have resale value, but generation, configuration, condition, location, removal cost, warranties, software, customer allocation and market supply affect recovery. Data centres and leases involve landlord, power, restoration and assignment issues. Qualified appraisal and legal work may be required.
Enterprise recovery should stress customer churn, staff departure, provider termination and data-right constraints. A going-concern sale can preserve more value than piecemeal enforcement, but timing and funding needs should be modelled. Recovery assumptions should remain conservative and documented.
28. Address structural and intercreditor risk
AI infrastructure can be financed through operating-company debt, equipment facilities, leases, project vehicles, receivables financing and vendor arrangements. Claims may sit at different entities and attach to different assets or cash flows.
The lender should map ownership, guarantees, security, cash movement, restricted payments and contractual subordination. A special-purpose vehicle may hold equipment while the operating company owns customers and software. Each depends on the other, and enforcement rights may not align.
Intercreditor terms should address control, standstill, enforcement, proceeds, access to assets, licences, cure rights and shared collateral. Provider contracts can contain liens, set-off or termination rights that affect senior lender value.
The structure should support operation during stress. Access to data centres, equipment, software, models, accounts and customer contracts may require consents. A nominal first-ranking security package can provide weak practical control when critical dependencies cannot transfer.
29. Use customer and supplier risk mitigants carefully
Customer prepayments, deposits, minimums, termination fees and guarantees can reduce financing risk. Their value depends on counterparty credit, enforceability, set-off, performance obligations and timing. The lender should reconcile cash received with remaining delivery cost.
Supplier mitigants include flexible capacity, volume bands, resale rights, termination options, service credits and price protection. A contractual right has value only when conditions, notice, fees and operational feasibility are understood.
Matched contracting can reduce exposure when customer terms cover provider obligations. Perfect matching is uncommon. Start dates, currency, duration, escalation, acceptance, service levels and termination may differ. The lender should quantify the residual mismatch.
Hedging can address currency, interest or power price where instruments and policy permit. It does not hedge product displacement or customer adoption. The credit pack should avoid describing unrelated protections as a complete mitigation.
30. Design the covenant architecture
Covenants should protect repayment capacity and evidence quality while allowing the borrower to adapt. The architecture can combine leverage, fixed-charge coverage, minimum liquidity, recurring-revenue tests, concentration limits, commitment controls and reporting.
Financial definitions should reflect compute and infrastructure economics. The treatment of capitalised development, cloud minimums, leases, prepayments, deferred revenue and extraordinary adjustments should be explicit. Definitions need consistency with reporting systems and executed agreements.
Operational triggers can address customer loss, product migration, provider interruption, capacity delay, data or model restrictions and material new commitments. They should lead to information, discussion, tighter controls or consent according to consequence. Overly broad triggers can produce noise and weaken discipline.
The package should include equity cure, add-back, acquisition, investment, debt and lien provisions calibrated to risk. Qualified legal drafting determines enforceability and interaction. The paper provides an analytical design framework rather than legal terms.
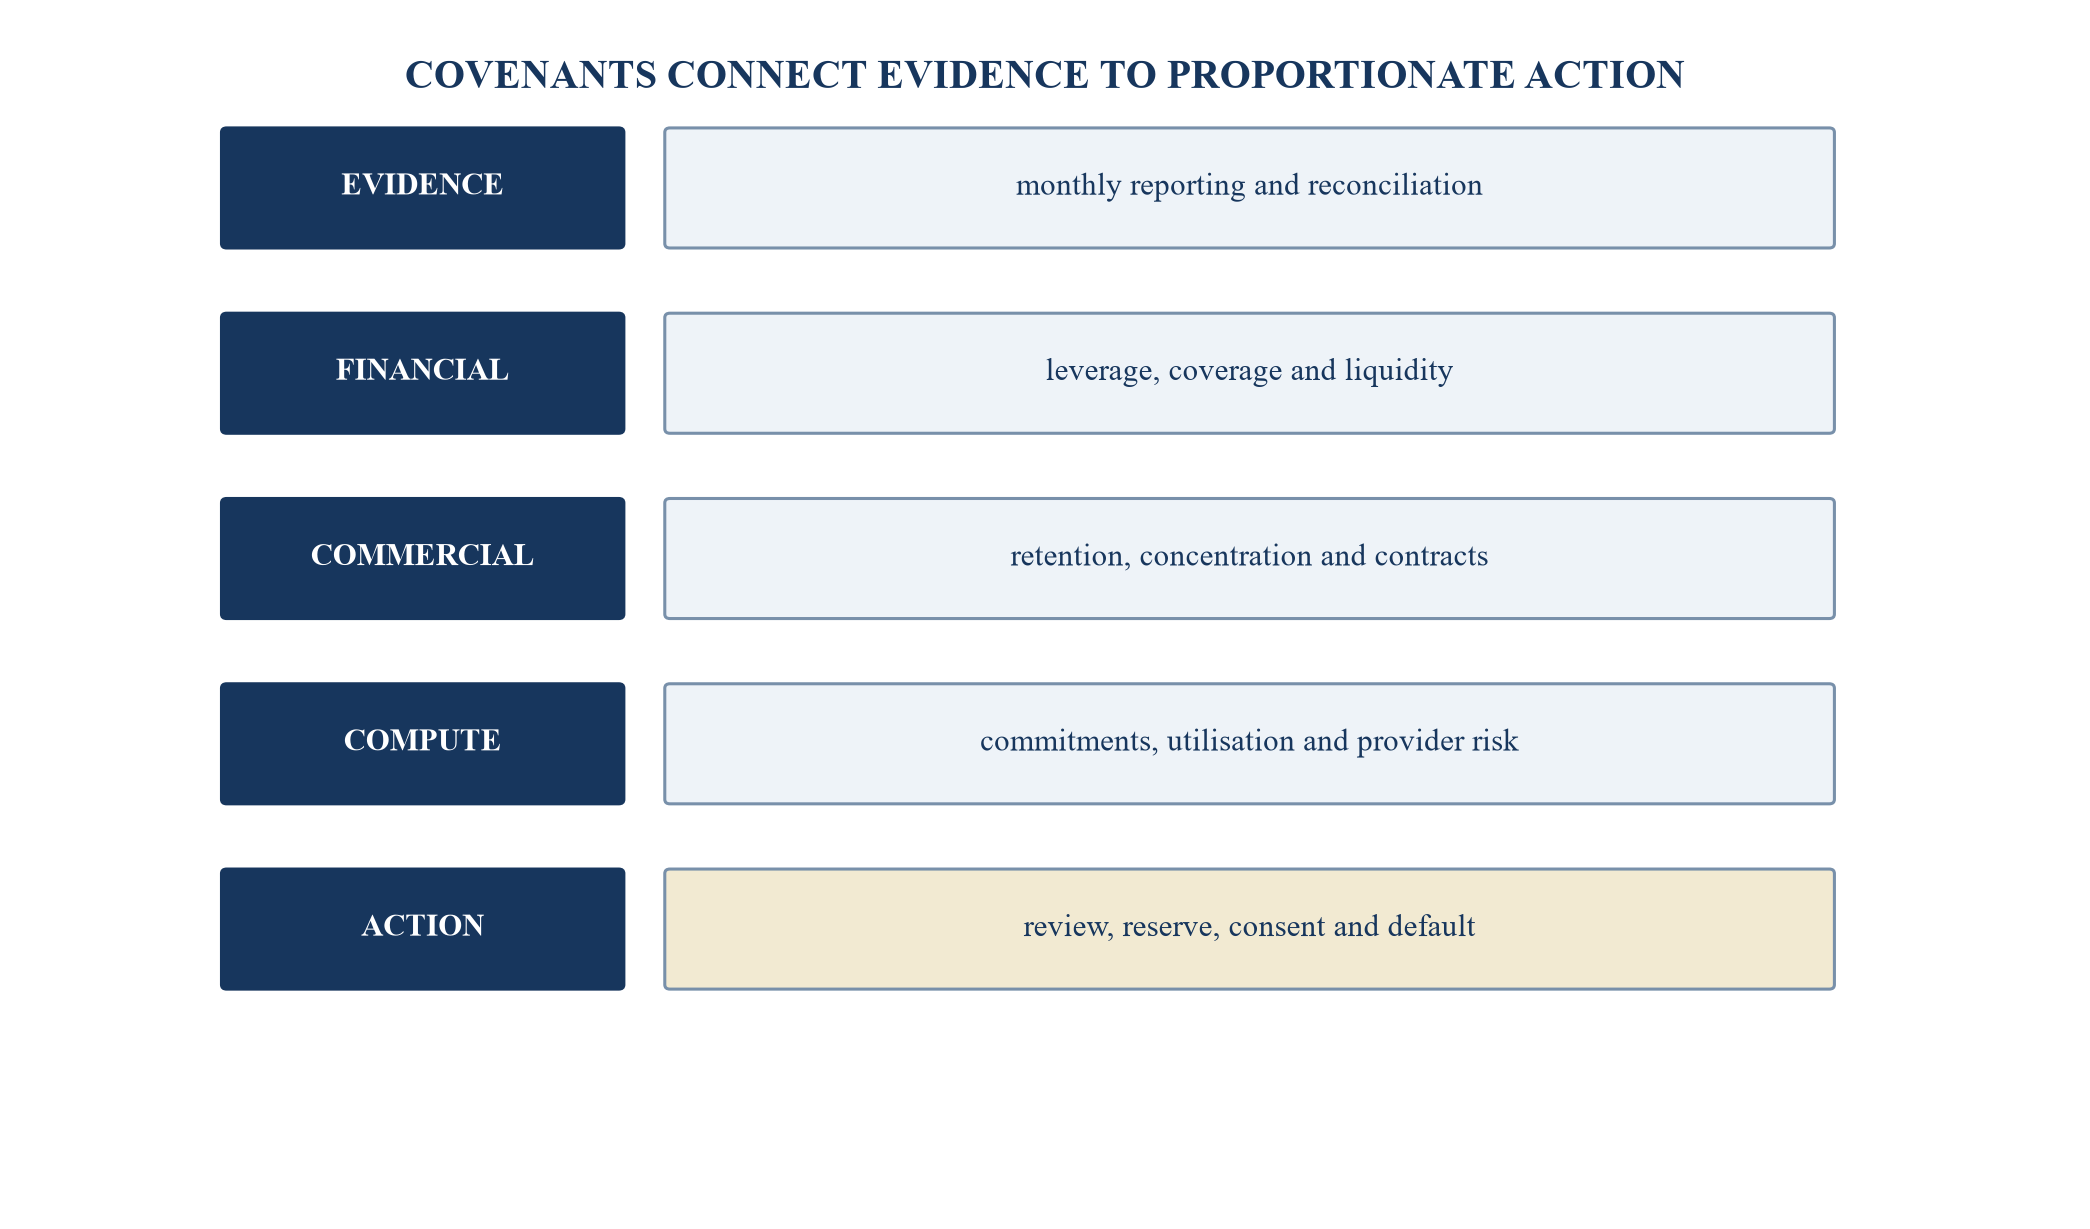
Trigger consequences should escalate with evidence and repayment impact.
Table 5. Covenant package for an AI-exposed borrower
| Control | Evidence | Trigger question | Potential consequence |
|---|---|---|---|
| leverage | reconciled cash EBITDA and debt | has debt capacity weakened | cash sweep, pricing or restriction |
| liquidity | cash, eligible availability and obligations | is the borrower approaching a funding gap | reserve, draw stop or equity support |
| retention | cohort renewal and contraction | is displacement becoming observable | enhanced reporting and plan review |
| concentration | customer and provider exposure | can one event impair repayment | limit, consent or mitigation |
| commitments | executed compute and infrastructure contracts | are new fixed claims supported | consent, staged funding or prohibition |
| evidence | timely financial, commercial and contract data | can risk be measured reliably | escalation, restricted use or default |
Thresholds and legal terms require transaction-specific analysis and drafting.
31. Build a monitoring dashboard
The dashboard should connect financial outcomes with product, customer and infrastructure evidence. It should show level, change, threshold, owner, data cut-off and response. Decorative traffic lights without consequence can conceal risk.
Core measures can include cash, collections, recurring value, gross and net retention, contraction, price, usage, gross margin, compute spend, committed capacity, utilisation, concentration, backlog conversion, covenant headroom and unresolved data issues.
Segment detail is essential. Aggregate stability can conceal deterioration in a product or renewal cohort. The dashboard should permit drill-down to material customers, contracts and workloads while protecting confidential information.
Monitoring frequency should reflect volatility and reporting capability. Monthly information may be insufficient during a liquidity event or capacity commissioning. The facility should define delivery timing, certification, access and escalation.
32. Define early-warning indicators and intervention rights
Early-warning indicators should identify deterioration before a payment or covenant breach. Examples include renewal slippage, discounting, pipeline conversion, usage decline, margin compression, delayed acceptance, compute underutilisation, provider disputes and forecast misses.
Thresholds should be calibrated to borrower history, materiality and response time. A single missed metric may require investigation; persistent or correlated signals may require a watch list, reserve, independent review or restricted commitments.
Intervention rights should be proportionate and authorised. Information requests, management meetings, adviser appointment, budget review, draw suspension, consent and enforcement serve different purposes. Documentation determines actual rights.
The record should state evidence, assessment, action, owner, deadline and outcome. This creates a closed loop and permits later evaluation of whether triggers were timely and useful.
33. Prepare the credit-committee pack
The pack should begin with the decision requested, facility, structure, repayment source and key uncertainties. It should identify where AI exposure changes revenue, cost, commitments, liquidity and recovery rather than repeat broad market commentary.
The evidence section should include product replacement, customer cohorts, pricing, gross margin, compute contracts, concentration, cash-flow reconciliation and downside cases. Material data gaps should appear in the main decision record with conditions and consequences.
The structure section should show leverage, amortisation, maturity, liquidity, security, covenants, reporting and intervention. It should explain why each term addresses a demonstrated risk and where residual exposure remains.
The committee should receive ranges and sensitivity rather than false precision. Minutes should record the evidence relied upon, conflicts, conditions, delegated authority and monitoring. Product claims and legal conclusions require qualified owners.
34. Construct a hypothetical borrower
Consider a hypothetical enterprise-software borrower with annual recurring value of USD 100 million, revenue of USD 92 million, cash EBITDA of USD 25 million, cash of USD 20 million and requested debt of USD 80 million. These figures are analytical assumptions.
The borrower sells a core workflow product, a legacy module and new AI-enabled capabilities. It has customer contracts of different renewal dates and a mix of seat and usage pricing. It has cloud and compute minimums that rise as the new product scales.
No client or observed company is represented. The example omits tax, accounting, legal, regulatory and operational details that would be required for an actual lending decision. It demonstrates how evidence connects to structure.
The base case assumes moderate recurring growth, stable core retention and improving AI monetisation. The committee then tests product displacement, compute lock-in and a combined stress.
35. Run the product-displacement case
The displacement case assumes legacy and discretionary product cohorts renew less strongly, contraction rises and new sales slow. Aggregate recurring value falls rather than growing. The assumptions are hypothetical.
Management reduces variable sales and hiring expenditure but preserves product, security and customer-success investment needed to operate. Gross margin weakens through discounting and under-absorbed delivery cost. Cash EBITDA falls to USD 13 million in the illustrative case.
Gross leverage rises from 3.2 times to 6.2 times on that assumed cash EBITDA. Minimum liquidity falls as customer cash slows before compute commitments can be reduced. The case shows why historical EBITDA and current recurring value may overstate forward capacity.
Potential responses include lower initial debt, faster cash sweep, staged availability, liquidity reserve, retention triggers and restrictions on incremental commitments. The appropriate response depends on transaction evidence and terms.
36. Run the compute lock-in case
The compute lock-in case assumes revenue declines modestly while cloud, capacity and lease payments rise under existing commitments. The borrower cannot reduce them within the stress period without fees or operational disruption. These are hypothetical assumptions.
Delivery margin compresses and cash EBITDA falls to USD 14 million. Minimum liquidity approaches USD 5 million before customer receipts improve. Annual revenue analysis alone would understate the dated cash pressure.
The diligence focus shifts to contract reduction rights, resale, workload portability, customer prepayments and capacity acceptance. A verified ability to redirect or cancel capacity could improve the outcome; an unsupported management plan should not.
Structure can use staged draws, funded reserves, matched customer contracts, provider consents and limits on new minimums. Monitoring should compare committed, used, billable and collected capacity.
37. Run the combined stress
The combined case assumes product displacement, pricing pressure, slower new sales and higher compute cash cost occur together. Cash EBITDA falls to USD 7 million and the illustrative borrower exhausts minimum liquidity before maturity.
This result does not predict failure. It identifies the variables and timing that make the requested structure fragile. The committee can test whether lower debt, equity support, commitment reduction or different amortisation restores resilience.
The case should also examine recovery. Specialised equipment may provide some value, while customer churn and provider dependencies can reduce enterprise value. Recovery proceeds, timing and costs should remain separate from operating cash flow.
A transaction should not rely on a downside that assumes immediate refinancing or sale at an unchanged market multiple. The structure should provide time and decision rights before liquidity is exhausted.
38. Translate analysis into a term-sheet logic
The analytical term sheet can specify initial debt, delayed draw, amortisation, maturity, pricing, minimum liquidity, cash sweep, commitment controls, reporting and collateral. Each term should trace to a risk or evidence gap.
For the hypothetical borrower, a lender might consider reduced funded debt, a reserve for dated compute obligations and availability conditional on customer or capacity milestones. This is an illustrative design, not a recommendation.
Covenant levels should provide useful warning and cure time rather than sit immediately above management forecast. Definitions should capture cash economics and avoid unrestricted add-backs. Baskets should permit ordinary operation within the approved risk boundary.
Conditions subsequent require owners, deadlines and consequences. A missing contract schedule or provider consent cannot remain open indefinitely if it affects repayment or security.
39. Implement the framework in ninety days
Days One to Thirty can establish the exposure perimeter, contract inventory, revenue definitions, cohort data and cash-flow reconciliation. Management, finance, product, sales, technology, legal and operations need assigned evidence owners.
Days Thirty-One to Sixty can complete product replacement analysis, compute schedule, customer and provider concentration, downside cases, collateral review and covenant design. Independent challenge should test definitions, assumptions and data completeness.
Days Sixty-One to Ninety can pilot the committee pack, dashboard, reporting workflow, covenant calculations and escalation. Historical data should be back-tested where available. Missing or disputed information should remain visible.
Implementation should begin with the most material products, customers and commitments. Expansion can follow once reconciliation and decision rights work in practice. Technology can support the workflow, but evidence ownership and authority remain essential.
40. Make AI exposure explicit in the lending decision
Debt for an AI-exposed borrower requires a clear path from technology change to contracts, customer behaviour, cost, liquidity and recovery. Broad optimism or pessimism provides weak credit evidence.
The framework separates six channels, reconciles recurring revenue, tests customer cohorts, schedules compute obligations and connects downside outcomes to leverage and structure. It makes fixed claims visible before they become a liquidity event.
The committee should state which evidence supports the base case, which uncertainties remain, which terms protect repayment and which triggers permit intervention. The final decision remains a judgement within delegated authority and applicable requirements.
Disciplined analysis can finance innovation while preserving credit standards. Its value comes from transparent assumptions, contractual evidence, dated cash flow, independent challenge and continued monitoring.
References
- Bank for International Settlements, AI disruption in private credit: exposure to software firms in BDCs, BIS Bulletin 128, 2026. https://www.bis.org/publications/bulletin-128-ai-disruption-private-credit-exposure-software-firms-bdcs
- European Banking Authority, Guidelines on loan origination and monitoring. https://eba.europa.eu/activities/single-rulebook/regulatory-activities/credit-risk/guidelines-loan-origination-and-monitoring
- Basel Committee on Banking Supervision, Principles for the Management of Credit Risk, 2025. https://www.bis.org/bcbs/publ/d595.pdf
- Central Bank of the UAE, Credit Risk Management Regulation. https://rulebook.centralbank.ae/en/rulebook/credit-risk-management-regulation
- Central Bank of the UAE, Credit Risk Management Standards. https://rulebook.centralbank.ae/en/rulebook/credit-risk-management-standards
- Financial Stability Board, The Financial Stability Implications of Artificial Intelligence, 2024. https://www.fsb.org/publications/the-financial-stability-implications-of-artificial-intelligence/
- IFRS Foundation, IFRS 15 Revenue from Contracts with Customers. https://www.ifrs.org/issued-standards/list-of-standards/ifrs-15-revenue-from-contracts-with-customers/
- IFRS Foundation, IFRS 16 Leases. https://www.ifrs.org/issued-standards/list-of-standards/ifrs-16-leases/
- IFRS Foundation, IAS 36 Impairment of Assets. https://www.ifrs.org/issued-standards/list-of-standards/ias-36-impairment-of-assets/
- IFRS Interpretations Committee, Customers' right to access suppliers' application software. https://www.ifrs.org/projects/completed-projects/2019/customers-right-to-access-suppliers-application-software-ias-38/tad-customers-right-to-access-suppliers-application-software/
- IFRS Foundation, Intangible Assets: cloud computing arrangements test case, 2026. https://www.ifrs.org/content/dam/ifrs/meetings/2026/january/iasb/ap17b-potential-changes-definition-cca.pdf
- Microsoft Corporation, Annual Report on Form 10-K for the year ended 30 June 2026. https://www.sec.gov/Archives/edgar/data/789019/000119312526323660/msft-20260630.htm
- Adobe Inc., Quarterly Report on Form 10-Q for the quarter ended 27 February 2026. https://www.sec.gov/Archives/edgar/data/796343/000079634326000056/adbe-20260227.htm
- Snowflake Inc., Annual Report on Form 10-K for the year ended 31 January 2026. https://www.sec.gov/Archives/edgar/data/1640147/000164014726000008/snow-20260131.htm
- C3.ai, Inc., Annual Report on Form 10-K for the year ended 30 April 2026. https://www.sec.gov/Archives/edgar/data/1577526/000157752626000078/ai-20260430.htm
- CoreWeave, Inc., Annual Report on Form 10-K for the year ended 31 December 2025. https://www.sec.gov/Archives/edgar/data/1769628/000176962826000104/crwv-20251231.htm
- NVIDIA Corporation, Annual Report for fiscal 2026. https://www.sec.gov/Archives/edgar/data/1045810/000104581026000038/a2026-annualxreportxwebxfi.pdf
- IREN Limited, Annual Report on Form 10-K for the year ended 30 June 2026. https://www.sec.gov/Archives/edgar/data/1878848/000187884826000052/iren-20260630.htm
- Nebius Group N.V., Annual Report on Form 20-F for the year ended 31 December 2025. https://www.sec.gov/Archives/edgar/data/1513845/000110465926052948/nbis-20251231x20f.htm
- Oracle Corporation, Annual Report on Form 10-K for the year ended 31 May 2026. https://www.sec.gov/Archives/edgar/data/1341439/000119312526277521/orcl-20260531.htm
- Amplitude, Inc., Annual Report on Form 10-K for the year ended 31 December 2025. https://www.sec.gov/Archives/edgar/data/1866692/000119312526057847/ampl-20251231.htm
- NetApp, Inc., Annual Report on Form 10-K for the year ended 24 April 2026. https://www.sec.gov/Archives/edgar/data/1002047/000119312526259683/ntap-20260424.htm
- National Institute of Standards and Technology, Artificial Intelligence Risk Management Framework 1.0, 2023. https://doi.org/10.6028/NIST.AI.100-1
- Office of the Comptroller of the Currency, Rating Credit Risk, Comptroller's Handbook. https://www.occ.treas.gov/publications-and-resources/publications/comptrollers-handbook/files/rating-credit-risk/pub-ch-rating-credit-risk.pdf
- Board of Governors of the Federal Reserve System, Supervisory Guidance on Model Risk Management, 2026. https://www.federalreserve.gov/frs/guidance/supervisory-guidance-on-model-risk-management.htm
- Interagency Statement on the Use of Alternative Data in Credit Underwriting, 2019. https://www.federalreserve.gov/supervisionreg/caletters/CA19-11.htm
