

1. Define the pricing decision
The acquisition decision is how much enterprise value can be supported by the target's current recurring revenue, customer retention and demonstrable contribution to maintenance economics. The buyer also needs to identify which benefits depend on customer behaviour, sensor coverage, engineering services, proprietary data, vendor personnel or buyer integration. The answer affects valuation, purchase-price protection, management incentives and the first one hundred days after closing.
Predictive maintenance sits between technology and operations. The product may collect vibration, acoustic, thermal, electrical, lubricant, visual or process evidence. It may detect anomalies, diagnose failure modes, estimate remaining useful life or recommend an intervention. Value appears only after an authorised person acts and the intervention changes an economically relevant outcome. A technically capable system can therefore have weak realised economics, while a relatively simple rule can create substantial value when it is trusted, timely and embedded in a constrained process.
The framework tests six propositions. The monitored population is defined. Detection performance is validated in the relevant operating conditions. Alerts arrive with enough lead time and context to support a practical action. Users complete the action through a controlled workflow. The avoided consequence is supported by a credible counterfactual. The resulting benefit reconciles to customer operations and finance. Each break in this chain changes the quality of the revenue and the multiple that a buyer can support.
Table 1. Evidence required to convert a predictive-maintenance claim into transaction value
| Evidence layer | Core question | Primary record | Valuation consequence |
|---|---|---|---|
| Equipment identity | Which physical asset, duty and failure mode are covered? | Asset register, hierarchy, operating context and sensor map | Defines the addressable installed base |
| Detection validity | Did the system identify a material condition reliably? | Raw signal, model version, threshold, diagnosis and validation result | Supports product efficacy and limits warranty risk |
| Actionability | Was the alert early and specific enough to change maintenance? | Alert timestamp, lead time, recommendation and acknowledgement | Separates useful alerts from technical observations |
| Intervention | Did an authorised team inspect, repair, replace or defer? | Work order, parts, labour, inspection and closure record | Establishes workflow adoption |
| Counterfactual | What probably would have happened without the intervention? | Failure history, engineering assessment, redundancy and production plan | Prevents every anomaly becoming an avoided failure |
| Financial outcome | Which cost, margin or risk consequence changed? | Finance-approved benefit ledger and supporting operational evidence | Supports customer ROI, renewal and income value |
Each layer has a different evidence owner and can fail independently.
2. Identify the product actually being acquired
A predictive-maintenance company can include several businesses under one commercial label. Hardware sales may fund sensors and gateways. Software subscriptions may cover analytics, workflow and dashboards. Managed monitoring may provide human review. Engineering projects may create baselines, models and integrations. Outcome-linked fees may depend on savings or availability. Each component has a different growth profile, gross margin, working-capital pattern and transfer dependency.
The buyer should reconcile product names to performance obligations, invoice lines and delivery activities. A subscription that includes free hardware replacement, around-the-clock analyst review and site engineering is economically different from a software licence delivered through customer-owned data infrastructure. A reported software gross margin can also exclude implementation labour carried elsewhere in the income statement. Cohort economics should therefore include the full cost required to acquire, commission, support and retain the installed base.
Public filings illustrate the range of models. MultiSensor AI describes a platform combining imaging and sensing technologies with AI-powered software and states that annual subscription payments are generally collected in advance and recognised over the subscription period [1]. Other industrial-technology providers combine device sales, cloud services and support. The diligence model should follow the actual contract and cost structure rather than assign a software multiple to the whole company.
3. Define the monitored population
The denominator determines whether reported performance is meaningful. A firm may describe thousands of monitored assets while actively analysing only a subset, receiving usable data from fewer, and influencing maintenance on fewer still. The population should be reconciled from contracted sites to commissioned sites, connected assets, assets with data above the quality threshold, assets covered by active models and assets governed by an adopted workflow.
The equipment hierarchy should identify plant, area, system, equipment unit, maintainable item and component where relevant. Duty, speed, load, product, ambient conditions, redundancy and criticality affect both model performance and economic consequence. ISO 14224 provides a structured basis for equipment, failure and maintenance data in petroleum, petrochemical and natural-gas operations and emphasises standardised data and quality control [2]. Other industries need an equivalent taxonomy suited to their equipment and processes.
Coverage should be measured by economic importance as well as asset count. Monitoring one hundred low-criticality motors does not offset missing the single compressor that constrains production. The buyer should calculate coverage by replacement value, production constraint, safety relevance, historical loss and customer-defined criticality. The same analysis should identify assets excluded because of sensor limitations, operating variability, insufficient failure history or commercial scope.
4. Standardise failure and maintenance records
Predictive-maintenance evidence deteriorates when customers use different terms for the same event or close work orders without recording the observed condition. A model trained on inconsistent labels can appear accurate in aggregate while failing on the failure modes that drive value. The acquisition team should map equipment taxonomy, failure mode, failure mechanism, detection method, action, consequence, downtime and cost to a controlled dictionary.
The record should preserve uncertainty. An alert may lead to a confirmed defect, no defect, an inconclusive inspection or a maintenance action taken before confirmation. These outcomes should remain distinct. Treating every post-alert intervention as a true positive inflates performance. Treating every asset that continued running as a false positive ignores cases in which the intervention removed the condition. The event record needs the evidence available before the action and the evidence obtained afterward.
ISO 13374 describes reference processing blocks for condition-monitoring and diagnostic systems, from data acquisition through state detection, health assessment and prognostic assessment [3]. That structure helps a buyer locate where evidence changes form and where human or algorithmic judgement enters. It also makes it easier to test whether the target's proprietary contribution lies in sensing, feature engineering, diagnosis, prognosis, workflow or the accumulated failure library.
5. Test signal and data integrity
The product cannot produce durable evidence when the underlying measurement is unreliable. Diligence should inspect sensor selection, installation, calibration, sampling, synchronisation, environmental protection, gateway behaviour, missing data, firmware, network interruptions and asset-to-sensor mapping. The review should also identify whether the customer or vendor controls each layer and who bears the cost of remediation.
Data-quality thresholds should be tied to the intended analysis. A temperature trend used for monthly inspection planning has different requirements from high-frequency vibration analysis. Completeness alone is insufficient when a sensor is attached to the wrong bearing or when a tag persists after equipment replacement. The evidence ledger should show when the asset configuration changed and whether the model was recalibrated.
Quality metrics should be calculated by customer cohort, equipment class and model version. A portfolio average can conceal weak deployments that are expensive to support or likely to churn. The buyer should examine the distribution of valid data hours, missing intervals, sensor replacements, mapping corrections and model suppressions. These measures affect customer value, service cost and the feasibility of scaling without proportional engineering effort.
6. Validate diagnostic performance
Model accuracy is not one number. The relevant measures depend on whether the system detects an abnormal state, diagnoses a failure mode, estimates severity or predicts time to failure. Detection can be assessed through precision, recall, false-positive rate and false-negative rate. Prognosis may require error, calibration and timeliness measures across the remaining-useful-life horizon. A useful result also needs performance across equipment, duty and failure cohorts.
NIST describes prognostics and health management as the use of current and historical state information to support decisions that improve performance, safety, reliability and maintainability [4]. Its research highlights verification, validation, standards and cost-benefit analysis as implementation needs. NASA's review of the C-MAPSS prognostics datasets notes the difficulty of benchmarking algorithms and the importance of consistent comparisons across operating conditions, failure modes and uncertainty [5]. These lessons apply directly to acquisition diligence.
The target should produce a versioned evaluation pack. It should define the population, label source, observation window, exclusions, train-test separation, operating conditions and performance distribution. Customer-specific tuning and analyst overrides should be visible. Back-tests performed after the failure is known should not be presented as contemporaneous performance. Where failure events are rare, the buyer should focus on calibrated uncertainty and operational evidence rather than a single headline score.
7. Measure actionable lead time
An accurate alert can arrive too late to create value or so early that the customer cannot decide when to intervene. Actionable lead time is the period between a sufficiently supported alert and the last practical point at which the customer can inspect, plan parts, schedule labour and perform the intervention before the economic consequence. It should be measured against the relevant maintenance workflow.
Lead time should be analysed by failure mode and customer constraint. A critical rotating component may require days to secure a shutdown window and specialist labour. A consumable component may need only hours. An uncertain early warning can still be useful if confidence develops in time and the customer has a defined monitoring plan. The evidence should distinguish first anomaly, first actionable alert, customer acknowledgement, inspection, decision and completed work.
Value depends on the distribution, not the average. A system that provides ample warning for common low-value events and late warning for high-value failures may show a strong mean. The buyer should weight lead time by criticality, avoided consequence and intervention feasibility. Contracts that promise detection without defining lead time, evidence and customer responsibilities expose both renewal and liability risk.
8. Separate alerts from adopted decisions
The alert-to-action funnel is a central commercial metric. The firm should reconcile generated alerts, analyst-confirmed alerts, customer acknowledgements, inspections, work orders, completed interventions and closed outcomes. Each transition should have a timestamp, owner and reason code. Suppressed, duplicated, deferred and rejected alerts should remain in the dataset.
Adoption is more than logins. A user may open a dashboard because the vendor requested it while maintenance decisions continue through existing routines. Stronger evidence connects the alert to a work order, inspection, parts request, planned outage or operating change. It also shows that the customer closed the outcome and supplied enough evidence to improve the system.
The US Department of Energy's operations and maintenance guide emphasises that predictive-maintenance technology requires serious implementation, training, monitoring and repair capability [6]. The buyer should therefore treat customer workflow design, training and change management as part of the product economics. High adoption created through vendor engineers may support value, while the associated service cost should remain in the cohort margin.
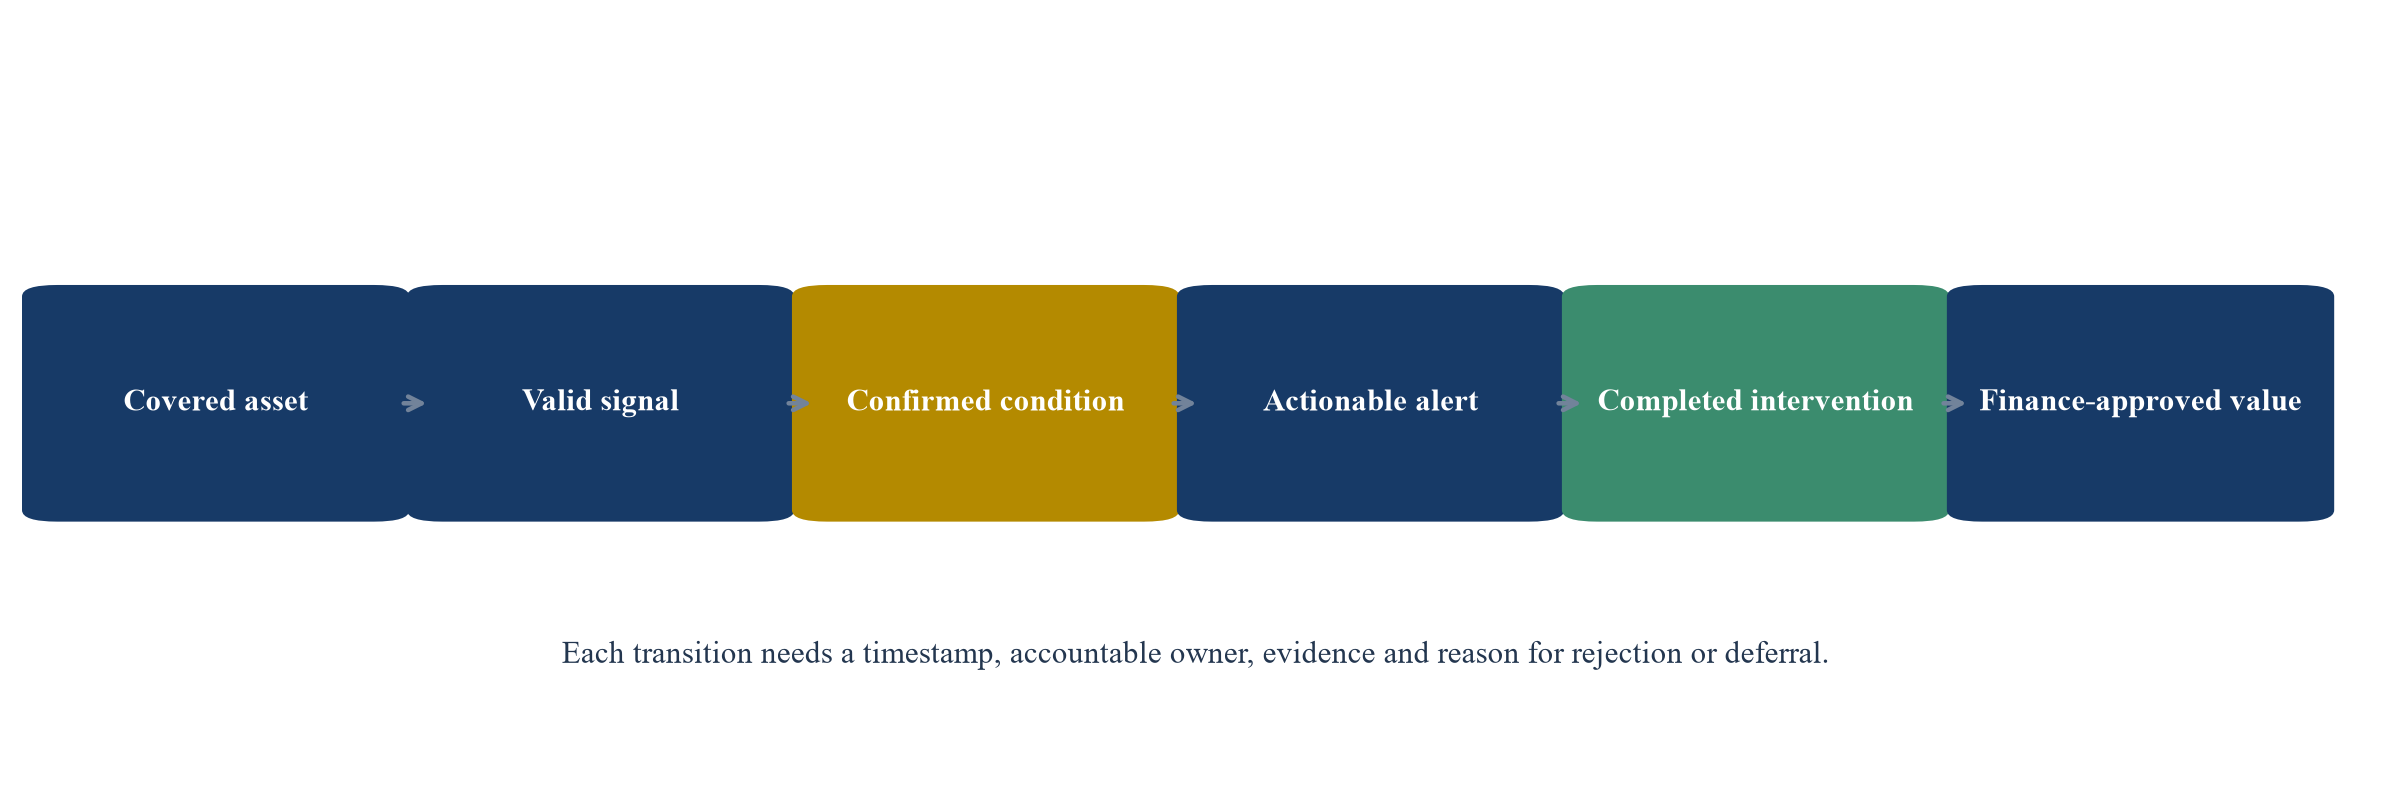
Transaction value depends on the conversion of monitored equipment into finance-approved outcomes.
9. Construct the failure counterfactual
Avoided downtime is not directly observed because the intervention changes the path. The customer and vendor therefore need a disciplined counterfactual. The evidence should state the diagnosed condition, probability and timing of failure without intervention, expected operational consequence, available redundancy, planned outage opportunities and confidence range. Engineering judgement is legitimate when it is documented and independently challenged.
Historical failure frequency can inform the counterfactual when equipment, duty and maintenance practice are comparable. Original-equipment-manufacturer limits, inspection findings and degradation models can provide additional evidence. A component found damaged after an alert supports the diagnosis, though it does not establish that catastrophic failure was imminent or that every planned hour would have become lost production.
The counterfactual should be frozen close to the decision date. Retrospective estimates prepared for a renewal or transaction can incorporate knowledge of later production, prices and events. The ledger should preserve the initial estimate, later evidence and final approved amount. Differences help the buyer assess optimism, calibration and governance.
10. Translate downtime into economic consequence
Downtime has value only through its effect on saleable output, cost, working capital, contractual performance, safety or asset life. The model should identify the system constraint and the period over which lost time affects the customer. Spare capacity, inventory, alternate lines, overtime recovery and demand can reduce the economic loss. A short interruption may have little value when production is recovered within the same period.
The contribution-margin approach should use incremental revenue less costs that change with the event. Applying revenue per hour to every avoided hour overstates value where demand, mix or recovery limit the loss. Cost savings should distinguish avoided external labour, overtime, emergency freight, damage escalation, scrap and parts from salaried labour or planned maintenance that merely moves in time.
Risk reduction can matter even when no failure occurs during the measurement period. A customer may pay to reduce the probability of a severe event. That value should be modelled separately through expected loss, insurance, compliance or risk appetite. It should not be added to avoided downtime for the same scenario without reconciling overlap.
11. Build the verified-savings ledger
The verified-savings ledger should operate at event level and roll up to customer, site, equipment class and reporting period. Each event needs an identifier, model version, alert and action timestamps, failure hypothesis, inspection finding, counterfactual, affected operating metric, gross benefit, deductions, recurring cost, evidence owner and approval status. The ledger should link to source records rather than rely on a narrative case study.
Approval should be staged. Engineering confirms the condition and plausible consequence. Maintenance confirms the action and cost. Operations confirms the production effect. Finance confirms the economic treatment and period. The customer determines whether the event can be used externally. Disagreements and rejected claims should remain visible because they reveal model and governance quality.
The ledger should prevent duplication across vendors and programmes. An avoided bearing failure may be claimed by the sensor provider, the analytics platform, the reliability consultant and the maintenance team. The customer can acknowledge shared contribution without recording the full value several times. For transaction purposes, the target's attributable share should follow the contracted role and evidence.
Table 2. Minimum event fields for a verified-savings ledger
| Field group | Required fields | Control question | Common failure |
|---|---|---|---|
| Identity | Customer, site, equipment, component, criticality and contract | Does the event belong to the contracted population? | Asset names differ across systems |
| Detection | Signal, model version, threshold, diagnosis and confidence | Can an independent reviewer reproduce the alert? | Retrospective model or undocumented override |
| Action | Acknowledgement, inspection, decision, work order and closure | Did the customer change maintenance because of the alert? | Alert cited after routine work was already planned |
| Counterfactual | Failure mode, timing, probability, redundancy and recovery | What credible outcome was avoided? | Every anomaly treated as imminent failure |
| Economics | Production, contribution, labour, parts, damage and recurring cost | Which incremental cash effect changed? | Revenue per hour used without constraint testing |
| Approval | Engineering, maintenance, operations and finance status | Who accepted or rejected each element? | Vendor-approved case presented as customer evidence |
The ledger preserves both accepted and rejected events to support calibration and audit.
12. Remove duplicated and non-cash benefits
The savings bridge should begin with management's reported amount and remove unsupported or overlapping elements. Typical deductions include events outside the contracted scope, conditions detected through another process, work already planned, assets with full redundancy, output recovered later, gross revenue presented as margin, maintenance deferred rather than avoided, duplicated claims and ongoing product cost.
Deferred maintenance should be treated carefully. Moving a planned intervention to a more convenient outage can create scheduling value while leaving parts and labour unchanged. Replacing a component before failure can also increase cost when remaining useful life is discarded. The economic model should recognise the value of planned work and damage avoidance without assuming the maintenance obligation disappears.
Customer value should be shown before and after the subscription, hardware amortisation, implementation, integration, analyst service and internal customer effort required to achieve it. A high gross-savings multiple can coexist with modest net benefit when deployment is complex. Net value is more relevant to renewal, price tolerance and an acquirer's ability to expand margin.
13. Analyse customer cohorts
Aggregate savings can be dominated by a small number of dramatic events. The buyer should examine value across customer cohorts by start date, industry, equipment class, deployment model, geography and contract size. The analysis should show time to first verified event, time to operational adoption, percentage of customers with finance-approved value and dispersion of value relative to price.
Cohort maturity matters. Newly commissioned sites may have high installation cost and little failure evidence. Mature sites may show stronger adoption but a lower event rate after reliability improves. Customers can also expand asset coverage after proving value, which makes expansion a useful commercial signal. The buyer should separate contracted expansion from unbilled pilots and management pipeline.
Churn and contraction should be linked to the evidence ledger. A customer may leave because of budget pressure, a plant closure, poor data quality, weak alert value, high false-positive burden, integration problems or a competitive replacement. These causes have different implications for valuation and remediation. Gross and net retention should be calculated from source contracts and invoices, with acquisitions, currency and non-recurring services treated consistently.
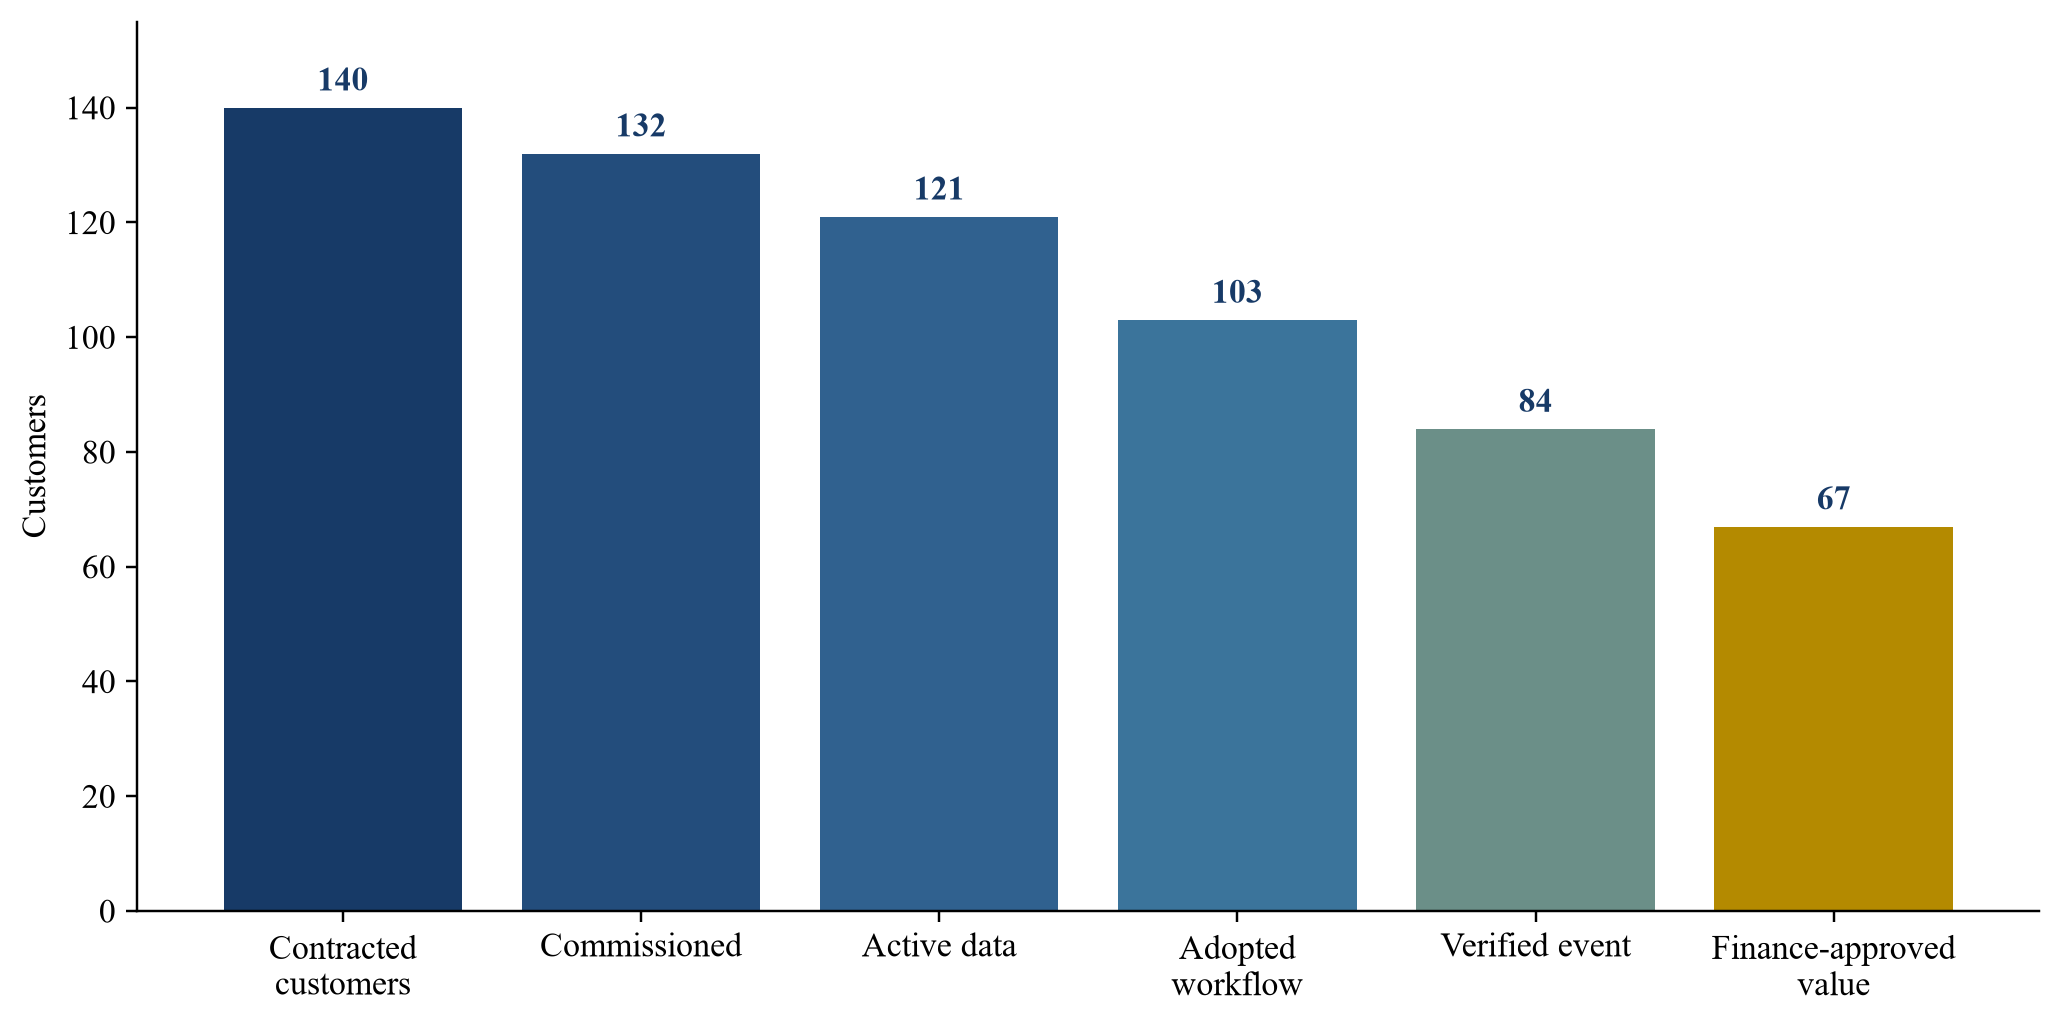
All counts are management assumptions created to demonstrate the diligence method.
14. Measure value-to-price and renewal quality
Value-to-price is the customer's finance-approved net benefit divided by the fully loaded annual price. It should be calculated for customers with sufficient observation and shown as a distribution. The measure should not assign zero value to customers whose risk-reduction objective cannot be observed annually, though those cases require a separately supported willingness-to-pay analysis.
Renewal quality improves when the customer can identify the covered assets, the decisions influenced, the benefits approved and the cost of switching. A renewal achieved through a large discount, unpaid extension or unresolved proof-of-value exercise is weaker than one completed on standard terms after measured expansion. The buyer should reconcile renewal date, contracted value, discount, scope change, collection and implementation obligations.
Annual recurring revenue is a commercial measure rather than cash or recognised revenue. Public software companies define it in different ways. Informatica, for example, described ARR as expected annual billing from active maintenance and subscription agreements and disclosed its grace-period treatment for expired contracts under negotiation [7]. The target's definition should be documented and reconciled to contracts, invoices, deferred revenue and the general ledger.
15. Test installed-base economics
The installed base creates value when additional assets and customers can be added without proportional cost. The buyer should calculate commissioning cost, sensor and gateway capital, installation labour, travel, data engineering, analyst review, cloud consumption, replacement hardware, customer success and support by cohort. These costs should follow the customer even when departments report them separately.
Gross margin should be calculated by revenue stream. Hardware, installation, managed monitoring, software and outcome fees can have materially different margins. Capitalised contract acquisition or development costs should be identified. The analysis should also distinguish customer-funded implementation from vendor-funded pilots and recoverable deposits.
Payback should use contribution after direct deployment and service cost. Long payback can be acceptable when retention and expansion are strong, while a short accounting payback may be misleading if the vendor bears later hardware replacement or monitoring commitments. The model should include cash timing because annual prepayment can support working capital even when accounting revenue is recognised over time.
16. Assess recurrence and expansion
Recurring revenue deserves a premium when contracts renew, service obligations are manageable and customer value persists. The buyer should examine gross retention, net retention, asset expansion, module expansion, price change, contract term, cancellation rights and concentration. It should also identify revenue described as recurring that depends on annual hardware refresh, discretionary engineering or a customer-controlled production programme.
Expansion should be traced to invoices and installed assets. A customer can increase contract value because the system proved value, because a pilot rolled into the planned base, because hardware was added or because price rose. Each source has a different implication for product-market fit and future growth. Cohort analysis should also show whether expansion offsets contraction from mature customers.
Backlog and remaining performance obligations can support visibility where definitions and cancellation terms are clear. They should not be added mechanically to annual recurring revenue. The buyer should map contracted consideration, invoicing, revenue recognition and delivery obligations to avoid counting the same economics in several metrics.
17. Evaluate outcome-based pricing
Outcome pricing can align the vendor with realised value, though it also transfers measurement and collection risk. The contract needs a defined baseline, event taxonomy, approval process, benefit formula, cap, floor, dispute mechanism and treatment of customer-caused delay. The vendor should not control both the measurement and the payment determination.
Hybrid pricing can separate access from performance. A base subscription supports the platform, monitoring and service capacity. A variable fee rewards finance-approved outcomes or expansion. The balance depends on event frequency, data quality, customer governance and the vendor's ability to absorb volatility. Outcome fees based on avoided catastrophic events can create unstable revenue and contentious counterfactuals.
IFRS 15 requires an entity to identify performance obligations, determine transaction price and constrain variable consideration where a significant reversal remains possible [8]. The accounting analysis depends on the contract and should be performed by qualified specialists. For M&A, the buyer should separately assess whether reported outcome fees are repeatable, collectable and supported by customer approvals.
18. Review data and intellectual-property rights
The target's models may depend on customer data that cannot be retained or reused after termination. The buyer should inventory rights to raw signals, equipment metadata, work orders, failure labels, derived features, trained parameters, aggregate benchmarks and customer case studies. Ownership, permitted use, territory, retention and deletion should be distinguished.
Model improvement across customers can create a data advantage only when rights, comparability and governance support it. A broader dataset can also introduce domain shift. Equipment designs, loads, maintenance practice and sensor placement may differ. The target should show how it tests transfer and protects customer confidentiality.
The intellectual-property review should cover patents, source code, open-source components, employee and contractor assignments, model libraries, deployment tools and know-how. A valuable failure library may exist mainly in analyst judgement and customer records. The buyer should assess whether that capability transfers with the people, contracts and data access required to maintain it.
19. Assess operational technology security
Predictive-maintenance products often connect operational technology to gateways, enterprise systems and cloud services. The acquisition review should identify every interface, credential, remote-support route, update mechanism, data flow and dependency. It should test how the product behaves when connectivity fails and whether analytics can influence control systems.
NIST's operational-technology security guidance emphasises the performance, reliability and safety constraints of industrial environments [9]. The architecture should preserve safe local operation, controlled change, least privilege, logging, recovery and asset inventory. Security cost belongs in the product margin and integration plan.
Incident history should cover customer environments, vendor infrastructure, device compromise, certificate expiry, exposed credentials and vulnerable components. Contractual responsibility for patching, notification, evidence preservation, recovery and regulatory engagement should be clear. A buyer may need price protection where unsupported devices or insecure deployment patterns require replacement.
20. Govern AI and human accountability
Model governance should identify the intended use, prohibited use, training or calibration population, performance limits, monitoring, override and change authority. A maintenance recommendation can affect safety, production and cost. The accountable customer engineer should understand the evidence and retain authority within the plant's operating procedures.
Current European Commission guidance distinguishes AI systems that serve as safety components from systems that provide precautionary predictive-maintenance insight, based on intended purpose and consequences [10]. Classification and application dates remain fact-specific. The buyer should perform a jurisdictional assessment for products integrated into machinery, critical infrastructure or employment processes.
The governance record should show how models are released, monitored and withdrawn. Vendor analysts and generative interfaces should not conceal the underlying evidence. High-consequence recommendations need traceability, uncertainty and escalation. These controls support customer trust and reduce the chance that rapid product expansion creates hidden liability.
21. Select the valuation methods
The market approach compares revenue and earnings multiples for relevant businesses, adjusted for growth, retention, margin, concentration, hardware mix, services intensity, scale and evidence quality. Comparable companies rarely match the target's product and delivery model exactly. The buyer should therefore explain each adjustment rather than use a broad industrial-software label.
The income approach forecasts revenue, gross profit, operating cost, reinvestment, working capital and risk. Customer-level retention, expansion and contribution evidence can improve the forecast. Verified savings do not become vendor cash flow automatically. They support willingness to pay, retention and price only through observed or contractually credible conversion.
The cost approach can inform the value of software, datasets and deployment capability when market and income evidence is limited. IFRS 13 describes market, income and cost approaches and requires assumptions consistent with those a market participant would use [11]. Transaction price, enterprise value and purchase-price allocation answer different questions and should be kept separate.
22. Create an evidence-adjusted revenue bridge
The buyer should begin with contracted recurring revenue and apply specific adjustments rather than a single diligence discount. Adjustments may cover expired agreements in grace periods, unpaid balances, cancellable pilots, hardware or services embedded in the metric, contracts lacking required commissioning, customer concentration and revenue dependent on unsupported outcome claims.
Evidence quality can then inform retention and expansion assumptions. Customers with finance-approved value, mature adoption and standard-price renewal may support a stronger forecast. Customers with weak data, vendor-intensive workflows and unresolved proof of value require lower retention or additional cost. The analysis should remain cohort based.
This bridge does not create an accounting metric. It is a transaction model that makes the path from reported recurring revenue to forecast cash flow transparent. Management, the buyer and financing providers can challenge each adjustment and replace it as better evidence becomes available.
Table 3. Predictive-maintenance valuation scorecard
| Dimension | Strong evidence | Weak evidence | Valuation input affected |
|---|---|---|---|
| Customer value | Finance-approved event ledger and net value-to-price by cohort | Vendor case studies and gross savings claims | Retention, expansion and pricing |
| Product efficacy | Versioned results across assets, duties and failure modes | Selected examples without denominators | Product risk and warranty exposure |
| Adoption | Alerts linked to work orders and closed outcomes | Dashboard activity or training attendance | Time to value and customer-success cost |
| Revenue quality | Contract reconciliation, collections and standard renewals | Pilots, grace periods and bundled services in ARR | Revenue base and multiple |
| Scalability | Declining deployment cost and stable support per asset | Bespoke engineering and analyst dependence | Gross margin and reinvestment |
| Rights and security | Transferable rights, controlled architecture and tested recovery | Customer-dependent data rights and unsupported devices | Remediation cost and risk premium |
The scorecard connects diligence evidence to the relevant valuation input.
23. Demonstrate the hypothetical case
The illustrative target has 140 contracted customers, 132 commissioned customers and 121 customers supplying data above the contractual quality threshold. One hundred and three customers use the system in an adopted maintenance workflow, 84 have at least one event supported by engineering and operational evidence, and 67 have finance-approved value. The business monitors 31,600 assets and reports USD 24.0 million of annual recurring revenue.
Management identifies USD 78.0 million of annual customer savings. Diligence removes USD 11.8 million of events without a credible failure counterfactual, USD 7.4 million involving available redundancy or recovered production, USD 5.9 million of duplicated production and maintenance value, USD 4.1 million of maintenance deferred rather than avoided, and USD 6.3 million outside the contracted workflow or observation period. The remaining supported operational benefit is USD 42.5 million. Only USD 29.8 million is finance approved and observed for at least twelve months.
Reported annual recurring revenue includes USD 1.6 million of cancellable pilots, USD 0.9 million of expired contracts under negotiation and USD 1.1 million of recurring engineering that carries a services margin. The evidence-adjusted recurring base is therefore USD 20.4 million before a forecast of renewals and expansion. These are hypothetical management assumptions. They illustrate the method and do not describe any company or market benchmark.
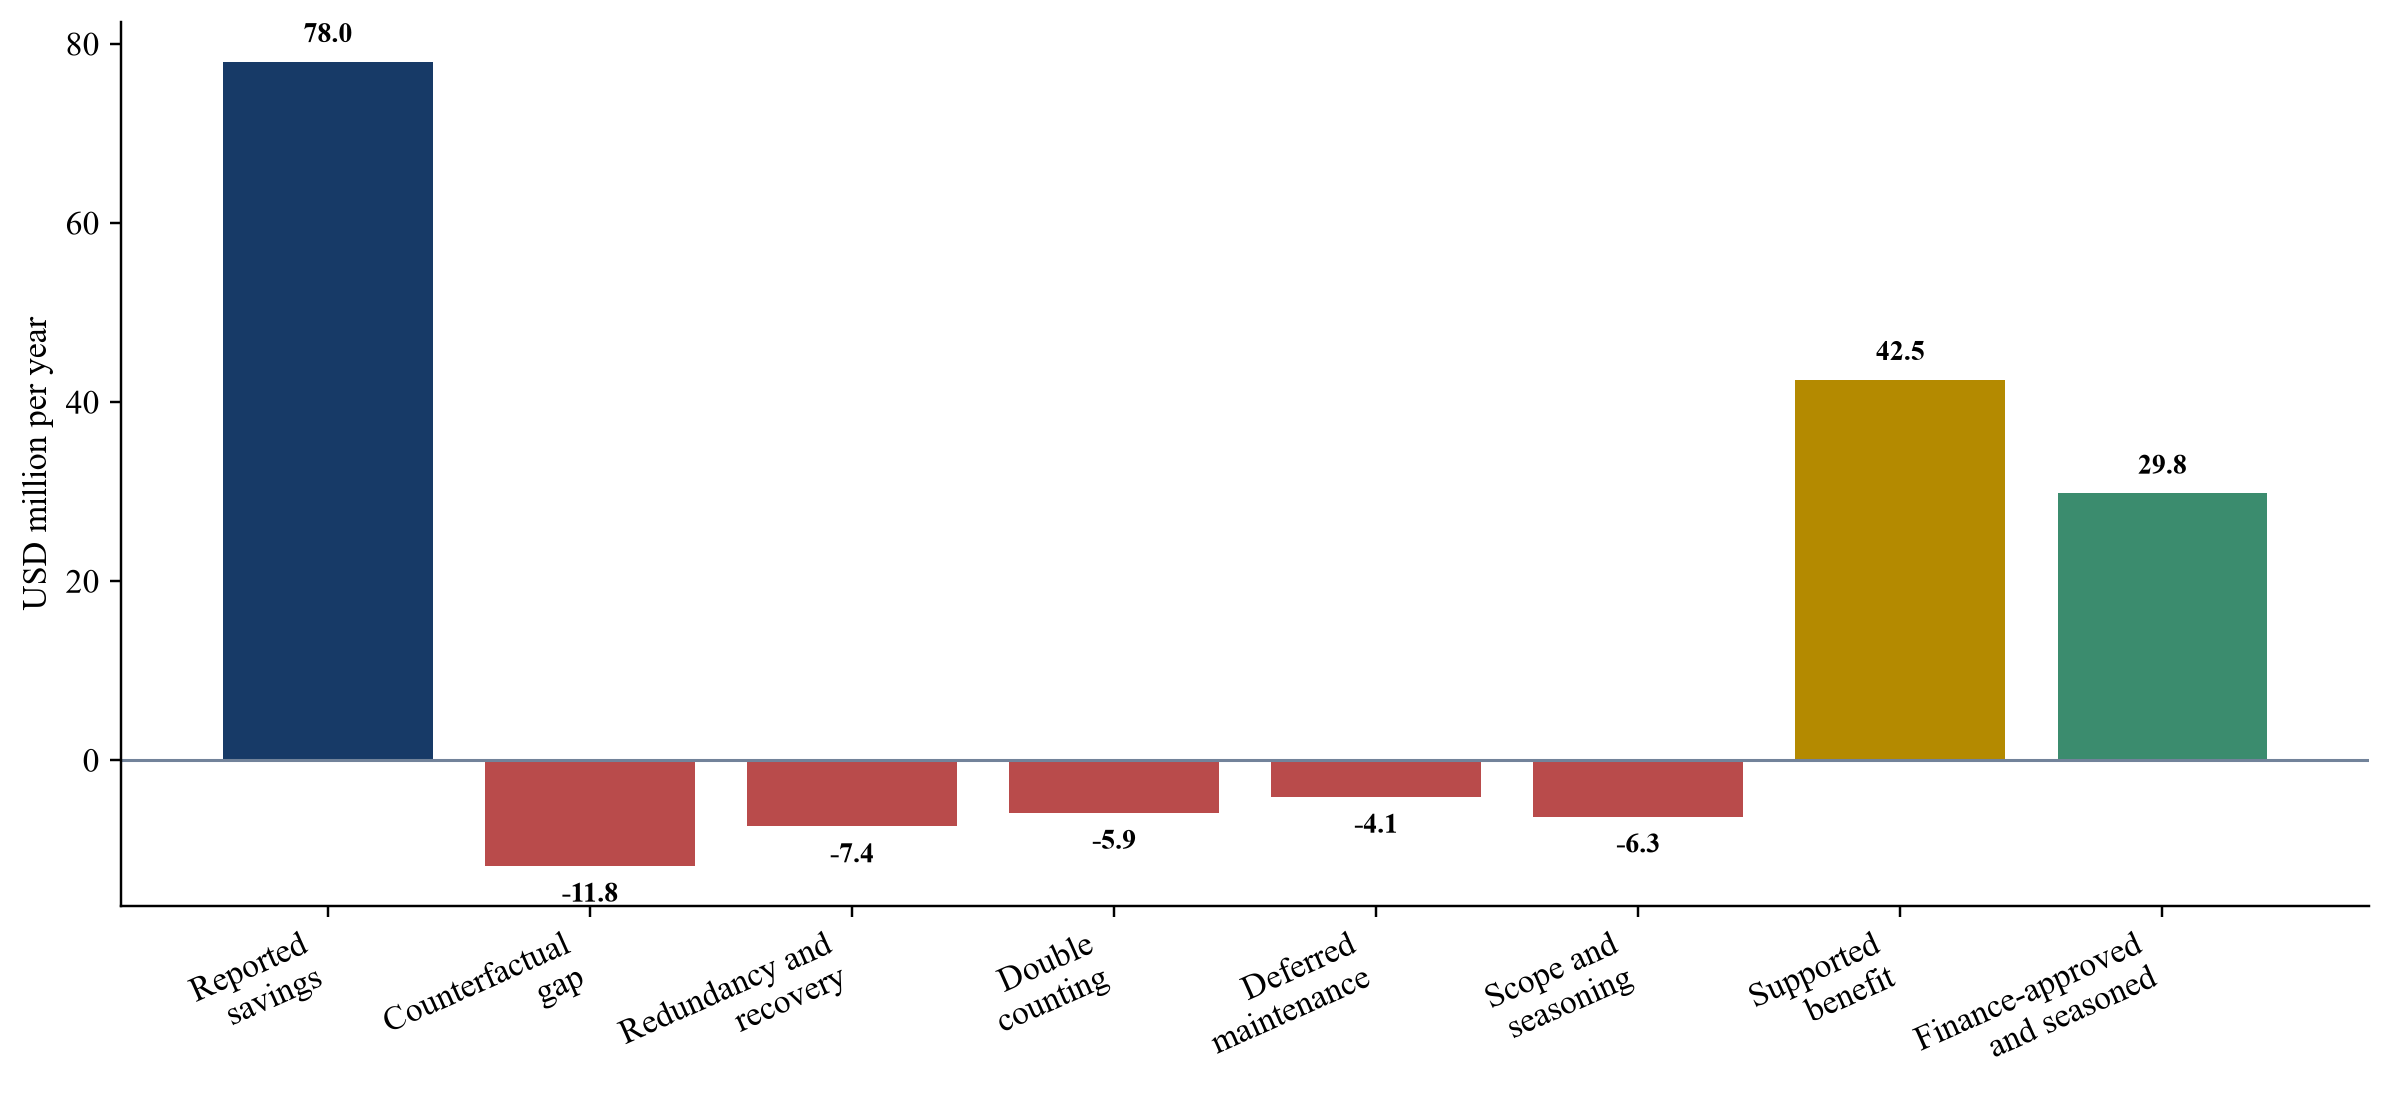
All amounts are management assumptions in USD millions and demonstrate the framework only.
24. Build the illustrative valuation range
The hypothetical income case begins with the USD 20.4 million evidence-adjusted recurring base. Management assumes gross retention of 90 percent, expansion equal to 12 percent of the opening base, new recurring revenue of USD 3.0 million in year one rising to USD 5.0 million by year five, and gross margin improving from 58 percent to 67 percent as deployment and analyst work become more efficient. The model includes sales, product, support and corporate investment required to sustain growth.
The downside case assumes lower retention, slower expansion, weaker gross-margin improvement and higher security and hardware remediation. The upside case assumes that the finance-approved cohort predicts stronger retention and that deployment automation reduces direct cost. A management-assumed discount rate of 15 percent in the central case reflects scale, concentration and execution risk. Terminal assumptions require separate support.
The market cross-check applies a range of enterprise-value-to-recurring-revenue multiples to the evidence-adjusted base and adjusts for net debt, working capital and other transaction items. The multiple is a management assumption rather than a market observation. A buyer should replace it with current comparable-company and transaction evidence at the valuation date.
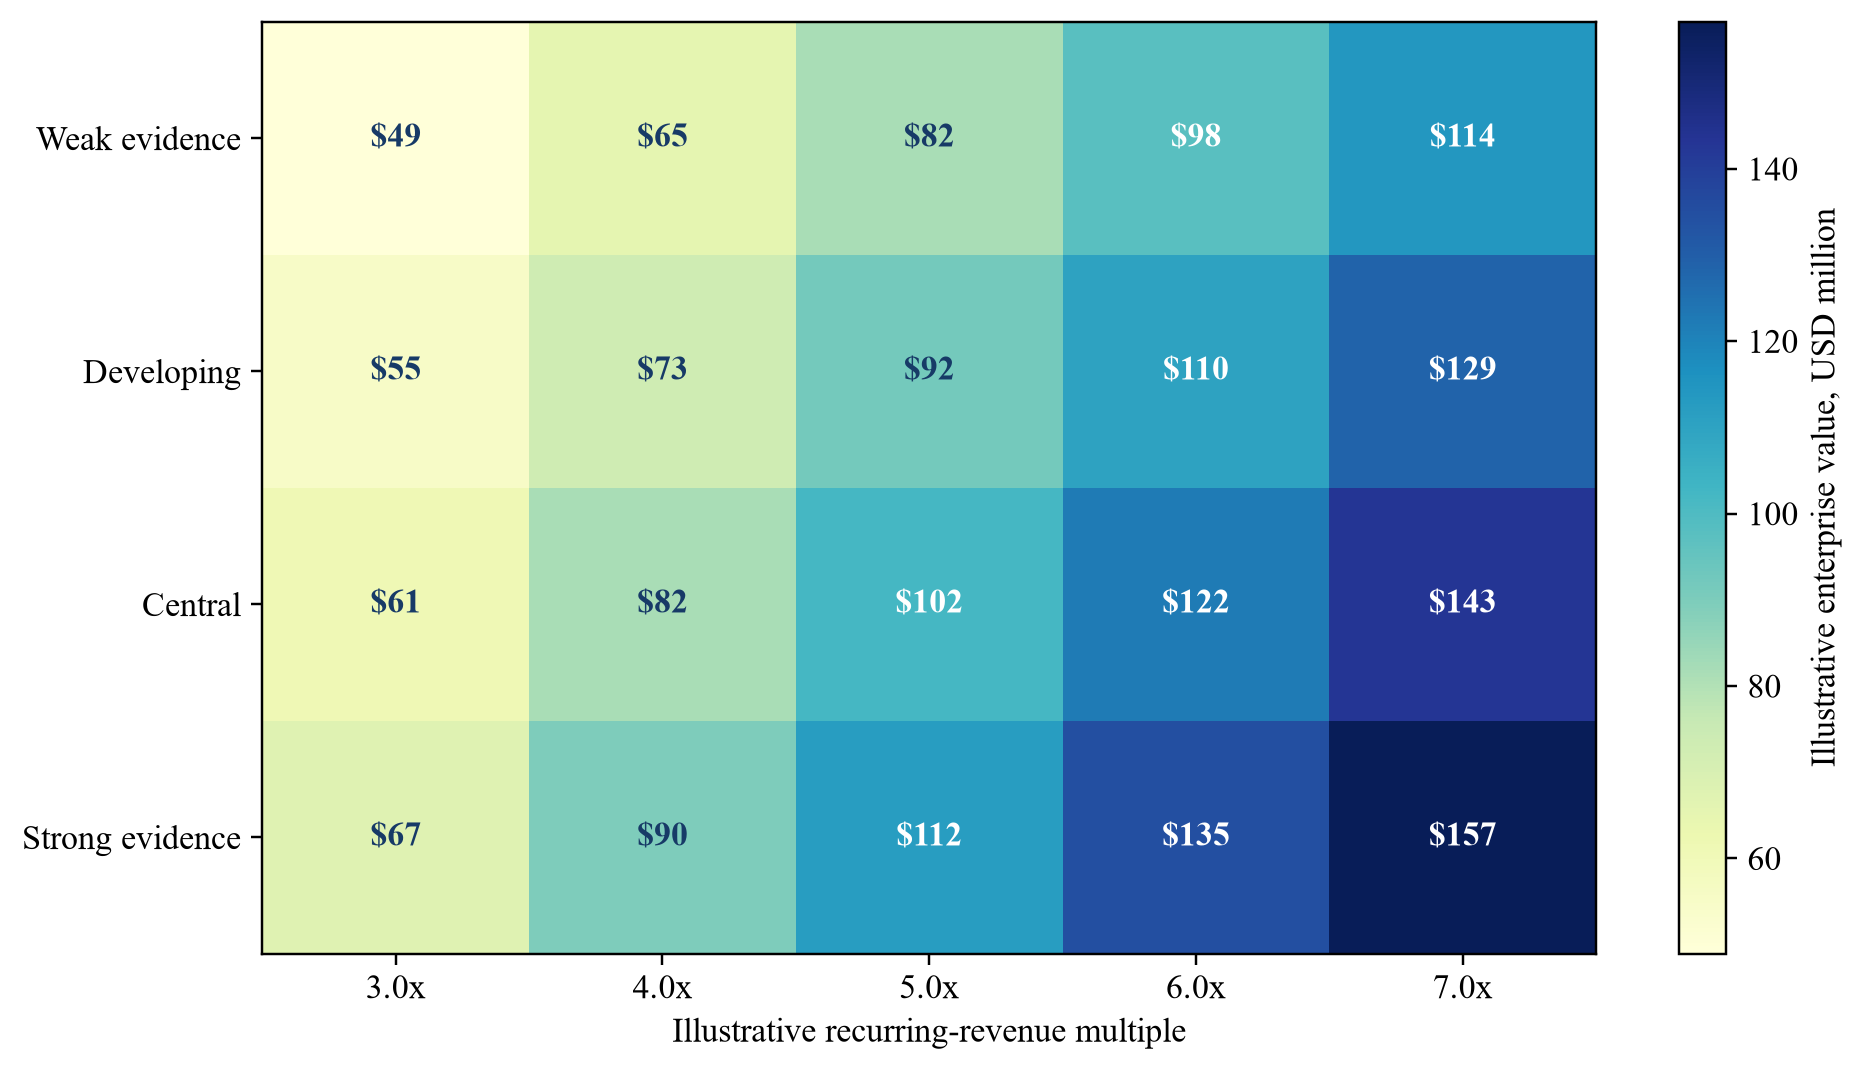
Values are management assumptions in USD millions and exclude net debt and other transaction adjustments.
25. Use purchase-price protection deliberately
Price protection should match the identified risk. A holdback can cover missing customer approvals or sensor remediation. An earn-out can link consideration to recurring-revenue retention, gross margin or finance-approved value. A warranty can address contract, data-rights, intellectual-property and cybersecurity facts. A specific indemnity can cover a known dispute or regulatory issue.
Earn-outs require definitions that survive operational change. Recurring revenue should state included products, currency treatment, acquisitions, discounts, grace periods and cancellations. Verified savings should state event approval, baseline, observation window, customer consent and dispute resolution. Management should not be rewarded for maximising a metric by offering uneconomic discounts or delaying necessary cost.
Closing conditions and covenants can secure customer consents, source-code access, key-person retention, security remediation and data portability. The buyer should avoid using contingent consideration as a substitute for understanding the business. A clear evidence gap can be priced, allocated or treated as a condition; an undefined metric creates further uncertainty.
26. Separate stand-alone value and buyer synergy
Stand-alone value reflects the target under market-participant assumptions and its existing rights, customers, team and operating model. Buyer synergy may come from access to a larger installed base, lower hardware cost, stronger distribution, complementary data, integration with maintenance systems or reduced corporate overhead. These benefits need owners, investment, timing and probability.
Customer data rights can limit cross-selling and model combination. A buyer may own adjacent equipment data without permission to use it for the acquired product. Integration can also disrupt alert continuity or introduce cybersecurity risk. The synergy plan should identify the contractual, technical and operational dependencies before value is included.
The buyer should maintain a separate synergy bridge. It should show gross benefit, revenue cannibalisation, implementation cost, customer migration, dis-synergy and execution risk. This preserves a clear view of the target's stand-alone evidence and prevents the purchase price from absorbing value that only the buyer can create.
27. Build the diligence request list
The request list should begin with source data, not selected case studies. Core items include the asset register, sensor map, model inventory, version history, alert log, acknowledgement log, work-order links, event ledger, customer approvals, contract repository, invoice detail, revenue recognition, deployment cost, support tickets, security architecture, incident history and data-rights schedule.
Sampling should be risk based and reproducible. The buyer should select customers across size, geography, industry, age, renewal outcome, value evidence and support intensity. Event samples should include accepted, rejected, false-positive, late, missed and inconclusive cases. Management should explain exclusions and allow the buyer to trace records to raw evidence.
Interviews should include customer finance and maintenance stakeholders where permission exists. Internal interviews should cover data science, reliability engineering, implementation, customer success, sales, finance, security and legal. Inconsistent definitions across these groups are an important finding because the valuation model depends on a shared evidence chain.
Table 4. One-hundred-day plan for an acquired predictive-maintenance platform
| Period | Operating priority | Evidence deliverable | Commercial decision |
|---|---|---|---|
| Days 0 to 30 | Preserve monitoring, credentials, alert routing and critical staff | Reconciled customer, site, asset, contract and model registers | Freeze unsupported pricing and metric changes |
| Days 31 to 60 | Standardise event and savings definitions across functions | Versioned alert-to-action ledger and cohort baselines | Prioritise renewals with unresolved proof of value |
| Days 61 to 100 | Validate high-value models and deployment economics | Customer-level value, margin, retention and remediation pack | Approve expansion, integration and outcome-pricing pilots |
| Quarter 2 onward | Automate evidence capture and close the finance loop | Auditable product and customer dashboards | Reprice cohorts and release buyer synergies against evidence |
The sequence protects customer continuity while improving evidence and economics.
28. Execute the first one hundred days
The first priority is continuity. The buyer should preserve sensor connectivity, model execution, analyst coverage, customer escalation and maintenance workflows. Changes to thresholds, identities, integrations or cloud architecture can break evidence and customer trust. Critical people and vendor dependencies should be identified before closing.
The second priority is definition control. Finance, product, engineering and customer success should agree the monitored population, alert states, event outcomes, recurring-revenue definition, savings categories and approval rules. The buyer can then rebuild cohort reporting from source records and quantify the cost of weak deployments.
The third priority is selective improvement. High-value models and strategic customers should receive focused validation and workflow support. Low-value assets, unsupported devices and bespoke features should be reviewed for remediation, repricing or retirement. Buyer synergies should be released only after rights, customer consent, architecture and economics are confirmed.
29. Recognise limitations and research priorities
Verified savings remain partly counterfactual. Even a well-governed ledger cannot observe the exact path that would have occurred without intervention. Engineering evidence, comparable history and independent approval can improve reliability while uncertainty remains. The valuation should reflect that uncertainty through scenarios and local adjustments.
Rare catastrophic failures create a measurement problem. The absence of events can indicate effective prevention, low underlying risk or insufficient observation. Research is needed on calibrated expected-loss models that combine physical degradation, operational context and human intervention without rewarding unsupported claims. Cross-industry benchmarks also require consistent taxonomy and disclosure.
Further work should examine whether finance-approved value predicts retention and expansion better than model accuracy, alert volume or user activity. It should also test the cost and reliability effects of generative interfaces, foundation models and cross-customer learning. These questions can be studied only with governed, comparable customer evidence.
30. Conclusion
Predictive maintenance creates transaction value when the target can demonstrate a repeatable path from monitored equipment to a validated condition, an actionable maintenance decision, an avoided operational consequence and finance-approved customer value. The buyer should evaluate that path by customer cohort and connect it to retention, expansion, gross margin and cash flow.
Reported savings, model performance and annual recurring revenue answer different questions. The verified-savings ledger connects them while preserving rejections, uncertainty and cost. It gives management a practical operating system for pricing, renewal and product improvement and gives the buyer a defensible basis for valuation and purchase-price protection.
The diligence standard is therefore evidence conversion. The target earns valuation support where it can show controlled equipment identity, valid data, versioned models, timely alerts, adopted workflows, credible counterfactuals, customer approval and durable unit economics. Gaps should be remediated, priced or allocated explicitly.
References
- MultiSensor AI Holdings, Inc. (2025). Annual Report for the year ended 31 December 2024. US Securities and Exchange Commission. https://www.sec.gov/Archives/edgar/data/1863990/000155837025004015/msai-20241231x10k.htm
- International Organization for Standardization (2016). ISO 14224:2016 Petroleum, petrochemical and natural gas industries; collection and exchange of reliability and maintenance data for equipment. https://www.iso.org/standard/64076.html
- International Organization for Standardization (2007). ISO 13374-2:2007 Condition monitoring and diagnostics of machines; data processing, communication and presentation; Part 2: Data processing. https://www.iso.org/obp/ui#iso:std:iso:13374:-2:ed-1:v2:en
- Vogl, G.W., Weiss, B.A. and Helu, M.M. (2016). A review of diagnostic and prognostic capabilities and best practices for manufacturing. National Institute of Standards and Technology. https://www.nist.gov/publications/review-diagnostic-and-prognostic-capabilities-and-best-practices-manufacturing
- Ramasso, E. and Saxena, A. (2014). Review and Analysis of Algorithmic Approaches Developed for Prognostics on CMAPSS Dataset. NASA Technical Reports Server. https://ntrs.nasa.gov/citations/20150007677
- US Department of Energy, Federal Energy Management Program (2010). Operations and Maintenance Best Practices Guide Release 3.0. https://www1.eere.energy.gov/femp/pdfs/om_6.pdf
- Informatica Inc. (2025). Annual Report for the year ended 31 December 2024. US Securities and Exchange Commission. https://www.sec.gov/Archives/edgar/data/1868778/000186877825000007/infa-20241231.htm
- IFRS Foundation (2026). IFRS 15 Revenue from Contracts with Customers. https://www.ifrs.org/issued-standards/list-of-standards/ifrs-15-revenue-from-contracts-with-customers/
- National Institute of Standards and Technology (2023). Guide to Operational Technology Security, NIST SP 800-82 Revision 3. https://csrc.nist.gov/pubs/sp/800/82/r3/final
- European Commission (2026). Guidelines for providers and deployers of AI high-risk systems. https://digital-strategy.ec.europa.eu/en/policies/guidelines-ai-high-risk-systems
- IFRS Foundation (2026). IFRS 13 Fair Value Measurement. https://www.ifrs.org/issued-standards/list-of-standards/ifrs-13-fair-value-measurement/
- National Institute of Standards and Technology (2020). Asset Condition Management: A Framework for Smart, Health-Ready Manufacturing Systems. https://www.nist.gov/publications/asset-condition-management-framework-smart-health-ready-manufacturing-systems
- National Institute of Standards and Technology (2016). Measurement Science Roadmap for Prognostics and Health Management for Smart Manufacturing Systems. https://www.nist.gov/publications/measurement-science-roadmap-prognostics-and-health-management-smart-manufacturing
- National Institute of Standards and Technology (2023). Summary Report on the Industry Forum for Monitoring, Diagnostics, and Prognostics for Manufacturing Operations. https://nvlpubs.nist.gov/nistpubs/ams/NIST.AMS.100-23.pdf
- National Institute of Standards and Technology (2025). The Rise of Artificial Intelligence in US Manufacturing. https://www.nist.gov/mep/rise-artificial-intelligence-ai-us-manufacturing-text-only
- National Institute of Standards and Technology (2021). Artificial Intelligence in Manufacturing: Real World Success Stories and Lessons Learned. https://www.nist.gov/blogs/manufacturing-innovation-blog/artificial-intelligence-manufacturing-real-world-success-stories
- International Organization for Standardization (2014). ISO 55000:2014 Asset management; overview, principles and terminology. https://www.iso.org/standard/55088.html
- International Organization for Standardization (2019). ISO 17359:2018 Condition monitoring and diagnostics of machines; general guidelines. https://www.iso.org/standard/71194.html
- International Organization for Standardization (2015). ISO 9001:2015 Quality management systems; requirements. https://www.iso.org/standard/62085.html
- International Organization for Standardization (2022). ISO/IEC 27001:2022 Information security management systems; requirements. https://www.iso.org/standard/27001
- National Institute of Standards and Technology (2023). Artificial Intelligence Risk Management Framework 1.0. https://www.nist.gov/itl/ai-risk-management-framework
- Cybersecurity and Infrastructure Security Agency (2025). Foundations for Operational Technology Cybersecurity: Asset Inventory Guidance. https://www.cisa.gov/resources-tools/resources/foundations-ot-cybersecurity-asset-inventory-guidance
- IFRS Foundation (2026). IAS 38 Intangible Assets. https://www.ifrs.org/issued-standards/list-of-standards/ias-38-intangible-assets/
- IFRS Foundation (2026). IFRS 3 Business Combinations. https://www.ifrs.org/issued-standards/list-of-standards/ifrs-3-business-combinations/
- National Institute of Standards and Technology (2026). Prognostics and Health Management for Reliable Operations in Smart Manufacturing. https://www.nist.gov/programs-projects/prognostics-and-health-management-reliable-operations-smart-manufacturing-phm4sm
About the Author
Chennakeshav (CK) is a corporate finance and investment banking executive with 25+ years of global experience in deal origination, structuring and execution across M&A, growth capital and corporate strategy. He has led value-creation mandates for founders, corporates and funds — bridging the boardroom view to hands-on execution and close.
His career spans Morgan Stanley, HSBC, Lloyds Banking Group, EWEC, ADQ portfolio companies and Emirates Growth Fund, across TMT, real estate, fintech, deeptech, cleantech, infrastructure and energy. He has partnered with C-suite leaders, private equity and venture funds, sovereign wealth funds and family offices to finance complex fund raises and scale-up ventures, and has led M&A due diligence, post-merger integration and business-transformation initiatives to create value.
At Matchpoint Partners he is Managing Partner, leading the firm's corporate finance, M&A and capital-raising practice. He holds an MBA from London Business School, an engineering degree from VTU and a Master of Laws (LLM, in progress) from UCL London.
An active start-up mentor, CK mentors at Techstars, DIFC FinTech Hive, Startup Grind, Founder Institute and IN5, serves as Entrepreneur Mentor in Residence (EMiR) at London Business School, and judges the Entrepreneurship World Cup.
https://www.linkedin.com/in/ckadya/
https://www.matchpoint-partners.com/team/ck-adya.html
This paper is part of a continuing series on the structure of private and alternative markets. The views expressed are the author's own. The paper is for information only, describes market structure in general terms, and does not constitute investment, legal, tax or regulatory advice or a recommendation in respect of any security, vehicle or counterparty.
